trade war and u.s. exports - felipe benguria
TRANSCRIPT

Dissecting the Impact of the 2018-2019 Trade War
on U.S. Exports
Felipe Benguria * Felipe Saffie †
December 10, 2019
Abstract
During the 2018-2019 trade war, U.S. exports have been affected by foreign retaliatory tariffs, U.S.
import tariffs that act through input-output linkages, and policy uncertainty. We establish, first, that
the large negative impact of foreign tariffs on U.S. exports is highly heterogeneous across destinations
and industries, being much larger among exports to China, particularly of industrial supplies, and is
explained by the degree of product differentiation and the extent to which trade occurs within related
parties. Second, supply chains matter, as U.S. import tariffs lead to lower exports by industries using
targeted imports as inputs. Third, beyond the direct impact of tariffs, uncertainty appears to play an
important role, as suggested by a collapse in exports of durable goods relative to nondurables, and in
sectors facing a larger risk of tariff increases. The severity of the trade war’s impact on U.S. exports is
amplified by a limited ability to redirect exports across markets: increased exports to the rest of the
world only partially offset the decline in sales to China. Finally, we establish that the impact of tariffs
on U.S. export volumes and prices is essentially different than that of exchange rates.
Keywords: Trade war, Trade policy, Tariffs, U.S. Exports
JEL classification: F1
*Department of Economics, University of Kentucky ([email protected]).†Department of Economics, University of Maryland ([email protected]).
1

1 Introduction
During 2018 and 2019, the U.S. has been engaged in an unprecedented trade war involving broad rounds
of tariffs imposed on its trading partners, especially China, and equally broad retaliatory tariffs on U.S.
exports. An event of this magnitude is unseen in the post-war era, and constitutes a major departure
from a decades-long trajectory towards free trade. Clear evidence on the consequences of this ongoing
trade war is much needed and should help tilt the balance towards either a correction or an intensi-
fication of the course of recent trade policy. At the same time, this ongoing trade war constitutes an
exceptional testing ground for the effects of trade policy. Surprisingly, there are few estimates of the
response of trade outcomes to changes in trade policies [Goldberg and Pavcnik, 2016] and much of the
recent evidence is based on developing countries’ unilateral trade liberalization episodes. The ongo-
ing trade war has provided a unique opportunity to examine the effects of trade policy in a developed
country setting with large tariffs imposed among the world’s major economies.
This paper studies the impact of the ongoing trade war on U.S. exports. We start by documenting
the impact of retaliatory tariffs on U.S. export volumes and prices. Beyond the average response doc-
umented in recent work [Amiti et al., 2019, Fajgelbaum et al., 2019], we show there is enormous and
systematic heterogeneity in the impact of tariffs on volumes and prices across both destinations and
industries, and explore its determinants. We then investigate two additonal mechanisms through which
the trade war has affected U.S. exports. First, we establish that supply chains matter, as U.S. import
tariffs hinder the ability of U.S. exporters to access imported inputs, thus affecting U.S. exports. Sec-
ond, there appears to be a role played by uncertainty, as after controlling for tariffs, exports of durables
to China fall as trade policy uncertainty indices spike. Further evidence of the uncertainty channel is
that exports decline more in sectors in which the potential tariffs China would impose in a full-blown
trade war are highest relative to observed tariffs. After documenting these mechanisms, we show there
has been a limited (and heterogeneous) ability of U.S. exports facing retaliatory tariffs to be redirected
to other destinations. Finally, we compare tariff passthrough to exchange rate passthrough, finding a
fundamentally different response of export values and prices to these two types of shocks .
Analyzing first U.S. exports to all markets, we establish that foreign tariffs have had a negative
impact on values and quantities, and virtually no impact on tariff-exclusive export prices. This starting
point is consistent with the findings in Fajgelbaum et al. [2019] and Amiti et al. [2019] and is our point
of departure from the literature. Because China has imposed by far the largest and broader retaliatory
tariffs on U.S. exports, we go on to show that when focusing exclusively on U.S. exports to China, the
negative impact of Chinese tariffs on U.S. exports is three times larger than that in the full world sample,
which is a first novel finding. This gap is not accounted for by differences in the product composition
2

of exports across destinations.
The elasticities of export volumes and prices to tariffs differ markedly not only across destinations,
but also across sectors. The negative impact of tariffs on trade flows is considerably larger among in-
dustrial supplies than among consumer goods, capital goods, or food and agricultural products.1 Only
in the case of capital goods, tarifffs lead to an economically and statistically significant fall in tariff-
exclusive export prices. Two product characteristics explain differences in the impact of tariffs across
goods: the degree of product differentiation and the extent to which trade occurs within related parties.
Among more differentiated products (i.e. products with lower elasticity of substitution), the negative
impact of tariffs on export values is significantly milder. This finding is consistent with the canonical
theory of trade policy, given that undifferentiated goods are easy to substitute in response to tariffs.
A second key determinant is the degree of related-party trade. Because there is no up-to-date data on
trade flows split by arms-length vs. related-party trade flows, we characterize each product-destination
pair by the share of related-party trade in 2016. We find that the negative impact of tariffs on U.S. ex-
ports is substantially milder for products more likely to be traded among related parties. Interestingly,
while the degree of product differentiation shapes the response of trade to tariffs both in the case of
exports to China or to the rest of the world, the extent of related-party trade is only relevant for U.S.
exports to China, signalling a particular behavior of multinationals in that destination.
Next, we examine the role of supply chains. A literature based on developing countries’ unilateral
trade liberalization episodes [Amiti and Konings, 2007, Goldberg et al., 2010] has established that lower
tariffs on imported inputs can lead to increases in productivity and product scope. The U.S. has imposed
large tariffs on imports from China, from which the U.S. sources many intermediate inputs. These U.S.
import tariffs could have an impact on U.S. exports by limiting the access of U.S. firms to imported
inputs. To study this channel, we construct input tariffs for each product exported using tariff schedules
for U.S. import tariffs combined with an input-output table for the U.S. economy. We find an important
negative impact of input tariffs on U.S. exports; each additional percentage point in U.S. input tariffs
reduces U.S. exports by half as much as what foreign tariffs do. This effect is particularly large among
exports of consumer goods.
Beyond the direct impact of tariffs, uncertainty appears to play an important role. Trade policy
uncertainty indices have spiked during the trade war, and prior research on trade and uncertainty has
found indeed a large response of trade flows to uncertainty [Novy and Taylor, 2019, Handley and Limao,
2017, Pierce and Schott, 2016].2 The model and evidence by Novy and Taylor [2019] shows that trade in
1We find that, considering exports to China, a 10 percentage point increase in tariffs leads to a 38% fall in exports in thecase of industrial supplies, a 16% decline among food and agricultural goods, a 13.7% decline for consumer goods, and finallya 7.6% fall in exports for capital goods.
2The U.S. trade policy uncertainty index of Baker et al. [2016] have increased from an average of 65 in 2015 and 2016 to
3

durable goods is more sensitive to uncertainty, as buyers follow a wait and see approach. Consistent with
this idea, we find that, after controlling for tariffs, exports of consumer durable goods have plummeted
relative to nondurable consumer goods as trade policy uncertainty spikes, but - as expected - only in
exports to China, which is the main party in the ongoing trade war along with the U.S. We further show
it is only trade policy uncertainty, not more general policy uncertainty or overall economic uncertainty
that affects U.S. exports.
We then take a second approach that provides further evidence on the uncertainty channel. We
propose a novel measure of trade policy uncertainty. This is based on the insight that, once the trade
war becomes a credible threat, uncertainty faced by U.S. exporters is proportional to the gap between
actual tariffs and those tariffs that China or other trading partners would impose on the U.S. in a full-
blown trade war.3 We indeed find that after the first announcements of broad tariffs rounds between
the U.S. and China, and after controlling for observed tariffs, exports decline by more in sectors facing
the largest gaps between observed and potential tariffs.
Given that there has been a large drop in U.S. exports to China, an important question is whether U.S.
firms have been able to reroute exports to China affected by tariffs to other destinations. The answer is
only to some extent. To measure this, we estimate a regression of U.S. exports to the rest of the world (i.e.
non-China destinations) as a function of tariffs in destination markets and Chinese tariffs. Controlling
for tariffs in the destination market, there has been an increase in exports to the rest of the world in
products targeted by Chinese tariffs. This increase, however, offsets only half of reduced exports to
China. We also find that Chinese tariffs have not led to changes in the prices of U.S. exports to the rest
of the world. This average effect, however, masks some heterogeneity across sectors. The increase in
exports to the rest of the world as a consequence of Chinese tariffs appears to be driven primarily by
food and agricultural products and by industrial supplies. In the case of the former, there has been an
important decline in the prices set in alternative markets. There are several reasons that could explain
the incomplete rerouting of exports to other markets, including the difficulty of establishing new trade
relationships, or uncertainty about the duration of the trade war that precludes U.S. exporters from
investing in entry into other markets. The inability of U.S. exporters to fully redirect exports to other
markets leaves three options: larger sales in the domestic market, lower production, or an accumulation
of inventories.
To conclude, we show that the effect of tariffs on U.S. export prices is fundamentally different to
that of exchange rates. While tariffs have virtually no impact on (tariff-exclusive) prices, a U.S. dollar
204 in 2017-2018.3These hypothetical tariffs are obtained from Ossa [2014]’s simulation of a trade war based on a quantitative model with
ricardian and intra-industry trade.
4

appreciation, in contrast, lowers prices significantly. While exchange rate passthrough is a key param-
eter in international finance and there is a vast literature (surveyed by Burstein and Gopinath [2014])
documenting it, there is much fewer evidence documenting tariff passthrough [Goldberg and Pavcnik,
2016] or comparing both in a common context. Further work, perhaps analyzing individual exporting
firms, could help shed light on this difference.
Summing up, the 2018-2019 trade war has had a negative impact on U.S. exports through three
channels: foreign retaliatory tariffs, U.S. import tariffs, and uncertainty. A core theme that emerges
from our results is that the elasticities of export values, quantities and prices to tariffs are not con-
stant parameters. Rather, these elasticities vary considerably across industries, across destinations and
over time. These elasticities are essential parameters in trade models and a key input to policymakers
both in the current trade war or in other contexts. The ongoing trade war evidently provides a unique
opportunity to document these elasticities based on a simple reduced-form framework.
1.1 Related Literature
This paper is among the first to evaluate the consequences of the U.S.-China trade war and complements
recent work that has already began to examine its consequences. Fajgelbaum et al. [2019] and Amiti
et al. [2019] quantify the effect of the trade war on the U.S. economy, and using different methods, reach
a fairly similar aggregate welfare loss equal of about 0.04% of GDP in 2018. These two papers also
document the average impact of foreign retaliatory tariffs on U.S. exports to the world. The contribution
of this paper is studying in detail the impact of the trade war on U.S. exports, including the substantial
and systematic heterogeneity across industries and destinations in the elasticity of trade volumes and
prices to tariffs, inspecting other channels - U.S. import tariffs and uncertainty - through which the trade
war impacts U.S. exports, and documenting the inability of U.S. exports targeted by Chinese tariffs to
be redirected to other markets.
Additional evidence on the consequences of recent U.S. trade policies includes Flaaen et al. [2019]
who study import tariffs on washing machines imposed on various U.S. trading partners between 2012
and 2018. Flaaen et al. [2019] find a large impact of the 2018 tariffs on consumer prices and showing
that production relocation can in some cases dampen this passthrough. Cavallo et al. [2019] study
tariff passthrough on to prices using data on both border prices and retail prices, and establish a full
passthrough of tariffs on to border prices but an incomplete passthrough to retail prices, indicating a
reduction in retailers’ margins. There is also some early evidence on the response of firms to the current
trade war. Huang et al. [2018] study the response of both U.S. and Chinese firms’ stock market prices to
the March 2018 announcement of the results of the investigation that led to the first round of U.S. tariffs
5
on China. They find that Chinese firms that export to the U.S. have lower stock market returns around
the announcement date. Finally, Benguria [2019b] documents a negative impact of the trade war on
Chinese firms that rely on exports to the U.S., and Benguria [2019a] studies the transmission channels
of the U.S.-China trade war to firms in 40 countries throughout the world.
This paper also complements a literature (recently surveyed by Goldberg and Pavcnik [2016]) study-
ing the impact of tariffs on trade flows and other outcomes such as productivity or wages. A first set
of papers examines the response of aggregate bilateral trade flows to free trade agreements or WTO
membership [Rose, 2004, Baier and Bergstrand, 2001]. A second set, closer to this paper in terms of
methodology, uses more disaggregate data taking advantage of cross-industry variation in tariffs. Much
of that evidence is restricted to developing countries’ unilateral trade liberalization episodes (Amiti
and Konings, 2007, Dix-Carneiro and Kovak, 2017, Goldberg et al., 2010, Topalova and Khandelwal,
2011, Estevadeordal and Taylor, 2013 among many others). The reason is simply a lack of episodes
of meaningful tariff changes among developed countries in recent decades. From the perspective of
quantitative trade models, Ossa [2014] quantifies the welfare cost of a global trade war in a model with
ricardian and intra-industry trade motives and political economy, while Caliendo et al. [2015] quantify
the welfare effects of trade liberalization over the period 1990-2010.
Finally, this paper contributes to the literature that examines the consequences of trade policy uncer-
tainty. Recently this literature has examined the impact of the reduction in trade policy uncertainty for
Chinese exporters to the U.S. implied by China’s accession to the World Trade Organization [Handley
and Limao, 2017, Pierce and Schott, 2016]. In the context of the current trade war, Caldara et al. [2019]
construct firm-level measures of trade policy uncertainty to show that it is correlated with a decline
in investment. Novy and Taylor [2019] show that broader economic uncertainty disproportionately
impacts international trade.
2 The 2018-2019 Trade War
In this section we briefly summarize recent trade policies imposed by the U.S. and retaliatory trade
policies imposed on U.S. exports by some of its main trading partners. We summarize the events up to
and including April 2019, which is when the data used in the paper ends. For further details, see Bown
and Kolb [2019] who provide an excellent and detailed timeline to the 2018-2019 trade war.
The first trade barriers imposed by the U.S. under the current administration were global safeguard
tariffs on imports of washing machines (covering approximately $1.8 billion in imports) and solar panels
(covering $8.5 billion) in October and November 2017, under the argument of a material injury to these
6

industries.4,5 This led to WTO disputes being filed by South Korea and China. The U.S. later imposed
tariffs on imports of steel (at a 25% rate) and aluminum (at a 10% rate) in March 2018 based on a
national security threat argument under Section 232 of the Trade Expansion Act of 1962. While these
tariffs were to be applied to all trading partners according to the initial announcement, several were
temporarily exempt, including Canada, Mexico and the European Union. China retaliated immediately
targeting about $2.4 billion in U.S. exports. After the exemption on Canada, Mexico and the European
Union ended in June 2018, these countries imposed retaliatory tariffs covering $17.8, $4.5 and $8.2
billion of U.S. exports respectively.
Starting in mid 2018, new trade barriers imposed by the U.S. focus exclusively on China. Following
an investigation on China’s treatment of U.S. intellectual property rights and based on Section 301 of
the Trade Act of 1974, the U.S. imposes a first round of tariffs covering $50 billion. This tariff round is
announced in April 2018. It is imposed in two waves, in July ($34 billion) and August ($16 billion) 2018.
China immediately retaliates with tariffs targeting an equivalent amount in U.S. goods. The July wave
of Chinese tariffs apply to 545 HS 8-digit products and the August wave applies to an additional 333
products, both with a 25% rate. This $50 billion round targets mostly food and agricultural products
(40% in terms of value), followed by industrial supplies (31%) and consumer goods (24%).
In September 2018 the U.S. applies a broader set of tariffs applying a 10% rate to 6056 HS 8-digit
products covering $200 billion in imports from China. The announcement includes a further increase of
the rate to 25% to be implemented in January 2019 and later postponed until May 2019. China retaliates
with a $52 billion round applying 5% and 10% rates on 5207 HS 8-digit level products.6 These Chinese
tariffs target primarily industrial supplies (46% in terms of value) and capital goods (42%).
In total, by April 2019, U.S. tariffs on Chinese products cover a list representing $250 billion (in
terms of their 2017 value), which is about half the imports from China in 2017. Chinese tariffs apply
to a list of products representing about 71% of U.S. exports to China in 2017 ($92 billion out of $129
billion exported in 2017).
3 Data Sources and Context
To assess the impact of the trade war on U.S. exports, we assemble a monthly panel of U.S. exports
by product and destination spanning the period from January 2015 to April 2019. We combine these
data with MFN tariffs faced by U.S. exports in each destination and additional retaliatory tariff increases
4These safeguard tariffs were imposed under Section 201 of the Trade Act of 1974.5Recall that the convention being used throughout the paper when stating the amount of trade covered by tariffs is calcu-
lating this amount based on U.S. exports or imports in 2017.6This Chinese tariff round was initially labeled as a $60 billion round given the approximate amount of trade targeted.
7
during the ongoing trade war by China, Canada, Mexico, the European Union, Turkey, Russia and India.
We also use data on U.S. MFN and trade war tariffs and the input-output table for the U.S. economy.
Finally we characterize products based on their type according to end use categories, to the share of
related-party trade and to their elasticity of substitution. We describe each of these datasets below.
3.1 Monthly U.S. Exports
U.S. exports detailed by product and destination at a monthly frequency are available from the U.S.
Census Bureau “U.S. Exports of Merchandise” publication. In this publication, products are detailed
at the 10-digit level of the U.S. version of the harmonized system (HS).7 The data has about 230 des-
tinations, which we match to ISO codes. Export values and quantities are aggregated to the level of
product-destination-month cells for the analysis. Values are reported in current U.S. dollars, which we
transform to constant dollars using the U.S. consumer price index. Quantities are reported in various
units that vary across products (these differences in units will be absorbed by fixed effects). We compute
unit values (“prices”) as the ratio of export values and quantities. We restrict the analysis to domestic
exports. These exclude exports manufactured in other countries and temporarily stored without fur-
ther processing in the U.S. to be re-exported. Robustness results show that the impact of the trade war
reported for this baseline sample is similar when considering total exports.
3.2 Tariffs Imposed by U.S. Trading Partners
The tariffs faced by U.S. exports in each destination are computed as the sum of MFN tariffs and the ad-
ditional retaliatory tariff rates imposed by China, the European Union, Canada, Mexico, Turkey, Russia
and India. The procedure to construct the tariff data is analogous to that described by Fajgelbaum et al.
[2019].
Tariff increases in 2018-2019 In 2018 and 2019, the U.S. has faced large retaliatory tariff increases
imposed by some of its main trading partners. We assemble detailed tariff schedules on all retaliatory
tariffs imposed on the U.S. during this period. These data are collected from two alternative sources:
official documents published by government agencies and the Li [2018] dataset of trade war tariffs,
and verified against each other.8 The largest tariff increases, which are to be added to MFN tariffs,
7 At this level of disaggregation products are very specific. The following is a useful example: HS 4-digit code 6109 is“T-shirts, singlets, tank tops and similar garments, knitted or crocheted”. HS 6-digit code 6109.10 restricts this product to“Of cotton:”. HS 10-digit code 6109.10.0004 restricts it further to “Men’s or boys’: T-shirts, all white, short hemmed sleeves,hemmed bottom, crew or round neckline, or V-neck, with a mitered seam at the center of the V, without pockets, trim orembroidery”.
8Official tariff announcements on retaliatory tariffs are obtained from China’s Ministry of Finance, Canada’s Departmentof Finance, the European Comission, Mexico’s “Diario Oficial”, the Russia’s Government resolution No. 788 of July 6, 2018
8

are those imposed by China. A first round covering $2.4 billion of U.S. exports (expressed in terms of
2017 export value) was imposed in retaliation to U.S. tariffs on steel and aluminum in April 2018. A
second round covering $50 billion was imposed in two waves in July and August 2018 in retaliation
to the U.S. tariff round on an equivalent amount of U.S. imports from China. In September that year,
China retaliated with tariffs covering $52 billion in U.S. exports in response to the U.S.’ $200 billion
round. In January 2019 Chinese retaliatory tariffs on specific cars and car parts were removed. The
European Union, Canada, Mexico, Russia, Turkey and India all imposed retaliatory tariffs following
U.S. tariffs on steel and aluminum. All these were imposed in June and July 2018 and applied to a set
of products representing a similar amount to these countries’ exports of steel and aluminum to the U.S.
Overall, Chinese tariffs are much more relevant than those imposed in other destinations of U.S. exports
in terms of the number of products and the value of trade targeted.
Most U.S. trading partners imposing retaliatory tariffs (including China, the European Union, Canada,
and Mexico) report these at the 8-digit level of their national versions of the Harmonized System (HS).9
HS codes are identical for all countries up to the 6-digit level of disaggregation. Following Fajgelbaum
et al. [2019] we work with tariffs at the 6-digit level to make them comparable across destinations. It
is also worth noting that most of these tariffs have a single ad-valorem rate, and the variation across
products depends on whether they are targeted or not, rather than on the rate.10
Both U.S. and consequently retaliatory tariffs were fairly unanticipated. The departure from the
long-standing prior U.S. trade policy by the current adminsitration following the 2016 election was
surprising given that election polls did not assign a high probability to the final result. Once the trade
war started, retaliatory tariffs were announced at most a few weeks before being imposed, and the list
of products targeted could not have been anticipated. We thus follow the literature in treating tariffs
as exogenous. It is also worth noting that to some extent, U.S. exporters might assess these tariffs as
temporary. Throughout 2018 and 2019 there have been attempts to reach an agreement between the
U.S. and China, suggesting an end to the trade war. To date, however, these negotiations have failed.
Beliefs about the duration of these policies probably get updated on an ongoing basis.
In 2017, the U.S. exported $129 billion to China. As Figure 1 shows, the average tariff faced by
the U.S. in China was essentially constant up to 2017, at about 6%. In July 2018 it increases to 12%
as a result of the first part of China’s $50 billion round, and in October it reaches 19% following the
remainder of the $50 billion round and the $52 billion round. It falls to 17% after January 2019 due
to a reversal of retaliatory tariffs on cars and car parts. This average tariff varies significantly across
and the World Trade Organization. Note that the Li [2018] database does not include Russian tariffs.9India’s tariffs are reported at the HS 6-digit level and Russian tariffs at the HS 10-digit level.
10An exception is China’s $52 billion round which assigns a 10% rate to 69% of products and a 5% rate to the remainingones.
9

sectors. Figure 2 plots the average Chinese tariff on U.S. products by type of product according to the
Census Bureau’s end use classification. Consumer goods (which includes passenger cars) start from a
higher level (slightly below 20%) than other categories and reach a 50% tariff in late 2018.11 Food and
agricultural goods also face a large tariff increase, from about 7% to 32%. Tariff increases for industrial
supplies and capital goods occur later, with China’s $52 billion retaliatory tariff round. The mean tariff
for industrial supplies rises from about 5% to 18%, while tariffs for capital goods increase by less, from
2% to about 6%.
MFN tariffs Most-favored-nation tariffs are obtained directly from the WTO website. These tariffs
are updated annually and are available, in some cases, up to 2019. In cases where countries have not
reported up to date values, we assign the most recent value reported. This assumption is reasonable
given that changes from year to year in MFN tariffs are very small compared to the retaliatory tariff
increases faced by the U.S. in this period.
Table 3 reports summary statistics on the MFN tariffs faced by U.S. exports each year. These are
computed across product - destination - month observations within each year and are unweighted. The
mean MFN tariff faced by U.S. exports has decreased from 6.47 in 2015 to 6.16 in 2019, while the mean
total tariff (i.e. including “trade war” tariffs imposed in 2018 and 2019) is 7.16 in 2018 and 7.47 in 2019.
Chinese MFN tariffs have also decreased slightly from 8.98 to 8.17 between 2015 and 2019, while the
mean total tariff is 11.73 in 2018 and 17.43 in 2019.
3.3 U.S. Input Tariffs
We compute input tariffs for each exported product combining U.S. tariff schedules and the total re-
quirements input-output table for the U.S. economy in 2012. We first describe these two data sources
and then the construction of the input tariffs.
U.S. trade war tariffs The U.S. imposed tariffs on various trading partners during 2017-2019. These
include tariffs on washing machines and solar panels in 2017, tariffs on steel and aluminum in 2018 and
several tariff waves imposed specifically on China in 2018 on large sets of imported goods. Data on these
tariffs are obtained from communications by the U.S. Trade Representative and the Li [2018] dataset of
trade war tariffs and verified against each other.12 Tariffs on washing machines and solar panels apply
to all trading partners and were imposed under Section 201 of the Trade Act of 1974 in October and
November 2017. Tariffs on steel and aluminum were applied in March 2018 and based on Section 232
11Tariffs for consumer goods excluding cars start from a significantly lower level and face a much smaller increase as shownin panel B in Figure 2.
12Tariffs on washing machines and solar panels are not included in the Li [2018] dataset.
10

of the Trade Expansion Act of 1962. They were imposed in principle on all trading partners, but a list
of countries including the European Union, Canada, and Mexico among others were initially exempt.
These exemptions were terminated in June 2018. Tariffs on China were based on Section 301 of the
Trade Act of 1974 following an investigation of China’s discriminatory actions towards U.S. companies’
intellectual property rights. A first round covered $50 billion and was applied in two subsequent waves
in July and August 2018. A second wave covered $200 billion and was imposed in September 2018.
U.S. MFN tariffs MFN tariffs at an annual frequency are obtained from the WTO website, similarly to
those for other countries described above.
Construction of U.S. input tariffs Input tariffs for each product p exported by the U.S. in month t
are a weighted average of the tariffs on the inputs used to produce each product, with weights equal to
the input requirements reported in the total requirements input-output table.13 The first step involves
computing the average import tariff imposed by the U.S. on each imported good j in month t. This is
computed as a weighted average of tariffs across source countries c as shown in equation 1. The weights
wjc correspond to 2017 imports from each source country.14
U.S. Tariffjt =∑c
wjc ·U.S. Tariffjct (1)
The tariff on imported inputs relevant to each exported product p is then defined as the weighted aver-
age of these U.S. tariffs on each imported product j with weights wIOpj obtained from the total require-
ments input-output table for the U.S. economy.
U.S. Input Tariffpt =∑j
wIOpj ·U.S. Tariffjt (2)
The industry by industry total requirements input-output (IO) table for 2012 is obtained from the Bu-
reau of Economic Analysis (BEA), which is based on 405 different industries. We use a concordance
obtained from BEA to construct input requirements by 6-digit NAICS codes from the codes used in
the IO table. The input tariffs are thus defined at the 6-digit NAICS level and assigned to the trade
data using a concordance between HS 6-digit codes and NAICS 6-digit codes obtained from the Census
Bureau.
13Pierce and Schott [2016] similarly use the total requirements table to build measures of the impact of the U.S. grantingpermanent normal trading relationships to China through input-output linkages.
14Data on U.S. imports to construct these weights is obtained from the Census Bureau “Imports of Merchandise” publica-tion.
11

The bottom panel in Table 3 reports summary statistics of the input tariffs faced by U.S. exported
products by year. While input tariffs vary by product and period, these summary statistics are computed
across product - destination - month observations within each year in the full dataset. The average input
tariff relevant to U.S. exports has increased from 3.17 in 2015 to 5.52 in 2019.
3.4 Product Characteristics
End Use Classification We distinguish between four different product categories based on the U.S.
Census Bureau’s End-Use classification. This classification divides products into food and agricultural
goods, industrial supplies, capital goods, and consumer goods.15 As Table 1 reports, the largest cat-
egories in exports to China are industrial supplies (each accounting for 37% of total exports in 2017)
followed by capital goods (34%), food and agricultural products (15%), and consumer goods (13%).
Exports to the rest of the world, in turn, have a similar composition, with a smaller share of food and
agricultural products and a larger share of industrial supplies and consumer goods. In addition we will
distinguish in the analysis between durable and nondurable consumer goods.16
Related-Party Trade We use the U.S. Census Bureau’s related-party trade database to compute the
share of exports occuring among related parties for each product. Ideally one would use data on exports
split into trade among related parties and arms-length trade during the trade war period. This data are
not available since the related-party trade data is published with a lag (the most recent value is for
2016). Even if these data were available, they are reported at an annual frequency whereas the analysis
in this paper is monthly given the frequency of tariff changes.
The data are reported annually at the level of destination country and 6-digit NAICS codes. Using
data from 2016 we compute the share of related-party trade for each NAICS 6-digit level code. To
combine these measures to the exports dataset described above, we use concordance files between U.S.
HS 10-digit codes and NAICS 6-digit codes provided directly by the U.S. Census Bureau.
Table 2 reports summary statistics for the share of related-party trade across product-destination
pairs in 2017. Exports to China have on average a higher share of trade within related parties (22.9%)
than exports to the rest of the world (16.4%), with a larger difference at the median and similar shares
at the extremes of the distribution.
15The original end use classification has automobiles as a separate category. We assign passenger cars (end use code 300)to consumer goods; trucks, buses and special purpose vehicles (301) to capital goods; and parts, engines, bodies, and chassis(302) to industrial supplies.
16Durable consumer good codes are: i) Durables, manufactured-except automotive (41), ii) Durables-unmanufactured (421)and iii) Passenger cars, new and used (300).
12

Elasticities of Substitution Elasticities of substitution are obtained from Broda et al. [2006]. They
calculate these elasticities by country for each industry at the 3-digit level of the Harmonized System
(i.e. for 171 different industries). These elasticities are constructed using data from 1994 to 2003 and
are reported for a list of 73 countries. Destinations for which these elasticities are available receive
more than 82% of U.S. exports in 2017. The bottom panel in Table 2 reports summary statistics of the
distribution of elasticities of substitution across products for China and the rest of the world.
3.5 Exchange Rates
Official exchange rates against the U.S. dollar at a monthly frequency for the largest 25 destinations of
U.S. exports are obtained from the IMF and expressed in terms of local currency per U.S. dollar.17 In
a few cases in which these are not available from the IMF, they are obtained from the Federal Reserve
Bank of St. Louis’ FRED database. Monthly consumer price indices are obtained from the OECD.
3.6 Measures of Trade Policy Uncertainty
News-based Indices We also use country-level monthly indices of trade policy uncertainty and broader
economic policy uncertainty and economic uncertainty. The index of trade policy uncertainty in China
is constructed by Davis et al. [2019]’based on mentions of trade and uncertainty related terms in news-
papers. Baker et al. [2016] construct a similar index for the U.S. An economic policy uncertainty index
for the U.S. is obtained from Davis [2016]. We also use the VIX index (the Chicago Board Options Ex-
change Market Volatility Index) as a (widely used) a measure of economic uncertainty [Novy and Taylor,
2019, Bloom, 2009].
Product-level Measure of Trade Policy Uncertainty We also construct a product-level measure of
policy uncertainty in the context of the ongoing trade war. The key insight behind this measure is that
once the trade war has become a credible threat, the degree of uncertainty faced by a U.S. exporter to
China is proportional to the difference between observed tariffs and the highest possible tariffs (Nash
tariffs) that China would optimally impose under a full-blown trade war. These hypothetical tariffs
are obtained from simulated quantitative trade policy models [Ossa, 2014]. Consider, for instance, U.S.
exports to China in two different sectors, paper publishing and ferrous metals, which faced similar
tariffs throughout 2017 (before the trade war began) of about 5%. The optimal tariffs China in a full-
blown trade war setting, however, differ significantly for these two industries and are much higher for
paper products (58%) than for ferrous metals (39%). Thus, exporters in the paper products sector face
17Exchange rates at a monthly frequency are not readily available for many typically smaller countries in the sample. Theset of the largest 25 destinations accounts for 84% of U.S. exports in 2017.
13

a larger degree of trade policy uncertainty once the trade war becomes a credible threat. This approach
resembles Graziano et al. [2018] in the context of Brexit and Pierce and Schott [2016] and Handley and
Limao [2017] in the context of China’s accession to the World Trade Organization.18
We denominate the difference between observed and Nash tariffs “trade war tariff risk” (TWTR). We
compute the TWTR measure not only for China but also for all other destinations.
TWTRpdt = Simulated Trade War Tariffpdt −Tariffpdt (3)
The Nash tariffs that countries would imposed on the U.S. in a full-blown trade war are computed
by Ossa [2014] using a multi-country and multi-industry quantitative trade model with ricardian and
intra-industry trade motives. These hypothetical tariffs are provided for China, Brazil, Japan, India, the
European Union, and the rest of the world as an aggregate (and vary much more across industries than
across regions). They are computed for 33 different sectors.19
In January 2018, before China had imposed any retaliatory tariff on the U.S., the mean TWTR level
was 57%, and the 10th and 90th percentiles were 32% and 66%.
3.7 Trends in U.S. Exports
U.S. exports to China have seen a sharp fall during 2018 and the first months of 2019. Figure 4 plots
exports to China and the rest of the world in the first quarter of each year from 2015 to 2019. Exports
to the rest of the world increased by 5.5% between 2017Q1 and 2018Q1 and 2.1% between 2018Q1
and 2019Q1. Exports to China, in turn, increased by 5.8%, slightly more than exports to the rest of
the world, between 2017Q1 and 2018Q1 and fell by 24% between 2018Q1 and 2019Q1. These patterns
vary susbtantially across sectors, as shown in Figure 6. Grouping sectors by the Census Bureau’s end use
categories, the largest decline occurs in the food and agricultural sector, with a 37.4% drop in exports
to China in 2018Q1-2019Q1 preceded by a 15.7% drop in 2017Q1 - 2018Q1, while exports to the rest
of the world essentially remained constant. Exports of industrial supplies to China have also fallen
drastically, while exports of capital goods and consumer goods have remained stable through the trade
war. As Figure 5 illustrates, there has also been a 5% decline in the number of HS 10-digit products
exported to China in 2018Q1-2019Q1, which contrasts with an almost flat trend for the rest of the
18Graziano et al. [2018] construct product-level risk measures for British trade flows as the distance between current (zero)tariffs and either MFN tariffs or trade war noncooperative tariffs Britain could face from the European Union following Brexit.Pierce and Schott [2016] and Handley and Limao [2017] measure product-level trade policy uncertainty as the differencebetween MFN U.S. tariffs received by China in the U.S. and Smoot-Hawley tariffs to which the U.S. would default if preferentialtreatment to China were not approved by Congress each year before China’s WTO accession.
19Sectors in Ossa [2014] are defined according to the GTAP (Global Trade Analysis Project) classification, which we matchto HS 6-digit products with a concordance obtained from the GTAP website.
14

world.20
4 The Trade War’s Impact on U.S. Exports
We begin this section examining the total impact of foreign tariffs on U.S. export values, quantities
and prices during the 2018-2019 trade war. We then document the extensive heterogeneity in these
elasticities across destinations, sectors and over time, and study the underlying determinants. We start
by looking at the impact of foreign tariffs on U.S. exports to the world, but through much of the analysis
focus on exports to China which is, with the U.S., the main party in the 2018-2019 trade war and where
retaliatory tariffs for U.S. exports have had by far the largest increase.
To quantify the impact of foreign tariffs on U.S. exports we estimate linear regressions of trade out-
comes on tariffs.21 The ongoing trade war episode is the ideal setting for this type of empirical exercise
as it provides susbtantial variation in the products targeted and in the timing of tariffs. In addition, as
argued in Section 3 as well as by Amiti et al. [2019], tariffs were unanticipated in their occurrence, in
their timing, and in the set products targeted, allowing for a clean identification of their impact.
The baseline regression is represented by equation 4. The dependent variable Ypdt is alternatively
the logarithm of U.S. exported value, quantity or unit value of HS 10-digit product p to destination d in
month t. The independent variable is the logarithm of one plus the ad-valorem tariff rate faced by U.S.
exports of each product in each destination. This specification captures the contemporaneous impact
of tariffs on export values, quantities and prices; at the end of the section we add leads and lags to
study the dynamic effects of the tariffs. As discussed in Section 3, these tariffs are constructed at the HS
6-digit level. This equation includes product-by-destination and time-by-destination fixed effects. The
time-by-destination fixed effects absorb country-specific shocks that affect the demand for U.S. exports
such as exchange rates or changes in market size. Alternative specifications with different sets of fixed
effects, results from estimating the relationships between trade outcomes and tariffs in first differences
rather than in levels, and specifications accounting for the response of the extensive margin are reported
in the robustness results at the end of this section. Equation 4 is estimated by OLS and standard errors
are clustered at the level of HS 6-digit products.
Ypdt = β1 · log(1+Tariffpdt) +γpd + δtd + εpdt (4)
20Note that there is a minimum reporting threshold of $2,500 in the U.S. exports data (which we discuss in more detail inthe robustness results at the end of Section 4.
21As Goldberg and Pavcnik [2016] point out, there is reatively little evidence in the literature regarding the impact of tariffson trade volumes and prices. Goldberg et al. [2010] also estimates the same type of regression below: linear regressions oftrade outcomes on tariffs in levels with product and time fixed effects in the context of the Indian trade liberalization.
15

We start by reporting the results in the full sample considering all destinations of U.S. exports and later
focus separately on the trading partners imposing retaliatory tariffs, especially China. Table 4 shows the
results both for the entire baseline sample that goes from January 2015 to April 2019 (in columns 1-3)
as well as for a January 2018 to April 2019 sample which is limited to the trade war period (in columns
4-6). Focusing first on the longer sample, the -0.036 elasticity in column 1 implies that a 10 percentage
point increase in foreign tariffs is associated to a 5.1% decline in U.S. exports. This response is driven by
a decline in the quantity sold, as shown in column 2, for which the elasticity is -0.065.22 Export prices
(unit values) exclusive of tariffs are computed as the ratio of export values to quantities. In response to
higher tariffs, unit values essentially remain constant (the elasticity is 0.006). This indicates a complete
passthrough of tariffs to (tariff-inclusive) export prices.23 Focusing exclusively on the trade war period
(using the 2018-2019 sample) the elasticity for export values (in column 4) is substantially higher: the
-0.08 coefficient implies a 10 percentage point increase in foreign tariffs is associated to a 10% decline
in U.S. exports, and again, this is driven by an adjustment in quantities.
These three findings for values, quantities and unit values, including the finding of no adjustment
in tariff-exclusive export prices, are in line with those in Amiti et al. [2019] (Table 3) and in Fajgelbaum
et al. [2019] (Figure IV).24 This first result is the point of departure from the existing literature, which
has focused on U.S. imports and the welfare consequnces of the trade war. Consequently, all the results
below are novel.
China has been the main target of U.S. tariffs and has consequently imposed the largest retaliatory
tariffs. To illustrate this point, consider that China was the third destination of U.S. exports in 2017
and its 2018 retaliatory tariffs apply to a list of products covering approximately $112 billion in U.S.
exports according to their 2017 value, which is about 87% of total U.S. exports to China ($129 billion
in 2017). In comparison, Canadian, European and Mexican tariff rounds cover $17.8, $8.2, and $4.5
billion respectively. In addition, the average tariff on U.S goods imposed by China has increased by 15
percentage points from about 5% to 20%, while the average tariff in Canada, Mexico, and the European
22Note that the number of observations is higher in column 1 for export values than in columns 2 and 3 for quantities andunit values, because not all entries in the data report quantities.
23The canonical theory of trade policy suggests that in response to tariffs imposed by large countries with some marketpower, tariff-exclusive prices would fall, and passthrough into domestic prices at the destination would be incomplete. Onepotential explanations for the finding here of a close to zero (and even slight increase) in tariff-exclusive prices is that highertariffs can reduce the number of firms that export a certain product. If lower productivity firms are more likely to exit andgiven that these firms set lower export prices (as Harrigan et al. [2015] documents), then the compositional effect could raiseaverage prices.
24The magnitude we find is almost identical to Amiti et al. [2019]. When considering the sample restricted to the trade warperiod (more consistent with their sample), the elasticity in column 4 in Table 3 in Amiti et al. [2019] is essentially the sameas the one we find (i.e. that a 10 percentage point increase in tariffs is associated to a 10% decline in trade). In Section 4.6 weestimate this equation in differences (as in Amiti et al. [2019]) finding a very similar result. Amiti et al. [2019] also estimate asimilar equation using the hyperbolic sine of export values instead of the logarithm to take into account the extensive margin.In Section 4.6 we report results considering the extensive margin.
16

Union has increased by at most one percentage point, as shown in Figure 3. Also, as Figure 4 reports,
exports to China have fallen substantially in 2018 and the first months of 2019, while exports to the rest
of the world have remained relatively stable. We estimate equation (4) separately for exports China and
find that the impact of tariffs on export values is three times larger than that for the rest of the world.25
To evaluate the potential reasons behind this striking difference, we will later examine the determinants
of these elasticities. Going back to documenting this result, Panel A in Table 5 shows the estimates of
equation (4) separately for China. The elasticity for export values is -0.17, implying that a 10 percentage
point increase in Chinese tariffs leads approximately to a 15.7% decline in exports. This result is entirely
accounted for by a decline in quantities (-0.174 elasticity). The impact on (tariff-exclusive) unit values
is close to zero and not statistically significant.26 In addition, note that the difference between the
impact of Chinese tariffs with the average impact of rest of the world tariffs is not due to the different
composition of the type of products sold to China as we show below at the end of Section 4.1.
Among the other U.S. trade partners imposing retaliatory tariffs, Canada, the European Union and
Mexico’s tariff rounds are the most important in terms of the volume of U.S. exports targeted. These
tariff rounds were imposed in late June and early July 2018 in response to U.S. tariffs on steel and
aluminum. Note that these tariffs are much smaller than those applied by China, both in terms of the
number of products targeted as well as the volume of trade accounted for by these products. In the
case of the European Union, the elasticity for export values is -0.038 as shown in column 1 in panel B
in Table 5. Quantities respond more strongly (-0.064 elasticity) and (tariff-exclusive) unit values (0.022
elasticity) rise slightly in response to tariffs. In the case of Canada (in panel C), the elasticity for values
and quantities are several times larger (-0.147 and -0.172) than for the E.U., and unit values also rise
slightly (0.024 elasticity). Finally, in the case of Mexico, there is a negative elasticity for quantities (-
0.031 elasticity) and an increase in prices (+0.024) which is similar to that for Canada and the European
Union. The elasticity for export values is small and not statistically significant.27
4.1 Sectoral Heterogeneity in the Impact of Tariffs
We now turn to unpacking exports to China into different sectors and industries and show that there
is a striking amount of heterogenity in the impact of tariffs. A first approach simply to illustrate these
differences divides products based on their end use. The Census Bureau’s end use classification divides
25From this point onward we use the full sample spanning January 2015 to April 2019.26Note that splitting the sample between exports to China and exports to the rest of the world yields identical coeffi-
cients than including an interaction term between a China dummy and the tariff variable, due to the inclusion of product-by-destination and time-by-destination fixed effects.
27For the European Union, Canada, and Mexico, these coefficients imply that a 10 percentage point in tariffs leads to a 50%,9% and 1.3% decline in exports respectively (not statistically significant in the case of Mexico).
17

industries into food and agricultural goods, industrial supplies, capital goods and consumer goods.28
We follow two approaches that yield generally similar results: estimating equation (4) splitting the
sample into these five sectors, or estimating a single regression adding dummy variables for each sector.
Table 6 shows the split-sample results. Consider the impact of Chinese tariffs on export values, in
panel A. The elasticity ranges for -0.347 and -0.315 for industrial supplies and for agricultural and food
products to -0.201 for consumer goods, and -0.066 for capital goods. This means that a 10 percentage
point increase in tariffs leads to a 16% fall in exports in the case of food and agricultural goods, 38%
decline among industrial supplies, 7.6% decline for capital goods, and finally a 13.7% fall in exports
for consumer goods. In the case of food and agricultural products, industrial supplies, and consumer
goods, the impact on values is relatively close to the impact on quantities (reported in panel B). For
capital goods, however, the message is entirely the opposite: the negative impact is entirely driven by
a negative impact on prices. The impact on prices is not statistically different from zero for food and
agricultural goods, industrial supplies and consumer goods. Appendix Table 13 shows similar results
are obtained from a single regression adding interaction terms between sectoral dummy variables and
tariffs.29
Having established these large sectoral differences in terms of the impact of tariffs, we explore two
industry characteristics that explain these elasticities. A first product determinant that could influence
the adjustment in response to tariffs is the extent to which trade occurs within the same or related firms
as opposed to arms-length transactions. Previous work on exports’ response to tariffs has not analyzed
this dimension, which will turn out to be quantitatively very important.30 Intuitively, one could think
that firms trading arms-length establish longer-term relationships and are less likely to switch trading
partners in response to tariffs, and more so in the case of these tariffs that could be seen as temporary.
As we explain in detail in Section 3, data on related party vs. arms-length exports is not available
during the trade war period, so we use each products share of related party exports in the most recent
year. A second determinant we examine is products’ elasticities of substitution, which capture the
extent of horizontal differentiation in each industry. Larger values imply a lower degree of horizontal
differentiation. The theory of trade policy would suggest that the negative impact of tariffs on export
values should be larger for less differentiated products.31
28There is also “Other Goods” and unreported categories in the data. These represent a negligible share of exports andare left out of this part of the analysis. Recall that cars and car parts are originally reported separately and assigned to othercategories as explained in Section 3.
29The small differences between this and the previous split-sample approach come from imposing common fixed effectsacross sectors in the joint regression.
30There is work analyzing the effect of tariffs as a determinant for the decision of firms on whether to vertically integratewith suppliers [Dıez, 2014] but not comparing the response of intra-firm vs. arms length exports to tariff changes.
31While there is not much empirical evidence testing how product differentiation shapes the impact of tariffs on trade flows,Spearot [2013] shows that, in the context of U.S. tariff cuts due to the GATT Uruguay round, imports of less differentiated
18

To study how each of these product characteristics shape the impact of tariffs on exports, we augment
equation (4) including interaction terms between these variables and foreign tariffs:32
Ypdt = β1 · log(1+Tariffpdt) + β2 · log(1+Tariffpdt)×Rel. Party Sharepd+
β3 · log(1+Tariffpdt)× log(Elast. of Subs.pd) +γpd + δtd + εpdt
(5)
Again, we focus first on exports to China. The results for export values are shown in panel A in Table 7.
In columns 1 and 2, each of the determinants is included by separately and column 3 reports the results
from including them jointly. The coefficients for the interaction between tariffs and the share of related
party trade or between tariffs and the elasticity of substitution are fairly stable across columns. The first
finding is that a higher share of related party trade is associated to a milder negative impact of tariffs
on export values. The magnitude is economically very meaningful. The total elasticity of exports to
tariffs is -0.22 at the 10th percentile of the share of related party trade and -0.14 at the 90th percentile,
evaluating other variables at their means. The second finding is that for more differentiated products
(with a lower elasticity of substitution) the negative impact of tariffs is also smaller. The total elasticity
of exports to tariffs is -0.16 at the 10th percentile and -0.21 at the 90th percentile of this variable. A
similar pattern is found for quantities (in panel B). In the case of unit values (in panel C), the positive
coefficient on the interaction between tariffs and the elasticity of substitution in column 3 indicates
that tariff-exclusive prices fall less among less differentiated products (which presumably have lower
markups).
Appendix Table 15 shows the results considering exports to the rest of the world. In this case, the
share of related party trade does not mediate the impact of tariffs on U.S. exports. This suggests a
special behavior by multinational corporations only regarding trade with China. The role of product
differentiation is similar to that found earlier for exports to China: tariffs have a lower impact on export
values and quantities among more differentiated products.
Does product composition explain the larger impact of Chinese tariffs on U.S. exports? We started
this section by showing that the impact of tariffs on U.S. exports is three times larger when considering
exports to China than exports to all destinations. Having found two product characteristics that shape
the passthrough of tariffs, could it be that differences in product composition explain the larger impact
of tariffs on exports to China? The answer is no. We estimate the following equation that compares the
products are more responsive to tariffs.32Note that following Levchenko et al. [2011] the elasticity of substitution is included in logs.
19
impact of tariffs in China and other destinations and controls for product characteristics (elasticities of
substitution and the related party trade share) as well as by destination d × time t × sector s (at the HS
2-digit level) fixed effects.
Ypdt = β1 · log(1+Tariffpdt) +β2 · log(1+Tariffpdt)×1[Chinad] +β3 · log(1+Tariffpdt)×Rel. Party Sharepd+
β4 · log(1+Tariffpdt)× log(Elast. of Subs.)pd +γpd + δtds + εpdt
(6)
The results in Appendix Table 21 show a difference captured by the coefficient on the interaction term
between tariffs and the China dummy variable (β2) that persists after controlling for product character-
istics. Columns 1 through 3 show the results of estimating 6 for export values, quantities and prices.
For comparison, columns 4 through 6 show the results from omitting the interaction of tariffs with the
elasticity of substitution and the related-party trade share, and replacing the destination × time × sec-
tor fixed effects by the destination × time fixed effects used previously. The coefficients are very similar
across both specifications, showing that clearly, the larger impact of tariffs on exports to China is not
the result of product composition.33
4.2 Supply Chains Matter: The Effect of U.S. Import Tariffs on U.S. Exports
U.S. import tariffs, imposed mainly on imports from China, could have an additional impact on U.S.
exports as U.S. companies rely on imported inputs to produce exported goods. China is among the
most important sources of U.S. imported inputs, so the impact of U.S. tariffs imposed on a broad set of
imported Chinese goods is presumably important in magnitude. In the context of developing countries,
the literature has established that in trade liberalization episodes the reduction in tariffs affecting firms’
imported inputs leads to increases in productivity [Amiti and Konings, 2007] and firms’ product scope
[Goldberg et al., 2010].
Input tariffs, which vary by product and time period, are defined as a weighted average of U.S.
import tariffs with weights equal to coefficients from the U.S. total requirements input-output table.
This procedure was explained in detail in Section 3.4. Having defined the relevant tariff on imported
inputs for each exported product in each time period, we augment equation 4 adding this term:
Ypdt = β1 · log(1+Tariffpdt) + β2 · log(1+U.S. Input Tariffpt) +γpd + δtd + εpdt (7)
33We have also verified that the larger impact of Chinese tariffs is not the result of a nonlinear impact of tariffs.
20

We estimate this equation on the full sample of exports to all countries. We report the impact of
input tariffs on U.S. export values, quantities and prices. The results are shown in the first column
in Table 8. Input tariffs indeed have a negative impact on U.S. export values. The magnitude of the
coefficient is such that a 10 percentage point increase in input tariffs is assocated to a 2.3% decline in
U.S. exports. In the case of quantities and prices, the effect is not statistically different from zero. We
also examine the impact of input tariffs separately by end use categories, once again finding substantial
heterogeneity. The negative impact of input tariffs on export values is large and statistically significant
among consumer goods, among which a 10 percentage point increase in input tariffs is associated to a
5.3% decline in exports. It is not statistically significant among other categories. In the case of export
prices, input tariffs lead to a large increase in prices among industrial supplies, and no significant effect
on other categories. These results highlight the importance of a supply chain mindset in the design and
evaluation of trade policy [Blanchard et al., 2017].
4.3 The Role of Trade Policy Uncertainty
Observers of the 2018-2019 trade war have often argued that beyond tariffs, the uncertainty generated
by these trade policies has contributed to depress trade flows and global growth.34 In fact trade policy
uncertainty indexes clearly spike around the trade war period (Figure 7). We measure the impact of
uncertainty on U.S. exports with the following two different approaches.
4.3.1 A Collapse in U.S. Exports of Consumer Durables to China
A simple way of establishing whether uncertainty has played a role is to compare the exports of durable
versus nondurable exports during the trade war relative to the preceding period. As Novy and Taylor
[2019] argue, demand for durable goods responds more to uncertainty. The reason in the face of un-
certainty buyers follow a wait-and-see approach, postponing purchases. We focus on consumer goods,
which can be cleanly divided into durable and nondurable goods with the same end use classification
used earlier.35 We thus modify equation (4) adding the interaction between a dummy variable mark-
ing the full-blown trade war period and a dummy variable for durable goods. The trade war dummy
variable is set to one starting in July 2018.36 We first estimate an equation only for exports to China:
Ypt = β1 · log(1+Tariffpt) + β2 ·Trade Wart × 1[Durablep] +γp + δt + εpt (8)
34See for instance the IMF’s World Economic Outlook of April 2019 [IMF, 2019].35Capital goods are all durable, and industrial supplies are difficult to be cleanly split into durable and nondurable.36July 2018 is when China imposes its first large and broad round of tariffs on U.S. exports. Note that China imposed a
small $2.4 billion tariff round in April 2018.
21

Alternatively, we replace the trade war dummy variable by a measure of trade policy uncertainty, so
the question becomes whether durables fall relative to nondurables in times of higher trade policy
uncertainty. This measure is Davis et al. [2019]’s index of trade policy uncertainty in China, constructed
by counting mentions of uncertainty and trade related terms in newspaper articles.37
Ypt = β1 · log(1+Tariffpt) + β2 ·Trade Policy Uncertaintyt × 1[Durablep] +γp + δt + εpt (9)
Further, we extend equation 8 considering exports to all destinations and adding an interaction term
that determines whether a differential impact in the decline in durable goods only occurs for exports to
China.
Ypdt = β1 · log(1+Tariffpdt) + β2 · log(1+Tariffpdt)× 1[Chinad] + β3 ·Trade Wart × 1[Durablep]
+ β4 ·Trade Wart × 1[Durablep]× 1[Chinad] +γpd + δtd + εpdt
(10)We also estimate a version of this last equation with a trade policy uncertainty index instead of the
trade war dummy. Because trade policy uncertainty measures have only been constructed for a few
countries, we use Baker et al. [2016]’s trade policy uncertainty index for the U.S. as a proxy for global
trade policy uncertainty.38
Ypdt = β1 · log(1+Tariffpdt) + β2 · log(1+Tariffpdt)× 1[Chinad]+
β3 ·Trade Policy Uncertaintyt × 1[Durablep] + β4 ·Trade Policy Uncertaintyt × 1[Durablep]× 1[Chinad]+
γpd + δtd + εpdt
(11)The results are shown in Table 9. Panel A reports the results of estimating equation 8, which is
restricted to exports to China. These results indicate that after controlling for tariffs, exports of durables
have fallen by 15% in comparison to nondurables during the trade war period relative to the preceding
period. Quantities have also fallen disproportionately for durables, while prices have increased but
that effect is not statistically significant. In panel B the trade war dummy is replaced by a trade policy
uncertainty index for China. It shows a very similar picture: a decline in exports of durables in periods
of high trade policy uncertainty. Panel C considers exports to all destinations. In column 1 (for export
values) the interaction between the durable goods dummy and the trade war dummy is negative but
37We use a measure of trade policy uncertainty in China because U.S. exports will be affected primarily by Chinese tradepolicy. Note that using instead a measure of trade policy uncertainty in the U.S. will yield very similar results.
38Note that as Figure 7 shows, the trade policy uncertainty indexes for China and the U.S. are highly correlated, and bothspike during the trade war period.
22

close to zero. The coefficient on the triple interaction between the durable goods dummy, the trade
war dummy and the China dummy is large and negative. This indicates that the collapse in exports
of durable goods (beyond the direct effect of tariffs) is exclusive to exports to China. The magnitude
is such that while exports to China of durables (relative to nondurables) fall by 16% during the trade
war period (relative to the previous period), there is no difference between durables and nondurables in
exports to the rest of the world. A similar result is found when replacing the trade war dummy with a
trade policy uncertainty measure (panel D).
While the trade war has meant an increase in trade policy uncertainty, there has also been higher
levels of economic policy uncertainty or broader economic uncertainty in general. In Appendix Ta-
ble 14 we estimate an augmented version of equation 11. In addition to the interaction term between
the dummy for durable goods and the trade policy uncertainty measure, we include interaction terms
with measures of economic policy uncertainty and the VIX index often used to capture economic uncer-
tainty.39 From the table it is clear that is is only in periods of high trade policy uncertainty that durables
fall (relative to nondurables). The signs for the interaction terms between the durables dummy and
either the economic policy uncertainty measure or the VIX index are also negative but not statistically
significant.
Put together, these results strongly evidence a negative impact on exports from the uncertainty
generated by trade policies.
4.3.2 A Product-level Measure of Tariff Risk Amid the Trade War
Our second approach to capture the impact of uncertaity on U.S. exports is based on the insight that,
once the trade war becomes a credible threat, the risk faced by a U.S. exporter is proportional to the
difference between the observed tariffs and the highest tariff U.S. trading partners would be willing to
impose in a trade war context.40
We denominate the distance between observed and simulated “trade war” tariffs “trade war tariff
risk” (TWTR). Details on the construction of this variable and descriptive statistics were provided in
Section 3.6. Given potential measurement error and the coarseness of the sectors for which this mea-
sure is defined, we simply distinguish between observations with above and below median TWTR. We
estimate the following equation in which U.S. exports are a function of observed tariffs and the interac-
tion between a dummy equal to one during the trade war period and a dummy variable for observations
39The economic policy uncertainty is obtained from Davis [2016]. The VIX index is the Chicago Board Options ExchangeMarket Volatility Index. It measures the market expectation of 30-day forward-looking volatility and has been widely used asa measure of economic uncertainty [Novy and Taylor, 2019, Bloom, 2009].
40Related measures of trade policy uncertainty have been constructed by Graziano et al. [2018] studying Brexit and Pierceand Schott [2016] and Handley and Limao [2017] stuyding China’s accession to the World Trade Organization.
23

with above-median TWTR. The presumption is that when a trade war is not seen as a possibilty (i.e.
before 2018) the TWTR measure should not have an impact on trade flows. In addition, we allow for a
differential impact of this measure in the case of exports to China, which is the main rival of the U.S.
in the trade war and consequently the country in which a transition to “trade war” tariffs appears most
likely. This equation includes product × time and destination × time fixed effects.
Ypdt = β1 · log(1+Tariffpdt) + β2 · log(1+Tariffpdt)× 1[Chinad] + β3 ·Trade Wart × 1[High TWTRpt]
+ β4 ·Trade Wart × 1[High TWTRpt]× 1[Chinad] +γpd + δtd + εpdt
(12)The results are reported in Table 10.41 Column 1 indicates that exports to China fall in industries
with above-median TWTR during the trade war period. In contrast, TWTR does not have an effect on
exports to the rest of the world, consistent with the fact that the U.S. has been engaged primarily in a
trade war with China and the tariffs applied by other trading partners have been minor in comparison.
Specifically, observations with above-median TWTR fall by 5.4% compared to those with below-median
TWTR among exports to China. Columns 2 and 3 correspond to quantities and prices as the dependent
variable. The impact of the uncertainty measure on quantities follows the same pattern, although the
coefficient on the triple interaction is not statistically significant. The impact on prices, however, is
negative and statistically significant, and implies a 4.4% larger decline for observations with above-
median TWTR.
4.4 Have U.S. Exports to China been Redirected to the Rest of the World?
A key question is whether U.S. exports facing higher tariffs in China amid the trade war have been
redirected towards other markets or not. If exports to the rest of the world do not offset lost exports due
to Chinese tariffs, the alternative is that they are sold in the domestic market, or firms reduce production
or increase inventories. To answer this question we estimate equation 4 for the rest of the world sample
(i.e. non-China destinations), and augment it with each products’ Chinese tariffs in addition to tariffs at
the destination, as shown in equation 13. Aside from this additional term, the estimation is equivalent
to that of equation 4 described earlier.
Ypdt = β1 · log(1+Tariffpdt) + β2 · log(1+TariffCHNpd ) +γpd + δtd + εpdt (13)
Column 1 in Table 11 shows the results. In the case of export values, the 0.008 coefficient is such
41We report results for a sample from 2017m1 to 2019m4. With the longer sample starting in 2015m1 the results are similarbut not statistically significant at conventional levels.
24
that a ten percentage point increase in Chinese tariffs leads to a 0.8% increase in exports to the rest of
the world. Given that China accounts for 8% of U.S. exports in 2017 and that a ten percentage point
increase in Chinese tariffs leads to a 15.7% decline in exports to China (based on the results in Table
5 discussed earlier), the increase in exports to the rest of the world does not fully offset the decline in
exports to China due to the trade war. It offsets only about half of the lost exports to China. The impact
of Chinese tariffs on quantities sold to the rest of the world is larger than that of values. and the impact
on export prices is essentially zero.
What elements could impede the rerouting of U.S. exports? First, exporting requires establishing
relationships, which is costly and takes time. Second, tariffs might have been seen as temporary by
U.S. exporters, especially at the start of the trade war, leading to a wait and see approach instead of
redirecting exports at a discount. Third, rerouting exports implies incurring in fixed costs associated to
legal and regulatory barriers, and transport-related expenses that are not per unit.42.
An analysis of this relationship by product type is useful to speculate further on the causes behind
this incomplete rerouting of U.S. exports. This is shown in columns 2 to 5 in Table 11. This result in-
dicates that food and agricultural goods and industrial supplies are the two sectors for which Chinese
tariffs lead to a statistically significant increase in exports to the rest of the world. In both cases, in-
creased exports to the rest of the world as a result of Chinese tariffs offset about half of lost exports to
China. In the case of food and agricultural exports, Chinese tariffs induce a small decline in the export
price to the rest of the world. One can speculate that this sector, compared to capital goods or consumer
goods, is typically less differentiated and has a larger share of commodities. These products are not tay-
lored to a specific buyer and thus are easier to reroute. Alternatively, the fact that food and agricultural
goods have seen some of the largest tariff increases and the largest decline in exports to China perhaps
suggest that the decline in trade reaches a point where an initial wait and see approach is replaced by
the need to sell the output elsewhere.
4.5 Tariffs and Exchange Rates
We started by establishing that tariffs have no impact on tariff-exclusive prices (i.e. full passthrough to
tariff-inclusive prices). This stands in contrast to a large literature, surveyed by Burstein and Gopinath
[2014] and earlier by Goldberg et al. [1997] that has documented an incomplete exchange rate passthrough
into import or export prices. The context and data studied here allow us to examine the response of trade
volumes and prices to tariffs and exchange rates at the same monthly frequency. In addition it is clearly
42The following article describes how infrastructure in Minnesota, North and South Dakota has been builtespecially to ship soybeans to China through ports in the Pacific Northwest, and how simply rerouting soy-beans produced in these regions to other terminals is difficult and expensive. http://www.startribune.com/
trade-war-draws-a-line-between-minnesota-soybean-farmers-and-a-wide-price-gap-appears/495227311/
25

preferrable to compare tariff and exchange rate passthrough studying the same country and time period
than to compare separate coefficients found with different methods and contexts in the literature.
To compare the impact of tariffs to that of exchange rates, we augment equation 4 adding the log
real exchange rate between each destination country and the U.S.43. These data are described in Section
3. Because exchange rate and price data at a monthly frequency are not available from a centralized
source for all destinations (particularly for smaller countries), we focus on the largest 25 markets for
U.S. exports.
Ypdt = β1 · log(1+Tariffpdt) + β2 · log(Real Exchange Rate)dt +γpd + δt + εpdt (14)
The results are shown in Table 12. We report results both including and excluding real exchange rates.
For export values (in column 1), an appreciation of the U.S. dollar has a larger negative impact than
that of tariffs (-0.122 vs. -0.056 elasticities). For quantities (in column 3), however, the impact of real
exchange rates and tariffs is similar. Finally, while tariffs have a small positive impact on unit values
(essentially not too different from zero), dollar appreciations lead to significantly lower prices (-0.037
elasticity), as shown in column 5. A further exploration with more disaggregate firm-level data might
shed more light on these differences.
4.6 Alternative Specifications and Robustness Checks
In this section we report different alternative specifications and robustness checks.
Dynamic Specification We first allow for a dynamic impact of tariffs by including five leads and lags
in 4.
Ypdt =k=5∑k=−5
βk1 · log(1+Tariffpd t+k) +γpd + δt + εpdt (15)
The results are shown graphically in Figure 8. There appears to be little anticipation regarding the
impact of tariffs on export values as the only statistically significant (and much larger) coefficient is the
contemporaneous one. A similar message applies to quantities, although the coefficient on the 1-month
lead is negative and statistically significant. Preliminary lists of products for some of China’s tariff
rounds were released with some anticipation, which could explain this result.
43The real exchange rate here is defined as the price of the dollar in terms of the destination market’s currency divided bythe destination CPI. Because monthly producer price index series are not available for several large trading partners of theU.S., we use consumer price index series instead.
26

Estimation in Differences We also estimate an alternative version of equation 4 in differences, with
12-month changes in export values, quantities or prices on changes in tariffs. This specification follows
Amiti et al. [2019]. We include product and destination × time fixed effects. The results are reported in
Appendix Table 16. The elasticity of export values to tariffs is such that a 10 percentage point higher tar-
iff leads to a 8.5% percent fall in trade in the 2015m1-2019m4 sample or a 11% fall in trade considering
the 2018m1-2019m4 sample.
Accounting For the Extensive Margin The estimated effect of tariffs can be larger when taking into
account products that stop being traded due to tariffs. To account for this we follow Amiti et al. [2019]
and instead of using the log of export values as the dependent variable in equation 4 we use the hyper-
bolic syne, which is defined for zero but otherwise has an interpretation very similar to logs. Expanding
the sample to account for zeros increases the number of observations from 7.7 million to 27.8 million.44
A note of caution is that the U.S. export data has a minimum reporting threshold of $2,500.45 Some
observed zeros might be in fact positive trade flows under that limit. The results are shown in Ap-
pendix Table 17. The elasticity of export values to tariffs is such that a 10 percentage point higher tariff
leads to a 5.0% fall in trade in the 2015m1-2019m4 sample or a 13.1% fall in trade considering the
2018m1-2019m4 sample.
A Nonlinear Impact of Tariffs? We also examine whether the impact of tariffs on export values, quan-
tities and prices is nonlinear. To this end, we estimate an augmented version of equation (4) allowing
the effect of tariffs to vary depending on their magnitude. We allow for different elasticities for tariffs
below 10%, between 10% and 20%, between 20% and 30% and above 30%.
Ypdt = β1 · log(1+Tariffpdt) + β2 · log(1+Tariffpdt)× 1[10 ≤ Tariffpdt < 20]+
β3 · log(1+Tariffpdt)× 1[20 ≤ Tariffpdt < 30] + β4 · log(1+Tariffpdt)× 1[30 ≤ Tariffpdt] +γpd + δtd + εpdt
(16)
Panel A in Table 20 shows the results considering exports to all destinations. There is some extent of
nonlinearities in the effect of tariffs on export values. The estimated coefficients imply that the impact
of a 1 percentage point increase in tariffs leads to a larger decline in trade among smaller tariffs. Specif-
ically, a 1 p.p. increase in tariffs leads to a 0.6% decline in exports for tariffs below a 10% rate, a 0.2%
44We consider all product × destination observations with positive trade flows during the 2015m1-2019m4 period and fillthe panel to include an export value of zero in months when these product × destination pairs do not appear in the data.
45See the data description (https://www.census.gov/foreign-trade/guide/sec2.html) and the note by Baldwin andHarrigan [2011].
27

decline for tariffs in the 10% to 20% range, a similar 0.2% decline for tariffs in the 20% to 30% range,
and a 0.07% fall in exports for tariffs above 30%. Panel B in the same table considers exports to China,
and the pattern is similar. A 1 percentage point increase in tariffs leads to a 2.9% decline in exports for
tariffs below a 10% rate, a 1.3% decline for tariffs in the 10% to 20% range, a 0.9% decline for tariffs in
the 20% to 30% range, and a 0.6% fall in exports for tariffs above 30%.
As mentioned earlier, this nonlinear response of trade flows to tariffs does not explain the difference
in the impact in tariffs between U.S. exports to China and to the rest of the world.
Additional Robustness Checks
Finally, we implement three additional robustness checks. First, the baseline sample consists of total
exports. This excludes re-exports, which are goods temporarily stored in the U.S. Table 18 shows that
the results are almost identical when considering total exports.
Second, the estimation in equation 4 includes product × destination and destination × time fixed
effects. In Table 19 we show the results are robust to i) adding product × time fixed effects and ii)
replacing the destination × time fixed effects for destination ×month × HS 2-digit sector fixed effects.
Last, a small number of HS 10-digit product codes change over time. There is no readily available
concordance for the period studied here. We use the Census Bureau’s “Obsolete codes” documents to
identify all products that change. This changes always occur within HS 4-digit categories. We drop all
HS 4-digit products for which there has been a change in the underlying HS 10-digit codes. We find the
results are nearly identical.
5 Conclusions
This paper has analyzed in depth the impact of the 2018-2019 trade war on U.S. exports. The trade
war has had a negative effect on U.S. exports through three mechanisms: foreign retaliatory tariffs, U.S.
import tariffs, and uncertainty.
The key results are the following. First, foreign tariffs have had a large negative impact on U.S. ex-
port values and quantities, and virtually no impact on tariff-exclusive prices. Second, the elasticity of
trade volumes and prices to tariffs is highly heterogeneous across destinations and sectors. The elastic-
ity of trade values to tariffs is three times larger for exports to China than to the world as a whole. The
response of trade flows to tariffs also varies across industries, being lower among more differentiated
goods and among goods more often traded within firms’ boundaries. Third, supply chains matter. The
import tariffs imposed by the U.S. during the trade have lowered U.S. exports. Fourth, after controlling
for tariffs, there appears to be a large role for uncertainty. Exports to China of durable consumer goods
28

exports have collapsed in comparison to nondurable consumer goods, and this is not the case for ex-
ports towards the rest of the world. In addition, there has been a decline in exports to China of goods
facing higher risks of tariff increases amid the trade war. Fifth, U.S. exports targeted by Chinese tariffs
have only been partially redirected to other destinations. Finally, we establish that tariff passthrough is
essentially different than exchange rate passthrough.
A fruitful avenue for further work is examining the margins of adjustment of individual U.S. export-
ing firms.
29

6 References
M. Amiti and J. Konings. Trade Liberalization, Intermediate Inputs, and Productivity: Evidence from
Indonesia. American Economic Review, 97(5):1611–1638, 2007.
M. Amiti, S. J. Redding, and D. Weinstein. The Impact of the 2018 Trade War on US Prices and
Welfare. Journal of Economic Perspectives, 33(4):187–210, 2019.
S. L. Baier and J. H. Bergstrand. The growth of world trade: tariffs, transport costs, and income
similarity. Journal of international Economics, 53(1):1–27, 2001.
S. R. Baker, N. Bloom, and S. J. Davis. Measuring economic policy uncertainty. The Quarterly Journal of
Economics, 131(4):1593–1636, 2016.
R. Baldwin and J. Harrigan. Zeros, quality, and space: Trade theory and trade evidence. American
Economic Journal: Microeconomics, 3(2):60–88, 2011.
F. Benguria. The Global Impact of the US-China Trade War: Firm-Level Evidence. SSRN Working Paper,
2019a.
F. Benguria. The Negative Impact of the US-China Trade War on Chinese Firms. SSRN Working Paper,
2019b.
E. J. Blanchard, C. P. Bown, and R. C. Johnson. Global value chains and trade policy. Working Paper,
2017.
N. Bloom. The impact of uncertainty shocks. Econometrica, 77(3):623–685, 2009.
C. Bown and M. Kolb. Trump’s Trade War Timeline: An Up-To-Date Guide. May, 2019.
C. Broda, J. Greenfield, and D. Weinstein. From Groundnuts to Globalization: A Structural Estimate of
Trade and Growth. 2006.
A. Burstein and G. Gopinath. International prices and exchange rates. In Handbook of international
economics, volume 4, pages 391–451. Elsevier, 2014.
D. Caldara, M. Iacoviello, P. Molligo, A. Prestipino, and A. Raffo. The economic effects of trade policy
uncertainty. Journal of Monetary Economics, 2019.
L. Caliendo, R. C. Feenstra, J. Romalis, and A. M. Taylor. Tariff Reductions, Entry, and Welfare: Theory
and Evidence for the Last Two Decades. 2015.
30
A. Cavallo, G. Gopinath, B. Neiman, and J. Tang. Tariff passthrough at the border and at the store:
Evidence from us trade policy. NBER Working Paper #26396, 2019.
S. J. Davis. An index of global economic policy uncertainty. 2016.
S. J. Davis, D. Liu, and X. S. Sheng. Economic policy uncertainty in china since 1946: The view from
mainland newspapers. 2019.
F. J. Dıez. The asymmetric effects of tariffs on intra-firm trade and offshoring decisions. Journal of
International Economics, 93(1):76–91, 2014.
R. Dix-Carneiro and B. K. Kovak. Trade Liberalization and Regional Dynamics. American Economic
Review, 107(10):2908–46, 2017.
A. Estevadeordal and A. M. Taylor. Is the Washington Consensus Dead? Growth, Openness, and the
Great Liberalization, 1970s–2000s. The Review of Economics and Statistics, 95(5):1669–1690, 2013.
P. D. Fajgelbaum, P. K. Goldberg, P. J. Kennedy, and A. K. Khandelwal. The Return to Protectionism.
Quarterly Journal of Economics, forthcoming, 2019.
A. B. Flaaen, A. Hortacsu, and F. Tintelnot. The Production Relocation and Price Effects of US Trade
Policy: The Case of Washing Machines. NBER Working Paper #25767, 2019.
P. K. Goldberg and N. Pavcnik. The effects of trade policy. In Handbook of commercial policy, volume 1,
pages 161–206. Elsevier, 2016.
P. K. Goldberg, M. M. Knetter, et al. Goods prices and exchange rates: What have we learned? Journal
of Economic Literature, 35(3):1243–1272, 1997.
P. K. Goldberg, A. K. Khandelwal, N. Pavcnik, and P. Topalova. Imported Intermediate Inputs and
Domestic Product Growth: Evidence from India. The Quarterly Journal of Economics, 125(4):
1727–1767, 2010.
A. Graziano, K. Handley, and N. Limao. Brexit uncertainty and trade disintegration. 2018.
K. Handley and N. Limao. Policy uncertainty, trade, and welfare: Theory and evidence for china and
the united states. American Economic Review, 107(9):2731–83, 2017.
J. Harrigan, X. Ma, and V. Shlychkov. Export prices of us firms. Journal of International Economics, 97
(1):100–111, 2015.
31

Y. Huang, C. Lin, S. Liu, and H. Tang. Trade Linkages and Firm Value: Evidence from the 2018
US-China Trade War. SSRN Working Paper, 2018.
IMF. World Economic Outlook. April, 2019.
A. A. Levchenko, L. T. Lewis, and L. L. Tesar. The” collapse in quality” hypothesis. American Economic
Review, 101(3):293–97, 2011.
M. Li. CARD Trade War Tariffs Database. 2018.
D. Novy and A. M. Taylor. Trade and Uncertainty. The Review of Economics and Statistics, forthcoming,
2019.
R. Ossa. Trade Wars and Trade Talks with Data. American Economic Review, 104(12):4104–46, 2014.
J. R. Pierce and P. K. Schott. The surprisingly swift decline of us manufacturing employment. American
Economic Review, 106(7):1632–62, 2016.
A. K. Rose. Do we really know that the wto increases trade? American Economic Review, 94(1):98–114,
2004.
A. C. Spearot. Variable demand elasticities and tariff liberalization. Journal of International Economics,
89(1):26–41, 2013.
P. Topalova and A. Khandelwal. Trade liberalization and firm productivity: The case of india. Review of
economics and statistics, 93(3):995–1009, 2011.
32

Figure 1: Average Chinese Tariff on U.S. Exports
510
1520
Ave
rage
Tar
iff
2017m1 2017m7 2018m1 2018m7 2019m1Month
Notes: This figure plots the average Chinese tariff on imports from the U.S. Weights are based on 2017U.S. exports to China.
33
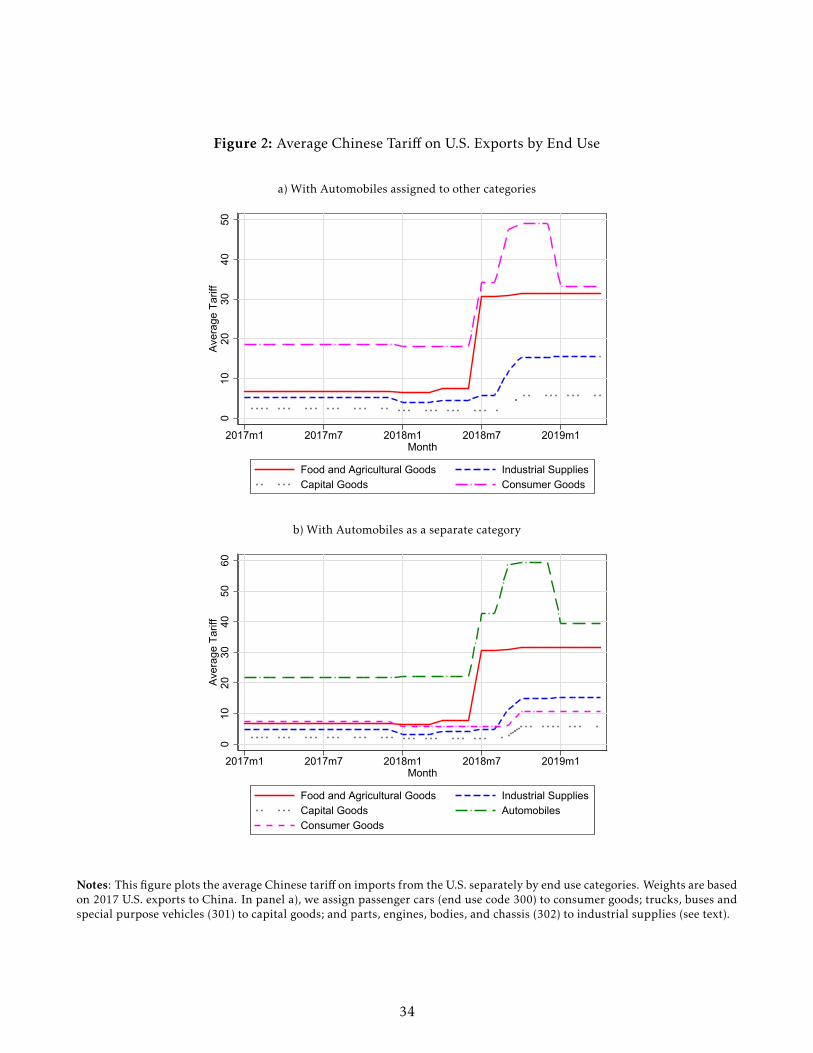
Figure 2: Average Chinese Tariff on U.S. Exports by End Use
a) With Automobiles assigned to other categories
010
2030
4050
Ave
rage
Tar
iff
2017m1 2017m7 2018m1 2018m7 2019m1Month
Food and Agricultural Goods Industrial SuppliesCapital Goods Consumer Goods
b) With Automobiles as a separate category
010
2030
4050
60A
vera
ge T
ariff
2017m1 2017m7 2018m1 2018m7 2019m1Month
Food and Agricultural Goods Industrial SuppliesCapital Goods AutomobilesConsumer Goods
Notes: This figure plots the average Chinese tariff on imports from the U.S. separately by end use categories. Weights are basedon 2017 U.S. exports to China. In panel a), we assign passenger cars (end use code 300) to consumer goods; trucks, buses andspecial purpose vehicles (301) to capital goods; and parts, engines, bodies, and chassis (302) to industrial supplies (see text).
34

Figure 3: Average Tariff on U.S. Exports by Destination
a) Canada
2.2
2.4
2.6
2.8
33.
2A
vera
ge T
ariff
2017m1 2017m7 2018m1 2018m7 2019m1Month
b) European Union
1.8
22.
22.
4A
vera
ge T
ariff
2017m1 2017m7 2018m1 2018m7 2019m1Month
c) Mexico
44.
24.
44.
6A
vera
ge T
ariff
2017m1 2017m7 2018m1 2018m7 2019m1Month
d) World Excl. China
3.5
44.
5A
vera
ge T
ariff
2017m1 2017m7 2018m1 2018m7 2019m1Month
Notes: This figure plots U.S. exports to China and to the rest of the world in the first quarter of each year from 2015 to 2019.All series are normalized to 1 in 2015Q1.
35

Figure 4: Exports to China and to the Rest of the World
a) First Quarter of Each Year
.8.9
11.
1E
xpor
ts (2
015q
1 =
1)
2015q1 2016q1 2017q1 2018q1 2019q1Quarter
Exports to ROW Exports to China
b) Monthly
.6.8
11.
21.
4E
xpor
ts (2
015m
1 =
1)
2015m1 2016m1 2017m1 2018m1 2019m1Month
Exports to ROW Exports to China
Notes: This figure plots U.S. exports to China and to the rest of the world. Panel a) plots the first quarter of each year from2015 to 2019. Panel b) plots monthly data. In both cases, exports to China and to the rest of the world are normalized to 1 in2015Q1.
36

Figure 5: Number of Products Exported to China and to the Rest of the World
.98
.99
11.
011.
021.
03N
umbe
r of H
S10
pro
duct
s (2
015q
1 =
1)
2015q1 2016q1 2017q1 2018q1 2019q1Quarter
Exports to ROW Exports to China
Notes: This figure plots the number of HS 10-digit products exported by the U.S. to China and to therest of the world in the first quarter of each year from 2015 to 2019. Both series are normalized to 1 in2015Q1.
37

Figure 6: Exports to China and to the Rest of the World by End Use Category
a) Food and Agricultural
.5.6
.7.8
.91
1.1
1.2
1.3
1.4
Exp
orts
(201
5q1
= 1)
2015q1 2016q1 2017q1 2018q1 2019q1Quarter
Exports to ROW Exports to China
b) Industrial Supplies
.5.6
.7.8
.91
1.1
1.2
1.3
1.4
Exp
orts
(201
5q1
= 1)
2015q1 2016q1 2017q1 2018q1 2019q1Quarter
Exports to ROW Exports to China
c) Capital Goods
.5.6
.7.8
.91
1.1
1.2
1.3
1.4
Exp
orts
(201
5q1
= 1)
2015q1 2016q1 2017q1 2018q1 2019q1Quarter
Exports to ROW Exports to China
d) Consumer Goods
.5.6
.7.8
.91
1.1
1.2
1.3
1.4
Exp
orts
(201
5q1
= 1)
2015q1 2016q1 2017q1 2018q1 2019q1Quarter
Exports to ROW Exports to China
Notes: This figure plots U.S. exports to China and to the rest of the world in the first quarter of each year from 2015 to 2019.All series are normalized to 1 in 2015Q1.
38

Figure 7: Trade Policy Uncertainty Indexes - U.S. and China
010
2030
4050
Trad
e P
olic
y U
ncer
tain
ty In
dex
(201
5m1
= 1)
2015m1 2016m1 2017m1 2018m1 2019m1Month
U.S. China
Notes: This figure plots trade policy uncertainty indexes for te U.S. and China normalized to 1 in Jan-uary 2015.
39
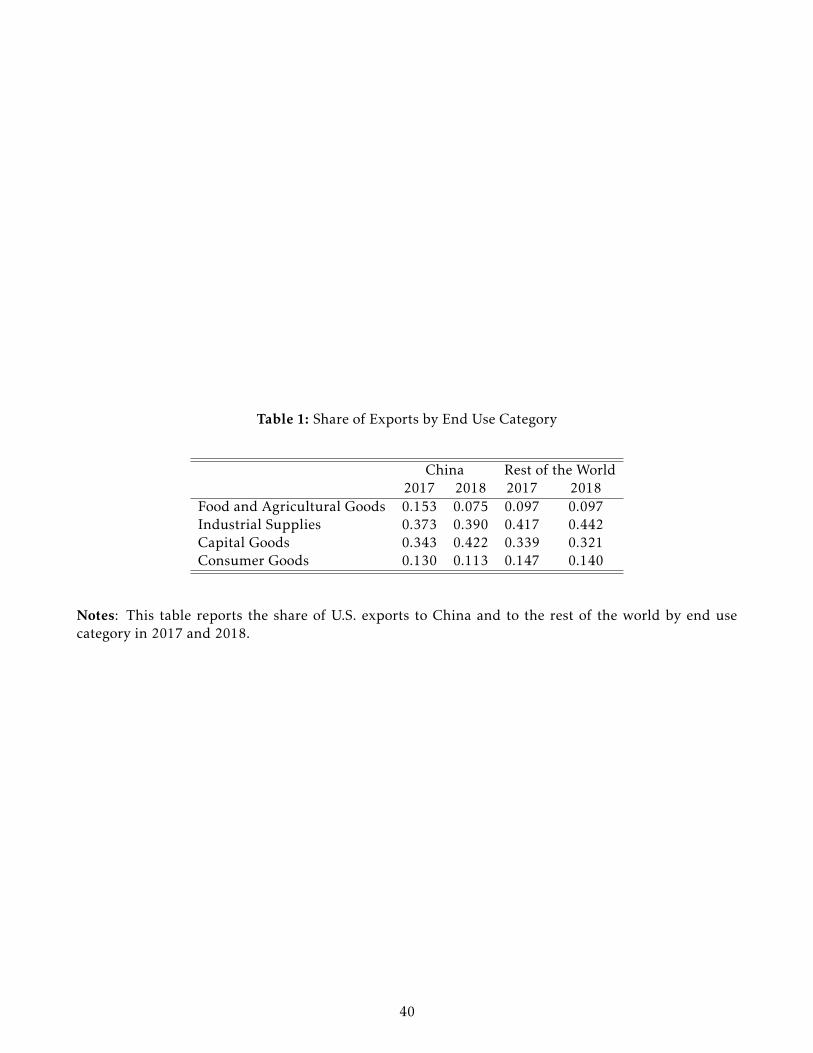
Table 1: Share of Exports by End Use Category
China Rest of the World2017 2018 2017 2018
Food and Agricultural Goods 0.153 0.075 0.097 0.097Industrial Supplies 0.373 0.390 0.417 0.442Capital Goods 0.343 0.422 0.339 0.321Consumer Goods 0.130 0.113 0.147 0.140
Notes: This table reports the share of U.S. exports to China and to the rest of the world by end usecategory in 2017 and 2018.
40

Table 2: Summary Statistics
Mean SD p10 p25 p50 p75 p90
Panel A: Share of Related Party TradeChina 0.229 0.175 0.016 0.093 0.203 0.316 0.446Rest of the World 0.164 0.202 0.000 0.011 0.081 0.248 0.465
Panel B: Elasticity of SubstitutionChina 5.950 9.605 1.980 2.742 3.386 5.003 7.645Rest of the World 6.970 78.871 1.975 2.527 3.521 5.003 8.389
Notes: Panel A reports summary statistics for the share of related party trade and the elasticity ofsubstitution variables described in Section 3. These statistics are computed across HS 10-digit productsand destinations using 2017 data and reported separately for China and for the rest of the world.
41
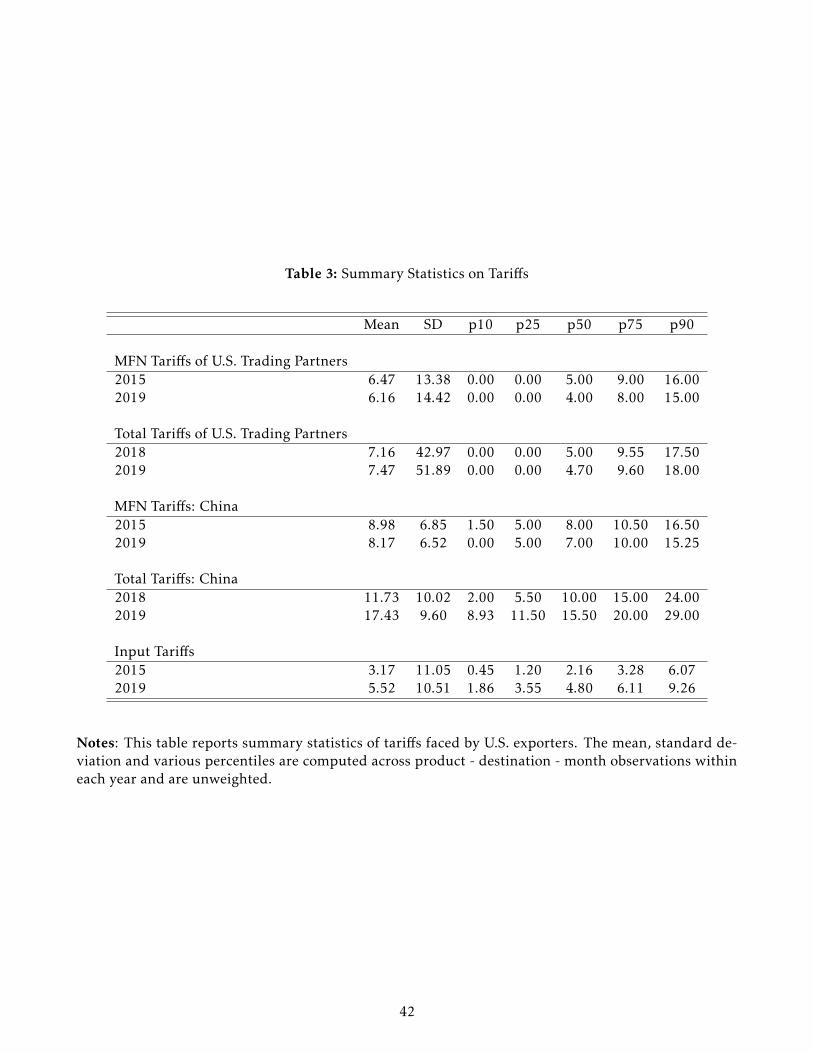
Table 3: Summary Statistics on Tariffs
Mean SD p10 p25 p50 p75 p90
MFN Tariffs of U.S. Trading Partners2015 6.47 13.38 0.00 0.00 5.00 9.00 16.002019 6.16 14.42 0.00 0.00 4.00 8.00 15.00
Total Tariffs of U.S. Trading Partners2018 7.16 42.97 0.00 0.00 5.00 9.55 17.502019 7.47 51.89 0.00 0.00 4.70 9.60 18.00
MFN Tariffs: China2015 8.98 6.85 1.50 5.00 8.00 10.50 16.502019 8.17 6.52 0.00 5.00 7.00 10.00 15.25
Total Tariffs: China2018 11.73 10.02 2.00 5.50 10.00 15.00 24.002019 17.43 9.60 8.93 11.50 15.50 20.00 29.00
Input Tariffs2015 3.17 11.05 0.45 1.20 2.16 3.28 6.072019 5.52 10.51 1.86 3.55 4.80 6.11 9.26
Notes: This table reports summary statistics of tariffs faced by U.S. exporters. The mean, standard de-viation and various percentiles are computed across product - destination - month observations withineach year and are unweighted.
42

Table 4: The Impact of Foreign Tariffs on U.S. Exports to the World
(1) (2) (3) (4) (5) (6)
Jan. 2015 - Apr. 2019 Jan. 2018 - Apr. 2019
Value Quantity Unit Value Value Quantity Unit Value
log(1+Tariff) -0.036∗∗∗ -0.048∗∗∗ 0.006 -0.080∗∗∗ -0.092∗∗∗ 0.007(0.005) (0.009) (0.005) (0.010) (0.014) (0.006)
Observations 7743472 6079454 6079454 2306974 1839986 1839986
Standard errors in parentheses∗ p < 0.10, ∗∗ p < 0.05, ∗∗∗ p < 0.01
Notes: This table reports the estimation of equation (4). Columns 1-3 are based on the 2015m1-2019m4sample. Columns 4-6 are based on the 2018m1-2019m4 sample. The dependent variable is (log) ex-ported value (columns 1 and 4), (log) exported quantity (columns 2 and 5) or (log) unit value (columns3 and 6). Each observation corresponds to a product (HS10)-destination-time combination. All columnsinclude product × destination and time × destination fixed effects. Standard errors are clustered at theHS 6-digit level.
43

Table 5: The Impact of Foreign Tariffs on U.S. Exports to China, Canada, the European Union andMexico
(1) (2) (3)Value Quantity Unit Value
Panel A: Exports to China
log(1+Tariff) -0.170∗∗∗ -0.174∗∗∗ -0.015(0.030) (0.042) (0.014)
Observations 217601 181773 181773
Panel B: Exports to the European Union
log(1+Tariff) -0.036∗∗∗ -0.064∗∗∗ 0.022∗∗
(0.011) (0.017) (0.010)Observations 1743296 1323215 1323215
Panel C: Exports to Canada
log(1+Tariff) -0.147∗∗∗ -0.172∗∗∗ 0.024∗∗∗
(0.013) (0.016) (0.006)Observations 305022 264800 264800
Panel D: Exports to Mexico
log(1+Tariff) -0.009 -0.031∗ 0.024∗∗∗
(0.016) (0.017) (0.007)Observations 314865 273216 273216
Standard errors in parentheses∗ p < 0.10, ∗∗ p < 0.05, ∗∗∗ p < 0.01
Notes: Panels A, B, C and D report the estimation of equation (4) separately for exports to China, theEuropean Union, Canada, and Mexico based on the 2015m1-2019m4 sample. The dependent variable is(log) exported value (column 1), (log) exported quantity (column 2) or (log) unit value (column 3). Eachobservation corresponds to a product (HS10)-time combination. All columns include product and timefixed effects. Standard errors are clustered at the HS 6-digit level.
44

Table 6: The Impact of Chinese Tariffs on U.S. Exports by End Use Category
(1) (2) (3) (4)Food and Agricultural Goods Industrial Supplies Capital Goods Consumer Goods
Panel A: Values
log(1+Tariff) -0.315∗∗∗ -0.347∗∗∗ -0.066∗∗∗ -0.201∗∗∗
(0.077) (0.073) (0.022) (0.047)Observations 17100 95147 71145 34554
Panel B: Quantities
log(1+Tariff) -0.288∗∗∗ -0.387∗∗∗ 0.008 -0.275∗∗∗
(0.076) (0.079) (0.041) (0.095)Observations 17045 89702 49442 26185
Panel C: Unit Values
log(1+Tariff) -0.028 0.017 -0.062∗∗ 0.083(0.026) (0.020) (0.030) (0.057)
Observations 17045 89702 49442 26185
Standard errors in parentheses∗ p < 0.10, ∗∗ p < 0.05, ∗∗∗ p < 0.01
Notes: This table reports the estimation of equation (4) separately by end use categories. The dependentvariable is (log) exported value (Panel A), (log) exported quantity (Panel B) or (log) unit value (Panel C).Each observation corresponds to a product (HS10)-time combination. All columns include product andtime fixed effects. Standard errors are clustered at the HS 6-digit level.
45

Table 7: Determinants of the Impact of Chinese Tariffs on U.S. Exports
(1) (2) (3)
Panel A: Values
log(1+Tariff) -0.230∗∗∗ -0.127∗∗∗ -0.175∗∗∗
(0.043) (0.025) (0.035)log(1+Tariff) × Share Rel. Party Trade 0.214∗∗ 0.172∗∗
(0.090) (0.081)log(1+Tariff) × log Elast. of Subst. -0.045∗∗ -0.036∗
(0.022) (0.021)Observations 217720 217086 216854
Panel B: Quantities
log(1+Tariff) -0.239∗∗∗ -0.093∗∗ -0.134∗∗∗
(0.056) (0.043) (0.050)log(1+Tariff) × Share Rel. Party Trade 0.224∗ 0.154
(0.121) (0.105)log(1+Tariff) × log Elast. of Subst. -0.076∗∗ -0.069∗∗
(0.032) (0.030)Observations 182175 181912 181707
Panel C: Unit Values
log(1+Tariff) -0.012 -0.057∗∗ -0.061∗∗
(0.017) (0.025) (0.026)log(1+Tariff) × Share Rel. Party Trade -0.018 0.014
(0.067) (0.063)log(1+Tariff) × log Elast. of Subst. 0.032∗∗ 0.032∗∗
(0.013) (0.013)Observations 182175 181912 181707
Standard errors in parentheses∗ p < 0.10, ∗∗ p < 0.05, ∗∗∗ p < 0.01
Notes: This table reports the estimation of equation (5) for U.S. exports to China. The dependent vari-able is (log) exported value (in panel A), (log) exported quantity (in panel B) and log unit value (in panelC). Each observation corresponds to a product (HS10)-time combination. All columns include productand time fixed effects. Standard errors are clustered at the HS 6-digit level.
46

Table 8: The Role of Input Tariffs
(1) (2) (3) (4) (5)All Food and Agricultural Goods Industrial Supplies Capital Goods Consumer Goods
Panel A: Value
log(1+Tariff) -0.033∗∗∗ -0.049∗∗∗ -0.050∗∗∗ -0.009 -0.029∗
(0.005) (0.014) (0.008) (0.008) (0.015)log(1+ U.S. Input Tariff) -0.010∗ -0.098 -0.014 0.000 -0.031∗∗
(0.006) (0.078) (0.011) (0.010) (0.015)Observations 7590378 628558 2625465 2862194 1423476
Panel B: Quantity
log(1+Tariff) -0.042∗∗∗ -0.050∗∗∗ -0.070∗∗∗ -0.003 -0.014(0.008) (0.017) (0.011) (0.016) (0.025)
log(1+ U.S. Input Tariff) -0.008 -0.122 -0.068∗∗ -0.011 -0.050∗∗
(0.011) (0.079) (0.027) (0.023) (0.023)Observations 5943882 627747 2386687 1833874 1064824
Panel C: Unit Value
log(1+Tariff) 0.006 0.001 0.016∗∗∗ -0.010 0.000(0.005) (0.006) (0.006) (0.010) (0.011)
log(1+ U.S. Input Tariff) -0.005 0.025 0.054∗∗ -0.002 0.009(0.007) (0.029) (0.027) (0.015) (0.012)
Observations 5943882 627747 2386687 1833874 1064824
Standard errors in parentheses∗ p < 0.10, ∗∗ p < 0.05, ∗∗∗ p < 0.01
Notes: This table reports the estimation of equation (7) for exports to all destinations. Column 1 con-siders exports in all industries, and columns 2-5 separates them by end use categories. The dependentvariable is (log) exported value (panel A), (log) exported quantity (panel B) or (log) unit value (panelC). Each observation corresponds to a product (HS10)-destination-time combination. All columns in-clude product × destination and time × destination fixed effects. Standard errors are clustered at the HS6-digit level.
47

Table 9: Trade Policy Uncertainty and the Collapse in U.S. Exports of Durable Consumer Goods toChina
(1) (2) (3)Value Quantity Unit Value
Panel A: Exports to China
log(1+Tariff) -0.191∗∗∗ -0.258∗∗∗ 0.080(0.047) (0.094) (0.057)
1[Durables] × 1[Trade War] -0.161∗∗∗ -0.275∗∗∗ 0.047(0.052) (0.079) (0.045)
Observations 34554 26185 26185
Panel B: Exports to China
log(1+Tariff) -0.192∗∗∗ -0.267∗∗∗ 0.080(0.047) (0.095) (0.056)
1[Durables] × log(TPU China) -0.059∗∗∗ -0.095∗∗∗ 0.027(0.019) (0.029) (0.017)
Observations 34554 26185 26185
Panel C: Exports to the World
log(1+Tariff) -0.027∗ -0.012 -0.002(0.015) (0.024) (0.011)
log(1+Tariff) × 1[China] -0.164∗∗∗ -0.247∗∗ 0.082(0.049) (0.097) (0.058)
1[Durables] × 1[Trade War] -0.012 -0.045∗∗∗ 0.021∗
(0.011) (0.017) (0.011)1[Durables] × 1[Trade War] × 1[China] -0.150∗∗∗ -0.230∗∗∗ 0.027
(0.052) (0.079) (0.046)Observations 1458727 1086107 1086107
Panel D: Exports to the World
log(1+Tariff) -0.027∗ -0.013 -0.001(0.015) (0.024) (0.011)
log(1+Tariff) × 1[China] -0.167∗∗∗ -0.256∗∗∗ 0.082(0.050) (0.098) (0.057)
1[Durables] × log(TPU) -0.003 -0.024∗∗∗ 0.016∗∗∗
(0.005) (0.009) (0.006)1[Durables] × 1[China] × log(TPU) -0.051∗∗ -0.062∗∗ 0.012
(0.021) (0.031) (0.017)Observations 1458727 1086107 1086107
Standard errors in parentheses∗ p < 0.10, ∗∗ p < 0.05, ∗∗∗ p < 0.01
Notes: Panel A reports the estimation of equation (8) for exports to China. Panel B reports the estimation of equation (9) for
exports to China. Panel C reports the estimation of equation (10) for exports to all destinations. Panel D reports the estimation
of equation (11) for exports to all destinations. The dependent variable is (log) exported value (column 1), (log) exported
quantity (column 2) or (log) unit value (column 3). In panels A and B, each observation corresponds to a product (HS10)-time
combination and all columns include product and time fixed effects. In panels C and D, each observation corresponds to
a product (HS10)-destination-time combination and all columns include product × destination and time × destination fixed
effects. Standard errors are clustered at the HS 6-digit level.48

Table 10: Trade Policy Uncertainty: The Impact of Trade War Tariff Risk.
(1) (2) (3)Value Quantity Unit Value
log(1+Tariff) -0.053∗∗∗ -0.071∗∗∗ 0.014∗∗∗
(0.008) (0.012) (0.006)log(1+Tariff) × 1[China] -0.111∗∗∗ -0.112∗∗ -0.021
(0.032) (0.045) (0.016)1[High TWTR] × 1[Trade War] 0.003 -0.001 0.001
(0.004) (0.006) (0.004)1[High TWTR] × 1[Trade War] × 1[China] -0.054∗∗ -0.026 -0.044∗∗
(0.023) (0.035) (0.021)Observations 3878550 3026470 3026470
Standard errors in parentheses∗ p < 0.10, ∗∗ p < 0.05, ∗∗∗ p < 0.01
Notes: This table reports the estimation of equation (12). The dependent variable is (log) exported value(column 1), (log) exported quantity (column 2) or (log) unit value (column 3). Each observation corre-sponds to a product (HS10)-destination-time combination. All columns include product × destinationand time × destination fixed effects. Standard errors are clustered at the HS 6-digit level.
49
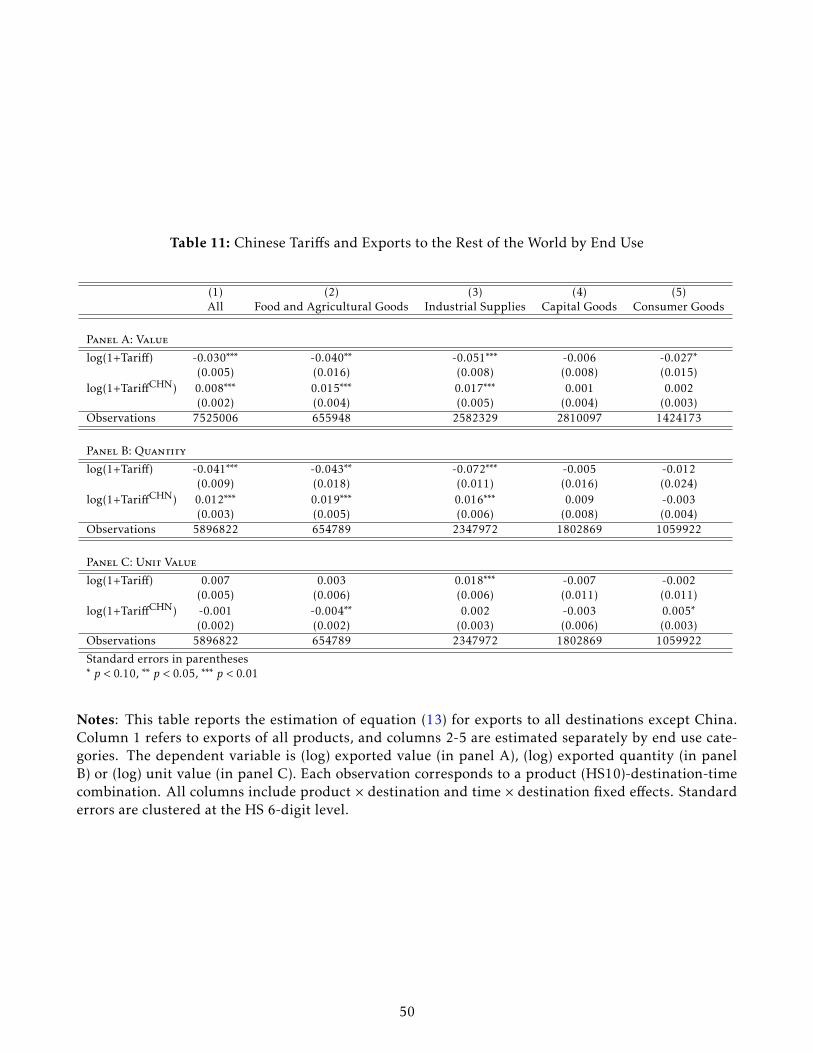
Table 11: Chinese Tariffs and Exports to the Rest of the World by End Use
(1) (2) (3) (4) (5)All Food and Agricultural Goods Industrial Supplies Capital Goods Consumer Goods
Panel A: Value
log(1+Tariff) -0.030∗∗∗ -0.040∗∗ -0.051∗∗∗ -0.006 -0.027∗
(0.005) (0.016) (0.008) (0.008) (0.015)log(1+TariffCHN) 0.008∗∗∗ 0.015∗∗∗ 0.017∗∗∗ 0.001 0.002
(0.002) (0.004) (0.005) (0.004) (0.003)Observations 7525006 655948 2582329 2810097 1424173
Panel B: Quantity
log(1+Tariff) -0.041∗∗∗ -0.043∗∗ -0.072∗∗∗ -0.005 -0.012(0.009) (0.018) (0.011) (0.016) (0.024)
log(1+TariffCHN) 0.012∗∗∗ 0.019∗∗∗ 0.016∗∗∗ 0.009 -0.003(0.003) (0.005) (0.006) (0.008) (0.004)
Observations 5896822 654789 2347972 1802869 1059922
Panel C: Unit Value
log(1+Tariff) 0.007 0.003 0.018∗∗∗ -0.007 -0.002(0.005) (0.006) (0.006) (0.011) (0.011)
log(1+TariffCHN) -0.001 -0.004∗∗ 0.002 -0.003 0.005∗
(0.002) (0.002) (0.003) (0.006) (0.003)Observations 5896822 654789 2347972 1802869 1059922
Standard errors in parentheses∗ p < 0.10, ∗∗ p < 0.05, ∗∗∗ p < 0.01
Notes: This table reports the estimation of equation (13) for exports to all destinations except China.Column 1 refers to exports of all products, and columns 2-5 are estimated separately by end use cate-gories. The dependent variable is (log) exported value (in panel A), (log) exported quantity (in panelB) or (log) unit value (in panel C). Each observation corresponds to a product (HS10)-destination-timecombination. All columns include product × destination and time × destination fixed effects. Standarderrors are clustered at the HS 6-digit level.
50

Table 12: Tariffs and Exchange Rates
(1) (2) (3) (4) (5) (6)Value Value Quantity Quantity Unit Value Unit Value
log(1+Tariff) -0.056∗∗∗ -0.055∗∗∗ -0.076∗∗∗ -0.075∗∗∗ 0.016∗∗∗ 0.015∗∗∗
(0.007) (0.007) (0.010) (0.010) (0.005) (0.005)log real exchange rate -0.122∗∗∗ -0.082∗∗ -0.037∗
(0.024) (0.035) (0.021)Observations 3076440 3945654 2514216 3213703 2514216 3213703
Standard errors in parentheses∗ p < 0.10, ∗∗ p < 0.05, ∗∗∗ p < 0.01
Notes: This table reports the estimation of equation (14). The sample is restricted to the 25 largestdestinations of U.S. exports. The dependent variable is (log) exported value (columns 1 and 2), (log)exported quantity (columns 3 and 4) or (log) unit value (columns 5 and 6). Each observation correspondsto a product (HS10)-destination-time combination. All columns include product × destination and timefixed effects. Standard errors are clustered at the HS 6-digit level.
51

7 Appendix
52

Figure 8: The Impact of Foreign Tariffs on U.S. Exports to the World
a) Export Values
-.1-.0
50
.05
-5 -4 -3 -2 -1 0 1 2 3 4 5Month
b) Export Quantities
-.1-.0
50
.05
.1
-5 -4 -3 -2 -1 0 1 2 3 4 5Month
b) Export Prices
-.1-.0
50
.05
-5 -4 -3 -2 -1 0 1 2 3 4 5Month
Notes: This figure plots the coefficients and confidence intervals obtained from the estimation of equa-tion 15.
53

Table 13: The Impact of Chinese Tariffs on U.S. Exports by End Use Category
(1) (2) (3)Value Quantity Unit Value
log(1+Tariff) -0.285∗∗∗ -0.277∗∗∗ -0.022(0.050) (0.057) (0.026)
1[Industrial Supplies]× log(1+Tariff) -0.028 -0.103 0.071∗∗
(0.060) (0.069) (0.030)1[Capital Goods] × log(1+Tariff) 0.169∗∗∗ 0.223∗∗∗ -0.035
(0.049) (0.058) (0.030)1[Consumer Goods] × log(1+Tariff) 0.121∗∗ 0.139∗ -0.000
(0.055) (0.077) (0.042)Observations 217952 182380 182380
Standard errors in parentheses∗ p < 0.10, ∗∗ p < 0.05, ∗∗∗ p < 0.01
Notes: This table reports the estimation of the following variant of equation (4):
Ypdt = β1 · log(1+Tariffpdt) + β2 · log(1+Tariffpdt) · 1[Industrial Supplies]+
β3 · log(1+Tariffpdt) · 1[Capital Goods] + β4 · log(1+Tariffpdt) · 1[Consumer Goods]+
γpd + δtd + εpdt(17)
The dependent variable is (log) exported value (columns 1 and 4), (log) exported quantity (columns 2and 5) or (log) unit value (columns 3 and 6). Each observation corresponds to a product (HS10)-timecombination. All columns include product and time fixed effects. Standard errors are clustered at theHS 6-digit level.
54

Table 14: Trade Policy Uncertainty, Economic Uncertainty, and the Collapse in U.S. Exports of DurableConsumer Goods to China
(1) (2) (3)Value Quantity Unit Value
log(1+Tariff) -0.027∗ -0.013 -0.001(0.015) (0.024) (0.011)
log(1+Tariff) × 1[China] -0.165∗∗∗ -0.252∗∗∗ 0.083(0.050) (0.097) (0.057)
1[Durables] × log(TPU) -0.002 -0.024∗∗∗ 0.014∗∗∗
(0.005) (0.008) (0.005)1[Durables] × 1[China] × log(TPU) -0.047∗∗ -0.061∗ 0.008
(0.022) (0.036) (0.021)1[Durables] × log(EPU -0.003 -0.002 0.007
(0.009) (0.016) (0.011)1[Durables] × 1[China] × log(EPU) -0.027 -0.017 0.014
(0.055) (0.101) (0.065)1[Durables] × log(VIX) -0.001 -0.007 -0.005
(0.012) (0.019) (0.013)1[Durables] × 1[China] × log(VIX) -0.023 -0.047 -0.028
(0.061) (0.103) (0.065)Observations 1458727 1086107 1086107
Standard errors in parentheses∗ p < 0.10, ∗∗ p < 0.05, ∗∗∗ p < 0.01
Notes: This table reports the estimation of the following variant of equation (11) for exports to alldestinations.
Ypdt = β1 · log(1+Tariffpdt) + β2 · log(1+Tariffpdt)× 1[Chinad]
β3 ·Trade Policy Uncertaintyt × 1[Durablep] + β4 ·Trade Policy Uncertaintyt × 1[Durablep]× 1[Chinad]+
β5 ·Ec. Policy Uncertaintyt × 1[Durablep] + β6 ·Ec. Policy Uncertaintyt × 1[Durablep]× 1[Chinad]+
β7 ·VIXt × 1[Durablep] + β8 ·VIXt × 1[Durablep]× 1[Chinad] +γpd + δtd + εpdt(18)
The trade policy uncertainty measure is the index developed by Baker et al. [2016] (in logs). Thismeasures U.S. trade policy uncertainty, as a proxy for global trade policy uncertainty. The economicpolicy uncertainty measure is the index developed by Davis [2016] (in logs). The VIX index (also in logs)is used as a measure of economic uncertainty. The dependent variable is (log) exported value (column1), (log) exported quantity (column 2) or (log) unit value (column 3). Each observation corresponds toa product (HS10)-destination-time combination. All columns include product × destination and time ×destination fixed effects. Standard errors are clustered at the HS 6-digit level.
55
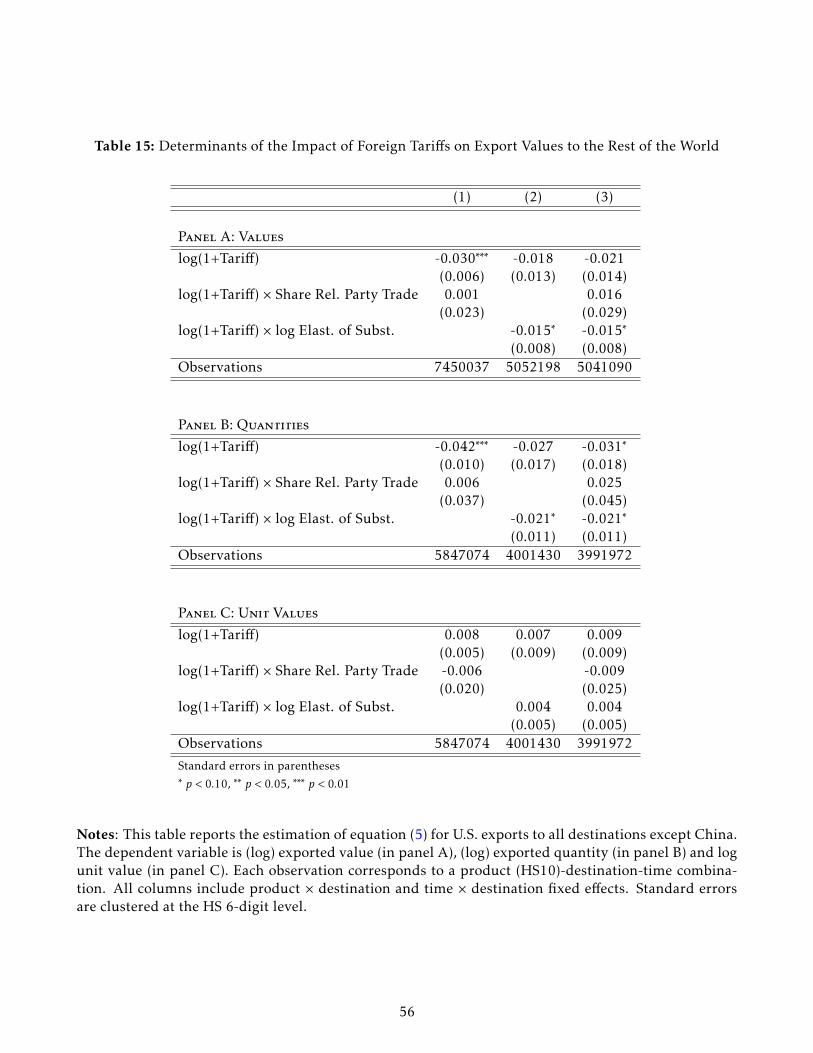
Table 15: Determinants of the Impact of Foreign Tariffs on Export Values to the Rest of the World
(1) (2) (3)
Panel A: Values
log(1+Tariff) -0.030∗∗∗ -0.018 -0.021(0.006) (0.013) (0.014)
log(1+Tariff) × Share Rel. Party Trade 0.001 0.016(0.023) (0.029)
log(1+Tariff) × log Elast. of Subst. -0.015∗ -0.015∗
(0.008) (0.008)Observations 7450037 5052198 5041090
Panel B: Quantities
log(1+Tariff) -0.042∗∗∗ -0.027 -0.031∗
(0.010) (0.017) (0.018)log(1+Tariff) × Share Rel. Party Trade 0.006 0.025
(0.037) (0.045)log(1+Tariff) × log Elast. of Subst. -0.021∗ -0.021∗
(0.011) (0.011)Observations 5847074 4001430 3991972
Panel C: Unit Values
log(1+Tariff) 0.008 0.007 0.009(0.005) (0.009) (0.009)
log(1+Tariff) × Share Rel. Party Trade -0.006 -0.009(0.020) (0.025)
log(1+Tariff) × log Elast. of Subst. 0.004 0.004(0.005) (0.005)
Observations 5847074 4001430 3991972
Standard errors in parentheses∗ p < 0.10, ∗∗ p < 0.05, ∗∗∗ p < 0.01
Notes: This table reports the estimation of equation (5) for U.S. exports to all destinations except China.The dependent variable is (log) exported value (in panel A), (log) exported quantity (in panel B) and logunit value (in panel C). Each observation corresponds to a product (HS10)-destination-time combina-tion. All columns include product × destination and time × destination fixed effects. Standard errorsare clustered at the HS 6-digit level.
56

Table 16: The Impact of Foreign Tariffs on U.S. Exports to the World: Estimation in Differences
(1) (2) (3) (4) (5) (6)
Jan. 2015 - Apr. 2019 Jan. 2018 - Apr. 2019
Value Quantity Unit Value Value Quantity Unit Value∆ log(1+Tariff) -0.061∗∗∗ -0.067∗∗∗ 0.003 -0.086∗∗∗ -0.100∗∗∗ 0.004
(0.007) (0.011) (0.005) (0.011) (0.015) (0.007)Observations 3988258 3032293 3032293 1596926 1216770 1216770
Standard errors in parentheses∗ p < 0.10, ∗∗ p < 0.05, ∗∗∗ p < 0.01
Notes: This table reports the estimation of a variant of equation (4) in differences and including product× destination and time fixed effects:
∆Ypdt = β1 ·∆log(1+Tariffpdt) +γpd + δt + εpdt (19)
Columns 1-3 are based on the 2015m1-2019m4 sample. Columns 4-6 are based on the 2018m1-2019m4sample. The dependent variable is (log) exported value (columns 1 and 4), (log) exported quantity(columns 2 and 5) or (log) unit value (columns 3 and 6). Each observation corresponds to a product(HS10)-destination-time combination. Standard errors are clustered at the HS 6-digit level.
57

Table 17: The Impact of Foreign Tariffs on U.S. Exports to the World: Accounting for the ExtensiveMargin
(1) (2)
Jan. 2015 - Apr. 2019 Jan. 2018 - Apr. 2019
Value Valuelog(1+Tariff) -0.039∗∗∗ -0.108∗∗∗
(0.008) (0.022)Observations 27845104 8645884
Standard errors in parentheses∗ p < 0.10, ∗∗ p < 0.05, ∗∗∗ p < 0.01
Notes: This table reports the estimation of equation (4) for exports to all destinations with the hyper-bolic sine of export values as the dependent variable. The sample includes both positive and zero tradeflows. Column 1 is based on the 2015m1-2019m4 sample. Column 2 is based on the 2018m1-2019m4sample. Each observation corresponds to a product (HS10)-destination-time combination. All columnsinclude product × destination and time × destination fixed effects. Standard errors are clustered at theHS 6-digit level.
58
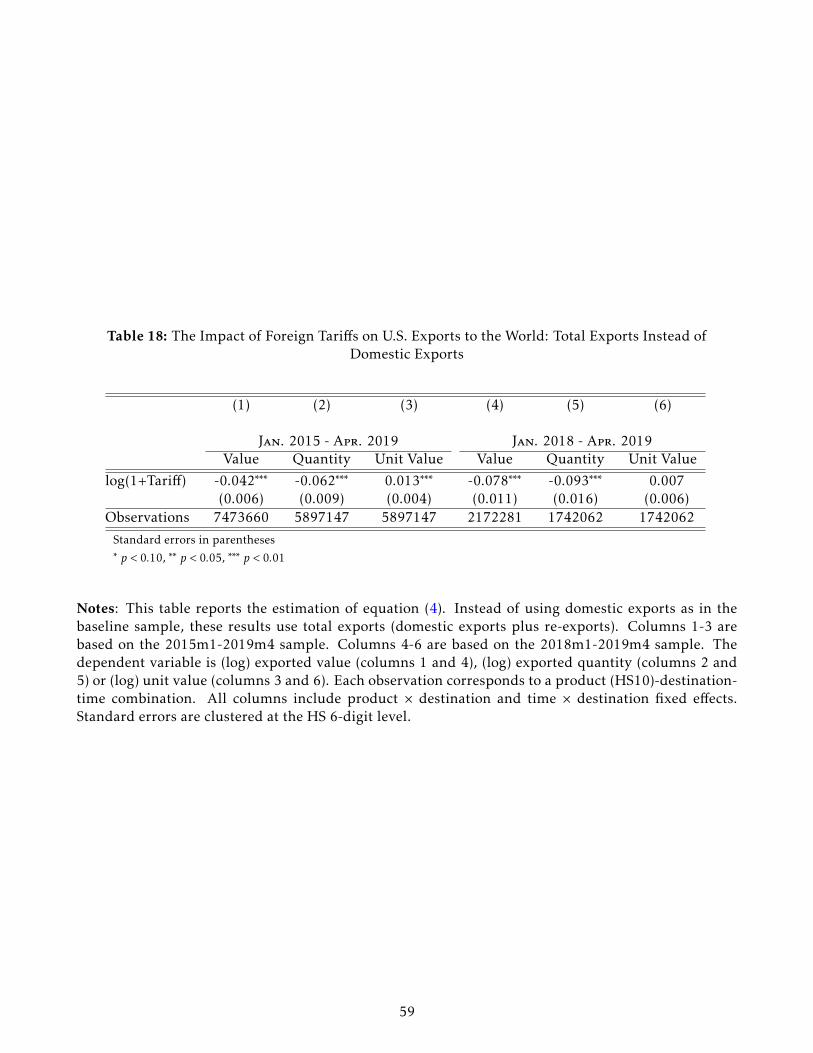
Table 18: The Impact of Foreign Tariffs on U.S. Exports to the World: Total Exports Instead ofDomestic Exports
(1) (2) (3) (4) (5) (6)
Jan. 2015 - Apr. 2019 Jan. 2018 - Apr. 2019
Value Quantity Unit Value Value Quantity Unit Value
log(1+Tariff) -0.042∗∗∗ -0.062∗∗∗ 0.013∗∗∗ -0.078∗∗∗ -0.093∗∗∗ 0.007(0.006) (0.009) (0.004) (0.011) (0.016) (0.006)
Observations 7473660 5897147 5897147 2172281 1742062 1742062
Standard errors in parentheses∗ p < 0.10, ∗∗ p < 0.05, ∗∗∗ p < 0.01
Notes: This table reports the estimation of equation (4). Instead of using domestic exports as in thebaseline sample, these results use total exports (domestic exports plus re-exports). Columns 1-3 arebased on the 2015m1-2019m4 sample. Columns 4-6 are based on the 2018m1-2019m4 sample. Thedependent variable is (log) exported value (columns 1 and 4), (log) exported quantity (columns 2 and5) or (log) unit value (columns 3 and 6). Each observation corresponds to a product (HS10)-destination-time combination. All columns include product × destination and time × destination fixed effects.Standard errors are clustered at the HS 6-digit level.
59

Table 19: The Impact of Foreign Tariffs on U.S. Exports to the World: Alternative Specifications
(1) (2) (3) (4) (5) (6)Value Quantity Unit Value Value Quantity Unit Value
Panel A: product × destination, destination × time and product × time fixed effects
log(1+Tariff) -0.036∗∗∗ -0.033∗∗∗ -0.006 -0.083∗∗∗ -0.086∗∗∗ -0.001(0.005) (0.008) (0.004) (0.010) (0.014) (0.005)
Observations 7700890 6038457 6038457 2292184 1825749 1825749
Panel B: product × destination and destination × time × sector (HS 2) fixed effects
log(1+Tariff) -0.029∗∗∗ -0.031∗∗∗ -0.002 -0.063∗∗∗ -0.072∗∗∗ 0.005(0.006) (0.010) (0.006) (0.010) (0.014) (0.006)
Observations 7643658 5980246 5980246 2275460 1808490 1808490
Standard errors in parentheses∗ p < 0.10, ∗∗ p < 0.05, ∗∗∗ p < 0.01
Notes: This table reports the estimation of a variant equation (4) with different sets of fixed effects.Columns 1-3 are based on the 2015m1-2019m4 sample. Columns 4-6 are based on the 2018m1-2019m4sample. The dependent variable is (log) exported value (columns 1 and 4), (log) exported quantity(columns 2 and 5) or (log) unit value (column 3 and 6). Each observation corresponds to a product(HS10)-destination-time combination. Standard errors are clustered at the HS 6-digit level.
60

Table 20: Nonlinear Effect of Tariffs
(1) (2) (3)Value Quantity Unit Value
Panel A: Exports to the World
log(1+Tariff) -0.020∗∗∗ -0.022∗ -0.001(0.007) (0.012) (0.007)
1[10 ≤ tariff < 20] × log(1+Tariff) -0.006 -0.010 0.006(0.005) (0.007) (0.004)
1[20 ≤ tariff < 30] × log(1+Tariff) -0.030∗∗∗ -0.043∗∗∗ 0.011∗
(0.007) (0.011) (0.006)1[30 ≤ tariff] × log(1+Tariff) -0.017∗∗ -0.027∗∗ 0.007
(0.008) (0.012) (0.006)Observations 7743472 6079454 6079454
Panel B: Exports to China
log(1+Tariff) -0.160∗∗∗ -0.145∗∗∗ -0.036∗
(0.029) (0.043) (0.020)1[10 ≤ tariff < 20] × log(1+Tariff) -0.012 -0.031∗∗ 0.018∗∗
(0.010) (0.015) (0.008)1[20 ≤ tariff < 30] × log(1+Tariff) -0.038∗∗ -0.051∗∗ 0.008
(0.018) (0.025) (0.011)1[30 ≤ tariff] × log(1+Tariff) -0.061∗∗∗ -0.091∗∗∗ 0.024∗∗
(0.019) (0.026) (0.012)Observations 218466 182632 182632
Standard errors in parentheses∗ p < 0.10, ∗∗ p < 0.05, ∗∗∗ p < 0.01
Notes: This table reports the estimation of equation 16. The dependent variable is (log) exported value(column 1), (log) exported quantity (column 2) or (log) unit value (column 3). In panel A, each observa-tion corresponds to a product (HS10)-destination-time combination and all columns include product ×destination and time × destination fixed effects. In panel B, each observation corresponds to a product(HS10)-time combination and all columns include product and time fixed effects. Standard errors areclustered at the HS 6-digit level.
61

Table 21: Does Product Composition Explain the Larger Impact of Chinese Tariffs on U.S. Exports?
(1) (2) (3) (4) (5) (6)Value Quantity Unit Value Value Quantity Unit Value
log(1+Tariff) -0.012 -0.016 -0.001 -0.030∗∗∗ -0.041∗∗∗ 0.007(0.014) (0.020) (0.011) (0.005) (0.009) (0.005)
1[China] × log(1+Tariff) -0.150∗∗∗ -0.142∗∗∗ -0.026 -0.156∗∗∗ -0.153∗∗∗ -0.023(0.032) (0.045) (0.020) (0.030) (0.043) (0.017)
log(1+Tariff) × Share Rel. Party Trade 0.038 0.046 -0.012(0.030) (0.046) (0.025)
log(1+Tariff) × log Elast. of Subst. -0.015∗ -0.019 0.005(0.009) (0.013) (0.006)
Observations 5253671 4153095 4153095 7743472 6079454 6079454
Standard errors in parentheses∗ p < 0.10, ∗∗ p < 0.05, ∗∗∗ p < 0.01
Notes: This table reports the estimation of equation (6). The dependent variable is (log) exported value(columns 1 and 4), (log) exported quantity (columns 2 and 5) or (log) unit value (column 3 and 6).Each observation corresponds to a product (HS10)-destination-time combination. Columns 1-3 includeproduct × destination and time × destination × sector fixed effects. Columns 4-6 include product ×destination and time × destination fixed effects. Standard errors are clustered at the HS 6-digit level.
62