trading & managing volatility - cfa institute archive/2012...the tale of two volatilities •...
TRANSCRIPT

PROPRIETARY.Permission to reprint or distribute any content from this presentation requires the written approval of Standard & Poor’s. Copyright © 2011 Standard & Poor’s Financial Services LLC, a subsidiary of The McGraw-Hill Companies, Inc. All rights reserved.
Analytic services and products by Standard & Poor’s are the result of separate activities designed to preserve the independence and objectivity of each analytic process. Standard & Poor’s has established policies and procedures to maintain the confidentiality of non-public information received during each analytic process.
There’s nothing passive
about how you invest.
McGraw-Hill Financial
Trading & Managing Volatility
Berlinda Liu, CFA
S&P Indices
March 7, 2012
For Financial Professionals – Not for Public Distribution

PROPRIETARY. Permission to reprint or distribute any content from this presentation requires the written approval of Standard & Poor’s. 1
Evolution of Volatility Management Indices
Implied
Volatility
Indices
Volatility
Futures
Indices
Vol-Managed
Enhanced
Equity Indices
1993-2007
Intelligent Roll
Volatility
Futures
Indices
2008-2009 2010-2012 2010-2012
Measuring Trading Managing

PROPRIETARY. Permission to reprint or distribute any content from this presentation requires the written approval of Standard & Poor’s. 2
How to measure volatility?
Implied
Volatility
Indices
Volatility
Futures
Indices
Vol-Managed
Enhanced
Equity Indices
1993-2007
Intelligent Roll
Volatility
Futures
Indices
2008-2009 2010-2012 2010-2012
•VIX®
•VXV®
Measuring Trading Managing

The Tale of Two Volatilities
• VIX & VXV
– VIX = 1 month implied volatility of S&P 500®
– VXV = 3 month implied volatility of S&P 500
– The VIX/VXV ratio measures expectations of short term event risk versus longer term systemic risk. In “normal”environments, the ratio is lower than 1.
• Implied & Realized Volatility
– Realized volatility is the standard deviation of the continuously compounded returns within a specific time horizon.
– Implied volatility is the volatility implied by the market price of the option based on an option pricing model.
PROPRIETARY. Permission to reprint or distribute any content from this presentation requires the written approval of Standard & Poor’s. 3
VIX and VXV are negatively correlated to equity markets, providing
diversification and tail risk hedging benefits. But neither is replicable.
VIX and VXV are negatively correlated to equity markets, providing
diversification and tail risk hedging benefits. But neither is replicable.

PROPRIETARY. Permission to reprint or distribute any content from this presentation requires the written approval of Standard & Poor’s. 4
How to trade volatility?
Implied
Volatility
Indices
Volatility
Futures
Indices
Vol-Managed
Enhanced
Equity Indices
1993-2007
Intelligent Roll
Volatility
Futures
Indices
2008-2009 2010-2012 2010-2012
•S&P 500 VIX Short Term VIX Futures
Index ®
•S&P 500 VIX Mid Term Futures Index ®
•Inverse•Leveraged
•S&P 500 Dynamic
VIX Futures ®
•S&P 500 VIX Futures Enhanced Roll ®
•S&P 500 VIX Futures Term Structure ®
Measuring Trading Managing

S&P 500 VIX Futures Index Series
• The S&P 500 VIX Short-Term
Futures Index measures the return from a daily rolling long position in the first and second month VIX futures contracts.
• The S&P 500 VIX Mid-Term
Futures Index measures the return from a daily rolling long position in the fourth, fifth, sixth and seventh month VIX futures contracts.
• Unlike spot VIX, these indices are replicable. But they have negative correlation and tail risk hedging benefits of spot VIX.
PROPRIETARY. Permission to reprint or distribute any content from this presentation requires the written approval of Standard & Poor’s. 5
Date S&P 500 VIX Spot
S&P 500 VIX
Short Term
Futures Index
S&P 500 VIX
Mid Term
Futures Index
10/15/2008 -9.46% 22.80% 13.13% 8.06%
12/1/2008 -9.35% 21.46% 12.01% 10.02%
9/29/2008 -9.20% 29.63% 13.11% 7.99%
10/9/2008 -7.92% 10.53% 9.50% 4.92%
11/20/2008 -6.94% 8.51% 5.15% 4.81%
8/8/2011 -6.88% 40.55% 17.44% 6.96%
11/19/2008 -6.30% 9.34% 9.34% 6.33%
10/22/2008 -6.27% 27.11% 9.85% 6.41%
10/7/2008 -5.91% 3.08% 9.17% 0.74%
1/20/2009 -5.43% 20.59% 12.06% 5.86%
11/5/2008 -5.35% 13.37% 6.32% 5.73%
11/12/2008 -5.28% 7.85% 7.44% 2.81%
11/6/2008 -5.13% 15.46% 11.12% 4.62%
2/10/2009 -5.03% 6.71% 6.11% 2.10%
8/4/2011 -4.90% 30.32% 19.35% 8.16%
9/15/2008 -4.83% 21.14% 5.84% 3.09%
9/17/2008 -4.83% 17.85% 5.57% 3.15%
3/2/2009 -4.77% 12.74% 6.35% 2.08%
2/17/2009 -4.64% 12.53% 4.25% 2.54%
8/18/2011 -4.55% 30.10% 17.59% 10.20%
Correlation w/ S&P 500
100% -77% -80% -78%
Correlation w/ VIX Spot
100% 88% 81%
Source: S&P Indices. Correlations are based on daily returns from 12/20/2005 through 1/31/2012. Past performance is no guarantee of future results. Some of the data used to determine correlations reflects hypothetical historical performance. Please see the Performance Disclosure on slide 22 of this presentation for important information related to back-tested information.

VIX Term Structure
• In the S&P 500 VIX Short-Term
Futures Index, a positive roll
cost occurs on 76% of days,
with an average daily loss of
0.18%.
• In the S&P 500 VIX Mid-Term
Futures Index, a positive roll
cost occurs on 64% of days,
with a lower average daily loss
of 0.07%.
PROPRIETARY. Permission to reprint or distribute any content from this presentation requires the written approval of Standard & Poor’s. 6
Source: www.cboe.com. 2/15/12 Source: Liu & Dash, Volatility ETFs & ETNs, Journal of Trading, Winter 2012.

The Contango Problem
PROPRIETARY. Permission to reprint or distribute any content from this presentation requires the written approval of Standard & Poor’s. 7
Source: S&P Indices. Based on daily returns from 12/20/2005 through 1/31/2012. Past performance is no guarantee of future results. Some of the information used in this chart reflects hypothetical historical performance. Please see the Performance Disclosure on slide 22 presentation for important information related to back-tested information.

The Other Side of VIX
• ETPs linked to the inverse of the
S&P 500 VIX Futures Indices
collect positive roll yield when
– The VIX futures curve is in contango, and
– The VIX spot remains flat or down
• Inverse VIX Futures ETPs
underperform when VIX rises.
• Available ETPs include
– XIV
– SVXY
PROPRIETARY. Permission to reprint or distribute any content from this presentation requires the written approval of Standard & Poor’s. 8
Source: S&P Indices, Bloomberg. Based on daily returns through 1/31/2012. Past performance is no guarantee of future results. It is not possible to invest directly in an index. The comparison in the chart comparing XIV to the S&P 500 VIX Short-Term Futures is for illustrative purposes only and does not take costs, fees or other expenses into account. Such costs would lower the actual performance of any investment. UX1, UX2, UX3 represent generic VIX futures price series of 1-month, 2-month and 3-month contracts, respectively. S&P does not sponsor, endorse, promote or sell any product linked to an S&P Index. For additional information regarding XIV, please see the Performance Disclosure on page 22.
Backwardation
Period

Addressing the Term Structure Decay
• Intelligent roll indices seek to
address the contango problem
by allocating across the term
structure.
• Allocation is typically between
the short and medium end of
the curve.
• May involve
– Long and short positions.
– Static or dynamic allocations
• Examples
– S&P 500 Dynamic VIX Futures Index
– S&P 500 VIX Futures Term Structure Index
– S&P 500 VIX Futures Enhanced Roll Index
PROPRIETARY. Permission to reprint or distribute any content from this presentation requires the written approval of Standard & Poor’s. 9
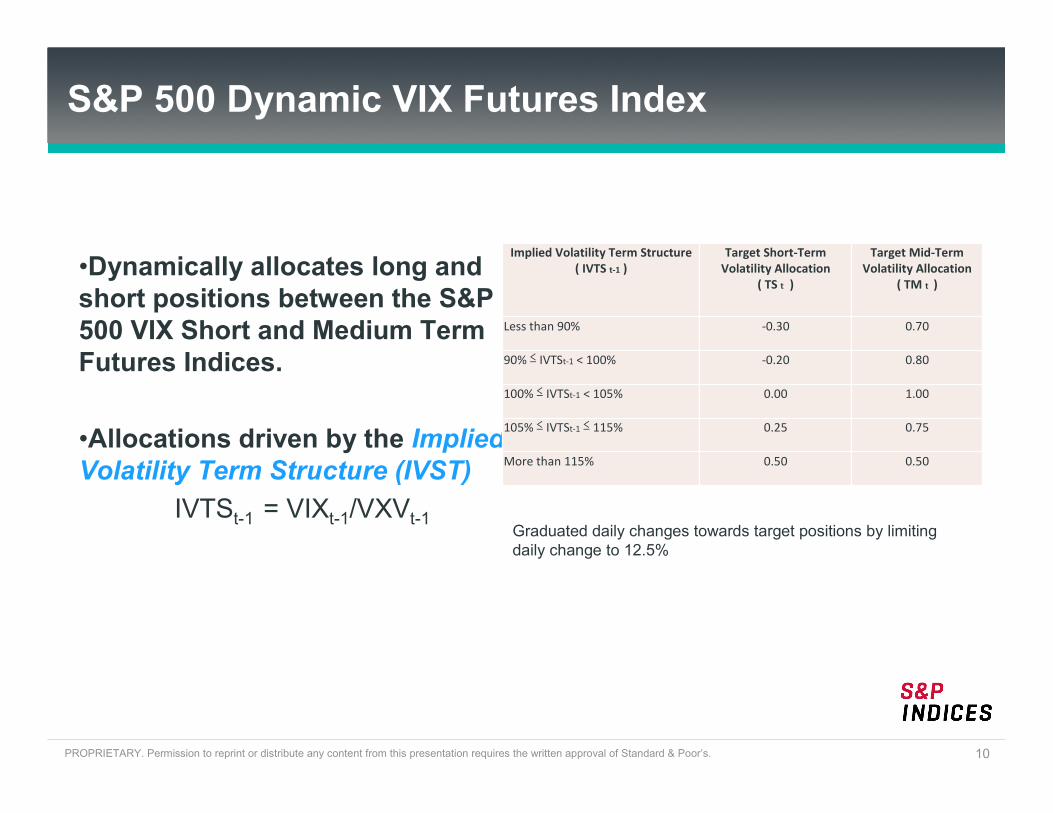
S&P 500 Dynamic VIX Futures Index
•Dynamically allocates long and
short positions between the S&P
500 VIX Short and Medium Term
Futures Indices.
•Allocations driven by the Implied Volatility Term Structure (IVST)
IVTSt-1 = VIXt-1/VXVt-1
PROPRIETARY. Permission to reprint or distribute any content from this presentation requires the written approval of Standard & Poor’s. 10
Implied Volatility Term Structure
( IVTS t-1 )
Target Short-Term
Volatility Allocation
( TS t )
Target Mid-Term
Volatility Allocation
( TM t )
Less than 90% -0.30 0.70
90% ≤ IVTSt-1 < 100% -0.20 0.80
100% ≤ IVTSt-1 < 105% 0.00 1.00
105% ≤ IVTSt-1 ≤ 115% 0.25 0.75
More than 115% 0.50 0.50
Graduated daily changes towards target positions by limiting daily change to 12.5%

Preserving the Tail Risk Hedge Benefits
Date S&P 500 VIX Spot
S&P 500 VIX
Short Term
Futures Index
S&P 500 VIX
Mid Term
Futures Index
S&P 500 Dynamic
VIX Futures Index
10/15/2008 -9.46% 22.80% 13.13% 8.06% 10.63%
12/1/2008 -9.35% 21.46% 12.01% 10.02% 10.27%
9/29/2008 -9.20% 29.63% 13.11% 7.99% 9.30%
10/9/2008 -7.92% 10.53% 9.50% 4.92% 7.24%
11/20/2008 -6.94% 8.51% 5.15% 4.81% 4.90%
8/8/2011 -6.88% 40.55% 17.44% 6.96% 9.69%
11/19/2008 -6.30% 9.34% 9.34% 6.33% 7.09%
10/22/2008 -6.27% 27.11% 9.85% 6.41% 8.14%
10/7/2008 -5.91% 3.08% 9.17% 0.74% 5.04%
1/20/2009 -5.43% 20.59% 12.06% 5.86% 2.24%
11/5/2008 -5.35% 13.37% 6.32% 5.73% 5.88%
11/12/2008 -5.28% 7.85% 7.44% 2.81% 3.99%
11/6/2008 -5.13% 15.46% 11.12% 4.62% 5.46%
2/10/2009 -5.03% 6.71% 6.11% 2.10% 1.06%
8/4/2011 -4.90% 30.32% 19.35% 8.16% 11.08%
9/15/2008 -4.83% 21.14% 5.84% 3.09% 2.42%
9/17/2008 -4.83% 17.85% 5.57% 3.15% 3.46%
3/2/2009 -4.77% 12.74% 6.35% 2.08% 2.08%
2/17/2009 -4.64% 12.53% 4.25% 2.54% 1.19%
8/18/2011 -4.55% 30.10% 17.59% 10.20% 12.10%
Correlation w/ S&P 500
100% -77% -80% -78% -72%
Correlation w/ VIX Spot
100% 88% 81% 65%
PROPRIETARY. Permission to reprint or distribute any content from this presentation requires the written approval of Standard & Poor’s. 11
Source: S&P Indices. Correlations are based on daily returns from 12/20/2005 through 1/31/2012. Past performance is no guarantee of future results. Some of the data used to determine correlations reflects hypothetical historical performance. Please see the Performance Disclosure on slide 22 presentation for important information related to back-tested information.

Navigating the Term Structure
S&P 500 VIX Spot
S&P 500 VIX
Short Term
Futures
Index
S&P 500 VIX
Mid Term
Futures
Index
S&P 500
Dynamic VIX
Futures Index
Return
1 Year 4.22% -0.46% -15.55% -5.16% 17.02%
2 Years 12.84% -11.14% -53.64% -13.33% 16.37%
3 Years 19.24% -24.31% -59.43% -18.41% 10.22%
5 Years 0.33% 13.28% -23.22% 11.46% 34.36%
Volatility
1 Year 23.40% 130.79% 77.85% 38.97% 31.14%
2 Years 20.73% 122.75% 69.77% 34.89% 24.41%
3 Years 22.40% 111.88% 63.50% 32.23% 22.23%
5 Years 26.72% 119.46% 64.52% 34.41% 27.63%
PROPRIETARY. Permission to reprint or distribute any content from this presentation requires the written approval of Standard & Poor’s. 12
Source: S&P Indices. Returns and volatility are annualized figures for 1, 2, 3 and 5 year periods ending 1/31/2012. Past performance is no guarantee of future results. Some of the data used to determine returns and volatility reflect hypothetical historical performance. Please see the Performance Disclosure on slide 22 presentation for important information related to back-tested information.

PROPRIETARY. Permission to reprint or distribute any content from this presentation requires the written approval of Standard & Poor’s. 13
How to manage volatility in an equity portfolio?
Implied
Volatility
Indices
Volatility
Futures
Indices
Vol-Managed
Enhanced
Equity Indices
1993-2007
Intelligent Roll
Volatility
Futures
Indices
2008-2009 2010-2012 2010-2012
•S&P 500 VEQTOR®
•S&P 500 Low Volatility ®
•S&P 500 Risk Control
Measuring Trading Managing

Volatility Managed S&P 500
PROPRIETARY. Permission to reprint or distribute any content from this presentation requires the written approval of Standard & Poor’s. 14
S&P 500
Risk Control
S&P 500
VEQTOR®
S&P 500
Low Volatility®
Managing Volatility of S&P 500 Exposure
Using Stock Selection &
Alternative Weighting
Allocating Between
Risky and Risk-Free
Assets
Using VIX Derivatives
Overlay

VEQTOR – Volatility Equity Allocator
PROPRIETARY. Permission to reprint or distribute any content from this presentation requires the written approval of Standard & Poor’s. 15
Step 1: Evaluate realized and implied volatility
Let RV and IV denote annualized one-month realized and implied
volatility, respectively, where:
1−tRV = 22
ln*25222
1
2
1
∑= −−
−
n nt
nt
SPX
SPX
(1)
1−tIV = 1−tVIX (2)
where:
VIXt-1 and SPXt refer to the CBOE Volatility Index (VIX)
and the S&P 500 price return index, respectively.
Step 2: Establish implied volatility trend
The implied volatility trend evaluates the presence, or lack, of a
trend of expected volatility implied by the options markets. Let the
five-day and 20-day implied volatility average be denoted by tIV5
and tIV20 , respectively. The Daily Implied Volatility Trend
indicator ( )tDIVT is up (+1) if the five-day implied volatility
average is greater than or equal to the 20-day implied volatility
average, and down (-1) if it is less.
15 −tIV = ∑=
−5
1 5n
ntIV (3)
120 −tIV = ∑=
−20
1 20n
ntIV (4)
<−
≥+=
−−
−−
−
11
11
12051
2051
tt
tt
tIVIVif
IVIVifDIVT
KK
KK
(5)
The Implied Volatility Trend ( )tIVT is established if the Daily
Implied Volatility Trend indicators remain constant for at least 10
business days. Uptrend (+1), Downtrend (-1) and No Trend (0) are
given by the following formulae:
+<<−
−=−
+=+
=
∑
∑
∑
=−
=−
=−
−
10100
101
10...1
10
1
10
1
10
1
1
n
nt
n
nt
n
nt
t
DIVTif
DIVTif
DIVTif
IVT
K
KK
K
(6)

VEQTOR – Volatility Equity Allocator
PROPRIETARY. Permission to reprint or distribute any content from this presentation requires the written approval of Standard & Poor’s. 16
Step 4: Impose stop loss discipline
At the close of any business day, if losses over the prior five
business days are greater than or equal to 2%, then the index
moves into a 100% cash position.
Step 3: Divide 100% of portfolio between volatility and equity
Realized Volatility
(1t
RV −)
Target Volatility Allocation
(Vol
tw )
Implied Volatility
Downtrend
( 1−tIVT ) = -1
No Implied
Volatility Trend
( 1−tIVT ) = 0
Implied Volatility
Uptrend
( 1−tIVT ) = +1
Less than 10% 2.5% 2.5% 10.0%
10% ≤ RVt-1 < 20% 2.5% 10.0% 15.0%
20% ≤ RVt-1 < 35% 10.0% 15.0% 25.0%
35% ≤ RVt-1 ≤ 45% 15.0% 25.0% 40.0%
More than 45% 25.0% 40.0% 40.0%
Vol
tw = Weight of the volatility component Equity
tw = Weight of the S&P 500
= 100% - Vol
tw

Dynamic Allocation in Action
PROPRIETARY. Permission to reprint or distribute any content from this presentation requires the written approval of Standard & Poor’s. 17
Source: S&P Indices. Based on daily returns from 12/20/2005 through 1/31/2012. Past performance is no guarantee of future results. Some of the information used in this chart reflects hypothetical historical performance. Please see the Performance Disclosure on slide 22 presentation for important information related to back-tested information.
Higher volatility exposure
(up to 40%) in stress
environment
Reduced volatility exposure
in benign environment

Dynamic Allocation in Action
PROPRIETARY. Permission to reprint or distribute any content from this presentation requires the written approval of Standard & Poor’s. 18
Source: S&P Indices. Returns and volatility are annualized figures for 1, 2, 3 and 5 year periods ending 1/31/2012. Past performance is no guarantee of future results. Some of the data used to determine returns and volatility reflect hypothetical historicalperformance. Please see the Performance Disclosure on slide 22 presentation for important information related to back-tested information
Risk-Return Statistics Annual Returns
S&P 500
S&P 500
VEQTOR
S&P 500 Low
Volatility
Annualized Returns
1 Year 4.22% 18.47% 14.56%
2 Years 12.84% 11.96% 15.13%
3 Years 19.24% 15.48% 16.73%
5 Years 0.33% 16.29% 3.85%
Risk Stats
5 Year
Volatility 18.83% 16.26% 12.82%
5 Year
Return/Risk 0.017 1.002 0.300
Correlation with S&P 500 using Daily Returns
100% 61.72% 93.86%
Correlation with S&P 500 using Monthly Returns
100% 6.47% 90.60%
S&P 500
S&P 500
VEQTOR
S&P 500 Low
Volatility
2006 15.79% 14.15% 19.69%
2007 5.49% 17.20% 0.58%
2008 -37.00% 21.29% -21.41%
2009 26.46% 23.39% 19.22%
2010 15.06% 1.65% 13.36%
2011 2.11% 17.41% 14.78%

Low Volatility Investing: Research
PROPRIETARY. Permission to reprint or distribute any content from this presentation requires the written approval of Standard & Poor’s. 19
• Low volatility investing has been around for over 40 years.
• Black, Jensen and Scholes (1972) first strategized that low risk
stocks may earn high risk-adjusted returns.
• Fama and French (1992); Blitz and van Vliet (2007); and Baker,
Bradley and Wurgler (2011) followed up that high beta or high
volatility stocks are not rewarded with higher returns. These studies
involved quantile portfolios based on ranking of securities on a risk
measure.
• Clarke, de Silva, and Thorley (2006) demonstrated using
mean/variance optimization that minimum variance portfolios earn
higher return with lower realized risk.

Constructing Low Volatility Indices
PROPRIETARY. Permission to reprint or distribute any content from this presentation requires the written approval of Standard & Poor’s. 20
Approach # 1 – Optimization Based Low Volatility Portfolio
• Minimum variance portfolio based on optimization models
• Risk reduction is achieved through estimated factor models or covariance matrices.
• Used by MSCI and Russell
Approach # 2 – Ranking Based Low Volatility Portfolio
• Portfolio of securities that are least volatile based on a past volatility measure
• Risk reduction is achieved through selection of lower volatilitysecurities (or conversely, removal of higher volatility securities)
• Used by S&P Indices
Research shows that both approaches are effective at reducing
portfolio volatility over a long-term investment horizon by 25-30%.

The Case for Low Volatility Investing
PROPRIETARY. Permission to reprint or distribute any content from this presentation requires the written approval of Standard & Poor’s. 21
S&P 500 Low
Volatility Index
Russell-Axioma U.S.
Large Cap Low
Volatility Index
MSCI US Min. Vol
IndexS&P 500
Annualized Return
1 Year 14.78% 6.39% 12.87% 2.11%
3 Year 15.76% 12.26% 15.29% 14.11%
5 Year 4.16% 2.62% 3.20% -0.25%
10 Year 7.24% N/A 4.76% 2.92%
15 Year 8.53% N/A N/A 5.45%
20 Year 9.85% N/A N/A 7.81%
Annualized Standard Deviation
1 Year 8.73% 11.96% 9.77% 15.94%
3 Year 11.90% 14.21% 14.45% 18.97%
5 Year 12.92% 14.09% 14.93% 18.88%
10 Year 10.81% N/A 12.32% 15.93%
15 Year 12.18% N/A N/A 16.59%
20 Year 11.37% N/A N/A 15.03%
Sharpe Ratio
3 Year 1.314 0.854 1.049 0.737
5 Year 0.229 0.100 0.134 -0.077
10 Year 0.501 N/A 0.238 -0.085
15 Year 0.466 N/A N/A -0.117
20 Year 0.580 N/A N/A 0.304
Data from 12/31/1990 - 12/31/2011. Returns are total return in USD. Data for MSCI US Minimum Volatility is from www.msci.com. Data for Russell is from www.russell.com. Graphs are provided for illustrative purposes only. Past performance is not a guarantee of future results. This graph reflects hypothetical historical performance. Please see the Performance Disclosure at the end of this document for more information regarding the inherent limitations associated with backtested performance.

PROPRIETARY. Permission to reprint or distribute any content from this presentation requires the written approval of Standard & Poor’s. 22
Performance Disclaimer
The inception date of the S&P 500 VIX Short Term Futures Index and the S&P 500 VIX Mid Term Futures Index was January 22, 2009, at the market close. All information presented prior to the index inception date is back-tested. The back-test calculations are based on the same methodology that was in effect when the index was officially launched. Complete index methodology details are available at www.indices.standardandpoors.com.The inception date of the S&P 500 Dynamic VIX Futures Index was June 29, 2011 at the market close. All information presented prior to the index inception date is back-tested. The back-test calculations are based on the same methodology that was in effect when the index was officially launched. Complete index methodology details are available at www.indices.standardandpoors.com.The inception date of the S&P 500 Dynamic VEQTOR Index was November 18, 2009, at the market close. All information presented prior to the index inception date is back-tested. The back-test calculations are based on the same methodology that was in effect when the index was officially launched. Complete index methodology details are available at www.indices.standardandpoors.com.The inception date of the S&P 500 Low Volatility Index was April 18, 2011, at the market close. All information presented prior to the index inception date is back-tested. The back-test calculations are based on the same methodology that was in effect when the index was officially launched. Complete index methodology details are available at www.indices.standardandpoors.com.The VelocityShares Daily Inverse VIX Short-Term ETN (XIV) inception date was 11/29/10 and has a maturity date of 12/4/30. XIV are senior, unsecured obligations of Credit Suisse AG. The returns on the ETNs are linked to the inverse of the daily performance of the S&P 500 VIX Short-Term Futures™ Index ER less the investor fee. On any calendar day, the Daily Investor Fee is equal to the product of (1) the Closing Indicative on the immediately preceding calendar day multiplied by (2) the Daily ETN Performance for that series on such calendar day multiplied by (3) the quotient of (a) 0.0135 divided by (b) 365. The ETNs provide traders with an exchange traded instrument enabling them to efficiently express their market views on the short-term futures contracts on the CBOE SPX Volatility Index® (the “VIX®”). The ETNs do not guarantee any return of principal at maturity and do not pay any interest during their term. The index was designed to provide investors with exposure to one or more maturities of futures contracts on the VIX®, which reflects implied volatility of the S&P 500® Index at various points along the volatility forward curve. The calculation of the VIX® is based on prices of put and call options on the S&P 500® Index. The S&P 500 VIX Short-Term Futures™ Index ER targets a constant weighted average maturity of 1 month. The ETNs are linked to the daily inverse return of the index and do not represent an investment in the inverse of the VIX®. The ETNs are not sponsored, endorsed, sold or promoted by S&P or CBOE and S&P and CBOE make no representation regarding the advisability of investing in the ETNs.Past performance is not an indication of future results. Prospective application of the methodology used to construct the S&P 500 VIX Short Term Futures Index, the S&P 500 VIX Mid Term Futures Index, the S&P 500 Dynamic VIX Futures Index, the S&P 500 Dynamic VEQTOR Index and the S&P 500 Low Volatility Index may not result in performance commensurate with the back-test returns shown. The back-test period does not necessarily correspond to the entire available history of the index. Please refer to the methodology paper for the index, available at www.standardandpoors.com for more details about the index, including the manner in which it is rebalanced, the timing of such rebalancing, criteria for additions and deletions, as well as all index calculations. It is not possible to invest directly in an Index.Also, another limitation of hypothetical information is that generally the index is prepared with the benefit of hindsight. Back-tested data reflect the application of the index methodology and selection of index constituents in hindsight. No hypothetical record can completely account for the impact of financial risk in actual trading. For example, there are numerous factors related to the equities (or fixed income, or commodities) markets in general which cannot be, and have not been accounted for in the preparation of the index information set forth, all of which can affect actual performance.The index returns shown do not represent the results of actual trading of investor assets. Standard & Poor’s maintains the indices and calculates the index levels and performance shown or discussed, but does not manage actual assets. Index returns do not reflect payment of any sales charges or fees an investor would pay to purchase the securities they represent. The imposition of theses fees and charges would cause actual and back-tested performance to be lower than the performance shown. In a simple example, if an index returned 10% on a US $100,000 investment for a 12-month period (or US$ 10,000) and an actual asset-based fee of 1.5% were imposed at the end of the period on the investment plus accrued interest (or US$ 1,650), the net return would be 8.35% (or US$ 8,350) for the year. Over 3 years, an annual 1.5% fee taken at year end with an assumed 10% return per year would result in a cumulative gross return of 33.10%, a total fee of US$ 5,375, and a cumulative net return of 27.2% (or US$ 27,200).VIX® is a registered trademark of Chicago Board Options Exchange, Incorporated. The VIX methodology is the property of the Chicago Board Options Exchange ("CBOE"). CBOE has granted Standard & Poor’s Financial Services LLC ("S&P"), a license to use the VIX methodology to create the S&P 500 Dynamic VIX, S&P 500 VIX Mid-Term Futures Index, S&P 500 VIX Short-Term Futures Index, S&P 500 VIX 2-Month Futures Index, S&P 500 VIX 3-Month Futures Index, S&P 500 VIX 4-Month Futures Index, and S&P 500 VIX 6-Month Futures Index.

PROPRIETARY. Permission to reprint or distribute any content from this presentation requires the written approval of Standard & Poor’s. 23
General Disclaimer
This document does not constitute an offer of services in jurisdictions where Standard & Poor’s Financial Services LLC (“S&P”) or its affiliates do not have the necessary licenses. All information provided by S&P is impersonal and not tailored to the needs of any person, entity or group of persons. S&P receives compensation in connection with licensing its indices to third parties. Any returns or performance provided within are for illustrative purposes only and do not demonstrate actual performance. Past performance is not a guarantee of future investment results.
It is not possible to invest directly in an index. Exposure to an asset class represented by an index is available through investable instruments based on that index. S&P and its affiliates do not sponsor, endorse, sell, promote or manage any investment fund or other vehicle that is offered by third parties and that seeks to provide an investment return based on the returns of any S&P index. There is no assurance that investment products based on the index will accurately track index performance or provide positive investment returns. S&P is not an investment advisor, and S&P and its affiliates make no representation regarding the advisability of investing in any such investment fund or other vehicle. A decision to invest in any such investment fund or other vehicle should not be made in reliance on any of the statements set forth in this document. Prospective investors are advised to make an investment in any such fund or other vehicle only after carefully considering the risks associated with investing in such funds, as detailed in an offering memorandum or similar document that is prepared by or on behalf of the issuer of the investment fund or other vehicle. Inclusion of a security within an index is not a recommendation by S&P to buy, sell, or hold such security, nor is it considered to be investment advice.
The index returns shown do not represent the results of actual trading of investor assets. Standard & Poor’s maintains the indices and calculates the index levels and performance shown or discussed, but does not manage actual assets. Index returns do not reflect payment of any sales charges or fees an investor would pay to purchase the securities they represent. The imposition of theses fees and charges would cause actual and back-tested performance to be lower than the performance shown. In a simple example, if an index returned 10% on a US $100,000 investment for a 12-month period (or US$ 10,000) and an actual asset-based fee of 1.5% were imposed at the end of the period on the investment plus accrued interest (or US$ 1,650), the net return would be 8.35% (or US$ 8,350) for the year. Over 3 years, an annual 1.5% fee taken at year end with an assumed 10% return per year would result in a cumulative gross return of 33.10%, a total fee of US$ 5,375, and a cumulative net return of 27.2% (or US$ 27,200).
S&P does not guarantee the accuracy and/or completeness of any S&P index, any data included therein, or any data from which it is based, and Standard & Poor’s shall have no liability for any errors, omissions, or interruptions therein. S&P makes no warranties, express or implied, as to results to be obtained from use of information provided by S&P, and S&P expressly disclaims all warranties of suitability with respect thereto. While S&P has obtained information believed to be reliable, S&P shall not be liable for any claims or losses of any nature in connection with information contained in this document, including but not limited to, lost profits or punitive or consequential damages, even if it is advised of the possibility of same.
S&P keeps certain activities of its business units separate from each other in order to preserve the independence and objectivity of their respective activities. As a result, certain business units of S&P may have information that is not available to other S&P business units. S&P has established policies and procedures to maintain the confidentiality of non-public information received during each analytic process. S&P and its affiliates provide a wide range of services to, or relating to, many organizations, including issuers of securities, investment advisers, broker-dealers, investment banks, other financial institutions and financial intermediaries, and accordingly may receive fees or other economic benefits from those organizations, including organizations whose securities or services they may recommend, rate, include in model portfolios, evaluate or otherwise address.
Copyright © 2012 by Standard & Poor’s Financial Services LLC, a subsidiary of The McGraw-Hill Companies. All rights reserved. Redistribution, reproduction and/or photocopying in whole or in part is prohibited without written permission. STANDARD & POOR’S, S&P and S&P 500 are registered trademarks of Standard & Poor’s Financial Services LLC.

Analytic services and products by Standard & Poor’s are the result of separate activities designed to preserve the independence and objectivity of each analytic process. Standard & Poor’s has established policies and procedures to maintain the confidentiality of non-public information received during each analytic process.
McGraw-Hill FinancialPROPRIETARY. Permission to reprint or distribute any content from this presentation requires the written approval of Standard & Poor’s. 24
For questions, please contact: