trading volumes and transaction costs in the foreign ...jmp/gmm/hartmann.pdf · trading volumes and...
TRANSCRIPT
Trading volumes and transaction costs in the
foreign exchange marketEvidence from daily dollar±yen spot data
Philipp Hartmann 1,2
European Central Bank, Directorate General Research, Kaiserstrasse 29, 60311 Frankfurt, Germany
Received 6 June 1996; accepted 24 July 1998
Abstract
A Generalized Method of Moments estimation of the determinants of dollar/yen bid±
ask spreads is undertaken. In particular, a long time-series of daily spot foreign ex-
change trading volumes is used for the ®rst time. In line with standard spread models
and volume theories, it can be shown that unpredictable foreign exchange turnover (a
measure of the rate of information arrival) increases spreads, while predictable turnover
decreases them. Both e�ects are strongly signi®cant when employing spot turnover in-
stead of proxies like forward turnover as in previous studies. The results are also found
to be robust when unpredictable Reuters quoting frequency is used as an instrument for
unpredictable trading volumes to cope with their endogeneity. Spread estimations with
plain (non-decomposed) volumes are rejected as misspeci®ed. Finally, there is evidence
for the conditional heteroscedasticity of unpredictable spot foreign exchange vol-
umes. Ó 1999 Elsevier Science B.V. All rights reserved.
JEL classi®cation: F31; G15; C32
Journal of Banking & Finance 23 (1999) 801±824
1 Tel.: 49 69 1344 7356; fax: 49 69 1344 6000; e-mail: [email protected] and philipp.hartm-
[email protected] This paper has been ®nalised while I was on the faculty of the London School of Economics,
Financial Markets Group. Any views expressed are my own and not necessarily those of the ECB,
CEPR or LSE.
0378-4266/99/$ ± see front matter Ó 1999 Elsevier Science B.V. All rights reserved.
PII: S 0 3 7 8 - 4 2 6 6 ( 9 8 ) 0 0 1 1 5 - 0
Keywords: Foreign exchange markets; Bid±ask spreads; Trading volumes; Time-series
analysis; Generalized method of moments estimation
1. Introduction
Early time-series estimations on the short-term relation between transactionvolume and transaction costs, as measured by bid±ask spreads, in the foreignexchange (forex) market resulted in the ®nding that spreads increase withvolume at constant volatility (Glassman, 1987). Although information costmodels of dealer spreads, such as that of Copeland and Galai (1983) togetherwith an assumption on the information content of volume, can provide atheoretical basis for this result, recent empirical research by Bessembinder(1994) shows that the impact of predictable and unpredictable trading volumeon spreads seems to be opposite in sign. This latter view is supported bystandard spread models and the mixture of distributions hypothesis (Clark,1973), which implies a positive correlation between unpredictable volatility andunpredictable volume, driven jointly by an (unobservable) information ¯owvariable. Since predictable volume is likely to be unrelated to information re-lated risk, it will help decrease ®xed costs of market making, increase dealers'revenues from liquidity traders, and therefore lower spreads. If predictablevolatility is included as another explanatory variable, but not unpredictablevolatility, then unpredictable volume alone will measure the rate of new in-formation arrival and will therefore have a signi®cant positive e�ect onspreads.
An apparent feature of the analyses by Glassman (1987) and Bessembinder(1994) is that the volume e�ects do not appear to be statistically strong. Oneexplanation could be that they use forex future volumes from the ChicagoInternational Monetary Market (IMM) as a proxy variable for global spotvolumes in the currencies considered. The lack of spot volume data at rea-sonably high frequencies is a principal handicap for many forex time-seriesanalyses. Although there is some positive correlation between spot and futuresvolumes, their overall behaviour may be quite di�erent. For example forexmarket spot turnover growth slowed down considerably in the late 1980s, whileforward turnovers continued to grow forcefully (BIS, 1993). Dumas (1996)points out that the choice of future volumes from an organized market tomeasure total volumes of a market working mostly over the counter may alsoinduce an omitted-variable problem in the estimations. Another explanationfor the statistical weakness of the volume e�ects in these studies, and alsoanother source of possible biases in parameter estimates, may be that theendogeneity of unpredictable turnover, measuring the rate of information ar-rival, is disregarded.
802 P. Hartmann / Journal of Banking & Finance 23 (1999) 801±824
In the present paper we use a new 8-year long (December 1986 throughJanuary 1995) daily volume series for the dollar/yen spot market in order toestimate the relation between volumes and spreads. As yet, to our knowledge,no comparable forex turnover time-series data are currently available for anyother spot market. Additionally, we are able to employ average spot Reutersquotes over the trading day to compute daily spreads and price changes be-tween opening and closing of the Tokyo market, instead of single ``represen-tative'' London quotes per day, as o�ered by most commercial databases. Theeconometric technique chosen is Generalized Method of Moments (GMM)estimation of a log-linear spread equation. Thus, we can introduce unpre-dictable Reuters quoting (tick) frequency as an instrumental variable for un-predictable volumes.
Our results con®rm those found by Bessembinder (1994). Predictable dollar/yen spot volume is negatively linked to spot spreads, while unpredictablevolume is positively linked to spreads. However, using our daily spot volumemeasure and exactly synchronous exchange rate quotes these parameter esti-mates are much more signi®cant, usually way below the 5% level. When in-troducing additional instruments, tests of the overidentifying restrictions donot reject the speci®cation with decomposed volumes and unpredictable ticksas an instrumental variable, while those with non-decomposed or non-instrumented volumes do not pass the test. Altogether this provides strongevidence in favor of the presence of both economies of scale in market making(due to order processing costs) and information costs e�ects in the dollar/yenmarket, suggesting that estimations failing to decompose trading volumes or toinstrument unpredictable volumes will be misspeci®ed and, hence, exhibit bi-ases.
In a companion paper (Hartmann, 1998a) I have studied the spread±volumerelationship with a short panel data set over many currency markets. Since theresults turned out to be fully consistent with those in the present paper, onemight infer that the time-series results found for dollar/yen are likely to be alsovalid for other markets.
The remainder of the paper is organized as follows. In Section 2 the theo-retical basis of the present estimations is summarized. The following sectionconsiders variable measurement issues and describes the econometric approachchosen. The estimations themselves are presented in Section 4. The ®nal sectionconcludes.
2. Spread theory
Finance theory has identi®ed three basic sources of bid±ask spreads: (1)order processing costs, (2) inventory holding costs, and (3) information costs ofmarket making. Each one is in¯uenced by trading volume in a particular
P. Hartmann / Journal of Banking & Finance 23 (1999) 801±824 803
manner. Order processing cost models assume the existence of some ®xed costsof market making or of providing ``immediacy'' for the exchange of ownershiptitles (Demsetz, 1968). These costs may come, for example, from the need toacquire trading know how and a name in the market, as well as from sub-scriptions to electronic information and trading systems (such as Reuters orTelerate in the forex market). They give rise to economies of scale of marketmaking. At a given spread, when a dealer expects that trading volume willincrease in the next trading period, ceteris paribus his expected pro®t goes upas well. However, inter-dealer competition will force him to narrow his spreadto avoid losing business to competitors undercutting him. Hence predictablevolume should reduce spreads through an order processing cost e�ect (Stoll,1978; Black, 1991; Hartmann, 1994, 1998b).
In contrast, the e�ect of trading volume on inventory holding costs is am-biguous, depending, for example, on transaction sizes. Inventory cost models,like Stoll (1978), Ho and Stoll (1981) and others, view dealers not only asproviders of liquidity services but also as optimizers of their own securitiesportfolio. In this framework they try to choose the return-risk e�cient port-folio, which maximizes their (or their shareholders') utility. However, sinceproviding ``immediacy'' (standing ready to trade in a security at any time de-sired by customers) implies being pushed away from this portfolio, they an-nounce bid and ask prices which assure that their positions are not too far fromthe optimal portfolio and provide revenues compensating for the remainingutility losses. On average, larger transactions will push the dealer ``farer'' awayfrom his desired portfolio, such that ceteris paribus the larger the transactionsizes in the order ¯ow expected, the larger the spreads.
However, if trading volume is expected to come in many small, statisticallyindependent orders, then by the law of large numbers increased (predictable)volume could also decrease spreads through an opposite inventory cost e�ect.Since additionally larger volume is not necessarily driven by larger transactionsizes (dealers may decompose one large transaction into several smaller ones of``standard'' size for example or transaction frequency may increase) andReuters quoted spreads are only binding up to a certain maximum transactionsize, it is unlikely that inventory cost e�ects can be identi®ed through dailyvolumes and spreads.
Information cost models suggest a relation between bid±ask spreads andinformation arrival or the presence of agents with better information thandealers in the market (Copeland and Galai, 1983; Glosten and Milgrom,1985; Kyle, 1985). If new information has arrived, such that dealers riskgetting into transactions with ``insiders'', then they will widen spreads inorder to deter some of the informed traders or to earn higher mark-ups fromliquidity-motivated traders, whose demand elasticity is rather low. (Whenasked for a quote, dealers do not know whether the counterparty is an in-formation or a liquidity trader.) Therefore, the more important the infor-
804 P. Hartmann / Journal of Banking & Finance 23 (1999) 801±824
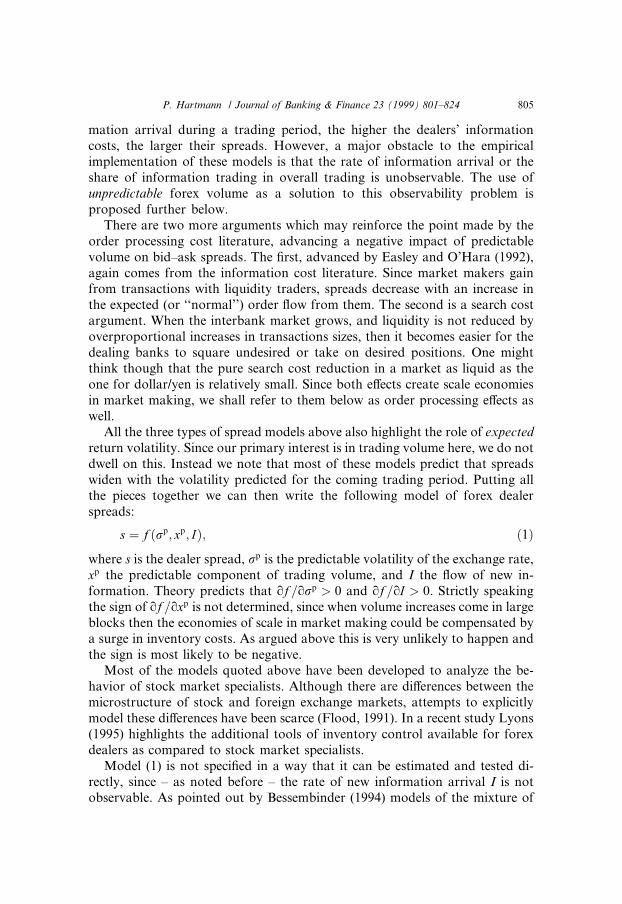
mation arrival during a trading period, the higher the dealers' informationcosts, the larger their spreads. However, a major obstacle to the empiricalimplementation of these models is that the rate of information arrival or theshare of information trading in overall trading is unobservable. The use ofunpredictable forex volume as a solution to this observability problem isproposed further below.
There are two more arguments which may reinforce the point made by theorder processing cost literature, advancing a negative impact of predictablevolume on bid±ask spreads. The ®rst, advanced by Easley and O'Hara (1992),again comes from the information cost literature. Since market makers gainfrom transactions with liquidity traders, spreads decrease with an increase inthe expected (or ``normal'') order ¯ow from them. The second is a search costargument. When the interbank market grows, and liquidity is not reduced byoverproportional increases in transactions sizes, then it becomes easier for thedealing banks to square undesired or take on desired positions. One mightthink though that the pure search cost reduction in a market as liquid as theone for dollar/yen is relatively small. Since both e�ects create scale economiesin market making, we shall refer to them below as order processing e�ects aswell.
All the three types of spread models above also highlight the role of expectedreturn volatility. Since our primary interest is in trading volume here, we do notdwell on this. Instead we note that most of these models predict that spreadswiden with the volatility predicted for the coming trading period. Putting allthe pieces together we can then write the following model of forex dealerspreads:
s � f �rp; xp; I�; �1�where s is the dealer spread, rp is the predictable volatility of the exchange rate,xp the predictable component of trading volume, and I the ¯ow of new in-formation. Theory predicts that of =orp > 0 and of =oI > 0. Strictly speakingthe sign of of =oxp is not determined, since when volume increases come in largeblocks then the economies of scale in market making could be compensated bya surge in inventory costs. As argued above this is very unlikely to happen andthe sign is most likely to be negative.
Most of the models quoted above have been developed to analyze the be-havior of stock market specialists. Although there are di�erences between themicrostructure of stock and foreign exchange markets, attempts to explicitlymodel these di�erences have been scarce (Flood, 1991). In a recent study Lyons(1995) highlights the additional tools of inventory control available for forexdealers as compared to stock market specialists.
Model (1) is not speci®ed in a way that it can be estimated and tested di-rectly, since ± as noted before ± the rate of new information arrival I is notobservable. As pointed out by Bessembinder (1994) models of the mixture of
P. Hartmann / Journal of Banking & Finance 23 (1999) 801±824 805
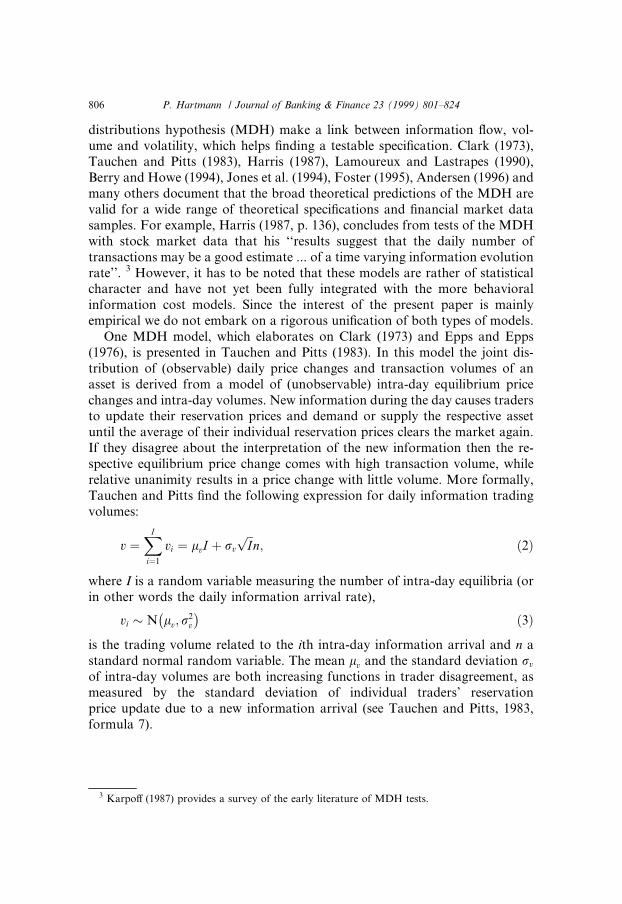
distributions hypothesis (MDH) make a link between information ¯ow, vol-ume and volatility, which helps ®nding a testable speci®cation. Clark (1973),Tauchen and Pitts (1983), Harris (1987), Lamoureux and Lastrapes (1990),Berry and Howe (1994), Jones et al. (1994), Foster (1995), Andersen (1996) andmany others document that the broad theoretical predictions of the MDH arevalid for a wide range of theoretical speci®cations and ®nancial market datasamples. For example, Harris (1987, p. 136), concludes from tests of the MDHwith stock market data that his ``results suggest that the daily number oftransactions may be a good estimate ... of a time varying information evolutionrate''. 3 However, it has to be noted that these models are rather of statisticalcharacter and have not yet been fully integrated with the more behavioralinformation cost models. Since the interest of the present paper is mainlyempirical we do not embark on a rigorous uni®cation of both types of models.
One MDH model, which elaborates on Clark (1973) and Epps and Epps(1976), is presented in Tauchen and Pitts (1983). In this model the joint dis-tribution of (observable) daily price changes and transaction volumes of anasset is derived from a model of (unobservable) intra-day equilibrium pricechanges and intra-day volumes. New information during the day causes tradersto update their reservation prices and demand or supply the respective assetuntil the average of their individual reservation prices clears the market again.If they disagree about the interpretation of the new information then the re-spective equilibrium price change comes with high transaction volume, whilerelative unanimity results in a price change with little volume. More formally,Tauchen and Pitts ®nd the following expression for daily information tradingvolumes:
v �XI
i�1
vi � lvI � rv
��Ip
n; �2�
where I is a random variable measuring the number of intra-day equilibria (orin other words the daily information arrival rate),
vi � N lv; r2v
ÿ � �3�is the trading volume related to the ith intra-day information arrival and n astandard normal random variable. The mean lv and the standard deviation rv
of intra-day volumes are both increasing functions in trader disagreement, asmeasured by the standard deviation of individual traders' reservationprice update due to a new information arrival (see Tauchen and Pitts, 1983,formula 7).
3 Karpo� (1987) provides a survey of the early literature of MDH tests.
806 P. Hartmann / Journal of Banking & Finance 23 (1999) 801±824
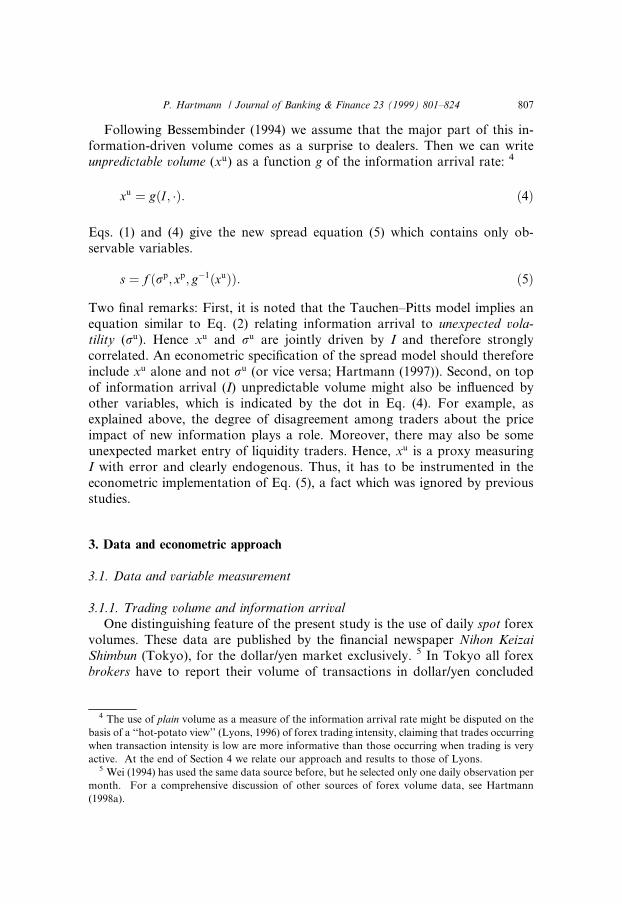
Following Bessembinder (1994) we assume that the major part of this in-formation-driven volume comes as a surprise to dealers. Then we can writeunpredictable volume (xu) as a function g of the information arrival rate: 4
xu � g�I ; ��: �4�
Eqs. (1) and (4) give the new spread equation (5) which contains only ob-servable variables.
s � f �rp; xp; gÿ1�xu��: �5�Two ®nal remarks: First, it is noted that the Tauchen±Pitts model implies anequation similar to Eq. (2) relating information arrival to unexpected vola-tility (ru). Hence xu and ru are jointly driven by I and therefore stronglycorrelated. An econometric speci®cation of the spread model should thereforeinclude xu alone and not ru (or vice versa; Hartmann (1997)). Second, on topof information arrival (I) unpredictable volume might also be in¯uenced byother variables, which is indicated by the dot in Eq. (4). For example, asexplained above, the degree of disagreement among traders about the priceimpact of new information plays a role. Moreover, there may also be someunexpected market entry of liquidity traders. Hence, xu is a proxy measuringI with error and clearly endogenous. Thus, it has to be instrumented in theeconometric implementation of Eq. (5), a fact which was ignored by previousstudies.
3. Data and econometric approach
3.1. Data and variable measurement
3.1.1. Trading volume and information arrivalOne distinguishing feature of the present study is the use of daily spot forex
volumes. These data are published by the ®nancial newspaper Nihon KeizaiShimbun (Tokyo), for the dollar/yen market exclusively. 5 In Tokyo all forexbrokers have to report their volume of transactions in dollar/yen concluded
4 The use of plain volume as a measure of the information arrival rate might be disputed on the
basis of a ``hot-potato view'' (Lyons, 1996) of forex trading intensity, claiming that trades occurring
when transaction intensity is low are more informative than those occurring when trading is very
active. At the end of Section 4 we relate our approach and results to those of Lyons.5 Wei (1994) has used the same data source before, but he selected only one daily observation per
month. For a comprehensive discussion of other sources of forex volume data, see Hartmann
(1998a).
P. Hartmann / Journal of Banking & Finance 23 (1999) 801±824 807
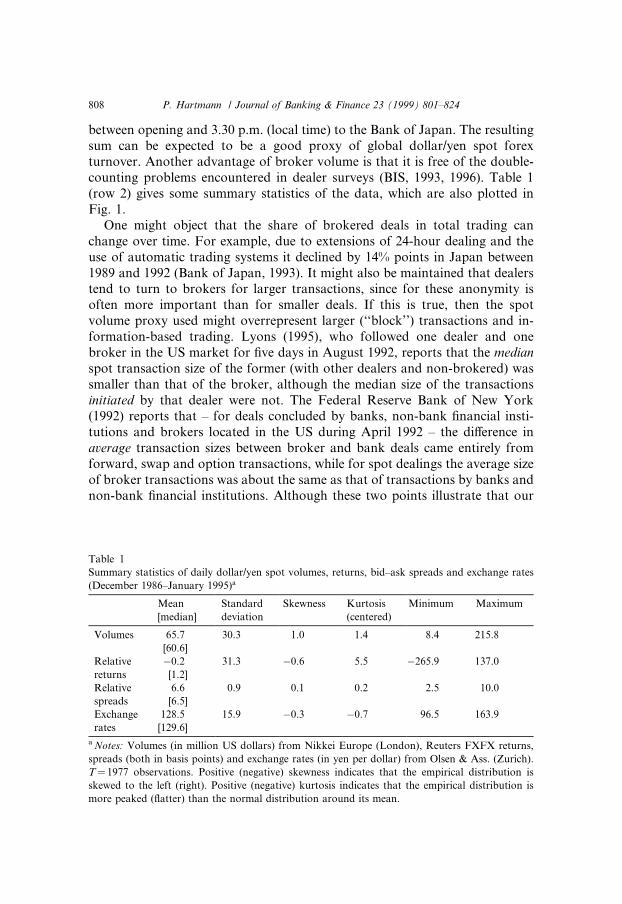
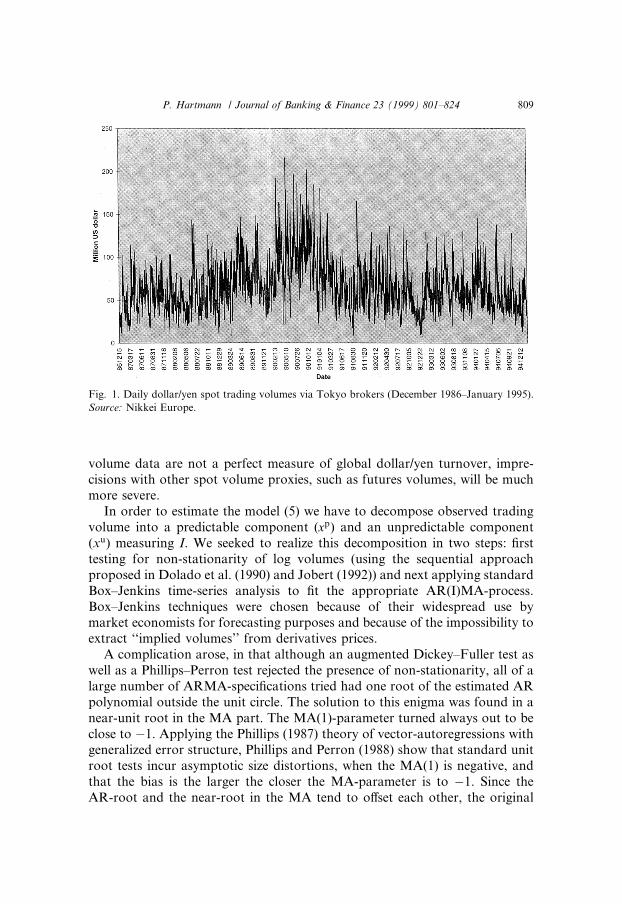
between opening and 3.30 p.m. (local time) to the Bank of Japan. The resultingsum can be expected to be a good proxy of global dollar/yen spot forexturnover. Another advantage of broker volume is that it is free of the double-counting problems encountered in dealer surveys (BIS, 1993, 1996). Table 1(row 2) gives some summary statistics of the data, which are also plotted inFig. 1.
One might object that the share of brokered deals in total trading canchange over time. For example, due to extensions of 24-hour dealing and theuse of automatic trading systems it declined by 14% points in Japan between1989 and 1992 (Bank of Japan, 1993). It might also be maintained that dealerstend to turn to brokers for larger transactions, since for these anonymity isoften more important than for smaller deals. If this is true, then the spotvolume proxy used might overrepresent larger (``block'') transactions and in-formation-based trading. Lyons (1995), who followed one dealer and onebroker in the US market for ®ve days in August 1992, reports that the medianspot transaction size of the former (with other dealers and non-brokered) wassmaller than that of the broker, although the median size of the transactionsinitiated by that dealer were not. The Federal Reserve Bank of New York(1992) reports that ± for deals concluded by banks, non-bank ®nancial insti-tutions and brokers located in the US during April 1992 ± the di�erence inaverage transaction sizes between broker and bank deals came entirely fromforward, swap and option transactions, while for spot dealings the average sizeof broker transactions was about the same as that of transactions by banks andnon-bank ®nancial institutions. Although these two points illustrate that our
Table 1
Summary statistics of daily dollar/yen spot volumes, returns, bid±ask spreads and exchange rates
(December 1986±January 1995)a
Mean
[median]
Standard
deviation
Skewness Kurtosis
(centered)
Minimum Maximum
Volumes 65.7 30.3 1.0 1.4 8.4 215.8
[60.6]
Relative ÿ0.2 31.3 ÿ0.6 5.5 ÿ265.9 137.0
returns [1.2]
Relative 6.6 0.9 0.1 0.2 2.5 10.0
spreads [6.5]
Exchange 128.5 15.9 ÿ0.3 ÿ0.7 96.5 163.9
rates [129.6]
a Notes: Volumes (in million US dollars) from Nikkei Europe (London), Reuters FXFX returns,
spreads (both in basis points) and exchange rates (in yen per dollar) from Olsen & Ass. (Zurich).
T� 1977 observations. Positive (negative) skewness indicates that the empirical distribution is
skewed to the left (right). Positive (negative) kurtosis indicates that the empirical distribution is
more peaked (¯atter) than the normal distribution around its mean.
808 P. Hartmann / Journal of Banking & Finance 23 (1999) 801±824
volume data are not a perfect measure of global dollar/yen turnover, impre-cisions with other spot volume proxies, such as futures volumes, will be muchmore severe.
In order to estimate the model (5) we have to decompose observed tradingvolume into a predictable component (xp) and an unpredictable component(xu) measuring I. We seeked to realize this decomposition in two steps: ®rsttesting for non-stationarity of log volumes (using the sequential approachproposed in Dolado et al. (1990) and Jobert (1992)) and next applying standardBox±Jenkins time-series analysis to ®t the appropriate AR(I)MA-process.Box±Jenkins techniques were chosen because of their widespread use bymarket economists for forecasting purposes and because of the impossibility toextract ``implied volumes'' from derivatives prices.
A complication arose, in that although an augmented Dickey±Fuller test aswell as a Phillips±Perron test rejected the presence of non-stationarity, all of alarge number of ARMA-speci®cations tried had one root of the estimated ARpolynomial outside the unit circle. The solution to this enigma was found in anear-unit root in the MA part. The MA(1)-parameter turned always out to beclose to ÿ1. Applying the Phillips (1987) theory of vector-autoregressions withgeneralized error structure, Phillips and Perron (1988) show that standard unitroot tests incur asymptotic size distortions, when the MA(1) is negative, andthat the bias is the larger the closer the MA-parameter is to ÿ1. Since theAR-root and the near-root in the MA tend to o�set each other, the original
Fig. 1. Daily dollar/yen spot trading volumes via Tokyo brokers (December 1986±January 1995).
Source: Nikkei Europe.
P. Hartmann / Journal of Banking & Finance 23 (1999) 801±824 809
series (and its autocorrelation function) behave(s) rather like a stationaryprocess. 6 This leads to overrejection.
A second argument against relying on standard unit-root tests in our case isprovided by Kim and Schmidt (1993). They show that in small samples thesetests can be biased in favor of rejecting the null, when ARIMA-residuals areconditionally heteroscedastic, and that these biases reduce only slowly withgrowing sample sizes. As reported in the upper rows of Table 3 further below,a Lagrange-multiplier test of conditional heteroscedasticity in the ARIMA-residuals clearly rejects homoscedasticity against ARCH(q) with q > 1.
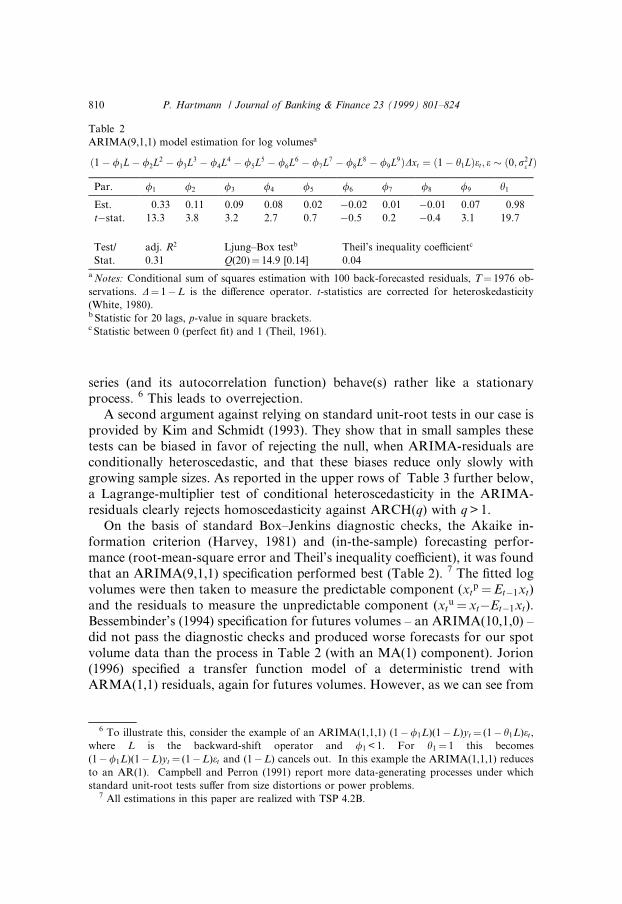
On the basis of standard Box±Jenkins diagnostic checks, the Akaike in-formation criterion (Harvey, 1981) and (in-the-sample) forecasting perfor-mance (root-mean-square error and Theil's inequality coe�cient), it was foundthat an ARIMA(9,1,1) speci®cation performed best (Table 2). 7 The ®tted logvolumes were then taken to measure the predictable component (xt
p�Etÿ1xt)and the residuals to measure the unpredictable component (xt
u� xtÿEtÿ1xt).Bessembinder's (1994) speci®cation for futures volumes ± an ARIMA(10,1,0) ±did not pass the diagnostic checks and produced worse forecasts for our spotvolume data than the process in Table 2 (with an MA(1) component). Jorion(1996) speci®ed a transfer function model of a deterministic trend withARMA(1,1) residuals, again for futures volumes. However, as we can see from
Table 2
ARIMA(9,1,1) model estimation for log volumesa
�1ÿ /1Lÿ /2L2 ÿ /3L3 ÿ /4L4 ÿ /5L5 ÿ /6L6 ÿ /7L7 ÿ /8L8 ÿ /9L9�Dxt � �1ÿ h1L�et; e � �0;r2e I�
Par. /1 /2 /3 /4 /5 /6 /7 /8 /9 h1
Est. 0.33 0.11 0.09 0.08 0.02 ÿ0.02 0.01 ÿ0.01 0.07 0.98
tÿstat. 13.3 3.8 3.2 2.7 0.7 ÿ0.5 0.2 ÿ0.4 3.1 19.7
Test/ adj. R2 Ljung±Box testb Theil's inequality coe�cientc
Stat. 0.31 Q(20)� 14.9 [0.14] 0.04
a Notes: Conditional sum of squares estimation with 100 back-forecasted residuals, T� 1976 ob-
servations. D� 1ÿL is the di�erence operator. t-statistics are corrected for heteroskedasticity
(White, 1980).b Statistic for 20 lags, p-value in square brackets.c Statistic between 0 (perfect ®t) and 1 (Theil, 1961).
6 To illustrate this, consider the example of an ARIMA(1,1,1) (1ÿ/1L)(1ÿL)yt � (1ÿ h1L)et,
where L is the backward-shift operator and /1 < 1. For h1� 1 this becomes
(1ÿ/1L)(1ÿL)yt � (1ÿL)et and (1ÿL) cancels out. In this example the ARIMA(1,1,1) reduces
to an AR(1). Campbell and Perron (1991) report more data-generating processes under which
standard unit-root tests su�er from size distortions or power problems.7 All estimations in this paper are realized with TSP 4.2B.
810 P. Hartmann / Journal of Banking & Finance 23 (1999) 801±824
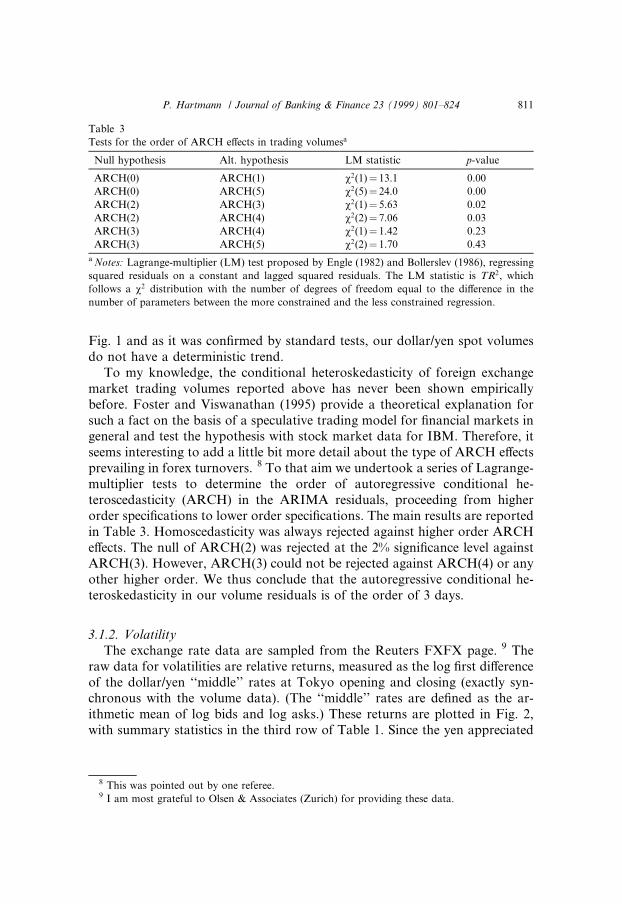
Fig. 1 and as it was con®rmed by standard tests, our dollar/yen spot volumesdo not have a deterministic trend.
To my knowledge, the conditional heteroskedasticity of foreign exchangemarket trading volumes reported above has never been shown empiricallybefore. Foster and Viswanathan (1995) provide a theoretical explanation forsuch a fact on the basis of a speculative trading model for ®nancial markets ingeneral and test the hypothesis with stock market data for IBM. Therefore, itseems interesting to add a little bit more detail about the type of ARCH e�ectsprevailing in forex turnovers. 8 To that aim we undertook a series of Lagrange-multiplier tests to determine the order of autoregressive conditional he-teroscedasticity (ARCH) in the ARIMA residuals, proceeding from higherorder speci®cations to lower order speci®cations. The main results are reportedin Table 3. Homoscedasticity was always rejected against higher order ARCHe�ects. The null of ARCH(2) was rejected at the 2% signi®cance level againstARCH(3). However, ARCH(3) could not be rejected against ARCH(4) or anyother higher order. We thus conclude that the autoregressive conditional he-teroskedasticity in our volume residuals is of the order of 3 days.
3.1.2. VolatilityThe exchange rate data are sampled from the Reuters FXFX page. 9 The
raw data for volatilities are relative returns, measured as the log ®rst di�erenceof the dollar/yen ``middle'' rates at Tokyo opening and closing (exactly syn-chronous with the volume data). (The ``middle'' rates are de®ned as the ar-ithmetic mean of log bids and log asks.) These returns are plotted in Fig. 2,with summary statistics in the third row of Table 1. Since the yen appreciated
8 This was pointed out by one referee.
Table 3
Tests for the order of ARCH e�ects in trading volumesa
Null hypothesis Alt. hypothesis LM statistic p-value
ARCH(0) ARCH(1) v2(1)� 13.1 0.00
ARCH(0) ARCH(5) v2(5)� 24.0 0.00
ARCH(2) ARCH(3) v2(1)� 5.63 0.02
ARCH(2) ARCH(4) v2(2)� 7.06 0.03
ARCH(3) ARCH(4) v2(1)� 1.42 0.23
ARCH(3) ARCH(5) v2(2)� 1.70 0.43
a Notes: Lagrange-multiplier (LM) test proposed by Engle (1982) and Bollerslev (1986), regressing
squared residuals on a constant and lagged squared residuals. The LM statistic is TR2, which
follows a v2 distribution with the number of degrees of freedom equal to the di�erence in the
number of parameters between the more constrained and the less constrained regression.
9 I am most grateful to Olsen & Associates (Zurich) for providing these data.
P. Hartmann / Journal of Banking & Finance 23 (1999) 801±824 811
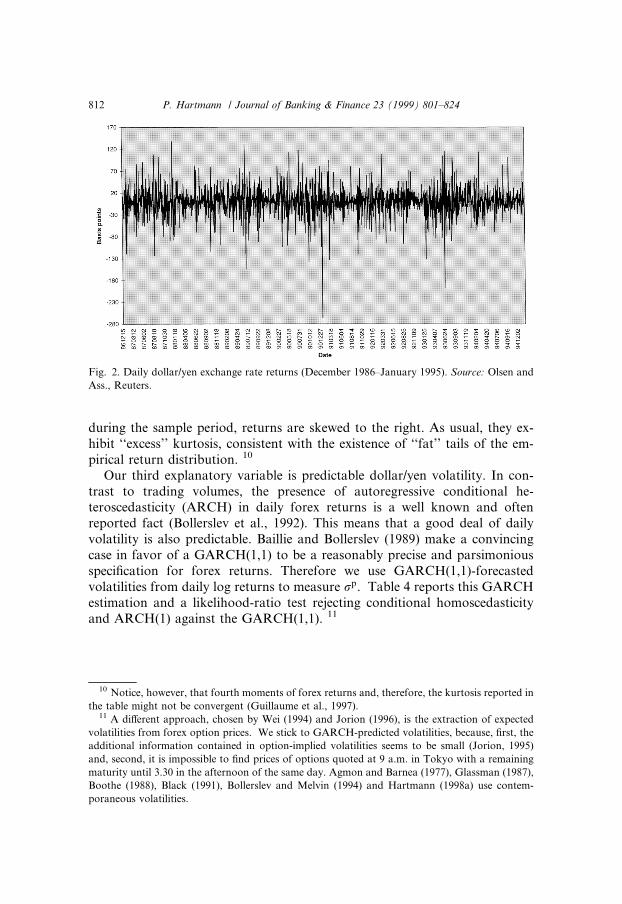
during the sample period, returns are skewed to the right. As usual, they ex-hibit ``excess'' kurtosis, consistent with the existence of ``fat'' tails of the em-pirical return distribution. 10
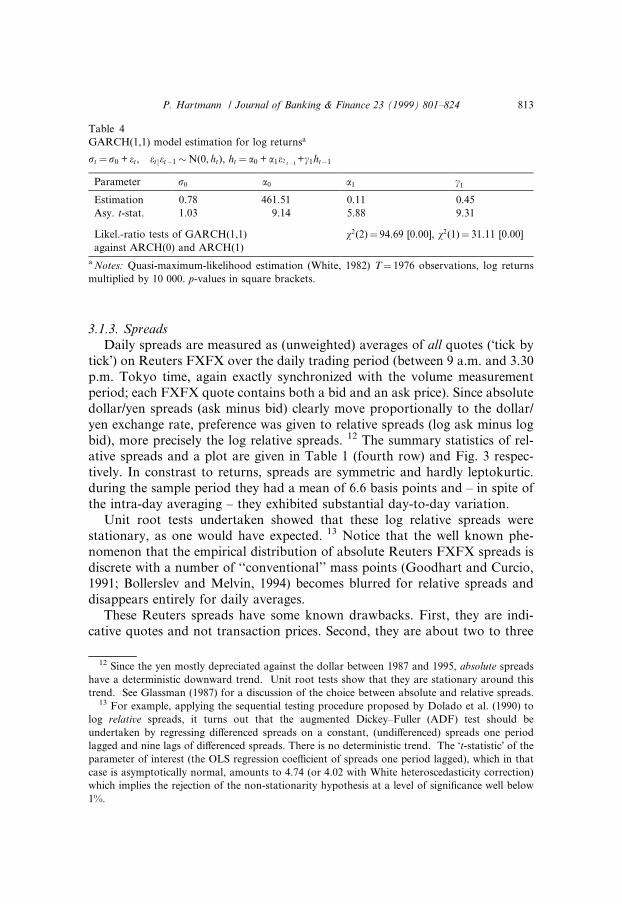
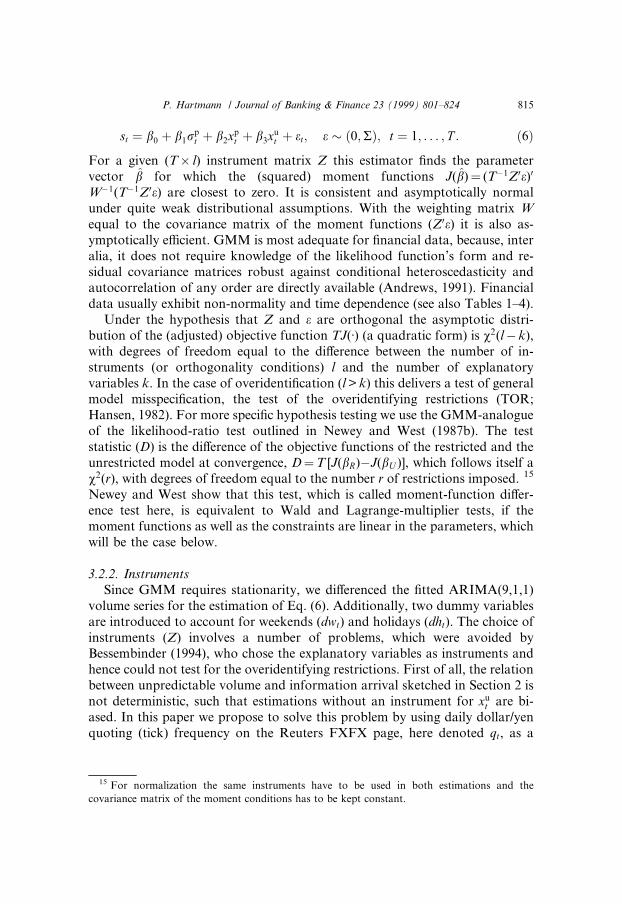
Our third explanatory variable is predictable dollar/yen volatility. In con-trast to trading volumes, the presence of autoregressive conditional he-teroscedasticity (ARCH) in daily forex returns is a well known and oftenreported fact (Bollerslev et al., 1992). This means that a good deal of dailyvolatility is also predictable. Baillie and Bollerslev (1989) make a convincingcase in favor of a GARCH(1,1) to be a reasonably precise and parsimoniousspeci®cation for forex returns. Therefore we use GARCH(1,1)-forecastedvolatilities from daily log returns to measure rp. Table 4 reports this GARCHestimation and a likelihood-ratio test rejecting conditional homoscedasticityand ARCH(1) against the GARCH(1,1). 11
10 Notice, however, that fourth moments of forex returns and, therefore, the kurtosis reported in
the table might not be convergent (Guillaume et al., 1997).11 A di�erent approach, chosen by Wei (1994) and Jorion (1996), is the extraction of expected
volatilities from forex option prices. We stick to GARCH-predicted volatilities, because, ®rst, the
additional information contained in option-implied volatilities seems to be small (Jorion, 1995)
and, second, it is impossible to ®nd prices of options quoted at 9 a.m. in Tokyo with a remaining
maturity until 3.30 in the afternoon of the same day. Agmon and Barnea (1977), Glassman (1987),
Boothe (1988), Black (1991), Bollerslev and Melvin (1994) and Hartmann (1998a) use contem-
poraneous volatilities.
Fig. 2. Daily dollar/yen exchange rate returns (December 1986±January 1995). Source: Olsen and
Ass., Reuters.
812 P. Hartmann / Journal of Banking & Finance 23 (1999) 801±824
3.1.3. SpreadsDaily spreads are measured as (unweighted) averages of all quotes (Ôtick by
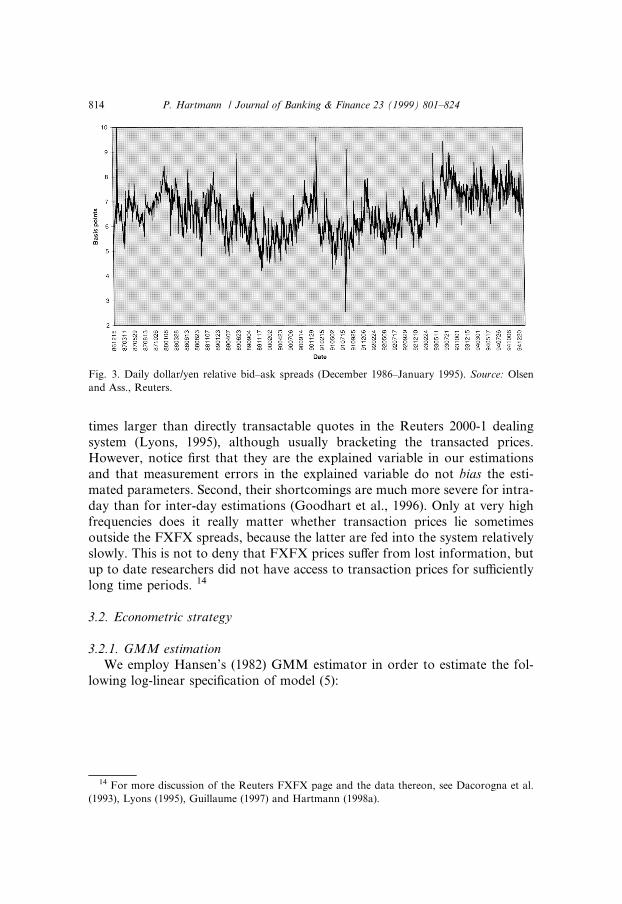
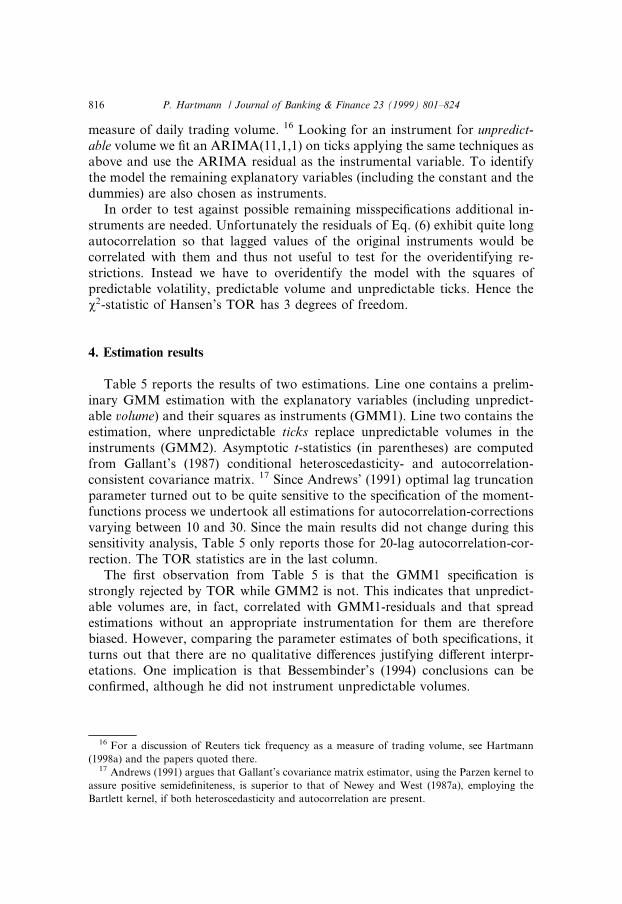
tickÕ) on Reuters FXFX over the daily trading period (between 9 a.m. and 3.30p.m. Tokyo time, again exactly synchronized with the volume measurementperiod; each FXFX quote contains both a bid and an ask price). Since absolutedollar/yen spreads (ask minus bid) clearly move proportionally to the dollar/yen exchange rate, preference was given to relative spreads (log ask minus logbid), more precisely the log relative spreads. 12 The summary statistics of rel-ative spreads and a plot are given in Table 1 (fourth row) and Fig. 3 respec-tively. In constrast to returns, spreads are symmetric and hardly leptokurtic.during the sample period they had a mean of 6.6 basis points and ± in spite ofthe intra-day averaging ± they exhibited substantial day-to-day variation.
Unit root tests undertaken showed that these log relative spreads werestationary, as one would have expected. 13 Notice that the well known phe-nomenon that the empirical distribution of absolute Reuters FXFX spreads isdiscrete with a number of ``conventional'' mass points (Goodhart and Curcio,1991; Bollerslev and Melvin, 1994) becomes blurred for relative spreads anddisappears entirely for daily averages.
These Reuters spreads have some known drawbacks. First, they are indi-cative quotes and not transaction prices. Second, they are about two to three
Table 4
GARCH(1,1) model estimation for log returnsa
rt �r0 + et, et jetÿ1�N(0, ht), ht � a0 + a1e2 t ÿ1+c1htÿ1
Parameter r0 a0 a1 c1
Estimation 0.78 461.51 0.11 0.45
Asy. t-stat. 1.03 9.14 5.88 9.31
Likel.-ratio tests of GARCH(1,1)
against ARCH(0) and ARCH(1)
v2(2)� 94.69 [0.00], v2(1)� 31.11 [0.00]
a Notes: Quasi-maximum-likelihood estimation (White, 1982) T� 1976 observations, log returns
multiplied by 10 000. p-values in square brackets.
12 Since the yen mostly depreciated against the dollar between 1987 and 1995, absolute spreads
have a deterministic downward trend. Unit root tests show that they are stationary around this
trend. See Glassman (1987) for a discussion of the choice between absolute and relative spreads.13 For example, applying the sequential testing procedure proposed by Dolado et al. (1990) to
log relative spreads, it turns out that the augmented Dickey±Fuller (ADF) test should be
undertaken by regressing di�erenced spreads on a constant, (undi�erenced) spreads one period
lagged and nine lags of di�erenced spreads. There is no deterministic trend. The Ôt-statisticÕ of the
parameter of interest (the OLS regression coe�cient of spreads one period lagged), which in that
case is asymptotically normal, amounts to 4.74 (or 4.02 with White heteroscedasticity correction)
which implies the rejection of the non-stationarity hypothesis at a level of signi®cance well below
1%.
P. Hartmann / Journal of Banking & Finance 23 (1999) 801±824 813
times larger than directly transactable quotes in the Reuters 2000-1 dealingsystem (Lyons, 1995), although usually bracketing the transacted prices.However, notice ®rst that they are the explained variable in our estimationsand that measurement errors in the explained variable do not bias the esti-mated parameters. Second, their shortcomings are much more severe for intra-day than for inter-day estimations (Goodhart et al., 1996). Only at very highfrequencies does it really matter whether transaction prices lie sometimesoutside the FXFX spreads, because the latter are fed into the system relativelyslowly. This is not to deny that FXFX prices su�er from lost information, butup to date researchers did not have access to transaction prices for su�cientlylong time periods. 14
3.2. Econometric strategy
3.2.1. GMM estimationWe employ Hansen's (1982) GMM estimator in order to estimate the fol-
lowing log-linear speci®cation of model (5):
14 For more discussion of the Reuters FXFX page and the data thereon, see Dacorogna et al.
(1993), Lyons (1995), Guillaume (1997) and Hartmann (1998a).
Fig. 3. Daily dollar/yen relative bid±ask spreads (December 1986±January 1995). Source: Olsen
and Ass., Reuters.
814 P. Hartmann / Journal of Banking & Finance 23 (1999) 801±824
st � b0 � b1rpt � b2xp
t � b3xut � et; e � �0;R�; t � 1; . . . ; T : �6�
For a given (T� l) instrument matrix Z this estimator ®nds the parametervector b̂ for which the (squared) moment functions J(b̂)� (Tÿ1Z0e)0
Wÿ1(Tÿ1Z0e) are closest to zero. It is consistent and asymptotically normalunder quite weak distributional assumptions. With the weighting matrix Wequal to the covariance matrix of the moment functions (Z0e) it is also as-ymptotically e�cient. GMM is most adequate for ®nancial data, because, interalia, it does not require knowledge of the likelihood function's form and re-sidual covariance matrices robust against conditional heteroscedasticity andautocorrelation of any order are directly available (Andrews, 1991). Financialdata usually exhibit non-normality and time dependence (see also Tables 1±4).
Under the hypothesis that Z and e are orthogonal the asymptotic distri-bution of the (adjusted) objective function TJ(á) (a quadratic form) is v2(lÿ k),with degrees of freedom equal to the di�erence between the number of in-struments (or orthogonality conditions) l and the number of explanatoryvariables k. In the case of overidenti®cation (l > k) this delivers a test of generalmodel misspeci®cation, the test of the overidentifying restrictions (TOR;Hansen, 1982). For more speci®c hypothesis testing we use the GMM-analogueof the likelihood-ratio test outlined in Newey and West (1987b). The teststatistic (D) is the di�erence of the objective functions of the restricted and theunrestricted model at convergence, D�T [J(bR)ÿJ(bU )], which follows itself av2(r), with degrees of freedom equal to the number r of restrictions imposed. 15
Newey and West show that this test, which is called moment-function di�er-ence test here, is equivalent to Wald and Lagrange-multiplier tests, if themoment functions as well as the constraints are linear in the parameters, whichwill be the case below.
3.2.2. InstrumentsSince GMM requires stationarity, we di�erenced the ®tted ARIMA(9,1,1)
volume series for the estimation of Eq. (6). Additionally, two dummy variablesare introduced to account for weekends (dwt) and holidays (dht). The choice ofinstruments (Z) involves a number of problems, which were avoided byBessembinder (1994), who chose the explanatory variables as instruments andhence could not test for the overidentifying restrictions. First of all, the relationbetween unpredictable volume and information arrival sketched in Section 2 isnot deterministic, such that estimations without an instrument for xu
t are bi-ased. In this paper we propose to solve this problem by using daily dollar/yenquoting (tick) frequency on the Reuters FXFX page, here denoted qt, as a
15 For normalization the same instruments have to be used in both estimations and the
covariance matrix of the moment conditions has to be kept constant.
P. Hartmann / Journal of Banking & Finance 23 (1999) 801±824 815
measure of daily trading volume. 16 Looking for an instrument for unpredict-able volume we ®t an ARIMA(11,1,1) on ticks applying the same techniques asabove and use the ARIMA residual as the instrumental variable. To identifythe model the remaining explanatory variables (including the constant and thedummies) are also chosen as instruments.
In order to test against possible remaining misspeci®cations additional in-struments are needed. Unfortunately the residuals of Eq. (6) exhibit quite longautocorrelation so that lagged values of the original instruments would becorrelated with them and thus not useful to test for the overidentifying re-strictions. Instead we have to overidentify the model with the squares ofpredictable volatility, predictable volume and unpredictable ticks. Hence thev2-statistic of Hansen's TOR has 3 degrees of freedom.
4. Estimation results
Table 5 reports the results of two estimations. Line one contains a prelim-inary GMM estimation with the explanatory variables (including unpredict-able volume) and their squares as instruments (GMM1). Line two contains theestimation, where unpredictable ticks replace unpredictable volumes in theinstruments (GMM2). Asymptotic t-statistics (in parentheses) are computedfrom Gallant's (1987) conditional heteroscedasticity- and autocorrelation-consistent covariance matrix. 17 Since Andrews' (1991) optimal lag truncationparameter turned out to be quite sensitive to the speci®cation of the moment-functions process we undertook all estimations for autocorrelation-correctionsvarying between 10 and 30. Since the main results did not change during thissensitivity analysis, Table 5 only reports those for 20-lag autocorrelation-cor-rection. The TOR statistics are in the last column.
The ®rst observation from Table 5 is that the GMM1 speci®cation isstrongly rejected by TOR while GMM2 is not. This indicates that unpredict-able volumes are, in fact, correlated with GMM1-residuals and that spreadestimations without an appropriate instrumentation for them are thereforebiased. However, comparing the parameter estimates of both speci®cations, itturns out that there are no qualitative di�erences justifying di�erent interpr-etations. One implication is that Bessembinder's (1994) conclusions can becon®rmed, although he did not instrument unpredictable volumes.
16 For a discussion of Reuters tick frequency as a measure of trading volume, see Hartmann
(1998a) and the papers quoted there.17 Andrews (1991) argues that Gallant's covariance matrix estimator, using the Parzen kernel to
assure positive semide®niteness, is superior to that of Newey and West (1987a), employing the
Bartlett kernel, if both heteroscedasticity and autocorrelation are present.
816 P. Hartmann / Journal of Banking & Finance 23 (1999) 801±824
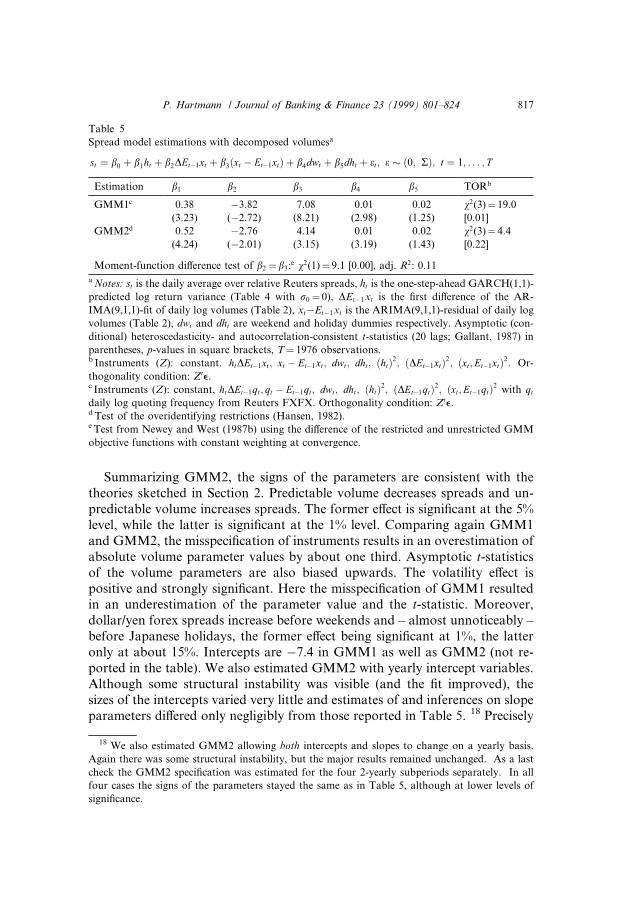
Summarizing GMM2, the signs of the parameters are consistent with thetheories sketched in Section 2. Predictable volume decreases spreads and un-predictable volume increases spreads. The former e�ect is signi®cant at the 5%level, while the latter is signi®cant at the 1% level. Comparing again GMM1and GMM2, the misspeci®cation of instruments results in an overestimation ofabsolute volume parameter values by about one third. Asymptotic t-statisticsof the volume parameters are also biased upwards. The volatility e�ect ispositive and strongly signi®cant. Here the misspeci®cation of GMM1 resultedin an underestimation of the parameter value and the t-statistic. Moreover,dollar/yen forex spreads increase before weekends and ± almost unnoticeably ±before Japanese holidays, the former e�ect being signi®cant at 1%, the latteronly at about 15%. Intercepts are ÿ7.4 in GMM1 as well as GMM2 (not re-ported in the table). We also estimated GMM2 with yearly intercept variables.Although some structural instability was visible (and the ®t improved), thesizes of the intercepts varied very little and estimates of and inferences on slopeparameters di�ered only negligibly from those reported in Table 5. 18 Precisely
Table 5
Spread model estimations with decomposed volumesa
st � b0 � b1ht � b2DEtÿ1xt � b3�xt ÿ Etÿ1xt� � b4dwt � b5dht � et; e � 0; R� �; t � 1; . . . ; T
Estimation b1 b2 b3 b4 b5 TORb
GMM1c 0.38 ÿ3.82 7.08 0.01 0.02 v2(3)� 19.0
(3.23) (ÿ2.72) (8.21) (2.98) (1.25) [0.01]
GMM2d 0.52 ÿ2.76 4.14 0.01 0.02 v2(3)� 4.4
(4.24) (ÿ2.01) (3.15) (3.19) (1.43) [0.22]
Moment-function di�erence test of b2�b3:e v2(1)� 9.1 [0.00], adj. R2: 0.11
a Notes: st is the daily average over relative Reuters spreads, ht is the one-step-ahead GARCH(1,1)-
predicted log return variance (Table 4 with r0� 0), DEtÿ1xt is the ®rst di�erence of the AR-
IMA(9,1,1)-®t of daily log volumes (Table 2), xtÿEtÿ1xt is the ARIMA(9,1,1)-residual of daily log
volumes (Table 2), dwt and dht are weekend and holiday dummies respectively. Asymptotic (con-
ditional) heteroscedasticity- and autocorrelation-consistent t-statistics (20 lags; Gallant, 1987) in
parentheses, p-values in square brackets, T� 1976 observations.b Instruments (Z): constant. htDEtÿ1xt; xt ÿ Etÿ1xt; dwt; dht; �ht�2; �DEtÿ1xt�2; �xt;Etÿ1xt�2. Or-
thogonality condition: Z0e.c Instruments (Z): constant, htDEtÿ1qt; qt ÿ Etÿ1qt; dwt; dht; �ht�2; �DEtÿ1qt�2; �xt;Etÿ1qt�2 with qt
daily log quoting frequency from Reuters FXFX. Orthogonality condition: Z0e.d Test of the overidentifying restrictions (Hansen, 1982).e Test from Newey and West (1987b) using the di�erence of the restricted and unrestricted GMM
objective functions with constant weighting at convergence.
18 We also estimated GMM2 allowing both intercepts and slopes to change on a yearly basis.
Again there was some structural instability, but the major results remained unchanged. As a last
check the GMM2 speci®cation was estimated for the four 2-yearly subperiods separately. In all
four cases the signs of the parameters stayed the same as in Table 5, although at lower levels of
signi®cance.
P. Hartmann / Journal of Banking & Finance 23 (1999) 801±824 817
the same results as for GMM2 occurred, when overidenti®cation was achievedwith third moments of the instruments instead of second moments as inGMM2.
The negative impact of predictable volume on spreads suggests the presenceof important order processing e�ects on forex spot spreads. (This correspondsto recent research on stock market spreads, also ®nding an important orderprocessing cost component (de Jong et al., 1995).) As could be expected, theseorder processing cost e�ects are not swamped by possible positive inventorycost e�ects of block trading. Furthermore, the strong e�ects of predictablevolatility (positive) and unpredictable volume (new information arrival, posi-tive) indicate the presence of important other inventory and information costcomponents. The statistical weakness of the holiday e�ect compared to theweekend e�ect on spreads can be explained by the fact that, in many cases,other large forex trading centers, for example London or New York, remainopen when there is a Japanese banking holiday (JP Morgan, 1994).
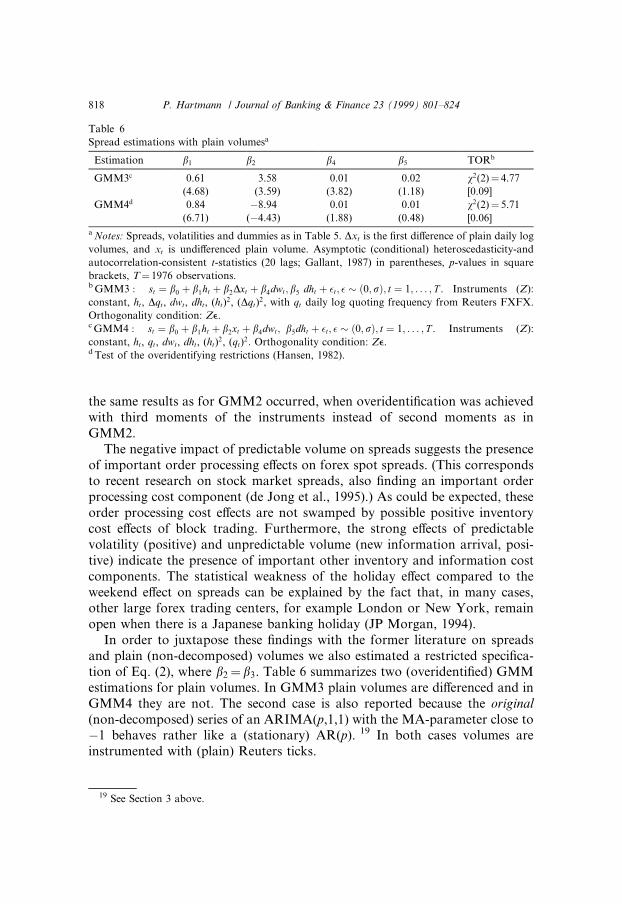
In order to juxtapose these ®ndings with the former literature on spreadsand plain (non-decomposed) volumes we also estimated a restricted speci®ca-tion of Eq. (2), where b2� b3. Table 6 summarizes two (overidenti®ed) GMMestimations for plain volumes. In GMM3 plain volumes are di�erenced and inGMM4 they are not. The second case is also reported because the original(non-decomposed) series of an ARIMA(p,1,1) with the MA-parameter close toÿ1 behaves rather like a (stationary) AR(p). 19 In both cases volumes areinstrumented with (plain) Reuters ticks.
Table 6
Spread estimations with plain volumesa
Estimation b1 b2 b4 b5 TORb
GMM3c 0.61 3.58 0.01 0.02 v2(2)� 4.77
(4.68) (3.59) (3.82) (1.18) [0.09]
GMM4d 0.84 ÿ8.94 0.01 0.01 v2(2)� 5.71
(6.71) (ÿ4.43) (1.88) (0.48) [0.06]
a Notes: Spreads, volatilities and dummies as in Table 5. Dxt is the ®rst di�erence of plain daily log
volumes, and xt is undi�erenced plain volume. Asymptotic (conditional) heteroscedasticity-and
autocorrelation-consistent t-statistics (20 lags; Gallant, 1987) in parentheses, p-values in square
brackets, T� 1976 observations.b GMM3 : st � b0 � b1ht � b2Dxt � b4dwt;b5 dht � �t; � � �0;r�; t � 1; . . . ; T . Instruments (Z):
constant, ht, Dqt, dwt, dht, (ht)2, (Dqt)
2, with qt daily log quoting frequency from Reuters FXFX.
Orthogonality condition: Ze.c GMM4 : st � b0 � b1ht � b2xt � b4dwt; b5dht � �t; � � �0; r�; t � 1; . . . ; T . Instruments (Z):
constant, ht, qt, dwt, dht, (ht)2, (qt)
2. Orthogonality condition: Ze.d Test of the overidentifying restrictions (Hansen, 1982).
19 See Section 3 above.
818 P. Hartmann / Journal of Banking & Finance 23 (1999) 801±824
The parameter estimates for GMM3 are largely analogous to those found inGlassman (1987) and Wei (1994). Relative spreads seem to increase with plaintrading volume. In other words, one is tempted to infer that the informationcost component seems to dominate the other spread components related tovolumes. However, in GMM4 the volume parameter is negative. In any case,Newey and West's (1987b) moment-functions di�erence test strongly rejects thenull of equality of b2 and b3 (Table 5, last row). Furthermore, contrary to the®ndings for decomposed volumes (Table 5), in both cases with plain volumesTOR rejects at a signi®cance level lower than 10% (Table 6, last column). Theseresults give a warning that predictable daily transaction volume should not bemixed with information-related surprises in trading. Since the parameter esti-mates in Table 6 appear to be inconsistent, it cannot be excluded that ± overall± relative spreads decrease with higher volume, even in the short run.
Our results also need to be delineated from recent tests of microstructuralhypotheses in the foreign exchange market with intra-day high-frequencytransactions data. Lyons (1995) recorded the transactions of one dealer andone broker in the US market for 5 days in August 1992. He then uses an ex-tended version of Madhavan and Smidt's (Madhavan and Smidt, 1991)Bayesian pricing model to test for the existence of inventory cost and infor-mation cost components in dollar/mark exchange rate changes. The model alsoallows one to draw some inferences on the relation between trading ``volume''and bid±ask spreads, because it considers a dealer quoting a complete priceschedule, which is di�erentiated according to transaction sizes as well astransaction directions, with a symmetric execution cost mark-up at each pricefor sale (positive) and purchase orders (negative). In this model the quotedspread, is larger for larger transaction sizes, since the dealer associates largerorders with an increased likelihood of an information disadvantage. Lyons'econometric results con®rm the positive correlation.
This approach and the underlying data are very di�erent from those in thepresent paper. First, Lyons' speci®cation is in transaction time and not in realtime with on average 267 dealer transactions per day (median inter-transactiontime less than 2 minutes) and therefore ultra-short term. His sample is set upfrom two individual institutions, while our data are aggregated over all Jap-anese forex brokers. His ``volume'' measure is basically the size of singletransactions, while ours gives more emphasis to daily transaction frequency.Also Lyons' theory aims at very short-term horizons. For example, possibleeconomies of scale in market making through order processing e�ects are notconsidered at all.
In a companion paper Lyons (1996) uses the same framework to test morespeci®cally for the information content of transaction sizes when trading ``in-tensity'' is high or low. He contrasts an ``event-uncertainty hypothesis'',claiming that trades are more informative (and hence price changes larger) whenintensity is high, with the opposing ``hot-potato hypothesis''. His estimations
P. Hartmann / Journal of Banking & Finance 23 (1999) 801±824 819
support one or the other hypothesis depending on the measure of trading in-tensity employed, underlining the possible complementarity of both views atvery short time horizons. Notice that neither of these two views is in con-tradiction with the approach taken in this paper, claiming that the unpredict-able part of daily trading volumes re¯ects the daily rate of information arrivaland therefore most of the information asymmetry costs for forex dealers. Inthis respect it is also instructive to look at some stock-market evidence fromNASDAQ-NMS, which is an inter-dealer market as well. For this marketJones et al. (1994) ®nd ± for daily data ± that transaction sizes have no in-formation content beyond that already contained in transaction frequency,reinforcing the usefulness of the mixture of distributions hypothesis.
5. Conclusions
In this paper it was argued that time-series estimations of the daily relationbetween spot foreign exchange spreads and plain trading volumes fail toconsider the fact that, to a large extent, trading volume (like volatility) in thismarket is predictable. The informational content of trading volumes is likely toexist in the unpredictable component, and following Bessembinder (1994) it isargued here that the impact of this component is likely to be of the oppositesign to that of predictable volume.
A GMM estimation of forex spreads expectedly shows that unpredictablevolumes drive spreads up while predictable volumes drives them down. With aunique daily dollar/yen volume data set, precisely synchronous exchange ratedata and proper instrumenting of endogenous unpredictable volumes, the ef-fects turn out to be strongly signi®cant. These results provide evidence in favorof information cost e�ects on spreads and economies of scale in marketmaking. One implication is that ± at least in the short run ± growing (shrinking)trading activity may increase (reduce) transaction costs. However, cross-sectionevidence over currency pairs suggests that this is unlikely to hold in the longrun (Black, 1991; Hartmann, 1998a, b). Moreover, in the present study, dailytime-series estimations of spreads with plain volumes turn out to be misspec-i®ed. Therefore the results showing a positive correlation between these twovariables should be interpreted with caution.
By studying a new data set of daily dollar/yen forex trading volumes, we arealso able to show for the ®rst time that ± similar to exchange rate returns ±volumes exhibit conditional heteroskedasticity. More precisely, ARCH e�ectsturn out to be of the order of 3 business days.
It comes immediately to mind that, in a market as active as that for foreignexchange, one might want to further reduce the time horizon for spread esti-mations and pass to intra-day analyses. The lack of turnover data at higherfrequencies might be overcome through the use of Reuters quoting frequency
820 P. Hartmann / Journal of Banking & Finance 23 (1999) 801±824
as a proxy for trading activity (Bollerslev and Domowitz, 1993; Dav�e, 1993;Demos and Goodhart, 1992; Hartmann, 1998a, b). Moreover, one might wantto pass from global turnover to dealer order ¯ows and from quoted spreads totraded spreads in order to better disentangle the di�erent channels throughwhich trading volume a�ects transaction costs in the very short run (Lyons,1995, 1996). However, it is uncertain whether these data will become availablefor researchers with the necessary coverage in the near future. Finally, mea-surement of expected volatility might be improvable by replacing GARCH-forecasts with implied volatilities in forex-options prices (Jorion, 1995). Thischange seems to be unlikely to alter the results found in the present paper(Jorion, 1996). Another approach to better track expected volatilities couldinvolve the use of stochastic volatility models (Andersen, 1994).
Acknowledgements
I thank Richard Portes for his support and advice. I am also grateful toRakhal Dav�e from Olsen & Associates for drawing part of the data from theO & A databank and to Clint Cummins from TSP International for someprogramming tricks. Comments received from Alvaro Almeida, FrancisBreedon, Ward Brown, Bernard Dumas, J�urgen von Hagen, Frank de Jong,Richard Payne and three anonymous referees, as well as from participants ofconferences at Universit�e de Paris I (Panth�eon Sorbonne), London BusinessSchool (MMF 96) and the Verein f�ur Socialpolitik Annual Meeting and ofseminars at LSE, DELTA, LIFE and the Bank of England were very helpful.Financial support from the Commission of the European Union (HumanCapital and Mobility Programme, contract CHRX-CT94-0648) and the Eco-nomic and Social Research Council (ESRC) is gratefully acknowledged.
References
Agmon, T., Barnea, A., 1977. Transaction costs and marketability services in the eurocurrency
money market. Journal of Monetary Economics 3 (3), 359±366.
Andersen, T., 1994. Stochastic autoregressive volatility: A framework for volatility modeling.
Mathematical Finance 4, 75±102.
Andersen, T., 1995. Return volatility and trading volume: An information ¯ow interpretation of
stochastic volatility. Journal of Finance 51 (1), 169±204.
Andrews, D., 1991. Heteroskedasticity and autocorrelation consistent covariance matrix estima-
tion. Econometrica 59 (3), 817±858.
Baillie, R., Bollerslev, T., 1989. The message in daily exchange rates: A conditional variance tail.
Journal of Business and Economic Statistics 7 (3), 297±305.
Bank for International Settlements, 1993. Central bank survey of foreign exchange market activity
in April 1992. BIS, Basle, March.
P. Hartmann / Journal of Banking & Finance 23 (1999) 801±824 821
Bank for International Settlements, 1996. Central bank survey of foreign exchange and derivatives
market activity 1995. BIS, Basle, May.
Bank of Japan, 1993. Summary of results of the Tokyo foreign exchange market turnover survey.
Bank of Japan Quarterly Bulletin, February, pp. 37±45.
Berry, T., Howe, K., 1994. Public information arrival. Journal of Finance 49 (4), 1331±1346.
Bessembinder, H., 1994. Bid±ask spreads in the interbank foreign exchange markets. Journal of
Financial Economics 35 (3), 317±348.
Black, S., 1991. Transaction costs and vehicle currencies. Journal of International Money and
Finance 3 (2), 209±222.
Bollerslev, T., 1986. Generalized autoregressive conditional heteroscedasticity. Journal of Econo-
metrics 31, 307±327.
Bollerslev, T., Chou, R., Kroner, K., 1992. ARCH modeling in ®nance ± a review of the theory and
empirical evidence. Journal of Econometrics 52, 5±59.
Bollerslev, T., Domowitz, I., 1993. Trading patterns and prices in the interbank foreign exchange
market. Journal of Finance 48 (4), 1421±1443.
Bollerslev, T., Melvin, M., 1994. Bid±ask spreads and volatlility in the foreign exchange market: an
empirical analysis. Journal of International Economic 36 (3/4), 355±372.
Boothe, P., 1988. Exchange rate risk and the bid±ask spread: A seven country comparison.
Economic Inquiry 26 (3), 485±492.
Campbell, J., Perron, P., 1991. Pittfalls and opportunities: What macroeconomists should know
about unit roots. NBER Macroeconomics Annual, Cambridge, MA.
Clark, P., 1973. A subordinated stochastic process model with ®nite variance for speculative prices.
Econometrica 41 (1), 135±155.
Copeland, T., Galai, D., 1983. Information e�ects on the bid±ask spread. Journal of Finance 38 (5),
1457±1469.
Dacorogna, M., M�uller, U., Nagler, R., Olsen, R., Pictet, O., 1993. A geographical model for the
daily and weekly seasonal volatility in the foreign exchange market. Journal of International
Money and Finance 12, 413±438.
Dav�e, R., 1993. Statistical correlation of data frequency, price change, and spread. Olsen and
Associates, Internal Document, RDD.1993-04-26, April, Zurich.
de Jong, F., Nijman, T., R�oell, A., 1995. A comparison of the cost of trading French shares on the
Paris Bourse and on SEAQ International. European Economic Review 39 (7), 1277±1301.
Demos, A., Goodhart, C., 1992. The interaction between the frequency of market quotations,
spread, and volatility in the foreign exchange market, London School of Economics. Financial
Markets Group Discussion Papers, no. 152, October.
Demsetz, H., 1968. The cost of transacting. Quarterly Journal of Economics 82 (1), 33±53.
Dolado, J., Jenkinson, T., Sosvilla-Rivero, S., 1990. Cointegraton and unit roots. Journal of
Economic Surveys 4 (3), 249±273.
Dumas, B., 1996. Comment. In: Frankel, J., Galli, G., Giovannini, A. (Eds.), The Microstructure
of Foreign Exchange Markets. University of Chicago Press, Chicago, IL, pp. 37±40.
Easley, D., O'Hara, M., 1992. Time and the process of security price adjustment. Journal of
Finance 47 (2), 577±605.
Engle, R., 1982. Autoregressive conditional heteroskedasticity with estimates of the variance of
U.K. in¯ation. Econometrica 50, 987±1008.
Epps, T., Epps, M., 1976. The stochastic dependence of security price changes and transaction
volumes: Implications for the mixture-of-distributions hypothesis. Econometrica 44 (2), 305±
321.
Federal Reserve Bank of New York, 1992. Summary of results of the U.S. foreign exchange market
turnover survey conducted in April 1992 by the Federal Reserve Bank of New York, New York.
Flood, M., 1991. Microstructure theory and the foreign exchange market. Federal Reserve Bank of
St. Louis Economic Review, November/December, 52±70.
822 P. Hartmann / Journal of Banking & Finance 23 (1999) 801±824
Foster, A., 1995. Volume±volatility relationships for crude oil futures markets. Journal of Futures
Markets 15 (8), 929±951.
Foster, D., Viswanathan, S., 1995. Can speculative trading explain the volume±volatility relation?
Journal of Business and Economic Statistics 13 (4), 379±396.
Gallant, A., 1987. Nonlinear statistical models. Wiley, New York.
Glassman, D., 1987. Exchange rate risk and transaction costs: Evidence from bid±ask spreads.
Journal of International Money and Finance 6 (4), 481±490.
Glosten, L., Milgrom, P., 1985. Bid, ask and transaction prices in a specialist market with
heterogeneously informed traders. Journal of Financial Economics 14, 71±100.
Goodhart, C., Curcio, R., 1991. The clustering of bid/ask prices and the spread in the foreign
exchange market, Financial Markets Group Discussion Papers, no. 110. London School of
Economics.
Goodhart, C., Ito, T., Payne, R., 1996. One day in June, 1993: a study of the working of Reuters
2000-2 electronic foreign exchange trading system. In: Frankel, J., Galli, G., Giovannini, A.
(Eds.), The Microstructure of Foreign Exchange Markets. University of Chicago Press,
Chicago, IL, pp. 107±179.
Guillaume, D., Dacorogna, M., Dav�e, R., M�uller, U., Olsen, R., Pictet, O., 1997. From the bird's
eye to the microscope: A survey of new stylized facts of the intra-daily foreign exchange
markets. Finance and Stochastics 1, 95±129.
Hansen, L., 1982. Large sample properties of generalized method of moments estimators.
Econometrica 50 (4), 1029±1054.
Harris, L., 1987. Transaction data tests of the mixture of distributions hypothesis. Journal of
Financial and Quantitative Analysis 22 (3), 127±141.
Hartmann, P., 1994. Vehicle currencies in the foreign exchange market. Discussion paper, no. 94-
13, DELTA, Paris, June.
Hartmann, P., 1997. Foreign exchange vehicles before and after EMU: From dollar/mark to dollar/
euro? In: Welfens, P. (Ed.), European Monetary Union: Transition, International Impact and
Policy Options. Springer, Berlin, pp. 133±155.
Hartmann, P., 1998a. Do Reuters spreads re¯ect currencies' di�erences in global trading activity.
Journal of International Money and Finance 17 (5), 757±784.
Hartmann, P., 1998b. Currency Competition and Foreign Exchange Markets. Cambridge
University Press, Cambridge (forthcoming).
Harvey, A., 1981. Time Series Models. Oxford University Press, Oxford.
Ho, T., Stoll, H., 1981. Optimal dealer pricing under transactions and return uncertainty. Journal
of Financial Economics 9, 47±73.
Jobert, T., 1992. Test de racine unitaire: Une strat�egie et sa mise en oeuvre. Cahiers de Recherche
Economie, Math�ematiques et Applications, no. 92.44. Universit�e de Paris I ± Panth�eon-
Sorbonne.
Jones, C., Kaul, G., Lipson, M., 1994. Transactions, volume, and volatility. Review of Financial
Studies 7 (4), 631±651.
Jorion, P., 1995. Predicting volatility in the foreign exchange market. Journal of Finance 50 (2),
507±528.
Jorion, P., 1996. Risk and turnover in the foreign exchange market. Frankel, J., Galli, G.,
Giovannini, A. (Eds.), The Microstructure of Foreign Exchange Markets. University of
Chicago Press, Chicago, IL, pp. 19±37.
JP Morgan, 1994. World Holiday and Time Guide. New York.
Karpo�, J., 1987. The relation between price changes and trading volume: A survey. Journal of
Financial and Quantitative Analysis 22 (1), 109±126.
Kim, K., Schmidt, P., 1993. Unit root tests with conditional heteroscedasticity. Journal of
Econometrics 59 (3), 287±300.
Kyle, A., 1985. Continuous auctions and insider trading. Econometrica 53 (6), 1315±1335.
P. Hartmann / Journal of Banking & Finance 23 (1999) 801±824 823
Lamoureux, C., Lastrapes, W., 1990. Heteroscedasticity in stock return data: Volume versus
GARCH e�ects. Journal of Finance 45 (1), 221±229.
Lyons, R., 1995. Tests of microstructural hypotheses in the foreign exchange market. Journal of
Financial Economics 39, 321±351.
Lyons, R., 1996. Foreign exchange volume: Sound and fury signifying nothing? In: Frankel, J.,
Galli, G., Giovannini, A. (Eds.), The Microstructure of Foreign Exchange Markets. University
of Chicago Press, Chicago, IL, pp. 183±201.
Madhavan, A., Smidt, S., 1991. A Bayesian model of intraday specialist pricing. Journal of
Financial Economics 30, 99±134.
Newey, W., West, K., 1987a. A simple positive semi-de®nite, heteroskedasticity and autocorre-
lation consistent covariance matrix. Econometrica 55, 703±708.
Newey, W., West, K., 1987b. Hypothesis testing with e�cient method of moments estimation.
International Economic Review 28 (3), 777±787.
Phillips, P., 1987. Asymptotic expansions in non-stationary vector autoregressions. Econometric
Theory 3 (1), 45±68.
Phillips, P., Perron, P., 1988. Testing for a unit root in time series regressions. Biometrika 75 (2),
335±346.
Stoll, H., 1978. The supply of dealer services in securities markets. Journal of Finance 33 (4), 1133±
1151.
Tauchen, G., Pitts, M., 1983. The price variability±volume relationship on speculative markets.
Econometrica 51, 485±505.
Theil, H., 1961. Economic Forecasts and Policy. North±Holland, Amsterdam.
Wei, S.-J., 1994. Anticipations of foreign exchange volatility and bid±ask spreads. Working paper,
no. 4737, NBER, Cambridge, MA, May.
White, H., 1980. A heteroscedasticity-consistent covariance matrix estimator and a direct test for
heteroscedasticity. Econometrica 48, 817±838.
White, H., 1982. Maximum likelihood estimation of misspeci®ed models. Econometrica 50 (1),
817±838.
824 P. Hartmann / Journal of Banking & Finance 23 (1999) 801±824