traffic and network flow model for assessing impact of 3d ... · • statistical data based on...
TRANSCRIPT

Traffic and Network Flow Model
for Assessing Impact of 3D
Applications on Internet
Dr Jonathan Loo
School of Engineering and Information Sciences,
Middlesex University, UK
Study collaborated with:
Prof John Cosmas
Dr Amar Aggoun
Dr Emmanuel Tsekleves
School of Engineering and Design, Brunel University, UK
Keynote Speech
ICWMC 2010, Polytechnic University of Valencia, Spain
24th September 2010

Keynote Outline
• Context and Scope
• Application Traffic Modelling
• Reference Network Modelling
• Conclusion

Context and Scope

Context
• 2006 Riga Ministerial Declaration on “e-Inclusion”:
– Emphasis on participation of all individuals and communities in all aspects of the
information society to improve economic performance, employment
opportunities, quality of life, social participation and cohesion.
• Wireless network is moving on...
– 3G communication network are delivering widespread mobile connectivity to
high-speed data services.
– 4G networks include 3G networks (LTE) and wireless broadband networks
based on the IEEE 802.16 standard (WiMAX) are started in operation.
• Optical IP networks are fast being deployed (in the UK and by 2015
around two thirds of all homes will have been reached).
– British Telecom pledges £1bn for fibre network. Virgin and Fibrecity are also
investing heavily in fibre network. Intended capacity of 25Gbps for access optical
network, and 40 to 100Gbps for Inter-regional optical networks.
Will caused a surge in the usage of internet-based application, thus the
traffic loading on core and access network.

The impact on the advent of new network
infrastructure to the home...
• Increase in diversity of internet-based applications and services.
• Increase in resolution and dimension of video media (2D to 3D,
higher frame rate).
• Increase in media access duration
– Society will become increasingly less reliant on travel and more reliant
on communication networks to interact with each other, socially and at
work, due to increasing cost of transport.

Scope of our study
• To examine the magnitude of traffic loading increases on the core
and access network.
• To develop a flexible traffic and network flow model as a reference for
the study.
• To define use case scenarios and modelling mixed heterogeneous
internet-based traffic flows especially to include the future 3D
applications/services.
• To investigate effect of peak hour and hourly traffic flows on the
reference network model.

Motivation of our study
• Given the projected future Internet traffic mixes and use case
scenarios:
– the dimension of the Internet’s contribution to core and access networks
– the existing Internet’s contribution to core and access network link
capacities whether it is sufficient to support the increased traffic loads
due to increased video resolutions and 3D video
• We want to develop a flow model, which is flexible and scalable that
allows us to answer these questions for existing and future predicted
traffic mixes, use case scenarios and reference network structures.

Application Traffic Modelling

Application Traffic
• The application traffic models for this study are built using a
spreadsheet tool, which captures the model characteristics, and
allows aggregate packet loads to be tallied, and resulting statistics to
be derived.
• The following traffic parameters are considered:
– Average Packet Call Object Size (Bytes)
– Average Over-head (Bytes)
– Inter-arrival (Sec)
– Session Time (Sec)
– Packet Calls / Session
– Average Session Size (Kbytes)
– Average Rate (kbps)

Application Traffic
• 8 applications of interest with up to total of 35 traffic variations have
been defined:
– 2D/3D Web Browser
– Streaming Video/IPTV (2D/3D Web, SDTV, HDTV Quality -
Clip/Programs)
– Streaming Audio (MP3, Web, Home Theatre Quality)
– Voice communication/VoIP (Toll, High Quality)
– 2D/3D Video Communications (Web, SDTV, HDTV Quality)
– P2P File Sharing (Small/Large)
– Interactive Gaming (Large & Slow, Small & Fast)
– Virtual Environment (Large & Slow, Small & Fast)

Application Traffic
• The application traffics are based on existing model and published
statistical data:
– Web browsing
• Statistically modelled based on empirical measurements of top web sites.
• Modelled as multiple downloads, interspaced by “read times”.
• Draft IEEE 802.16m Evaluation Methodology Document" - IEEE 802.16 BWA WG -
6/18/2007.
• "Application Traffic Model for WiMAX Simulation“ - Posdata - April 2007.
– Streaming video
• Statistical data based on MPEG4 video coding, the expected standard for future IPTV.
• "Global IP Traffic Forecast and Methodology, 2006 - 2011" - Cisco Systems – 2007.
• “MPEG-4 AVC to deliver greater bit-rate reduction in coming years,” Oct 24, 2006.
– Streaming Audio
• Statistical data based on MP3, which sends fixed-size audio frames at a constant rate
(128 kbps typical for recorded music, while rates may be used for voice).
Application Traffic
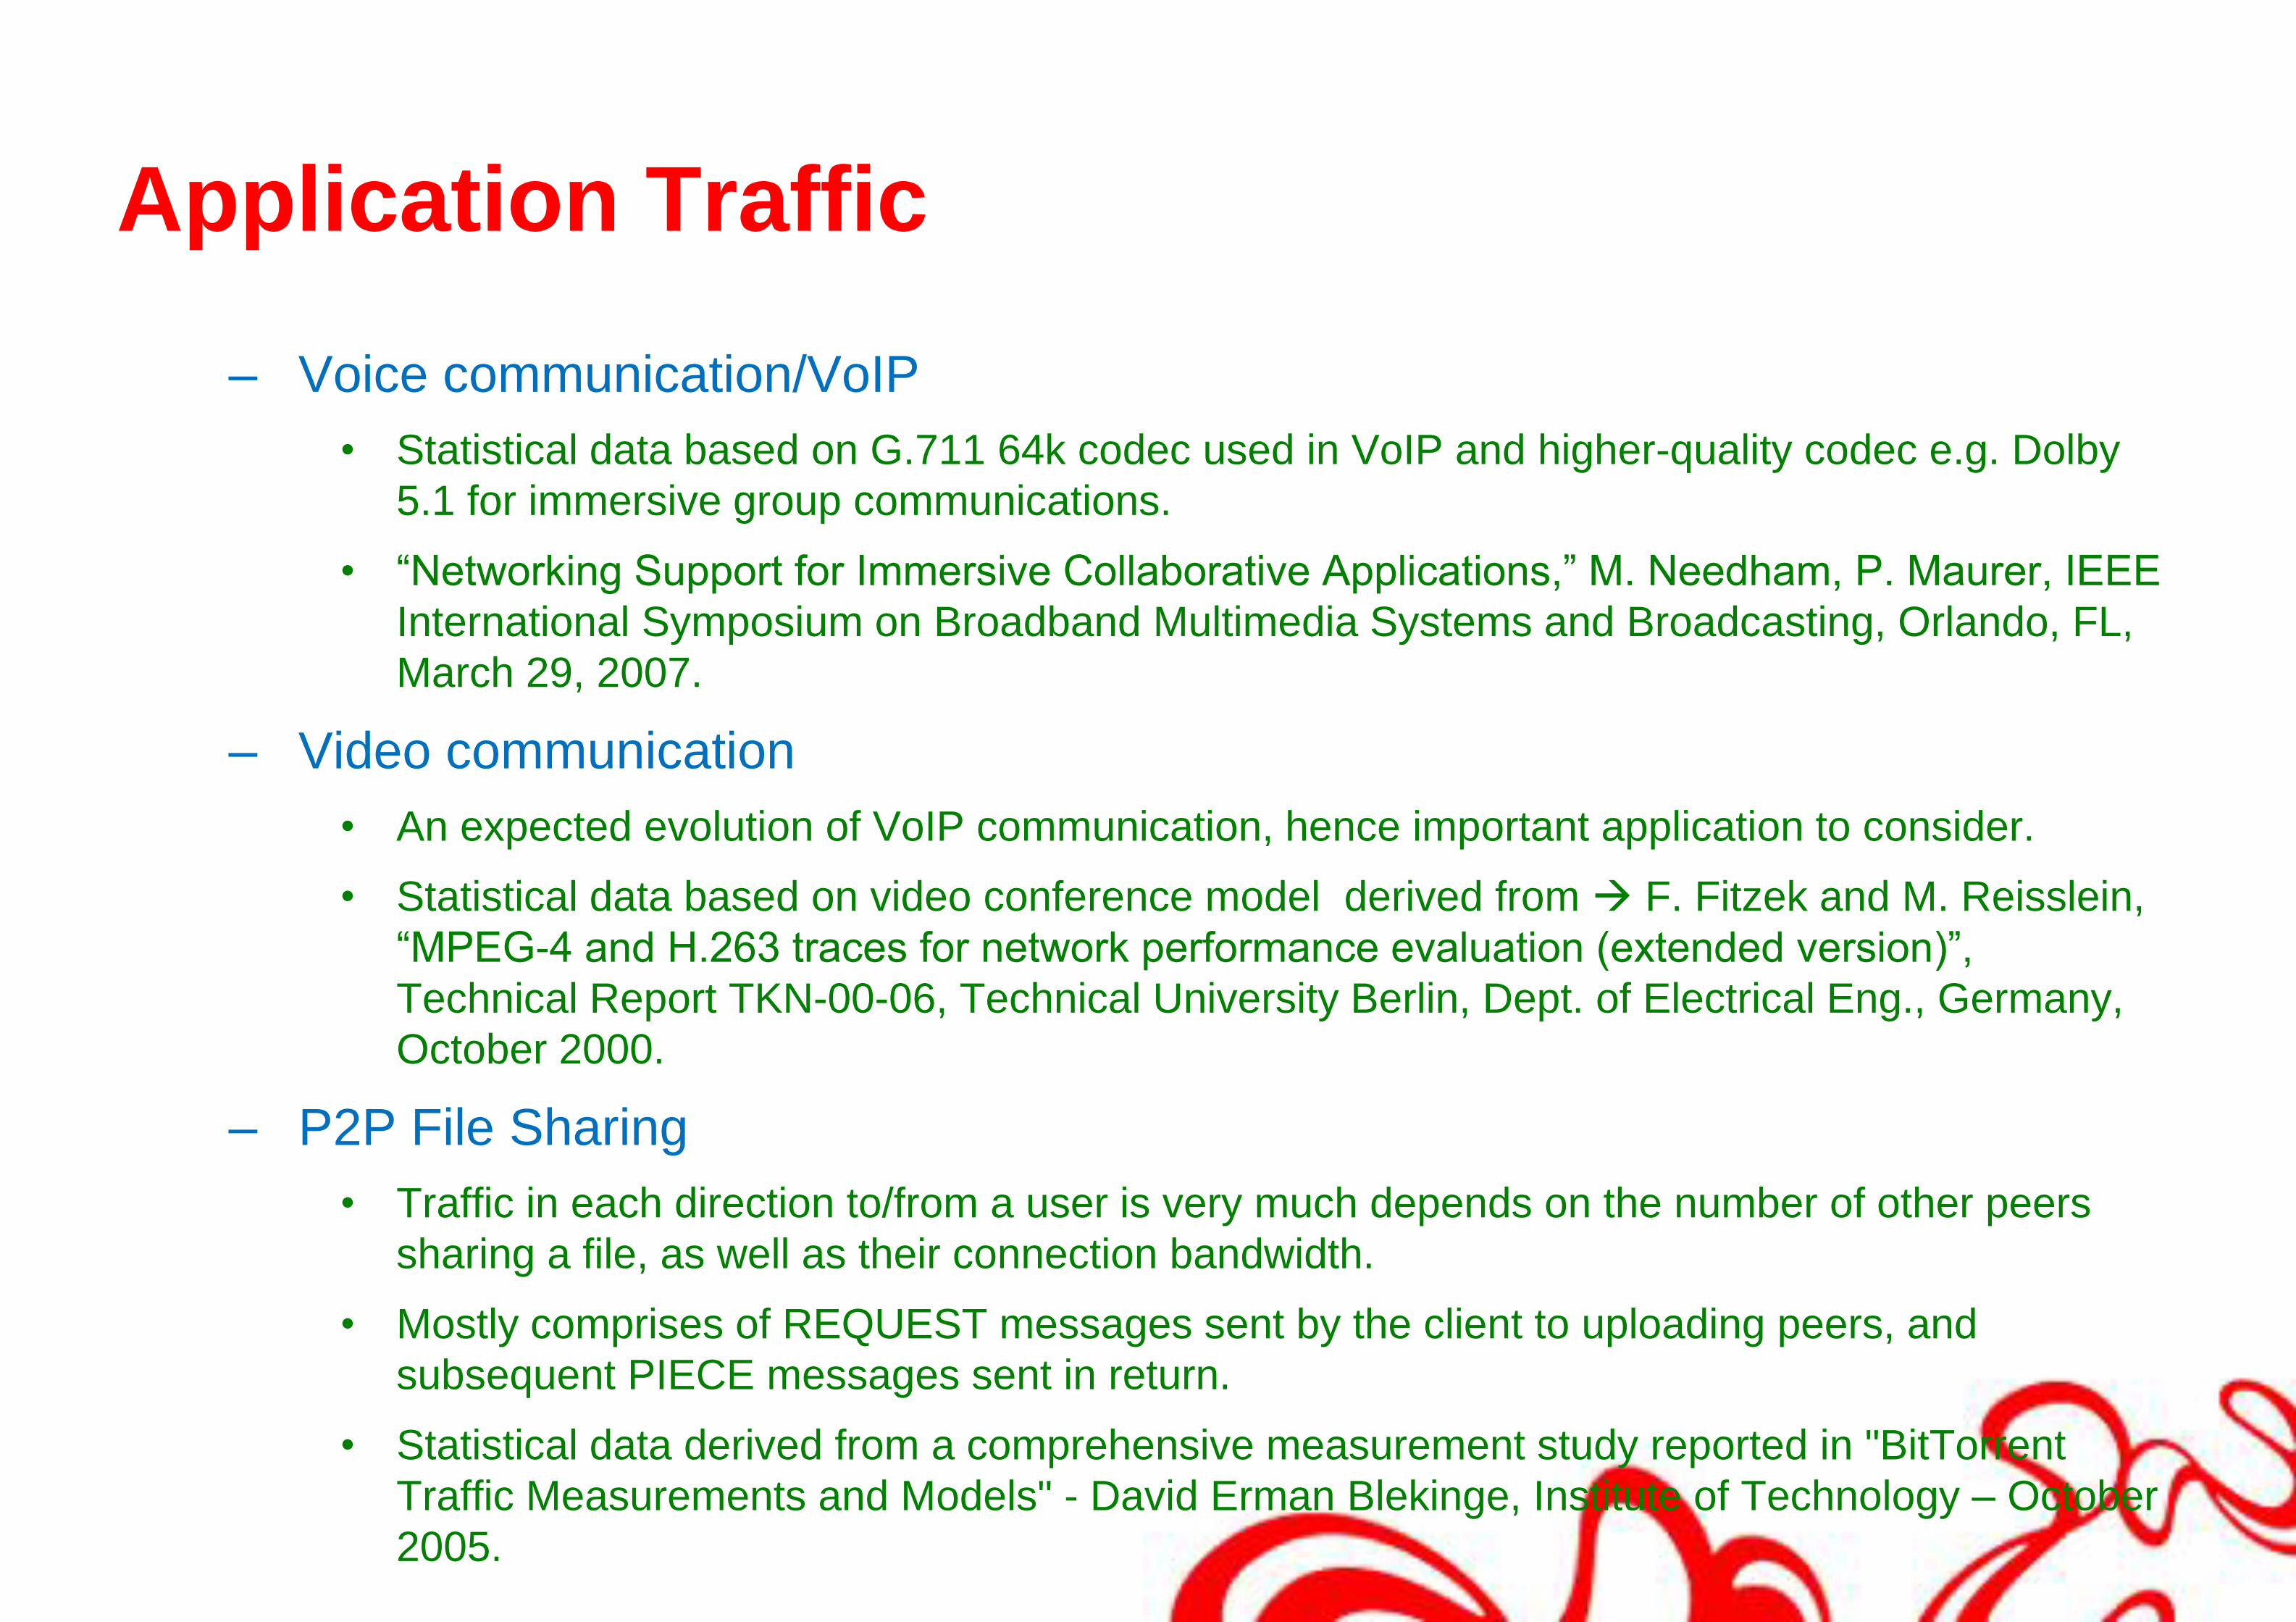
– Voice communication/VoIP
• Statistical data based on G.711 64k codec used in VoIP and higher-quality codec e.g. Dolby
5.1 for immersive group communications.
• “Networking Support for Immersive Collaborative Applications,” M. Needham, P. Maurer, IEEE
International Symposium on Broadband Multimedia Systems and Broadcasting, Orlando, FL,
March 29, 2007.
– Video communication
• An expected evolution of VoIP communication, hence important application to consider.
• Statistical data based on video conference model derived from F. Fitzek and M. Reisslein,
“MPEG-4 and H.263 traces for network performance evaluation (extended version)”,
Technical Report TKN-00-06, Technical University Berlin, Dept. of Electrical Eng., Germany,
October 2000.
– P2P File Sharing
• Traffic in each direction to/from a user is very much depends on the number of other peers
sharing a file, as well as their connection bandwidth.
• Mostly comprises of REQUEST messages sent by the client to uploading peers, and
subsequent PIECE messages sent in return.
• Statistical data derived from a comprehensive measurement study reported in "BitTorrent
Traffic Measurements and Models" - David Erman Blekinge, Institute of Technology – October
2005.

Application Traffic
– Gaming
• Traffic can broadly be divided into slow-pace role playing and adventure games.
• Statistical data based on “Network Game Traffic Modelling,” Johannes Färber,
NetGames2002, April 16-17, 2002, Braunschweig, Germany.
• “Traffic Modelling for Fast Action Network Games”, Johannes Färber, Multimedia
Tools and Applications, Vol. 23, Issue 1, pp. 31 - 46., May 2004.
– Virtual Environments
• Increasing popular application related to gaming called virtual reality – “Second Life”
(online 3D virtual world). The data must be transmitted across the network and
rendered in real-time, hence the traffic is demanding in case of network loading.
• Additionally, 3D environments will soon represent the Internet interface in near future,
replacing current 2D web browsers.
• "Traffic Analysis Beyond This World: the Case of Second Life" - Fernandes et al. –
2007.

New Application Traffic
• In addition, we modelled new and futuristic 3D video applications
based on 3D holoscopic imaging technology for 3D video capturing
with a single camera and playback.
– Currently in development under the EU FP7 3D-Vivant project leading by
Brunel University (http://www.3dvivant.eu/)
1D array (horizontal) of Cylindrical
lenses to record Unidirectional
Integral Images
2D array (horizontal & vertical) of
microlenses to record
Omnidirectional Integral Images

Holoscopic 3D Video Display
• This new technique allows more conventional single camera live
capture and glasses-free display, for both horizontal and
horizontal/vertical parallax, offers free viewing to more than one
person independently of the viewer’s position.
• It allows the mixing of real and virtual video and it is now accepted as
a strong candidate for next generation 3DTV.
Horizontal Parallax 3D Integral Image


Holoscopic 3D video Traffic
• Horizontal parallax images can be encoded at 0.075 bpp at a PSNR
of 33.6 dB.
– 2560 x 240 horizontal parallax video @ 25 fps with 3D wavelet encoded
8-bit holoscopic gives estimated rate of 1.735 Mbps
– 57600 x 480 horizontal parallax video @ 25 fps with 3D wavelet encoded
8-bit holoscopic gives estimated rate of 7.816 Mbps
– 10240 x 5760 horizontal and vertical parallax @ 25 fps with 3D wavelet
encoded 64-bit holoscopic gives estimated rate of 16.61 Mbps.
Data provided by
Dr Amar Aggoun
Brunel University

Characterisation of Application Traffics
No Application Application
Specifics
Packet Call
Object (PCO)
Avg. PCO
Size
(Bytes)
Avg.
Over-head
(Bytes)
Inter-
arrival
(Sec)
Sess.
Time (Sec)
Packet
Calls /
Session
Avg.
Session
(Kbytes)
Avg. Rate
(bps)
1 2D Web Browser 2D graphics Web Page 489350 40 300 17 8.320e+06 3.467e+03
2 3D Web Browser 3D graphics and Web pages Web Page 665820 40 300 17 11.32e+06 4.717e+03
3 Streaming Audio (Web
Quality)
MP3 (20k) Audio Frame 65 40 0.026 300 1.212e+06 3.231e+04
4 Streaming Audio (MP3
Quality)
MP3 (128k) Audio Frame 418 40 0.026 300 5.285e+06 1.410e+05
5 Streaming Audio (Home
Theater)
AC3 Dolby 5.1 (448k) Audio Frame 1792 88 0.032 300 1.763e+07 4.700e+05
6 Video/IPTV (2D Web
Quality-Clip/Prog)
MPEG-4 320x240 Group of
Pictures
20000 400 0.48 300/ 3600 1.275e+07
/ 1.530+08
3.400e+05
7 Video/IPTV (3D Web
Quality-Clip/Prog)
3D Wavelet 2560x240 (8-bit
holoscopic, Horiz Parallax)
Group of
Pictures
103680 400
0.48 300/ 3600 6.505e+07
/
7.806e+08
1.735e+06
8 Video/IPTV (2D SDTV
Quality-Clip/Prog)
MPEG-4 720x480 Group of
Pictures
90000 2400 0.48 300/ 3600 5.775e+07
/
6.930e+08
1.540e+06
9 Video/IPTV (3D SDTV
Quality-Clip/Prog)
3D Wavelet 5760x480 (8-bit
holoscopic, Horiz Parallax)
Group of
Pictures
466560 2400 0.48 300/ 3600 2.931e+08
/
3.517e+09
7.816e+06
10 Video/IPTV (2D HDTV
Quality-Clip/Prog
MPEG-4 1280x720 Group of
Pictures
480000 12000 0.48 300/ 3600 3.075e+08
/
3.690e+09
8.200e+06
11 Video/IPTV (3D HDTV
Quality-Clip/Prog
3D Wavelet 10240x5760 (64-bit
holoscopic, Horiz/ Vert Parallax)
Group of
Pictures
9953280 12000 0.48 300/ 3600 6.228e+09
/
7.474e+10
1.661+08
12 VoIP (Toll Quality) G.711 (64k) Speech
Frame
160 40 0.02 210 2.100e+06 8.000e+04
13 VoIP (MP3 Quality) MP3 (128k) Frame 418 40 0.026 210 3.699e+06 1.409e+05
14 VoIP (Home Theater
Quality)
AC3 Dolby 5.1 (448k) Audio Frame 1792 88 0.032 210 1.234e+07 4.700e+05

Web: Mid morning and
evening peak
Audio: Morning peak
Video clip: High during day
peaking at evenings
IPTV: High during evenings
VoIP: Peak in morning
remaining high till late evening
AV Comms: High during day
peaking in evening
Gaming: Peaks in synchronism
with availability of other time
zones
P2P: Higher during day and
evening not varying much
Audio UDL: Mid morning
and evening peak
Video UDL: Mid morning
and evening peak
Peak Hour (8 pm)
Modelling of “Per Hour Percentage” Traffic
Demand of Applications

Use Case Scenarios
• 2D & 3D Residential Broadband
• 2D & 3D Increased Media Resolution
• 2D & 3D Max Media Resolution

Example: Characterisation of Use Case
Scenario
Residential Broadband Application Type Quality Session
per Day
% of Users with
Application
Total Load User
per Day (Mbytes)
Peak
Hour %
Traffic
Asymmetry (%
uplink)
Equivalent per user Busy Hour
bit rate Down/up link (bits/sec)
Web Browser 2D Web Browser 2.5 75.0 15.599 7.9 10.1 2462 / 277
Streaming Audio Streaming Audio (Web Quality) 1.5 25.0 0.454 2.4 0 24 / 0
Streaming Video Video/IPTV (Web Quality-Clip 1.0 50.0 6.375 6.1 0 864 / 0
IPTV – program Video/IPTV (SDTV Quality-Clip) 1.0 0.50 2.888 9.4 0 60 / 0
VoIP Comms. VoIP (Toll Quality) 2.0 15.0 0.630 5.7 50.0 40 / 40
Video Comms Video Comm (Web Quality) 0.5 5.0 0.319 7.7 50.0 27 / 27
Interactive Gaming Interactive Gaming (Small&Fast) 1.0 33.0 2.525 6.25 46.4 188 / 163
P2P File Sharing P2P File Sharing (Large) 0.14 5.0 11.500 5.3 83.6 222 / 1132
Audio UD loading UDL Audio(Web Quality) 2,0 50.0 1.211 7.9 10.4 191 / 22
Video UD loading UDL Video/IPTV (Web Qual-Prog) 0.07 50.0 5.355 7.9 10.4 842 / 98
Total 4921 / 1759
Calculated from
predefined traffic
parameters
Predefined
Traffic demand
at Peak Hour
3D Residential Broadband Application Type Quality Session
per Day
% of Users with
Application
Total Load User
per Day (Mbytes)
Peak
Hour %
Traffic
Asymmetry (%
uplink)
Equivalent per user Busy Hour
bit rate Down/up link (bits/sec)
Web Browser 3D Web Browser 2.5 75.0 21.224 7.9 10.1 3350 / 376
Streaming Audio Streaming Audio (Web Quality) 1.5 25.0 0.454 2.4 0 24 / 0
Streaming Video 3D Video/IPTV (Web Quality-Clip 1.0 50.0 32.525 6.1 0 4409 / 0
IPTV – program 3D Video/IPTV (SDTV Quality-Clip) 1.0 0.50 1.466 9.4 0 306 / 0
VoIP Comms. VoIP (Toll Quality) 2.0 15.0 0.630 5.7 50.0 40 / 40
Video Comms 3D Video Comm (Web Quality) 0.5 5.0 1.626 7.7 50.0 139 / 139
Interactive Gaming Interactive Gaming (Small&Fast) 1.0 33.0 2.525 6.25 46.4 188 / 163
P2P File Sharing P2P File Sharing (Large) 0.14 5.0 11.500 5.3 83.6 222 / 1132
Audio UD loading UDL Audio(Web Quality) 2,0 50.0 1.211 7.9 10.4 191 / 22
Video UD loading UDL 3D Video/IPTV(Web Qual-
Prog)
0.07 50.0 27.321 7.9 10.4 4298 / 499
Total 13166 / 2371

Web Browser Application
is dominant
3D Video IPTV
clips and Video downloads
increase in importance
P2P sharing
dominant
DL traffic bit rate
3X UL traffic
3D traffic not a huge increase
From 2D traffic
2D and 3D Residential Broadband:
Per User Up/Download Traffic Demand at Peak Hour
Download Upload
2D2D
Download Upload3D 3D

Video Clips, programs
and download
becoming
dominant
3X increase
in bit rate
compared to
Res BB
Scenario
Video IPTV
is dominant
3X increase in
bit rate compared to
2D Inc MR scenario
DL traffic bit rate
7X UL traffic
P2P sharing and video
UDL dominant
2D and 3D Increased Media Resolution:
Per User Up/Download Traffic Demand at Peak Hour
3D 3D
2D 2D

3.3X increase in
bit rate
compared to 2D
Inc MR scenario
Video clips and
UDL Video
now dominant
5.3X increase in
bit rate
compared to
2D Max Res
Scenario
DL traffic bit
rate 10X UL
traffic
Video UDL
dominant
Video clips and
UDL Video
Increasing in
dominance
2D and 3D Max Media Resolution:
Per User Up/Download Traffic Demand at Peak Hour
3D 3D
2D 2D

Peaks at 20.00hrs with 4919 bps
due to dominant Internet and
Video UDL traffic
Peaks at 20.00hrs
with 8001 bps
due to continued
dominance
of Internet and Video
UDL traffic
Peaks at 20.00hrs with 1756
bps due to dominant P2P
traffic
Peaks at 20.00hrs with
2006 bps due to
dominant P2P traffic
2D and 3D Residential Broadband:
Per User Up/Download Link Demand over 24 hours
Download Upload
3D 3D
2D 2D

Peaks at 20.00hrs with
15822 bps due to
dominant Internet and
Video Clip, IPTV and
UDL traffic
Peaks at 20.00hrs with 45056 bps
due to increased dominance
of IPTV and Video UDL traffic
Peaks at 20.00hrs
with 2294 b/s due to
dominant P2P traffic
Peaks at 20.00hrs with
3068 bps due to dominant
P2P and Video
UDL traffic
2D and 3D Increased Media Resolution:
Per User Up/Download Link Demand over 24 hours
3D 3D
2D 2D

New peak at 23.00 hrs with 53 kbps
due to Increasing Video clip traffic
New peak at 23.00 hrs with 286 kbps
due to Increasing Video clip traffic
Peak at 20.00 hrs with
5.1 kbps due to Increasing
Video UDL traffic
Peak at 20.00 hrs with 20 kbps
due to dominant Video UDL
traffic
2D and 3D Max Media Resolution:
Per User Up/Download Link Demand over 24 hours
3D 3D
2D 2D

Reference Network Modelling

ISP
Networks
ISP
Gateway
Routers
ISP
Distribution
Switch
Main Aggregation
Router
MAN / WAN
Transport
Networks
Regional Aggregation
Router
Regional Backhaul
Networks
Access Points
R1 R2 R3
C1
B1
I1 I2
X
1
2 3
4
5 6
7
8
9 10 11
12
13 14
17
1516
No of RAN
Sites per
MAN
10 20 30
No of Users
per MAN200 200 200
60% Traffic
to ISP 140% Traffic
to ISP 2
Motorola’s Reference Network and Network Flow Model

End to End Flows Considered in our Reference Network
ISP
Networks
ISP
Gateway
Routers
ISP
Distribution
Switch
Main Aggregation
Router
MAN / WAN
Transport
Networks
Regional Aggregation
Router
Regional Backhaul
Networks
Access Points

101.2 = 15x difference
in magnitude
101.4 = 25x difference
in magnitude
100.31 = 2x
difference
in magnitude
100.15 = 1.4x
difference
in magnitude
100.96 = 9.1x difference in
magnitude
101.01 = 10.2x difference in
magnitude
100.22 = 1.7x
difference
in magnitude
100.17 = X1.5
difference
in magnitude
End to End Flows at Peak Hour:
2D and 3D Residential Broadband
Download Upload
3D 3D
2D 2D

102.06 = 115x difference
in magnitude
101.65 = 45x
difference
in magnitude
100.18 = 1.5x
difference
in magnitude
100.03 = 1.1x
difference
in magnitude
101.18 = 15x difference in
magnitude
101.42 = 23x
difference in
magnitude
100.47 = 3x
difference
in magnitude
100.23 = 1.7x
difference
in magnitude
End to End Flows at Peak Hour:
2D and 3D Increased Media Resolution
3D3D
2D2D

102.14 = 138x difference
in magnitude
101.91 = 81x difference
in magnitude
100.79 = 6.2x
difference
in magnitude
100.40 = 2.5x
difference
in magnitude
101.17 = 15x difference
in magnitude
101.21 = 16x difference in
magnitude
100.72 = 5.3x
difference
in magnitude
100.67 = 4.7x
difference
in magnitude
End to End Flows at Peak Hour:
2D and 3D Max Media Resolution

Max load ~ 55 Mbps Max load ~ 49 Mbps Max load ~ 91 Mbps Max load ~ 68 Mbps
Core Network Access NetworkCore Network Access Network
“Link Load” at Peak Hour:
2D and 3D Residential Broadband
Download Upload

Max load ~ 186 Mbps Max load ~ 114 Mbps Max load ~ 537 Mbps Max load ~ 295 Mbps
Core Network Access NetworkCore Network Access Network
“Link Load” at Peak Hour:
2D and 3D Increased Media Resolution
Download Upload

Max load ~ 617 Mbps Max load ~ 339 Mbps Max load ~ 3.31 Gbps Max load ~ 1.74 Gbps
Core Network Access NetworkCore Network Access Network
“Link Load” at Peak Hour:
2D and 3D Max Media Resolution
Download Upload

Max load (link 11) =
107.69 ~ 49 MbpsMax load (link 5) =
107.74 ~ 55 MbpsMax load (link 11) =
107.83 ~ 68 Mbps
Max load (link 5) =
107.96 ~ 91 Mbps
“Link Load” at Per Hour:
2D and 3D Residential Broadband
• For upload: 100 Mbps Core and Access Network capacity is sufficient
Access NetworkCore Network

Max load (link 11) =
108.1 ~ 126 GbpsMax load (link 5) =
108.27 ~ 186 MbpsMax load (link 11) =
108.47 ~ 295 MbpsMax load (link 5) =
108.73 ~ 537 Mbps
• For upload: 300 Mbps Access Network capacity is sufficient
“Link Load” at Per Hour:
2D and 3D Increased Media Resolution
Access NetworkCore Network

Max load (link 11) =
108.53 ~ 339 M bit/sMax load (link 5) =
108.79 ~ 617 M bit/sMax load (link 11) =
109.24 ~ 1.74 G bit/sMax load (link 5) =
109.52 ~ 3.31 G bit/s
• For upload: 2 Gbps Access Network capacity is sufficient
“Link Load” at Per Hour:
2D and 3D Max Media Resolution
Access NetworkCore Network

Conclusion
• The study shown that Introducing the increased media resolution and
3DTV traffics to Internet
– Total traffic demand is enlarged due to the increase intensity and
duration of online media access.
– Link load increased by a factor of about ten if 3D Holoscopic video with
horizontal parallax is used and by a factor of hundred if 3D Holoscopic
video with horizontal/vertical parallax is used.
• The dominant effect on networks will be due to video applications
with the rest of the traffic mix making a very minor effect.
• This study is in line with European research priorities.


