traffic bubble in delhi
TRANSCRIPT
Brief Traffic Analysis in
New Delhi, India
Delhi is the most polluted City in
the World: WHO
Growing traffic on city streets is a major cause of air
pollution but Delhi Metro becomes First Metro Rail to get carbon Credits from United Nations (UN) for helping to
reduce pollution levels in the city by 6.3 lakh tons every
year

Brief Analysis on:
Traffic Congestion in Delhi
Pollution in City due to Traffic
Commutes time wasted on road

Vehicle Registered in Delhi
Year No. of Vehicle
2008 3,95,196
2009 4,13,967
2010 4,85,659
2011 5,12,420
2012 5,29,268
2013 4,83,958
Total No. of Vehicles Regd. (upto
June,2014)
89,47,718
Year wise Vehicle Registered in Delhi
About 1.2 million Non-Delhi vehicles pass through the capital(New Delhi)
daily, clogging its nine highways
**Statistics in year 2012
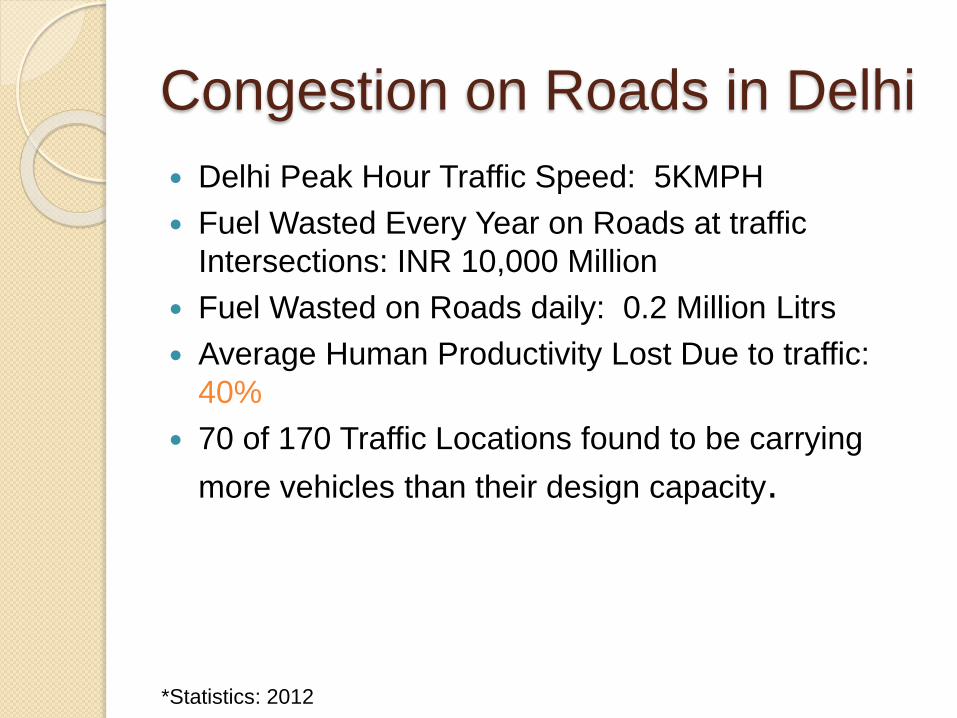
Congestion on Roads in Delhi
Delhi Peak Hour Traffic Speed: 5KMPH
Fuel Wasted Every Year on Roads at traffic
Intersections: INR 10,000 Million
Fuel Wasted on Roads daily: 0.2 Million Litrs
Average Human Productivity Lost Due to traffic:
40%
70 of 170 Traffic Locations found to be carrying
more vehicles than their design capacity.
*Statistics: 2012

Analysis of Traffic Congestion
*Statistics: 2012
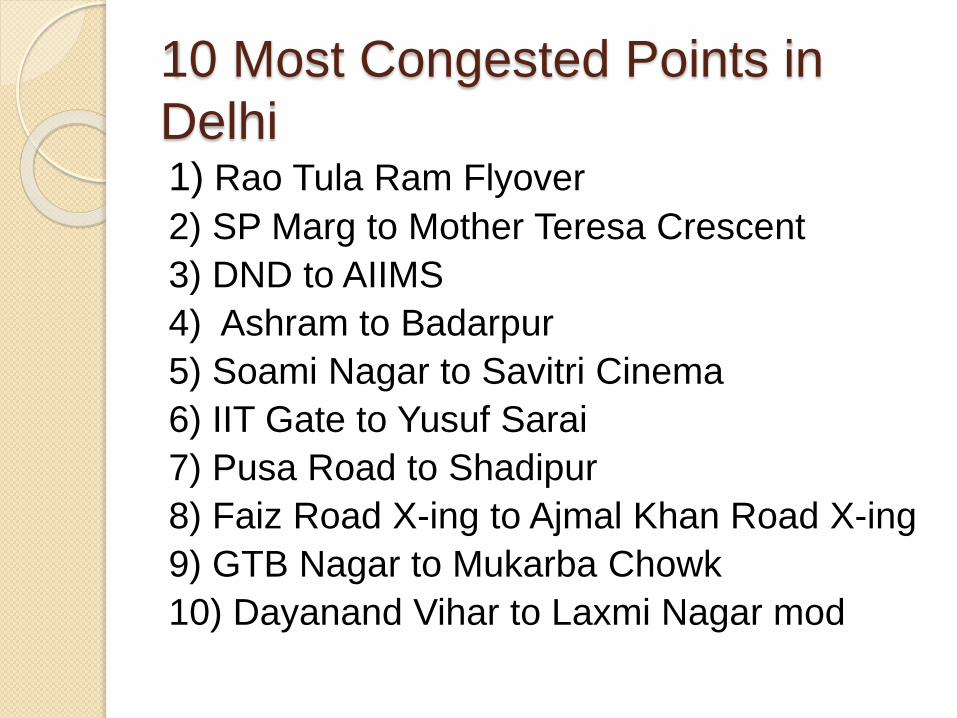
10 Most Congested Points in
Delhi1) Rao Tula Ram Flyover
2) SP Marg to Mother Teresa Crescent
3) DND to AIIMS
4) Ashram to Badarpur
5) Soami Nagar to Savitri Cinema
6) IIT Gate to Yusuf Sarai
7) Pusa Road to Shadipur
8) Faiz Road X-ing to Ajmal Khan Road X-ing
9) GTB Nagar to Mukarba Chowk
10) Dayanand Vihar to Laxmi Nagar mod
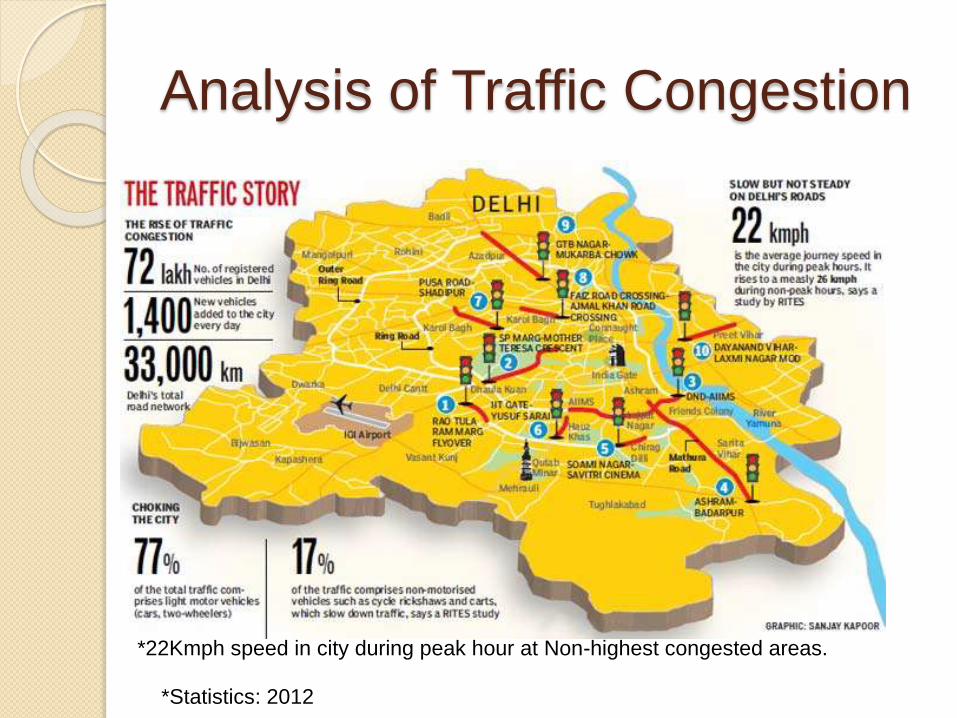
Analysis of Traffic Congestion
*Statistics: 2012
*22Kmph speed in city during peak hour at Non-highest congested areas.
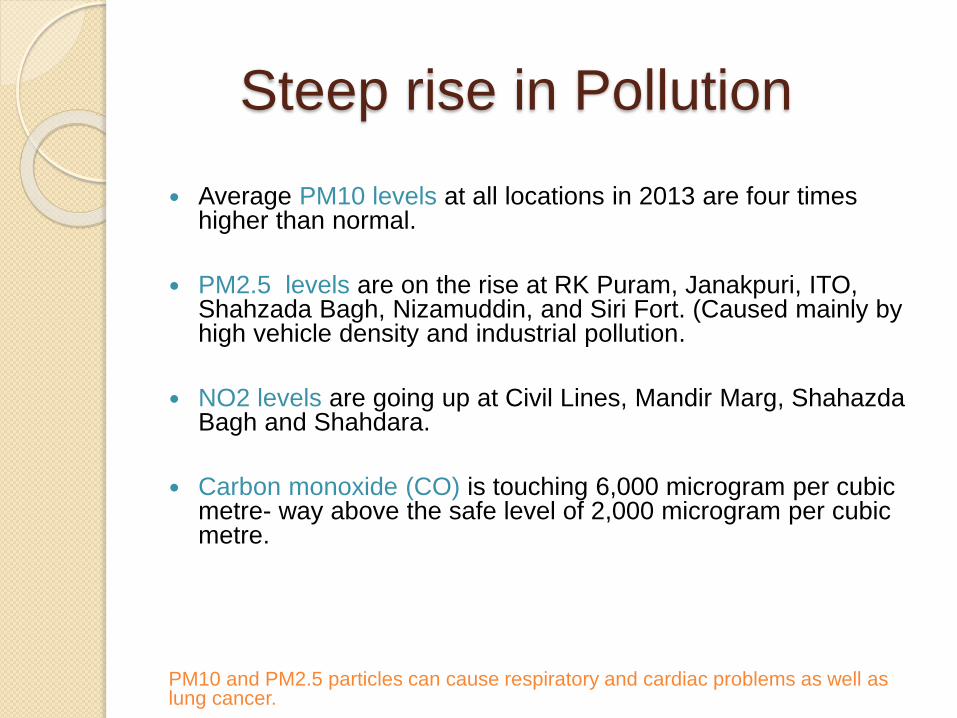
Steep rise in Pollution
Average PM10 levels at all locations in 2013 are four times higher than normal.
PM2.5 levels are on the rise at RK Puram, Janakpuri, ITO, Shahzada Bagh, Nizamuddin, and Siri Fort. (Caused mainly by high vehicle density and industrial pollution.
NO2 levels are going up at Civil Lines, Mandir Marg, ShahazdaBagh and Shahdara.
Carbon monoxide (CO) is touching 6,000 microgram per cubic metre- way above the safe level of 2,000 microgram per cubic metre.
PM10 and PM2.5 particles can cause respiratory and cardiac problems as well as lung cancer.
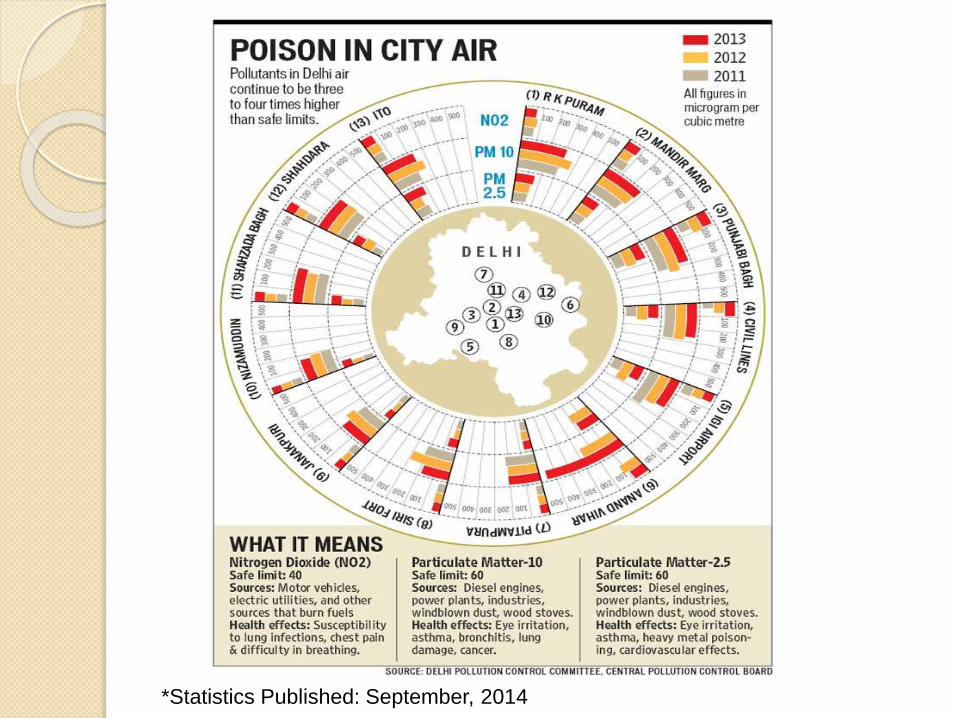
*Statistics Published: September, 2014
Time & Energy Lost due to
Traffic
65-70 lakh man-hours are lost the day Delhi gets gridlocked
In a career spanning over 30 years, you lose close to six years trapped on the city's congested roads. It's more if someone commutes between Delhi and Gurgaon; from north Delhi to Faridabad; or between Ghaziabad and Dwarka.
The City Next to Look Upon in India Is
Bangalore

Some of above statistics shows why we
need technology to solve a very big
problem both for
the cities & the commuters

References
http://indianexpress.com/article/cities/delhi/delhi-most-polluted-city-in-the-world-who/
http://zeenews.india.com/exclusive/delhi-air-pollution-breathe-at-your-own-risk_7017.html
https://delhitrafficpolice.nic.in/about-us/statistics/
http://www.delhimetrorail.com/press_reldetails.aspx?id=746xECETA6Qlld
http://crridom.gov.in/
http://www.cseindia.org/
http://www.dailymail.co.uk/indiahome/indianews/article-2177339/Studies-paint-horror-scenario-Delhi-congestion-doubles-time-years.html
http://www.hindustantimes.com/india-news/newdelhi/delhi-ten-points-where-the-city-chokes/article1-949619.aspx
http://www.hindustantimes.com/india-news/newdelhi/delhi-s-air-pollution-levels-remain-a-problem/article1-1258952.aspx
http://indiatoday.intoday.in/story/gridlocked-delhi-six-years-of-career-lost-in-jams/1/111506.html