traffic characteristics of machine to machine...
TRANSCRIPT
Traffic Characteristics of Machine to Machine
Communication NetworkTanjila Ahmed
Machine to Machine (M2M)
Machine to machine refers to direct communication between devices using any communications channel, including wired and wireless. In modern times the communication is often via the Internet of Things (IoT).
~Wikipedia
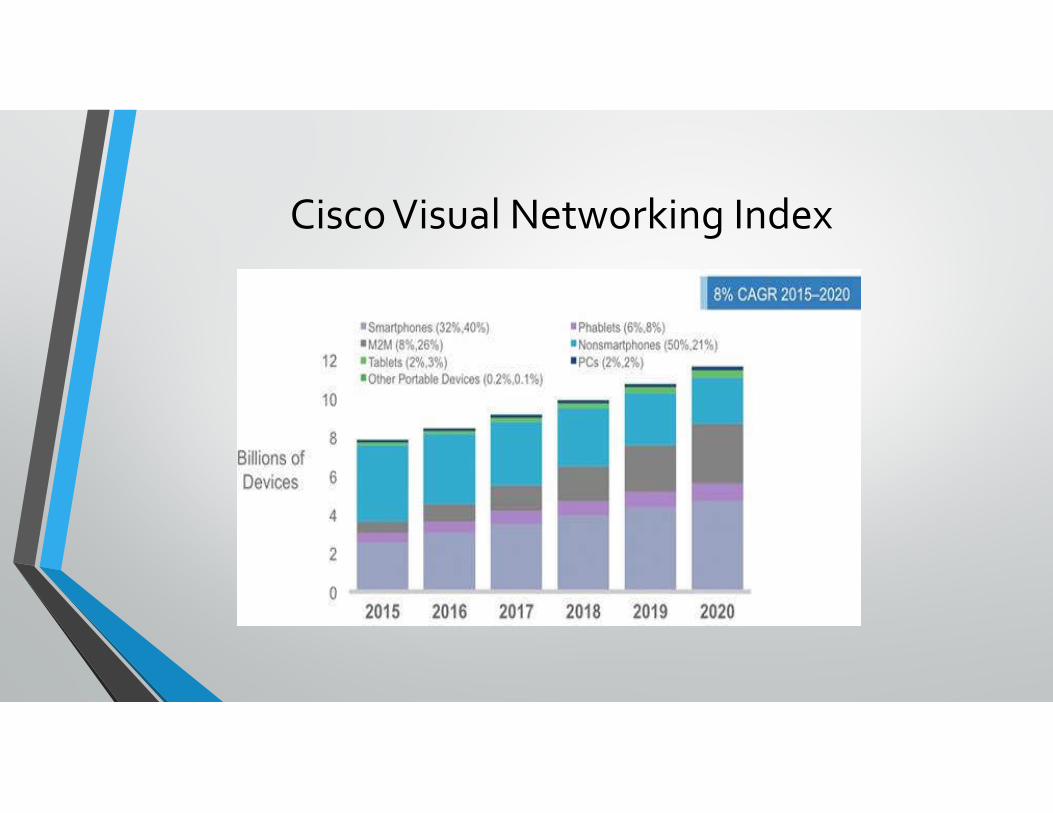
Cisco Visual Networking Index
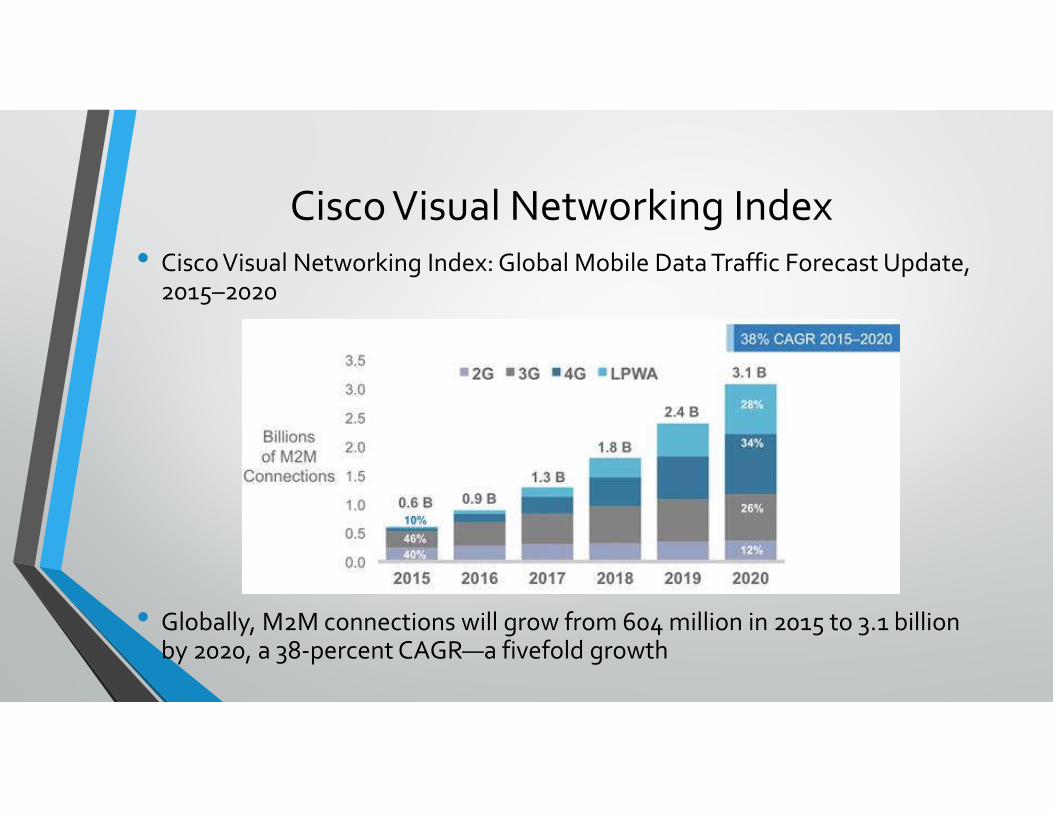
Cisco Visual Networking Index• Cisco Visual Networking Index: Global Mobile Data Traffic Forecast Update,
2015–2020
• Globally, M2M connections will grow from 604 million in 2015 to 3.1 billion by 2020, a 38-percent CAGR—a fivefold growth
Paper Review
A First Look At Cellular Machine To Machine Traffic -Large Scale Measurement And Characterization
M.Zubair Shafiq , Lusheng Ji, Alex X. Liu, Jeffrey Pang , Jia Wang
12 th ACM SIGMETRICS/PERFORMANCE joint international conference on Measurement and Modeling of Computer Systems , pp 65-76,June,2012
Motivation
• Growth of the smart devices (10 million(2012)-100million(2017))
• Sharing same cellular network with smartphones
• Competition with smartphones for network resources
• Traffic pattern and QoS required for these are different than smartphone
• To be able to answer this question traffic pattern of these devices should be known ?
What are the challenges cellular network operators may face to accommodate traffic from both smartphones and M2M devices?
Key Contribution
• Large Scale Measurement : cellular M2M traffic traces of million devices of 150 hardware models , millions of smartphone traffic from same cellular network
• Aggregate Traffic Volume: Uplink and downlink traffic measurement
• Traffic Volume Time Series : To find the ‘peak hour’ concept in M2M traffic
• Traffic Session : Active time , session length ,session inter-arrival time
• Device Mobility: M2M devices are less mobile
• Application Usage
• Network Performance: Packet loss ratio and RTT
DATA SET
• Cellular operator in USA (2 G and 3 G)
• Supports GPRS, EDGE,UMTS,HSPA technologies
• Lower Tier : Wireless connection
• Upper Tier : core network interfaces the cellular with Internet
• Each trace is a 5 mins traffic volume
• Session level traffic between cellular devices and internet
• Duration : 1 complete week of August 2010
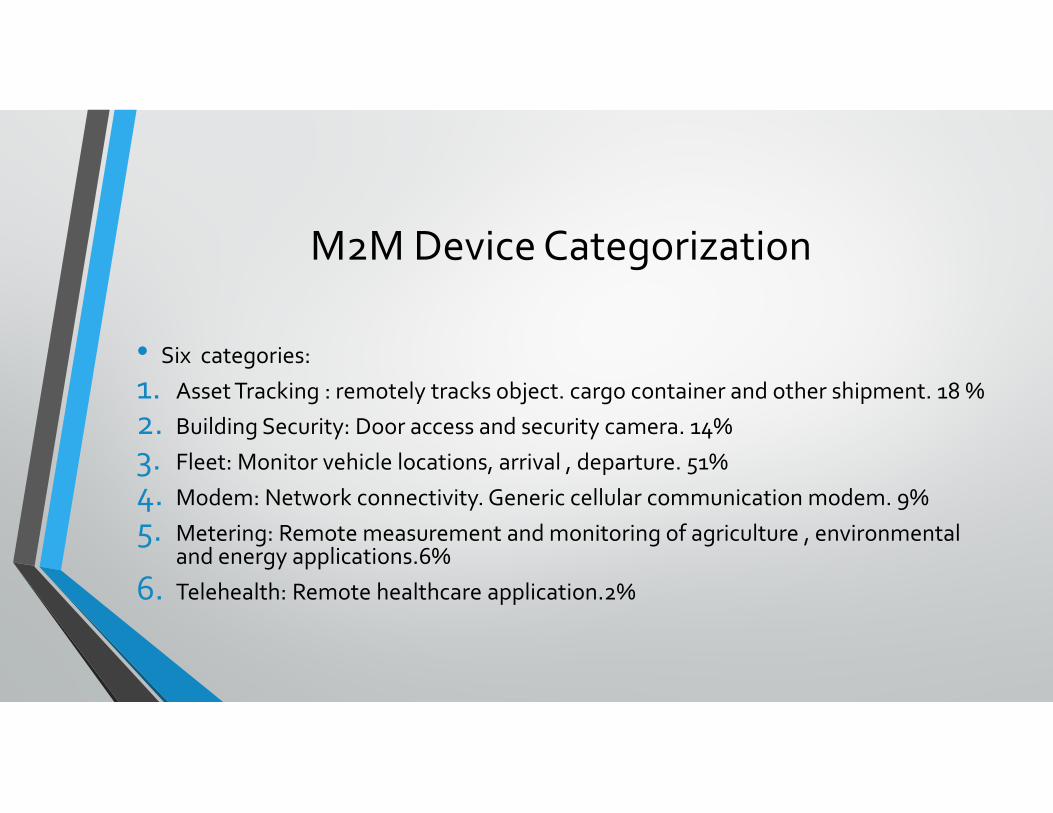
M2M Device Categorization
• Six categories:
1. Asset Tracking : remotely tracks object. cargo container and other shipment. 18 %
2. Building Security: Door access and security camera. 14%
3. Fleet: Monitor vehicle locations, arrival , departure. 51%
4. Modem: Network connectivity. Generic cellular communication modem. 9%
5. Metering: Remote measurement and monitoring of agriculture , environmental and energy applications.6%
6. Telehealth: Remote healthcare application.2%
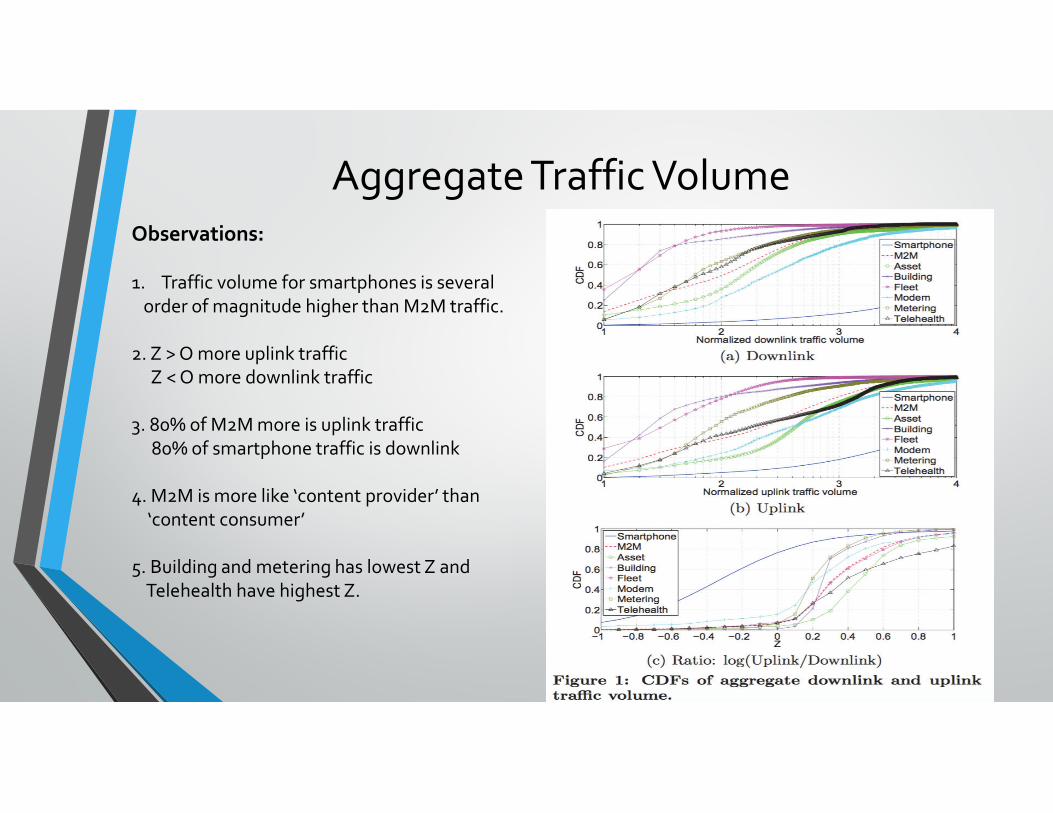
Aggregate Traffic VolumeObservations:
1. Traffic volume for smartphones is several order of magnitude higher than M2M traffic.
2. Z > O more uplink trafficZ < O more downlink traffic
3. 80% of M2M more is uplink traffic80% of smartphone traffic is downlink
4. M2M is more like ‘content provider’ than‘content consumer’
5. Building and metering has lowest Z and Telehealth have highest Z.
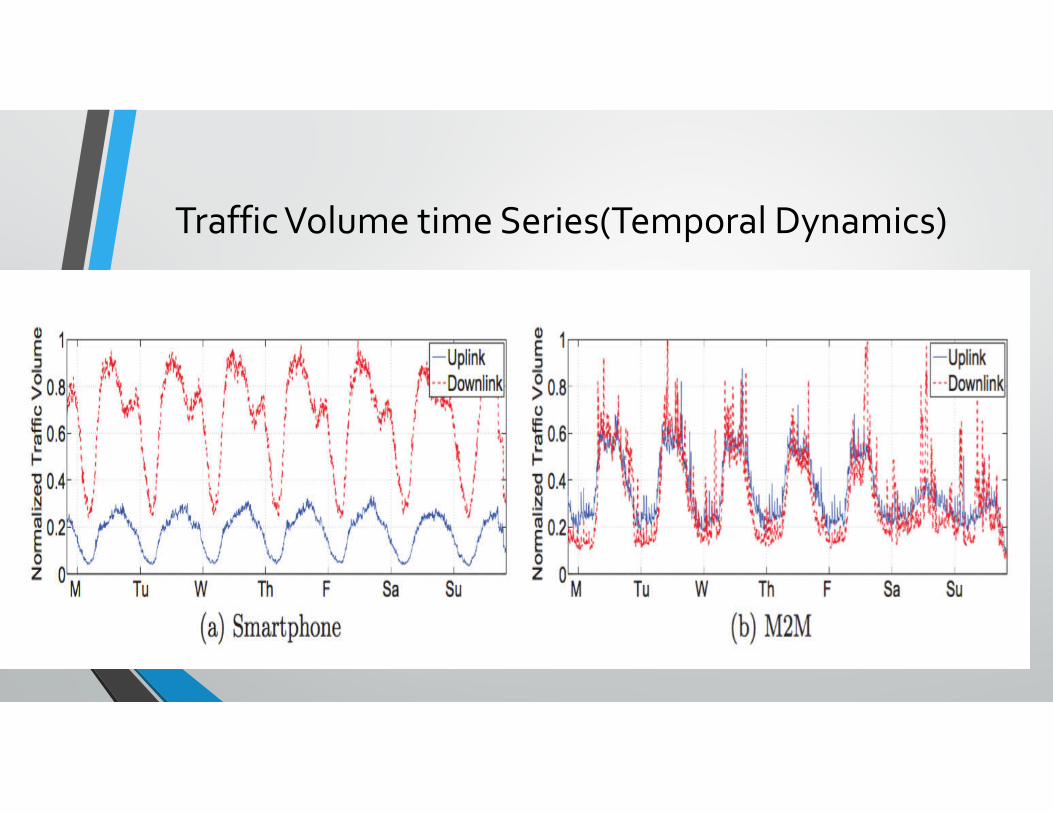
Traffic Volume time Series(Temporal Dynamics)
Traffic Volume time Series(Temporal Dynamics)
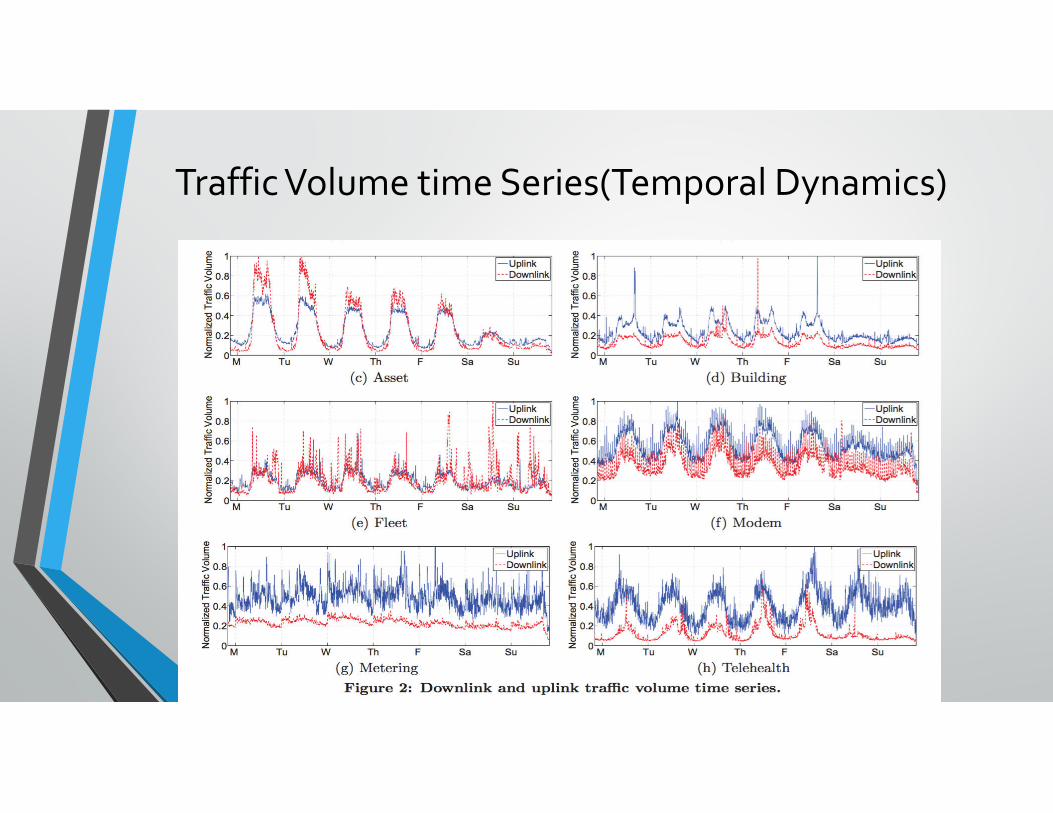
• 1. volume of downlink traffic dominates for smartphone; fairly equal in M2M
• 2.Smartphone traffic time series are wider(starting in the morning ending to midnight)
• 3. M2M traffic time series are narrower, ending by evening time.
• 4. Significant reduction in weekends for M2M.
• Smartphone traffic pattern related to human ‘waking’ hours.
• M2M device traffic pattern related to human ‘working’ hours.
Traffic Volume time Series(Temporal Dynamics)
Traffic Volume time Series(Temporal Dynamics)
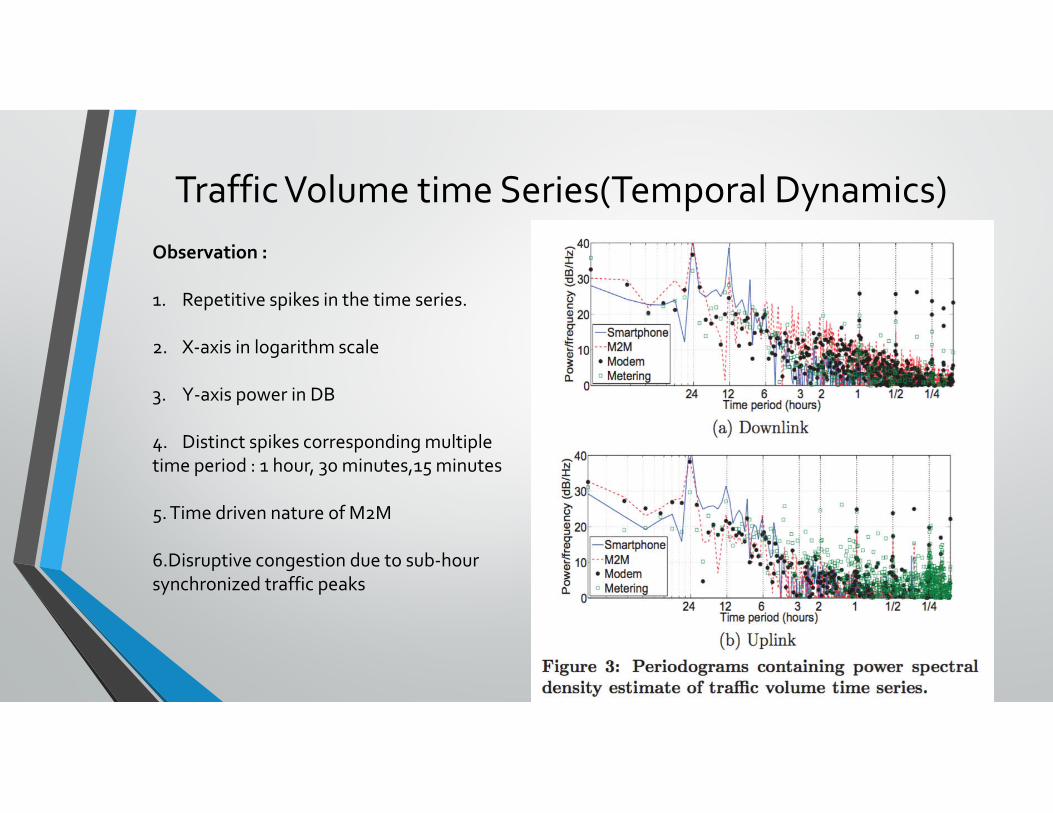
Observation :
1. Repetitive spikes in the time series.
2. X-axis in logarithm scale
3. Y-axis power in DB
4. Distinct spikes corresponding multiple time period : 1 hour, 30 minutes,15 minutes
5. Time driven nature of M2M
6.Disruptive congestion due to sub-hour synchronized traffic peaks
Traffic Volume time Series(Temporal Dynamics)
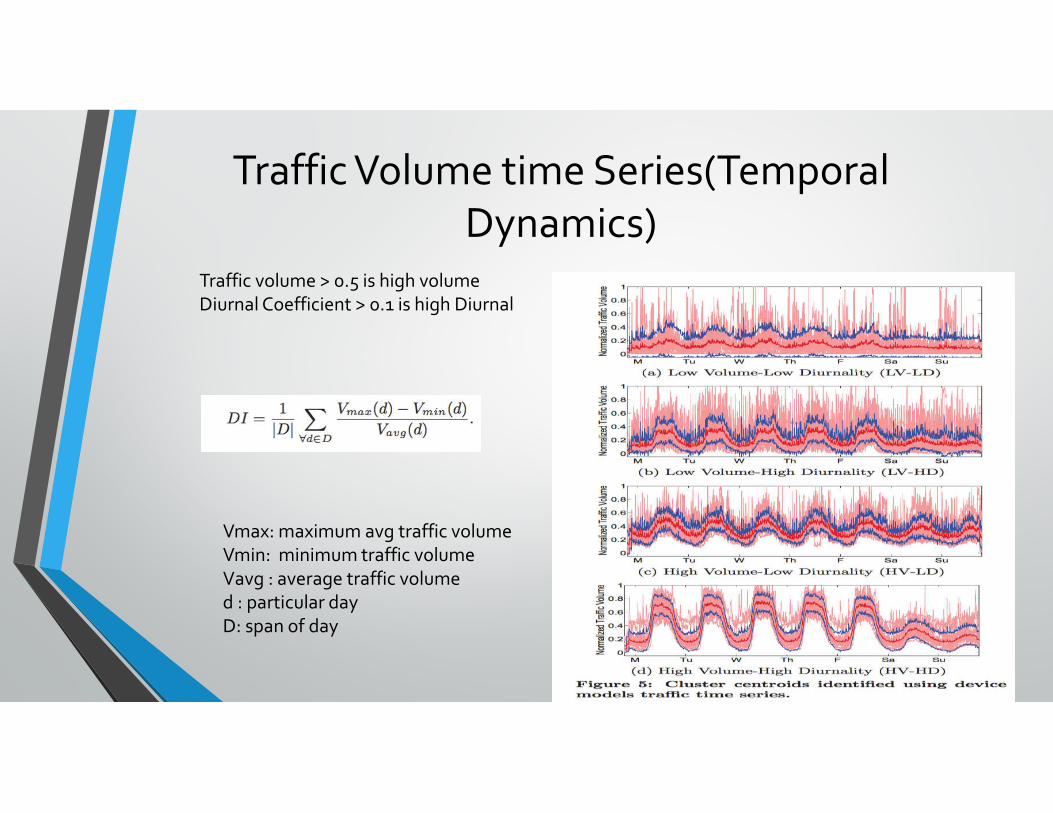
Traffic volume > 0.5 is high volumeDiurnal Coefficient > 0.1 is high Diurnal
Vmax: maximum avg traffic volumeVmin: minimum traffic volumeVavg : average traffic volumed : particular dayD: span of day
Traffic Volume time Series(Temporal Dynamics)
Session analysis
• This is valuable for network operator because device active time corresponds more to radio resource usage than aggregate traffic
• M2M service provider better design their devices for battery management
Session Analysis
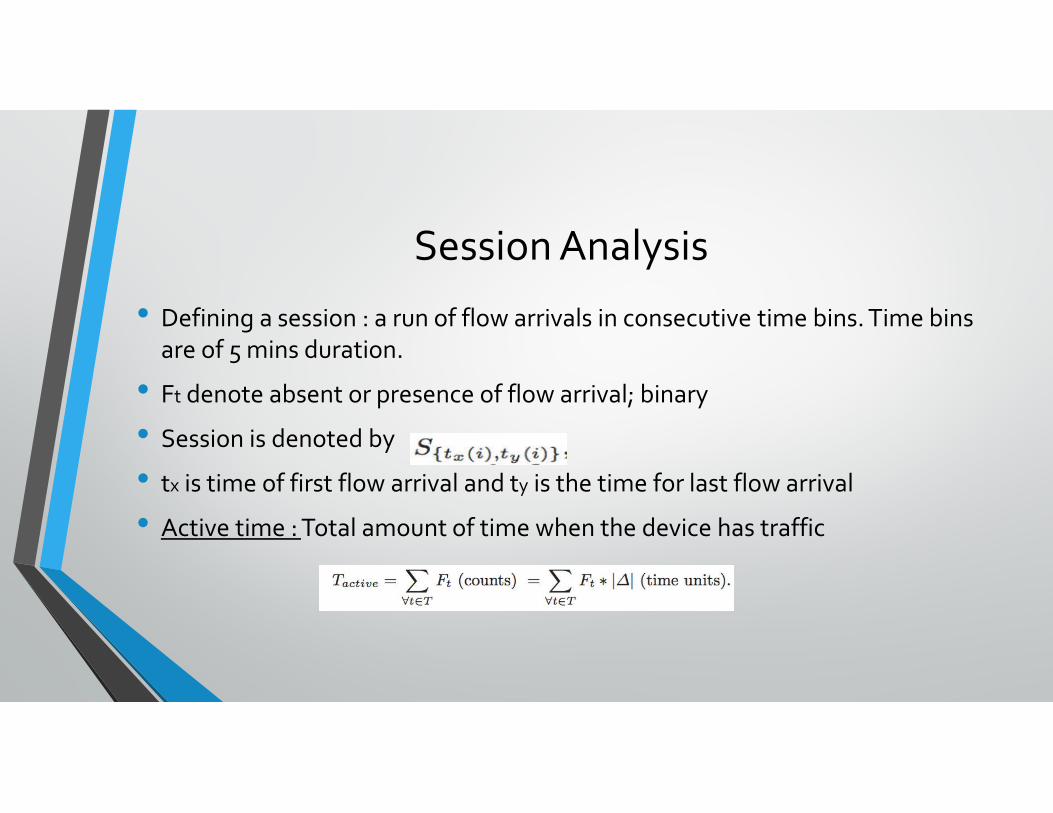
• Defining a session : a run of flow arrivals in consecutive time bins. Time bins are of 5 mins duration.
• Ft denote absent or presence of flow arrival; binary
• Session is denoted by
• tx is time of first flow arrival and ty is the time for last flow arrival
• Active time : Total amount of time when the device has traffic

Session Analysis
• Average Session Length :
• Average Session Inter-arrival:
Session Analysis
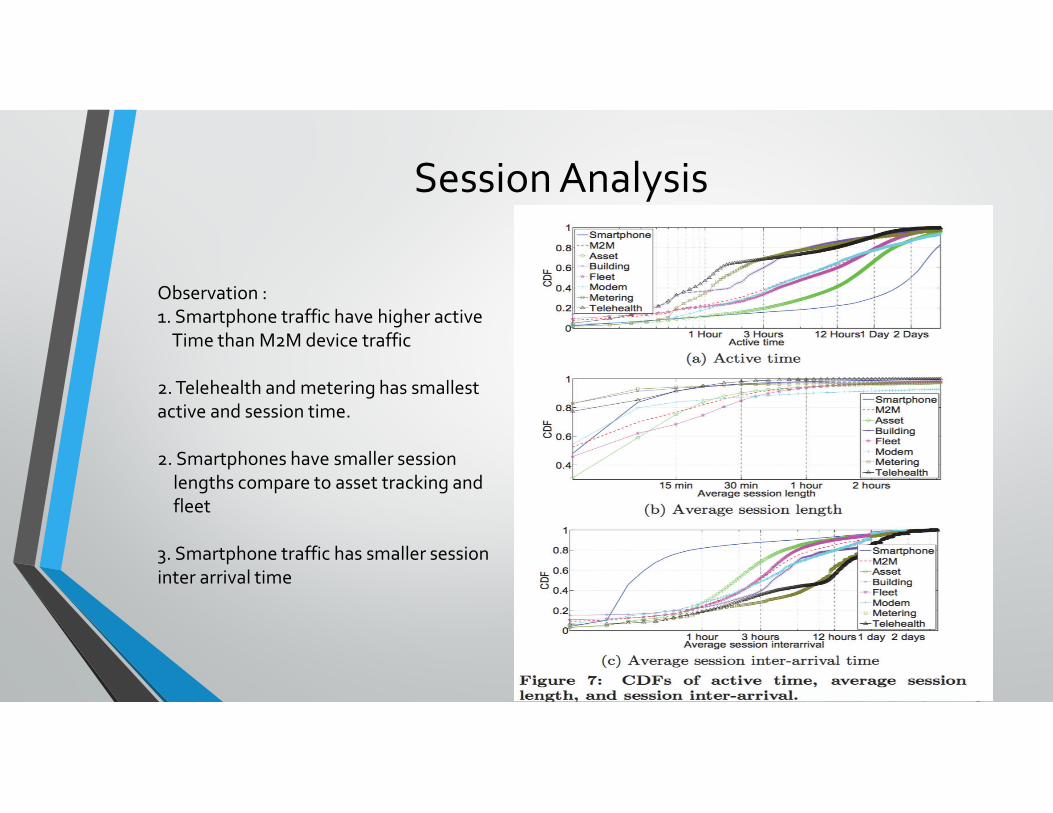
Observation : 1. Smartphone traffic have higher active
Time than M2M device traffic
2. Telehealth and metering has smallestactive and session time.
2. Smartphones have smaller sessionlengths compare to asset tracking andfleet
3. Smartphone traffic has smaller sessioninter arrival time
Mobility
Observation :
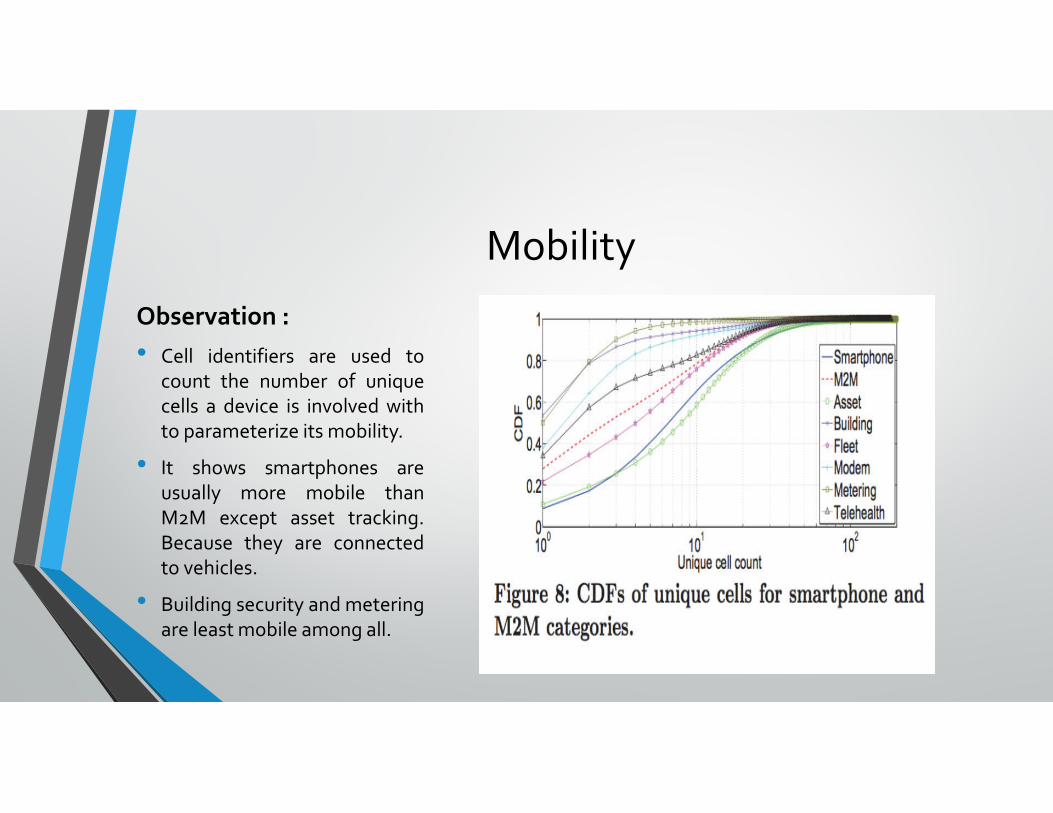
• Cell identifiers are used tocount the number of uniquecells a device is involved withto parameterize its mobility.
• It shows smartphones areusually more mobile thanM2M except asset tracking.Because they are connectedto vehicles.
• Building security and meteringare least mobile among all.
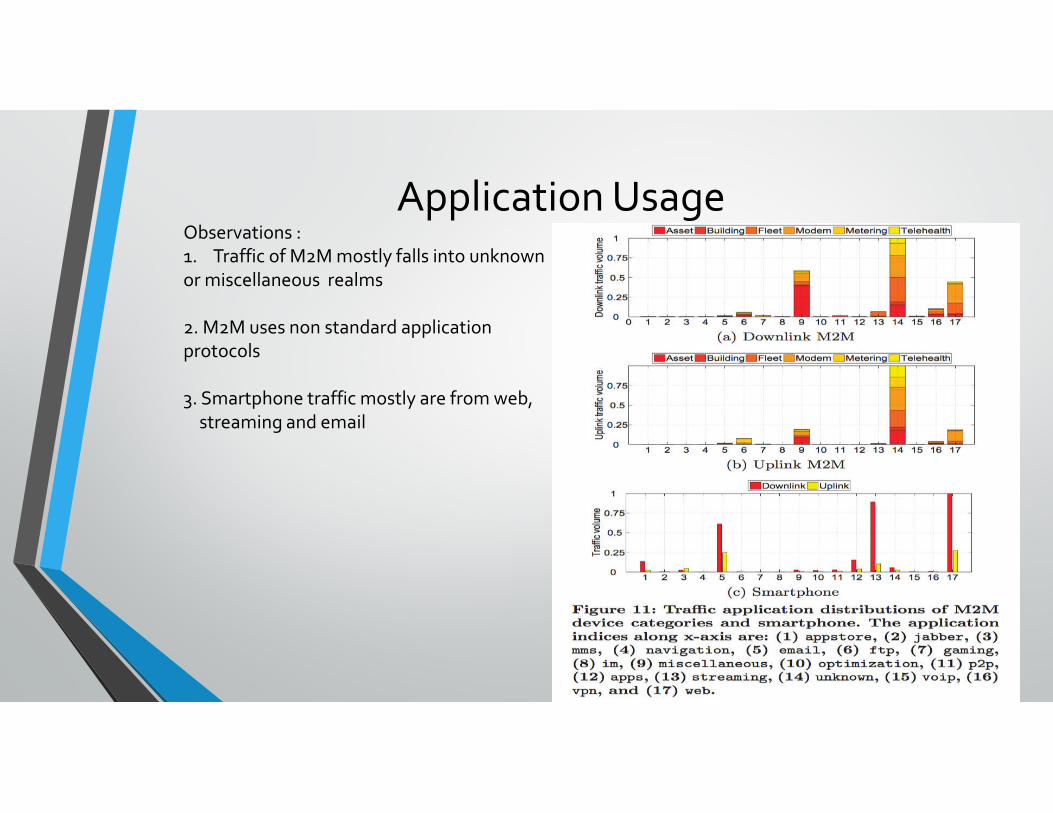
Application UsageObservations :1. Traffic of M2M mostly falls into unknown or miscellaneous realms
2. M2M uses non standard application protocols
3. Smartphone traffic mostly are from web,streaming and email
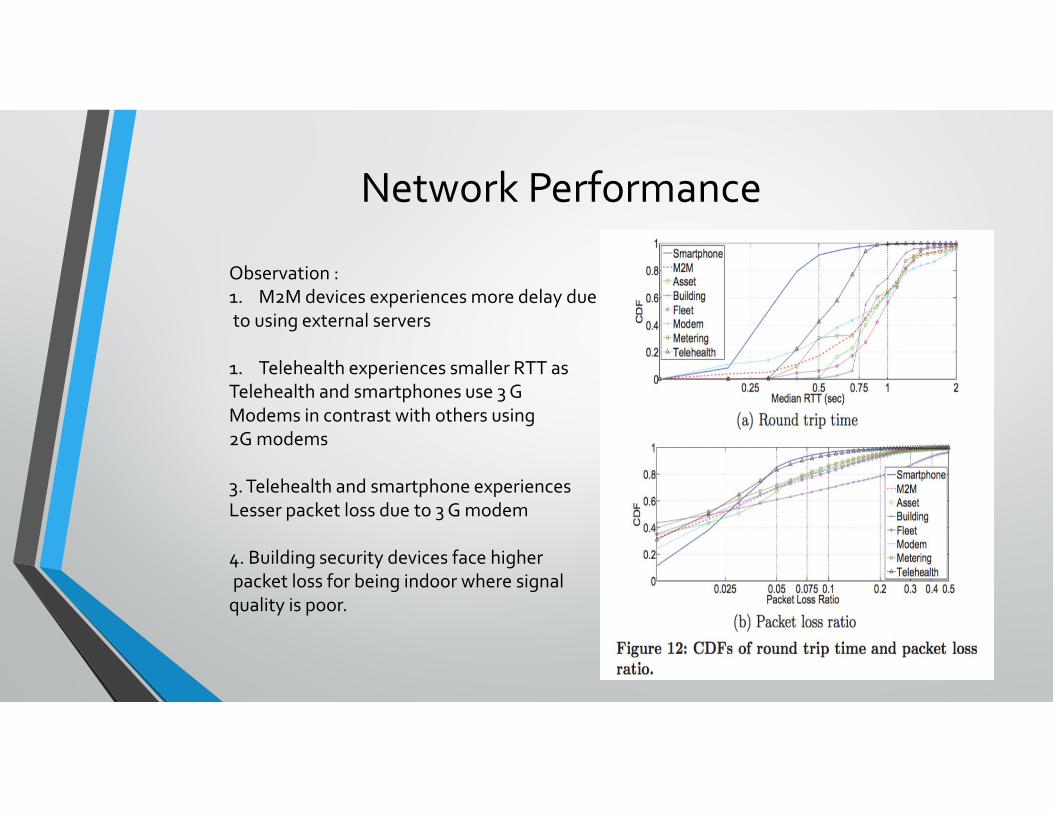
Network Performance
Observation :1. M2M devices experiences more delay dueto using external servers
1. Telehealth experiences smaller RTT as Telehealth and smartphones use 3 G Modems in contrast with others using 2G modems
3. Telehealth and smartphone experiences Lesser packet loss due to 3 G modem
4. Building security devices face higherpacket loss for being indoor where signal
quality is poor.
Conclusion (in comparison with smartphone traffic)
• Average traffic volume is lower than smartphone
• Traffic volume respect to different day of a week depends on human ‘wake’ time
• Traffic volume peak frequency is synchronous in 1hour to 15 min period of time
• Active time is lower , session length can be high and inter arrival of session time is higher
• Less mobile
• Network performance is lower in terms of packet loss and RTT