traffic impact fee nexus study dec 2014 - simi valley
TRANSCRIPT

SIMI VALLEY TRAFFIC IMPACT FEE Nexus Study
Submitted to:
City of Simi Valley
Adopted December 2014
17J13‐1763
Submitted by:

Page i City of Simi Valley
TABLE OF CONTENTS
Table of Contents .................................................................................................................................. i
Appendices ........................................................................................................................................... i
List of Tables ........................................................................................................................................ ii
List of Figures ....................................................................................................................................... ii
Executive Summary ............................................................................................................................. 3
1.0 Introduction ............................................................................................................................. 3
1.1 BACKGROUND ................................................................................................................................... 3 1.2 CALIFORNIA MITIGATION FEE ACT ........................................................................................................ 4
2.0 Travel Demand Forecasting and Analysis .................................................................................. 5
2.1 TRAVEL DEMAND FORECASTING ........................................................................................................... 5 2.2 INTERSECTION LOS ANALYSIS .............................................................................................................. 7
3.0 Traffic Impact Fee Project List ................................................................................................. 12
4.0 Project Cost Estimates ............................................................................................................ 13
4.1 UNIT COSTS .................................................................................................................................... 15 4.2 INTERSECTION IMPROVEMENT COST ESTIMATES ................................................................................... 15
5.0 Traffic Impact Fee ................................................................................................................... 18
5.1 COST INCREASES OVER TIME ............................................................................................................. 18
APPENDICES
Appendix A: Mitigation Fee Act & Resolution 91‐93 Appendix B: LOS Calculation Sheets Appendix C: Detailed Improvement Cost Estimates Appendix D: Fair Share Calculation Sheets

Page ii City of Simi Valley
LIST OF TABLES
Table 1: Total Generated Trips...................................................................................................................... 6 Table 2: Signalized Intersection Level of Service Definitions ........................................................................ 7 Table 3: Unsignalized Intersection Level of Service Definitions ................................................................... 8 Table 4: “Adopted” General Plan Buildout with Existing Lane Geometry ‐ Intersection LOS .................... 10 Table 5: Improvement Project List .............................................................................................................. 12 Table 6: Improvement Project Costs ........................................................................................................... 16 Table 7: Total Transportation Improvement Costs ..................................................................................... 18
LIST OF FIGURES
Figure 1: Study Intersection Locations .......................................................................................................... 9 Figure 2: Study Intersections Requiring Improvements ............................................................................. 14

Page 3 City of Simi Valley
EXECUTIVE SUMMARY
This Traffic Impact Fee Nexus Study describes the methodology and summarizes the results of a study conducted by Iteris, Inc. (Iteris) to update the current Traffic Impact Fee Program for the City of Simi Valley. The purpose of the Traffic Impact Fee is to collect funds for transportation infrastructure improvements aimed at relieving projected mobility deficiencies and unacceptable traffic operating conditions expected to exist as a result of the new developments within Simi Valley per buildout of the City’s General Plan. This report identifies the purpose of the fee and demonstrates a reasonable relationship (nexus) between the fee and the purpose for which it is to be collected, thus satisfying the requirements of the California Mitigation Fee Act. The net final total cost to improve the City’s transportation system at full buildout of the General Plan, was estimated at $19,431,100. The Traffic Impact Fee was calculated by dividing the total costs of the transportation improvements by the 240,846 net daily trips which are projected to be generated by new development within the City by the buildout of the General Plan land uses. The maximum nexus fee as a result of the projected new daily trips is $80.68 per generated daily trip. This Nexus Fee Study only recommends this maximum fee per trip that by state law nexus is connected to and can be assessed to new development. The staff report, which will be drafted for consideration by the City Council based on the results of this study, will recommend the parameters of the actual updated traffic impact fee program.
1.0 INTRODUCTION
The purpose of this traffic impact fee nexus study is to describe the methodology used and summarize the results of a study conducted by Iteris. Inc. (Iteris) to update the traffic impact fee in the City of Simi Valley. The Traffic Impact Fee is intended to be used to collect funds for transportation infrastructure improvements aimed at relieving projected transportation deficiencies and unacceptable traffic operating conditions which are forecast to be caused by new development within Simi Valley, per build out of the City’s General Plan. This report identifies the purpose of the fee and demonstrates a reasonable relationship (nexus) between the fee and the purpose for which it is to be collected.
1.1 BACKGROUND
As part of Resolution 91‐93, the City Council initially adopted a traffic impact fee of $22.38 per daily vehicle trip end for residential development and $10.50 per daily vehicle trip end for nonresidential

Page 4 City of Simi Valley
development. This fee was later updated to $33.00 per daily vehicle trip end for residential development and $15.50 per daily vehicle trip end for nonresidential development. The City must comply with California Government Code Section 66000 and as part of the code, the City is required to make certain findings via a nexus study in order to establish a valid traffic impact fee. Without the required findings, the traffic impact fee, as it is currently constructed, may be invalidated by a court of law. Appendix A includes a complete version of Resolution 91‐93.
1.2 CALIFORNIA MITIGATION FEE ACT
New development lays the groundwork for population increases and job opportunities within the City. However, as population and employment increase, the need for planning and implementing circulation system improvements also increases. California Government Code Section 66000 et seq. enables local agencies to charge a mitigation fee. A mitigation fee, also known as a development impact fee, is a monetary exaction imposed by a government agency upon an applicant seeking approval for a development project. The fee is applied towards the cost of traffic‐related public infrastructure improvements within the jurisdiction, and is not a tax or special assessment. The fee is to be used to finance only those circulation system improvements which are related to the type of development that will generate an increase in traffic. The Mitigation Fee Act requirements in California Government Code Section 66001 require specific nexus requirements to be satisfied for fees related to traffic mitigation improvements. These requirements include: 66001. (a) In any action establishing, increasing, or imposing a fee as a condition of approval of a development project by a local agency, the local agency shall do all of the following:
(1) Identify the purpose of the fee. (2) Identify the use to which the fee is to be put. If the use is financing public facilities, the facilities shall be identified. That identification may, but need not, be made by reference to a capital improvement plan as specified in Section 65403 or 66002, may be made in applicable general or specific plan requirements, or may be made in other public documents that identify the public facilities for which the fee is charged. (3) Determine how there is a reasonable relationship between the fee's use and the type of development project on which the fee is imposed. (4) Determine how there is a reasonable relationship between the need for the public facility and the type of development project on which the fee is imposed.
Appendix A includes a complete version of California Government Code Section 66000‐66008.

Page 5 City of Simi Valley
2.0 TRAVEL DEMAND FORECASTING AND ANALYSIS
This section describes the methodology used to forecast the future peak hour traffic volumes that are expected to be generated by the buildout of the City’s 2012 General Plan land uses using the City’s travel demand model (Simi Valley Traffic Analysis Model, or SVTAM). The section also discusses the resulting intersection levels of service (LOS) analysis conducted for the projected future peak hour intersection traffic volumes.
2.1 TRAVEL DEMAND FORECASTING
The Simi Valley Traffic Analysis Model (SVTAM) was used to analyze the traffic impacts of projected development within the City at buildout of the City’s General Plan land uses. The model was developed by Iteris in 2007 as a part of the 2012 General Plan Update Circulation and Mobility Element process. The SVTAM was created as a focused travel demand model for the City from the Southern California Association of Governments (SCAG) regional model. At the time of the development, this model had a 2006 base year and 2030 as a regional horizon year for the future. The SCAG regional model attributed only 25 traffic analysis zones (TAZs) to the City of Simi Valley. As part of the work effort done for the Circulation and Mobility Element Update, these 25 zones were disaggregated to 342 smaller zones covering the City. Land use quantities were estimated for the buildout conditions of the study area for each of the TAZs. These model input data include key input variables such as the number of single and multiple dwelling units, population, retail, and total employment among others for each TAZ. The SVTAM highway network was also obtained from SCAG and refined by adding secondary and minor arterials, collector streets, and refined zonal connectors within the City to represent a more detailed network consistent with the developed finer zone system. As part of this fee update study, an updated base year 2013 model was created to supplant the original 2006 model, using updated land use data provided by the City. The data included development that had already been completed between 2006 and 2013. The updated base year model was created in order to more accurately estimate the growth in vehicle trips between current conditions (at the time of the fee update study) and projected buildout conditions. In total, the SVTAM consists of 35 unique land‐use categories in the 2006 and updated 2013 base condition. In 2030, the same 35 unique land use categories are included as well as three new categories of Mixed‐use Residential, Mixed‐use Office, and Mixed‐use Retail, as proposed by the General Plan Update process. For the 2030 Buildout year, the General Plan Update Environmental Impact Report (EIR) assumed and analyzed a more intensive land use mix than what was ultimately approved (adopted) by the City Council in 2012. Therefore, as part of this nexus study, a new set of forecast model runs and related
Page 6 City of Simi Valley
traffic analyses were conducted to correspond to the “Adopted” land use scenario to determine the needed circulation improvements at buildout conditions. The “Adopted” General Plan scenario consists of the following total generalized land use quantities for the entire City of Simi Valley:
Residential – 53, 669 units
Retail – 7,980,000 square feet
Office – 6,412,000 square feet
Business Park – 5,940,000 square feet
Industrial – 12,577,000 square feet It should be noted that there is no specific timeframe (projected year) associated with the build‐out of the General Plan, and these development estimates are intended to provide overall estimates of the potential for population and employment growth in the City of Simi Valley generally over the next 20 years. The model was run using these new buildout land uses and the generated trips in the City plus the estimated other 2030 trips generated from all other zones in the model representing the Southern California region. Table 1 summarizes the inbound, outbound, and total daily trips generated by Simi Valley TAZs for the initial base 2006 scenario, the updated 2013 scenario, and the “Adopted” General Plan Buildout 2030 scenario.
TABLE 1: TOTAL GENERATED TRIPS
Year Daily Inbound Trips Daily Outbound Trips Total Daily Trips
Base Year 2006 442,563 447,795 890,358
Updated Base Year 2013 455,448 460,772 916,220
“Adopted” GP Year 2030 575,292 581,774 1,157,066
Increase in trips between 2013 and 2030
119,844 121,002 240,846
As shown in Table 1, the projected total increase in daily trips as a result of new development in the City of Simi Valley between 2013 and 2030 is estimated at 240,846 daily trips. This number represents the total trip difference between City TAZs in the two model year scenarios, and includes contributions from all land uses. The City does not exempt any land uses in the calculation of total daily trips attributed to new development. However, public schools are exempt from local planning regulations and may not pay their share of the traffic impact fees. Their share of the fee would likely be borne by the City’s General Fund.

Page 7 City of Simi Valley
2.2 INTERSECTION LOS ANALYSIS
Intersections are typically considered to represent the most critical locations for traffic flow bottlenecks and congestion on roadways with interrupted traffic flow, since at intersections the right‐of‐way must be shared by opposing traffic streams, creating conflicting traffic movements. For purposes of this study, intersection level of service (LOS) is measured to determine the peak hour operating conditions at the study intersections. Table 2 outlines the LOS concept for signalized intersections using the Intersection Capacity Utilization (ICU) methodology, as the standard recognized and used per the City of Simi Valley General Plan, as adopted by the City Council.
TABLE 2: SIGNALIZED INTERSECTION LEVEL OF SERVICE DEFINITIONS
Level of
Service Description
Signalized Intersection Volume‐to‐Capacity Ratio
(V/C)
A Free flowing, virtually no delay. Minimal Traffic. < 0.600
B Free flow and choice of lanes. Delays are minimal. All cars clear intersection easily.
>0.600 to 0.699
C Good operation. Delays starting to become a factor but still within acceptable limits.
>0.700 to 0.799
D
Approaching unstable flow. Queues at intersection are quite long but most cars clear intersection on their green signal. Occasionally, several vehicles must wait for a second green signal. Congestion is moderate.
>0.800 to 0.899
E Severe Congestion and delay. Most of the available capacity is used. Many cars must wait through a complete signal cycle to clear the intersection.
>0.900 to 0.999
F Excessive delay and congestion. Most cars must wait through more than one on one signal cycle. Queues are very long and drivers are obviously irritated.
> 1.000
Table 3 outlines the LOS concept for unsignalized intersections using the Highway Capacity Manual (HCM) methodology.

Page 8 City of Simi Valley
TABLE 3: UNSIGNALIZED INTERSECTION LEVEL OF SERVICE DEFINITIONS
Level of
Service Description
Unsignalized Intersection
Delay (seconds per vehicle)
A Excellent operation. All approaches to the intersection appear quite open, turning movements are easily made, and nearly all drivers find freedom of operation.
< 10
B Very good operation. Many drivers begin to feel somewhat restricted within platoons of vehicles. This represents stable flow. An approach to an intersection may occasionally be fully utilized and traffic queues start to form.
>10 and < 15
C Good operation. Occasionally drivers may have to wait more than 60 seconds, and back‐ups may develop behind turning vehicles. Most drivers feel somewhat restricted.
>15 and < 25
D Fair operation. Cars are sometimes required to wait more than 60 seconds during short peaks. There are no long‐standing traffic queues.
>25 and < 35
E Poor operation. Some long‐standing vehicular queues develop on critical approaches to intersections. Delays may be up to several minutes.
>35 and < 50
F
Forced flow. Represents jammed conditions. Backups form locations downstream or on the cross street may restrict or prevent movement of vehicles out of the intersection approach lanes; therefore, volumes carried are not predictable. Potential for stop and go type traffic flow.
> 50
Source: Highway Capacity Manual, Special Report 209, Transportation Research Board, Washington, DC, 2000.
The City of Simi Valley’s adopted policy for minimum vehicular operating condition standards for intersections aims to achieve level of service (LOS) C or better during peak hour periods. Consistent with the analyses performed under the General Plan and EIR process, level of service conditions were analyzed for 81 key intersections in the City during morning (a.m.) and afternoon (p.m.) peak hours. Figure 1 shows the locations of the 81 study intersections. As a first step in determining future capacity needs, Table 4 summarizes the LOS at the 81 study intersections given the land uses in the buildout of the “Adopted” General Plan but assuming only the existing configurations and lane geometry at all study intersections. This scenario was used to determine the possible expected extent of future intersection deficiencies if the City were not to make any improvements to the roadway network and intersections through the buildout year 2030. Detailed intersection LOS calculation sheets are provided in Appendix B.

FIGURE 1Study Intersection Locations
Legend
City Boundary
X Study Intersection
City of Simi Valley
Traffic Impact Fee Nexus Study
X
12
7
6
4
513
9
12
10
1114
15
16
171819
2022
23
24
25
26
27
28
29
30
3132
33
34
35
36
37
38
39
40
41
42
43
44
45
46
47
4849
50
51
52
53
54
55
56
5758
59
60
61
62
63
64
65
66
67
6869
7071
72
73
74
75
7677
81 78
79
80
3
8
21
Los Angeles Ave
Tierra Rejada Rd
Madera Rd
Wood R
anch
Pkw
y
Long Can
yon R
d
Cochran StM
ad
era
R
d
Easy St
Sin
alo
a R
d
1st
St
Simi Town Ctr Wy
Err
ing
er
Rd
Patricia Ave
Fitzgerald Ave
Royal St
Heywood St
Sycam
ore
Dr
Reserv
oir
Dr
Gale
na A
ve
Seq
uo
ia A
ve
Lost Canyons Rd
Township Ave
Avenida Simi
Alamo St
Los Angeles Ave
Cochran St
Guardian St
Tap
o C
yn
R
d
Tap
o S
t
Cottonwood DrPresidio Dr
Walnut St
Kadota St
Texas A
ve
Rals
ton
Ave
Leeds St
Ste
arn
s S
t
Sto
w S
t
Yo
se
mit
e
Av
e
Ku
eh
ner
Dr
Katherine Rd
Santa Susana Rd
Fla
nag
an D
r
118
118
Sta
rgaze
Pl

Page 10
City of Simi Valley
TABLE 4: “ADOPTED” GENERAL PLAN BUILDOUT WITH EXISTING LANE GEOMETRY ‐ INTERSECTION LOS
Intersection Traffic Control
AM Peak Hour PM Peak Hour
V/C Ratio
Delay (sec)
LOS V/C Ratio
Delay (sec)
LOS
1 Rocky Peak Fire Rd & SR‐118 WB Unsignalized ‐ 17.0 C ‐ 929.0 F
2 Rocky Peak Fire Rd & SR‐118 EB Unsignalized ‐ 15.4 C ‐ 153.6 F
3 Kuehner Dr & Smith Rd Signal 0.40 ‐ A 0.44 ‐ A
4 Kuehner Dr & Katherine Rd Signal 0.57 ‐ A 0.34 ‐ A
5 Kuehner Dr & Los Angeles Ave Unsignalized 0.71 20.6 C 1.25 100.6 F
6 Kuehner Dr & SR‐118 EB On‐Off Unsignalized ‐ 10.7 B ‐ 17.9 C
7 Kuehner Dr & SR‐118 WB On‐Off Unsignalized ‐ 126.5 F ‐ 553.9 F
8 Yosemite Ave & Evening Sky Dr Unsignalized 0.43 10.1 B 0.21 8.4 A
9 Yosemite Ave & Alamo St Unsignalized 0.94 37.5 E 0.60 16.8 C
10 Yosemite Ave & SR‐118 WB On‐Of Signal 0.58 ‐ A 0.42 ‐ A
11 Yosemite Ave & SR‐118 EB On‐Of Signal 0.45 ‐ A 0.39 ‐ A
12 Yosemite Ave & Cochran St Signal 0.55 ‐ A 0.40 ‐ A
13 Yosemite Ave & Los Angeles Ave Signal 0.76 ‐ C 0.89 ‐ D
14 Stow St & Cochran St Signal 0.36 ‐ A 0.18 ‐ A
15 Stow St & Los Angeles Ave Signal 0.58 ‐ A 0.73 ‐ C
16 Stearns St & Alamo St Signal 0.44 ‐ A 0.39 ‐ A
17 Stearns St & SR‐118 WB On‐Off Signal 0.51 ‐ A 0.42 ‐ A
18 Stearns St & SR‐118 EB On‐Off Signal 0.42 ‐ A 0.38 ‐ A
19 Stearns St & Cochran St Signal 0.79 ‐ C 0.67 ‐ B
20 Stearns St & Los Angeles Ave Signal 0.80 ‐ C 0.86 ‐ D
21 Los Angeles Ave & Hidden Ranch Signal 0.51 ‐ A 0.88 ‐ D
22 Los Angeles Ave & Ralston Ave Unsignalized ‐ 99.8 F ‐ 292.1 F
23 Kadota St & Cochran St Unsignalized ‐ 17.6 C ‐ 14.3 B
24 Kadota St & Alamo St Unsignalized ‐ 48.5 E ‐ 33.9 D
25 Tapo St & Walnut St Unsignalized 0.48 11.4 B 0.25 9.4 A
26 Tapo St & Alamo St Signal 0.55 ‐ A 0.46 ‐ A
27 Tapo St & Cochran St Signal 0.55 ‐ A 0.55 ‐ A
28 Tapo St & Los Angeles Ave Signal 0.65 ‐ B 0.90 ‐ D
29 Tapo Canyon Rd & Royal Ave Unsignalized 0.73 20.3 C 0.85 26.3 D
30 Tapo Canyon Rd & Los Angeles Ave Signal 0.89 ‐ D 1.02 ‐ F
31 Tapo Canyon Rd & Cochran St Signal 0.80 ‐ D 0.81 ‐ D
32 Tapo Canyon Rd & SR‐118 EB On‐ Signal 0.62 ‐ B 0.59 ‐ A
33 Tapo Canyon Rd & SR‐118 WB On‐ Signal 0.50 ‐ A 0.62 ‐ B
34 Tapo Canyon Rd & Alamo St Signal 0.45 ‐ A 0.47 ‐ A
35 Tapo Canyon Rd & Township Ave Signal 0.40 ‐ A 0.26 ‐ A
36 Tapo Canyon Rd & Lost Canyons Unsignalized ‐ 17.1 C ‐ 11.7 B
37 Sequoia Ave & Alamo St Signal 0.52 ‐ A 0.63 ‐ B
38 Sequoia Ave & Cochran St Signal 0.54 ‐ A 0.60 ‐ A
39 Sequoia Ave & Los Angeles Ave Signal 0.73 ‐ C 0.83 ‐ D
40 Sequoia Ave & Royal Ave Signal 0.35 ‐ A 0.53 ‐ A
41 Cochran St & Galena Ave Signal 0.39 ‐ A 0.53 ‐ A
42 Sycamore Dr & Alamo St Signal 0.68 ‐ B 0.73 ‐ C
43 Sycamore Dr & SR‐118 WB On‐Off Signal 0.46 ‐ A 0.50 ‐ A
44 Sycamore Dr & SR‐118 EB On‐Off Signal 0.65 ‐ B 0.64 ‐ B
45 Sycamore Dr & Cochran St Signal 0.61 ‐ B 0.64 ‐ B
46 Sycamore Dr & Los Angeles Ave Signal 0.82 ‐ D 0.89 ‐ D
47 Sycamore Dr & Royal Ave Signal 0.62 ‐ B 0.52 ‐ A
48 Sycamore Dr & Fitzgerald Rd Unsignalized 0.57 13.6 B 0.51 13.4 B

Page 11
City of Simi Valley
49 Erringer Rd & Fitzgerald Rd Unsignalized 0.64 18.3 C 0.41 12.7 B
50 Erringer Rd & Royal Ave Signal 0.77 ‐ C 0.81 ‐ D
51 Erringer Rd & Patricia Ave Signal 0.49 ‐ A 0.51 ‐ A
52 Erringer Rd & Los Angeles Ave Signal 0.72 ‐ C 0.81 ‐ D
53 Erringer Rd & Cochran St Signal 0.63 ‐ B 0.69 ‐ B
54 Erringer Rd & SR‐118 EB On‐Off Signal 0.33 ‐ A 0.49 ‐ A
55 Erringer Rd & SR‐118 WB On‐Off Signal 0.41 ‐ A 0.53 ‐ A
56 Erringer Rd & Alamo St Signal 0.44 ‐ A 0.76 ‐ C
57 Los Angeles Ave & Hubbard St Signal 0.33 ‐ A 0.49 ‐ A
58 Los Angeles Ave & Patricia Ave Signal 0.69 ‐ B 0.85 ‐ D
59 First St & SR‐118 WB On‐Off Ramp Signal 0.54 ‐ A 0.64 ‐ B
60 First St & SR‐118 EB On‐Off Ramp Signal 0.53 ‐ A 0.73 ‐ C
61 First St & Cochran St Signal 0.56 ‐ A 0.70 ‐ C
62 First St & E Easy St Signal 0.70 ‐ C 0.91 ‐ E
63 First St & Los Angeles Ave Signal 0.79 ‐ C 0.89 ‐ D
64 First St & Royal Ave Signal 0.92 ‐ E 0.77 ‐ C
65 First St & Fitzgerald Rd Signal 0.59 ‐ A 0.47 ‐ A
66 Sinaloa Rd & Los Angeles Ave Signal 0.58 ‐ A 0.75 ‐ C
67 Sinaloa Rd & Royal Ave Signal 0.71 ‐ C 0.62 ‐ B
68 Viewline Dr & SR‐118 WB On‐Off Signal 0.46 ‐ A 0.57 ‐ A
69 Madera Rd & Viewline Dr Signal 0.45 ‐ A 0.53 ‐ A
70 Madera Rd & SR‐118 EB On‐Off Ramp Signal 0.32 ‐ A 0.36 ‐ A
71 Madera Rd & Cochran St Signal 0.53 ‐ A 0.84 ‐ D
72 Madera Rd & Easy St Signal 0.47 ‐ A 0.66 ‐ B
73 Madera Rd & Los Angeles Ave/Tierra Rejada Signal 0.68 ‐ B 0.81 ‐ D
74 Madera Rd & Royal Ave Signal 0.60 ‐ A 0.73 ‐ C
75 Tierra Rejada Rd & Stargaze Pl Signal 0.28 ‐ A 0.35 ‐ A
76 Madera Rd & Country Club Dr East Signal 0.86 ‐ D 0.67 ‐ B
77 Wood Ranch Parkway & Madera Rd Signal 0.87 ‐ D 0.88 ‐ D
78 Wood Ranch Parkway & Country Club Signal 0.53 ‐ A 0.50 ‐ A
79 Wood Ranch Parkway & Long Canyon Unsignalized 0.44 12.1 B 0.32 10.0 B
80 Madera Rd & Presidential Dr Signal 0.81 ‐ D 0.73 ‐ C
81 Madera Rd & Country Club Dr West Signal 0.90 ‐ E 0.67 ‐ B
Notes: V/C = Volume to Capacity Ratio, LOS = Level of Service, Delay = Average Vehicle Delay (Seconds) BOLD indicates deficient operation.
As shown in Table 4, several intersections are expected to operate at unacceptable levels of service (LOS D or worse) given the buildout of the “Adopted” General Plan land uses and assuming the existing circulation network. By State law, the traffic impact fee is only to address projected future deficiencies and is not intended to be collected to improve any existing intersection LOS deficiencies. The following three intersections are currently operating at LOS D or worse as noted in the General Plan Update Circulation and Mobility Element, and are shown to continue to operate at LOS D or worse with the “Adopted” General Plan Buildout:
#7 ‐ Kuehner Drive/SR‐118 Westbound Ramps;
#24‐ Kadota Street/Alamo Street; and
#29 ‐ Tapo Canyon Road/Royal Avenue. New development would continue to add trips to the already deficient intersections, worsening the traffic operating conditions. A discussion of how improvement costs are calculated for these currently
Page 12
City of Simi Valley
deficient intersections, based on the portion future trips only, known as a “fair share” percentage, is provided in Section 4.2.
3.0 TRAFFIC IMPACT FEE PROJECT LIST
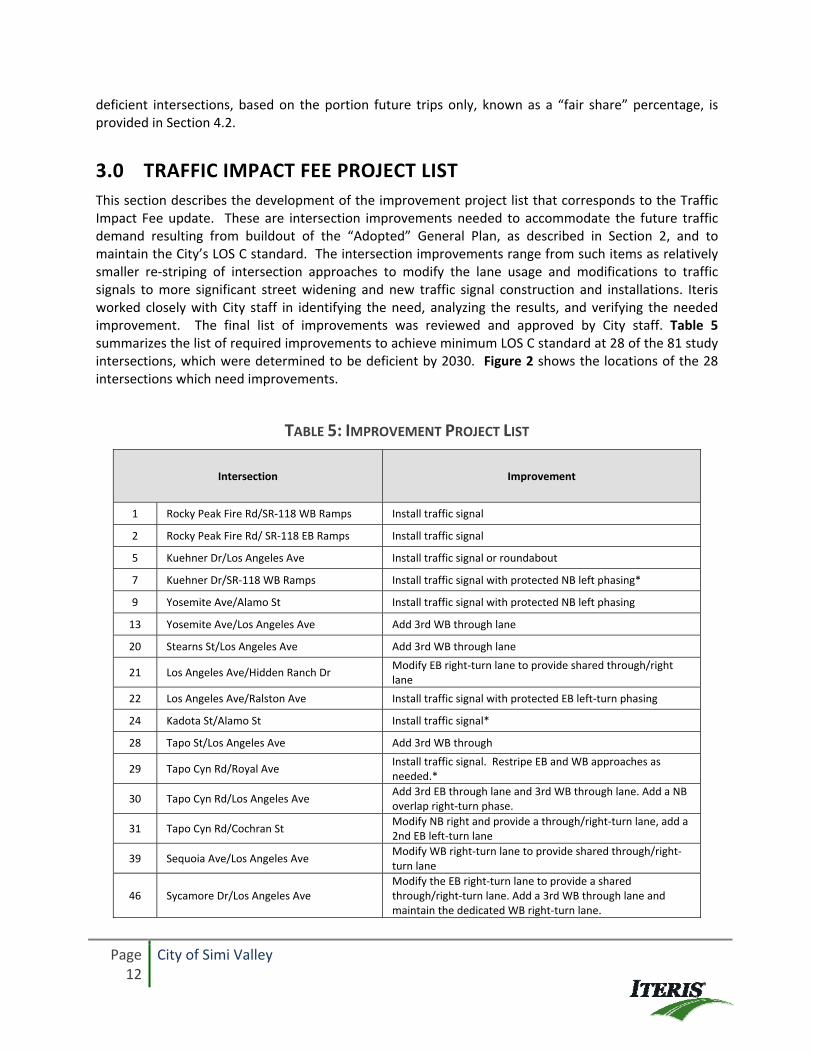
This section describes the development of the improvement project list that corresponds to the Traffic Impact Fee update. These are intersection improvements needed to accommodate the future traffic demand resulting from buildout of the “Adopted” General Plan, as described in Section 2, and to maintain the City’s LOS C standard. The intersection improvements range from such items as relatively smaller re‐striping of intersection approaches to modify the lane usage and modifications to traffic signals to more significant street widening and new traffic signal construction and installations. Iteris worked closely with City staff in identifying the need, analyzing the results, and verifying the needed improvement. The final list of improvements was reviewed and approved by City staff. Table 5 summarizes the list of required improvements to achieve minimum LOS C standard at 28 of the 81 study intersections, which were determined to be deficient by 2030. Figure 2 shows the locations of the 28 intersections which need improvements.
TABLE 5: IMPROVEMENT PROJECT LIST
Intersection Improvement
1 Rocky Peak Fire Rd/SR‐118 WB Ramps Install traffic signal
2 Rocky Peak Fire Rd/ SR‐118 EB Ramps Install traffic signal
5 Kuehner Dr/Los Angeles Ave Install traffic signal or roundabout
7 Kuehner Dr/SR‐118 WB Ramps Install traffic signal with protected NB left phasing*
9 Yosemite Ave/Alamo St Install traffic signal with protected NB left phasing
13 Yosemite Ave/Los Angeles Ave Add 3rd WB through lane
20 Stearns St/Los Angeles Ave Add 3rd WB through lane
21 Los Angeles Ave/Hidden Ranch Dr Modify EB right‐turn lane to provide shared through/right lane
22 Los Angeles Ave/Ralston Ave Install traffic signal with protected EB left‐turn phasing
24 Kadota St/Alamo St Install traffic signal*
28 Tapo St/Los Angeles Ave Add 3rd WB through
29 Tapo Cyn Rd/Royal Ave Install traffic signal. Restripe EB and WB approaches as needed.*
30 Tapo Cyn Rd/Los Angeles Ave Add 3rd EB through lane and 3rd WB through lane. Add a NB overlap right‐turn phase.
31 Tapo Cyn Rd/Cochran St Modify NB right and provide a through/right‐turn lane, add a 2nd EB left‐turn lane
39 Sequoia Ave/Los Angeles Ave Modify WB right‐turn lane to provide shared through/right‐turn lane
46 Sycamore Dr/Los Angeles Ave Modify the EB right‐turn lane to provide a shared through/right‐turn lane. Add a 3rd WB through lane and maintain the dedicated WB right‐turn lane.

Page 13
City of Simi Valley
Intersection Improvement
50 Erringer Rd/Royal Ave Add a dedicated WB right‐turn lane
52 Erringer Rd/Los Angeles Ave Add a 2nd EB left‐turn lane and a 2nd WB left‐turn lane
58 Los Angeles Ave/Patricia Ave
Modify signal to provide NB & SB protected/permissive phasing. Restripe NB shared left‐turn/through/right‐turn lane to provide 1 left‐turn lane and 1 through/right‐turn lane. Add 1 WB right‐turn lane.
62 First St/Easy St
Restripe WB approach from 1 left‐turn lane and 1 shared through/right‐turn lane to 1 shared left‐turn/through lane and 1 right‐turn lane. Add a WB right‐turn overlap phase. Restripe EB approach from 1 left‐turn lane and 1 shared left‐turn/through/right‐turn lane to 1 left‐turn lane, 1 shared left‐turn/through lane, and 1 right‐turn lane.
63 First St/Los Angeles Ave Add 1 EB through lane
64 First St/Royal Ave Add a 2nd NB left‐turn lane and add a 2nd SB left‐turn lane
71 Madera Rd/Cochran St Restripe SB approach to provide 2 left‐turn lanes, 2 through lanes, 1 through/right‐turn lane, and 1 right‐turn lane.
73 Madera Rd/ Los Angeles Ave‐Tierra Rejada Rd
Restripe the current SB right‐turn lane to a 3rd through lane and add a dedicated SB right‐turn lane.
76 Madera Rd/Country Club Dr East Add 3rd WB through lane
77 Wood Ranch Pkwy/Madera Rd Add 3rd EB through lane and 3rd WB through lane
80 Madera Rd/Presidential Dr Add 3rd WB through lane
81 Madera Rd/Country Club Dr West Add 3rd WB through lane
* Intersection identified as having an existing deficiency, thus the cost applied to the fee will reflect a “fair share” percentage of the total improvement cost (discussed in Section 4.2).
4.0 PROJECT COST ESTIMATES
This section describes the methodology used to estimate the total cost of the intersection improvement projects described in Section 3. The cost of each improvement project is based on a unit construction cost as well as a unit cost for right‐of‐way acquisition. The unit costs were reviewed and approved by City staff. It should be noted that the cost estimates are intended to be “planning level” estimates consistent with the intent of estimated long‐range improvement costs, including appropriate levels of contingency and soft costs, which are calculated prior to availability of design details or documents related to these improvements.

FIGURE 2Study Intersections Requiring Improvements
Legend
City Boundary
X Intersection Requiring Improvement
City of Simi Valley
Traffic Impact Fee Nexus Study
X
12
7
6
4
513
9
12
10
1114
15
16
171819
2022
23
24
25
26
27
28
29
30
3132
33
34
35
36
37
38
39
40
41
42
43
44
45
46
47
4849
50
51
52
53
54
55
56
5758
59
60
61
62
63
64
65
66
67
6869
7071
72
73
74
75
7677
81 78
79
80
3
8
21
Los Angeles Ave
Tierra Rejada Rd
Madera Rd
Wood R
anch
Pkw
y
Long Can
yon R
d
Cochran StM
ad
era
R
d
Easy St
Sin
alo
a R
d
1st
St
Simi Town Ctr Wy
Err
ing
er
Rd
Patricia Ave
Fitzgerald Ave
Royal St
Heywood St
Sycam
ore
Dr
Reserv
oir
Dr
Gale
na A
ve
Seq
uo
ia A
ve
Lost Canyons Rd
Township Ave
Avenida Simi
Alamo St
Los Angeles Ave
Cochran St
Guardian St
Tap
o C
yn
R
d
Tap
o S
t
Cottonwood DrPresidio Dr
Walnut St
Kadota St
Texas A
ve
Rals
ton
Ave
Leeds St
Ste
arn
s S
t
Sto
w S
t
Yo
se
mit
e
Av
e
Ku
eh
ner
Dr
Katherine Rd
Santa Susana Rd
Fla
nag
an D
r
118
118
Sta
rgaze
Pl

Page 15
City of Simi Valley
4.1 UNIT COSTS
For each type of improvement, a unit cost for construction and right‐of‐way, if required, were developed. The following unit cost assumptions (in 2013 dollars) were used to calculate the project improvements costs:
Physical Construction cost of $75/sq ft
Using the $75/sq ft cost o Left‐turn lane would cost $180,000 o Thru lane would cost $1,080,000 o Right‐turn lane would cost $180,000
Signal Modification cost of $40,000 per intersection
New traffic signal cost of $217,000
Lane Re‐striping cost of $32,000 for one lane, plus $7,000 per additional lane at the same intersection
Power pole relocation cost of $20,000 per pole
Right‐of‐Way (ROW) costs o $35/sq ft o $16,500 per property touched
30% contingency factor added to total physical construction cost
15% Engineering fee factor added to total physical construction cost
4.2 INTERSECTION IMPROVEMENT COST ESTIMATES
Based on the unit costs for construction and ROW acquisition (where needed), as presented in Section 4.1, the intersection improvement costs are summarized in Table 6. A detailed cost breakdown illustrating the details of the cost elements at each intersection is provided in Appendix C.

Page 16
City of Simi Valley
TABLE 6: IMPROVEMENT PROJECT COSTS
Intersection Physical
Construction Cost Right‐of‐Way Cost
Total Intersection Cost
1 Rocky Peak Fire Rd/SR‐118 WB Ramps $314,650 $0 $314,650
2 Rocky Peak Fire Rd/ SR‐118 EB Ramps $314,650 $0 $314,650
5 Kuehner Dr/Los Angeles Ave $435,0001 $0 $435,0001
7 Kuehner Dr/SR‐118 WB Ramps $160,470 $33,000 $193,470*
9 Yosemite Ave/Alamo St $314,650 $0 $314,650
13 Yosemite Ave/Los Angeles Ave $1,566,000 $285,000 $1,851,000
20 Stearns St/Los Angeles Ave $1,566,000 $486,000 $2,052,000
21 Los Angeles Ave/Hidden Ranch Dr $46,400 $0 $46,400
22 Los Angeles Ave/Ralston Ave $314,650 $0 $314,650
24 Kadota St/Alamo St $12,590 $0 $12,590*
28 Tapo St/Los Angeles Ave $1,566,000 $201,000 $1,767,000
29 Tapo Cyn Rd/Royal Ave $103,940 $0 $103,940*
30 Tapo Cyn Rd/Los Angeles Ave $3,190,000 $369,000 $3,559,000
31 Tapo Cyn Rd/Cochran St $336,400 $100,500 $436,900
39 Sequoia Ave/Los Angeles Ave $46,400 $0 $46,400
46 Sycamore Dr/Los Angeles Ave $1,612,400 $504,000 $2,116,400
50 Erringer Rd/Royal Ave $261,000 $56,000 $317,000
52 Erringer Rd/Los Angeles Ave $522,000 $201,000 $723,000
58 Los Angeles Ave/Patricia Ave $365,400 $66,900 $432,300
62 First St/Easy St $114,550 $0 $114,550
63 First St/Los Angeles Ave $1,566,000 $537,000 $2,103,000
64 First St/Royal Ave $551,000 $89,000 $640,000
71 Madera Rd/Cochran St $46,400 $0 $46,400
73 Madera Rd/ Los Angeles Ave‐Tierra Rejada Rd $336,400 $117,000 $453,400
76 Madera Rd/Country Club Dr East $46,400 $0 $46,400
77 Wood Ranch Pkwy/Madera Rd $56,550 $0 $56,550
80 Madera Rd/Presidential Dr $46,400 $0 $46,400
81 Madera Rd/Country Club Dr West $46,400 $0 $46,400
Total $15,858,700 $3,045,400 $18,904,100
1= Cost shown represent construction costs for roundabout intersection design. * Intersection identified as having an existing deficiency, thus the cost applied to the fee (as shown) reflects a “fair share”
percentage of the total improvement cost.
As shown in Table 6, the total cost of required physical construction, at the 28 intersections requiring improvements, is estimated as $15,858,700. This cost includes a 30 percent contingency fee and a 15 percent engineering fee factor, as approved by the City, consistent with the planning level cost

Page 17
City of Simi Valley
estimates. Adding the ROW acquisition costs which would total $3,045,400, the total cost of intersection improvements is estimated at $18,904,100. It should be noted that only intersection improvements intended to relieve vehicular congestion are included in the costs, thus no pedestrian, bicycle, or transit improvement costs are included. Right of way costs were not included in the City’s original traffic impact fee. The City could acquire ROW as a condition of approval for projects adjacent to the intersection. Over the past 20 years though, almost all of the property adjacent to these intersections has been fully developed. It is unlikely that within the next 15 years these properties will experience redevelopment requiring discretionary review that would allow the City to require dedication of the needed ROW. The ROW acquisition cost of $3,045,400 represents only 16 percent of the total improvement cost, but 46 percent of the intersections that require improvements (13 of the 28) require ROW acquisition. Therefore, omitting ROW from the cost estimate would severely hamper the City in fully mitigating the traffic impacts of new development. As mentioned in Section 2.2, three intersections have existing LOS deficiencies as identified in the General Plan Update Circulation and Mobility Element. The traffic impact fee is not intended to collect funds to improve existing deficiencies. At these three intersections, only a portion of the overall improvement costs were applied towards the fee calculation, reflecting the portion that would be due to future growth. This portion, also known as a fair share percentage, was calculated by dividing the net new trips expected to be generated by new development by the total future trips at each intersection. The fair share calculations are provided in Appendix D. The following fair share of future traffic volumes were attributed to new development and were applied to the improvement costs:
#7 Kuehner Drive/SR‐118 Westbound Ramps – 51 percent of future trips were associated with new development
#24‐ Kadota Street/Alamo Street – 4 percent of future volumes were associated with new development
#29 ‐ Tapo Canyon Road/Royal Avenue – 28 percent of future volumes were associated with new development
In addition to physical construction and ROW costs, additional fees are included to cover internal costs over a 15‐year period to the General Plan 2030 horizon. These fees include:
Traffic Signal Maintenance and Operation Fee – This fee would be used for routine and preventative maintenance repairs of the City’s traffic signal equipment and associated lighting, as well as signal timing adjustments where applicable. The annual cost of $1,200 per traffic signal was applied, consistent with such costs in other jurisdictions. For maintenance of the City’s 70 traffic signals, the total cost over the span of 15 years would be $1,260,000.
City Administration Fee – This fee covers annual tasks related to City Council action for Engineering News Record (ENR) construction cost increases, improvement project prioritization and budgeting, and public education. A yearly fee of $3,600 was calculated based on 40 hours of staff time at $90 per hour. Over the span of 15 years, the Administration Fee would total $54,000.
5‐year Update Fee – This fee includes staff and consultant time to validate new construction, update land use data for zoning and General Plan changes, rerun the model, prepare reports,

Page 18
City of Simi Valley
and prepare Council action if necessary. The 5‐year Update would occur three times during the 15‐year period. Each update would cost $10,000, totaling $30,000 over the life of the General Plan horizon.
This total was then reduced by the current amount of funding available for circulation improvements as of September 2013, provided by City staff. Table 7 summarizes the final cost calculations.
TABLE 7: TOTAL TRANSPORTATION IMPROVEMENT COSTS
Category Cost
Intersection Improvements $18,904,100
Traffic Signal Maintenance and Operation Fee $1,260,000
City Administration Fee $54,000
5‐year Updates (Administration fee) $30,000
Existing Fund Balance ‐ $817,000
NET TOTAL $19,431,100
5.0 TRAFFIC IMPACT FEE
The Traffic Impact Fee was calculated by dividing the total costs of the intersection improvement, as calculated above (including construction, ROW, contingencies and administration minus available current funds), by the expected net daily trips forecast to be generated from new development within the City by buildout of the General Plan land uses. The final traffic impact fee, assuming the net transportation improvement cost of $19,431,150 required as a result of the 240,846 new daily trips forecast for the “Adopted” General Plan buildout scenario associated with the land uses, is $80.68 per daily trip. This calculation assumes that all “trips” are expected to equally contribute to the need for the intersection improvements, regardless of the land use types that generate the trips, per the City’s adopted daily trip generation rates. Similar to Resolution 91‐93, the fees to be collected as a result of this updated traffic impact fee nexus study are supplementary to the specific fees and conditions imposed upon individual development projects by the City. All requirements of the Mitigation Fee Act in California Government Code Section 66001 have been met by this nexus study.
5.1 COST INCREASES OVER TIME
The cost estimates used to calculate the traffic impact fee were based on 2013 dollars and unit costs applied recently in other cities. In order for the traffic impact fee to stay current with changing construction and land costs, the City of Simi Valley shall apply an inflation adjustment to the fee.

Page 19
City of Simi Valley
Construction costs shall be revised periodically to reflect changes in the Construction Cost Index published by the ENR.