traffic impact study for artesa vineyards project in … · traffic impact study for artesa...
TRANSCRIPT

FINAL REPORT Traffic Impact Study for Artesa Vineyards Project In the County of Sonoma December 2, 2004
P L E A S A N T O N • S A N T A R O S A
FINAL REPORT Traffic Impact Study for Artesa Vineyards Project In the County of Sonoma December 2, 2004 Prepared by: TJKM Transportation Consultants 141 Stony Circle, Suite 280 Santa Rosa CA 94501-4110 Tel: 707.575.5800 Fax: 707.575.5888
c:\projects\sonoma county\117-075_sonoma-artesa\report\117-075 final report.doc
TABLE OF CONTENTS
INTRODUCTION AND SUMMARY...................................................................................................................1
INTRODUCTION ...................................................................................................................................................1 SUMMARY...........................................................................................................................................................1 METHODOLOGY ..................................................................................................................................................3 INTERSECTION LEVEL OF SERVICE METHODOLOGY............................................................................................3 LEVEL OF SERVICE STANDARDS .........................................................................................................................3
EXISTING CONDITIONS ....................................................................................................................................4 ROAD NETWORK.................................................................................................................................................4 LEVEL OF SERVICE, EXISTING TRAFFIC CONDITIONS .........................................................................................4
EXISTING PLUS PROJECT CONDITIONS........................................................................................................7 TRIP GENERATION ..............................................................................................................................................7 VINEYARD TRIP DISTRIBUTION AND ASSIGNMENT .............................................................................................9 INTERSECTION LEVEL OF SERVICE ANALYSIS.....................................................................................................9 LINK LEVEL OF SERVICE ANALYSIS..................................................................................................................12
FUTURE CONDITIONS .....................................................................................................................................14 FUTURE TRAFFIC CONDITIONS..........................................................................................................................14 INTERSECTION LEVEL OF SERVICE, FUTURE CONDITIONS ................................................................................14
FUTURE PLUS PROJECT CONDITIONS.........................................................................................................16 TRIP GENERATION, DISTRIBUTION, AND ASSIGNMENT.....................................................................................16 INTERSECTION LEVEL OF SERVICE ANALYSIS...................................................................................................16 LINK LEVEL OF SERVICE ANALYSIS, 2025 FUTURE PLUS PROJECT CONDITIONS..............................................18
STUDY REFERENCES.......................................................................................................................................21 TJKM PERSONNEL ...........................................................................................................................................21 DATA COLLECTION...........................................................................................................................................21 PERSONS CONSULTED.......................................................................................................................................21 REFERENCES .....................................................................................................................................................21
APPENDIX A – LEVEL OF SERVICE METHODOLOGY APPENDIX B – LEVEL OF SERVICE WORKSHEETS: EXISTING APPENDIX C – LEVEL OF SERVICE WORKSHEETS: EXISTING + PROJECT APPENDIX D – TWO-WAY TWO-LANE HIGHWAY SEGMENT WORKSHEETS, EXISTING PLUS
PROJECT CONDITIONS APPENDIX E – LEVEL OF SERVICE WORKSHEETS: FUTURE APPENDIX F – LEVEL OF SERVICE WORKSHEETS: FUTURE + PROJECT APPENDIX G – TWO-WAY TWO-LANE HIGHWAY SEGMENT WORKSHEETS, FUTURE PLUS
PROJECT CONDITIONS

LIST OF TABLES
TABLE I : EXISTING CONDITIONS INTERSECTION LEVEL OF SERVICE......................................................................4 TABLE II: PROJECT TRIP GENERATION....................................................................................................................8 TABLE III: EXISTING PLUS PROJECT CONDITIONS INTERSECTION LEVELS OF SERVICE .........................................12 TABLE IV: EXISTING PEAK HOUR LEVEL OF SERVICE ON ARTERIAL ROADS........................................................12 TABLE V: PERCENT PROJECT CONTRIBUTION (LINK LEVEL) – EXISTING PLUS PROJECT CONDITIONS.................13 TABLE VI : FUTURE CONDITIONS INTERSECTION LEVEL OF SERVICE (NO PROJECT)............................................14 TABLE VII: FUTURE PLUS PROJECT CONDITIONS: INTERSECTION LEVELS OF SERVICE ........................................18 TABLE VIII: FUTURE + PROJECT CONDITIONS: PEAK HOUR LEVEL OF SERVICE ON ARTERIAL ROADS................18 TABLE IX: PERCENT PROJECT CONTRIBUTION (LINK LEVEL) – FUTURE PLUS PROJECT CONDITIONS..................19
LIST OF FIGURES
FIGURE 1: VICINITY MAP ........................................................................................................................................2 FIGURE 2: EXISTING TURNING MOVEMENT VOLUMES............................................................................................5 FIGURE 3: EXISTING LANE CONFIGURATIONS .........................................................................................................6 FIGURE 4: PROJECT TRIP DISTRIBUTION ...............................................................................................................10 FIGURE 5: EXISTING PLUS PROJECT TURNING MOVEMENT VOLUMES ..................................................................11 FIGURE 6: FUTURE (2025) TURNING MOVEMENT VOLUMES.................................................................................15 FIGURE 7: FUTURE PLUS PROJECT (2025) TURNING MOVEMENT VOLUMES.........................................................17

INTRODUCTION AND SUMMARY
Introduction
The conversion of approximately 200 acres of timberland to vineyard is proposed in the County of Sonoma. The project site is located southerly of Annapolis Road, approximately 5 miles east of State Route 1 (SR-1). The project site and its vicinity are shown in Figure 1.
Summary
The project is not expected to substantially increase overall delay at the intersections of SR-1/Annapolis Road, SR-1/Stewarts Point Road and Stewarts Point Road/Annapolis Road. The project does not trigger the need for traffic signal installation at these intersections. No other mitigation measures are needed. Trip generation was estimated by using production rates of typical vineyards, trip generation research for wineries conducted by Sonoma County, and telephone interview with vineyard Director of Operations. During the harvest season, the proposed 200-acre vineyard will generate 128 average employee daily trips with 78 trips occurring during the morning and afternoon periods. Two trucks per day will be required to haul the harvested grapes. The two bridges on Annapolis Road and Stewarts Point Road are expected to adequately serve projected traffic associated with the timberland conversion to a vineyard.
Artesa Vineyard Traffic Impact Study – Final Report Page 1 TJKM Transportation Consultants December 2, 2004

Figure
1117-075 - 1/8/03 - DM
County of SonomaArtesa Vineyards ProjectVicinity Map
Not to ScaleNorth
Study Intersection
LEGEND
ProjectSite
ANN APO LI
S RD.
SODA
SPRINGS RD.
KELL
Y R
D.
STEWA
R
TS POINT
STATE FORRESTRY R
D.
ANNAPOLIS
RD.
TIN BARN
RD .
KRUSE RANCH
RD.
KING RIDGE RD.
HAU
SER BRID GE RD
.
TIM
BERCOVE
RD.
SE
AV
IE
W R
D.
FORT ROS
S RD.
SKA GGS
SPRINGS RD.
OLD
STA
GE
RD
.
GUALALA RD.
13
2
1
Methodology
The study evaluated traffic conditions at the following intersections:
1. SR-1/Stewarts Point Road 2. Stewarts Point Road/Annapolis Road 3. SR-1/Annapolis Road
The study also evaluated level of service at the following links:
1. SR-1 between Annapolis Road and Stewarts Point Road 2. Annapolis Road between SR-1 and Stewarts Point Road 3. Stewarts Point Road between SR-1 and Annapolis Road
The following four scenarios were addressed in the study:
Existing Conditions – This scenario evaluates intersection and roadway conditions based on existing traffic counts and field surveys.
Existing plus Proposed Artesa Vineyard Project – This scenario evaluates
intersection and roadway conditions based on existing plus project traffic count estimates.
Future Conditions– This scenario evaluates projected intersection and roadway
conditions based on an annual growth factor that is used to extrapolate existing traffic counts into the future.
Future plus Proposed Artesa Vineyard Project – This scenario evaluates
intersection and roadway conditions based on future plus project traffic count estimates.
Intersection Level of Service Methodology
Level of Service (LOS) is a qualitative measure describing operational conditions within a traffic stream and their perception by motorists and passengers. The LOS generally describes these conditions in terms of such factors as speed and travel time, delay, freedom to maneuver, traffic interruptions, comfort and convenience, and safety. Six LOS are defined for each type of facility (i.e., roadway or intersection) that is analyzed. They are given letter designations from A to F, with LOS A representing the best operating conditions and LOS F the worst. Peak hour intersection conditions are reported as delay in seconds per vehicle with corresponding LOS. The operating conditions at all study intersections were evaluated using TRAFFIX version 7.6 software and Highway Capacity Manual (HCM) 2000 methodology. Appendix A contains a detailed description of this methodology.
Level of Service Standards
The Sonoma County General Plan is to maintain LOS C or better on arterial and collector roads. This objective is not rigidly applied and may be varied dependent upon local values (i.e., Table CT-1, Table CT-2 or Figure CT-6e [1]). The County of Sonoma has not adopted a service level standard for non-signalized intersections.
Artesa Vineyard Traffic Impact Study – Final Report Page 3 TJKM Transportation Consultants December 2, 2004

Artesa Vineyard Traffic Impact Study – Final Report Page 4 TJKM Transportation Consultants December 2, 2004
EXISTING CONDITIONS
Road Network
The project site and surrounding study area are illustrated in Figure 1. The roadways serving the project site are discussed below. SR-1 is a scenic two-lane roadway that runs north/south. The roadway has sharp horizontal curves resulting in inadequate line of sight for most sections. An advisory posted speed limit of 40 miles per hour (mph) is installed on most segments of the roadway. The peak hour traffic volume is approximately 248 vehicles per hour (vph) in the a.m. period and 214 vph in the p.m. period just north of Annapolis Road. Annapolis Road is a two lane undivided roadway with noticeable horizontal and vertical curves resulting in poor line of sight. It is a rural road fronted by open spaces, forest and vineyards. The refuse disposal transfer station located about 8.5 miles from Annapolis Road/SR-1 generates truck traffic on Annapolis Road. A small airport is also located off Annapolis Road. The posted speed limit on Annapolis Road is 30 mph. Annapolis Road ends on north at SR-1 and on the South at Stewarts Point Road via a narrow small stream bridge. The peak hour traffic volume is approximately 140 vph in the a.m. period and 158 vph in the p.m. period just east of SR-1. Stewarts Point Road is a two lane undivided roadway with noticeable horizontal and vertical curves resulting in poor line of sight for motorist. It is a rural road fronted by forests. A few farm houses can be found along Stewarts Point Road near SR-1. The peak hour traffic volume is approximately 80 vph in the a.m. period and 72 vph in the p.m. period just east of SR-1.
Level of Service, Existing Traffic Conditions
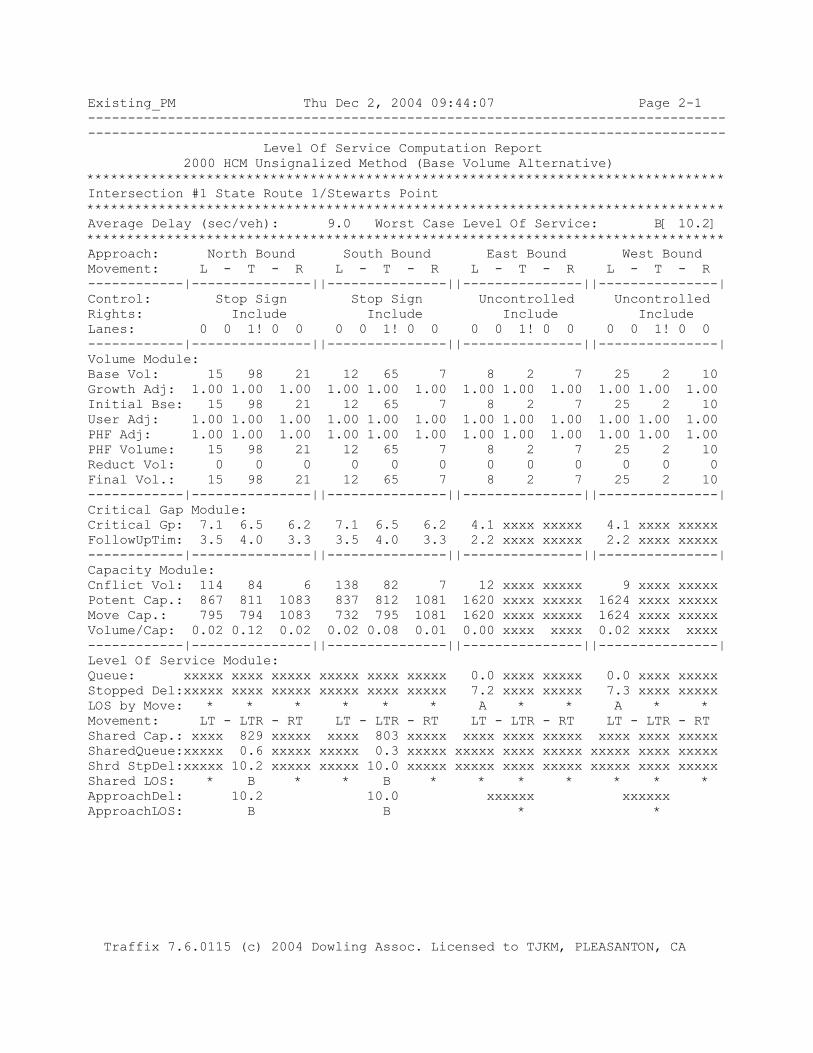
The existing a.m. and p.m. peak hour traffic turning movement counts for the study intersections were conducted by BayMetrics Traffic Resources in the second week of December 2003. Figure 2 shows the peak hour turning movement volumes at the study intersections. Figure 3 shows the existing lane configuration. All the study intersections are unsignalized and operate at an acceptable LOS A for both major and minor movements. Table I summarize the results of the intersection level of service analysis for existing conditions. Detailed calculations are contained in Appendix B.
TABLE I : EXISTING CONDITIONS INTERSECTION LEVEL OF SERVICE
A.M. Peak Hour P.M. Peak Hour Intersection
Control Delay LOS Delay LOS
State Route 1/Stewarts Point Road Two-Way STOP 8.6(9.7) A (A) 9.0(10.2) A (A) Stewarts Point Road/Annapolis Road One-Way STOP 2.8(8.6) A (A) 3.1(8.6) A (A) State Route 1/Annapolis Road One-Way STOP 7.8(10.2) A (A) 6.0(9.7) A (A)
Note: LOS = Level of Service X = Intersection level of service X.X = Overall intersection delay in seconds per vehicle (X) = Level of service for the minor approach (X.X) = Average delay for the minor approach (in seconds per vehicle) Delay = Values in parenthesis indicated average delay for the critical movement at One- and Two-Way STOP-controlled intersections.

Figure
2117-075 - 1/14/04 - DM
County of SonomaArtesa Vineyards ProjectExisting Turning Movement Volumes
Not to ScaleNorth
Study IntersectionAM Peak Hour VolumePM Peak Hour Volume
LEGEND
XX(XX)
ProjectSite
ANN APO LI
S RD.
SODA
SPRINGS RD.
KELL
Y R
D.
STEWA
RTS
POINT
STATE FORRESTRY R
D.
ANNAPOLIS
RD.
TIN BARN
RD .
KRUSE RANCH
RD.
KING RIDGE RD.
HAU
SER BRID GE RD
.
TIM
BERCOVE
RD.
SE
AV
IE
W R
D.
FORT ROS
S RD.
SKA GGS
SPRINGS RD.
OLD
STA
GE
RD
.
GUALALA RD.
13
2
1
Intersection #1State Route 1/Annapolis Rd.
Intersection #3Annapolis Rd./Stewarts Point
64 (
51)
25 (
25)
4 (8
)15
(14)
18 (2
0)12
(14)
89 (
42)
61 (
48)
34 (73)20 (12)
Intersection #2State Route 1/Stewarts Point
1 (8)0 (2)4 (7)
3 (7
)45
(65
)13
(12
)
8 (10)0 (2)29 (25)
2 (1
5)49
(98
)30
(21
)
8 (9)11 (12)

Figure
3117-075 - 1/14/04 - DM
County of SonomaArtesa Vineyards ProjectExisting Lane Configuration
Not to ScaleNorth
Study Intersection
LEGEND
ProjectSite
ANN APO LI
S RD.
SODA
SPRINGS RD.
KELL
Y R
D.
STEWA
RTS
POINT
STATE FORRESTRY R
D.
ANNAPOLIS
RD.
TIN BARN
RD .
KRUSE RANCH
RD.
KING RIDGE RD.
HAU
SER BRID GE RD
.
TIM
BERCOVE
RD.
SE
AV
IE
W R
D.
FORT ROS
S RD.
SKA GGS
SPRINGS RD.
OLD
STA
GE
RD
.
GUALALA RD.
13
2
1
Intersection #1State Route 1/Annapolis Rd.
Intersection #2State Route 1/Stewarts Point
Intersection #3Annapolis Rd./Stewarts Point

EXISTING PLUS PROJECT CONDITIONS
Trip Generation
Trip generation is defined as the number of “vehicle trips” produced by a particular land use or project. A trip is defined as a one-direction vehicle movement. The total number of trips generated by each land use includes the inbound and outbound trips. The following analysis of trip generation characteristics of vineyards is deduced from the production input and output of a typical vineyard and trip generation research for wineries conducted by Sonoma County, and telephone interview with vineyard Director of Operations. A summary of “harvest by the numbers” is given below. A single grapevine will produce 6.6 pounds of grapes during a typical year, enough to make 2.4 bottles of wine. A one-acre block of vineyard may:
Yield about 1089 vines Yield about 4.5 tons of grapes Require 2.5 labor hours for an eight-person crew
Vineyard traffic consists of two components, employee traffic and truck traffic. Trips generated during the harvest season are used for this analysis. Employees The largest component of vineyard traffic is employee trips. Seasonal employees are used during the harvest season. Seasonal employment can range from two months to six months. The number of seasonal employees needed depends upon the season and the rate at which the grapes ripen. A good yield will require about 30 to 40 tons per day harvest. It was determined from interviews with vineyard operators that seasonal workers are typically hired on a piece rate basis (i.e. paid by amount of tonnage harvested) and full time employees on an hourly basis. For a 200-acre vineyard, nine eight-person crews (i.e., 72 seasonal workers) will be needed for harvesting the grapes. Six full time employees will be needed for vineyard operations such as vineyard equipment maintenance, irrigation, tractor work etc. Employee trips constitute home to work trips, lunch trips, errands and other business trips. Ten percent of the employees are expected to carpool from home to work, 50 percent carpool for lunch and 0.2 trips per employee for errands and other business. To be conservative in our analysis, a high percentage of car ownership is assumed for seasonal workers. With an average occupancy of 3 employees per car for carpooling the average employee traffic is therefore estimated as 128 trips per day. Vineyard employees usually start work at 6:30 a.m. and get off work at 3:30 p.m. This shift is outside typical peak a.m. and p.m. periods for commute traffic. The morning and afternoon employee trips are estimated as 73 trips (obtained by assuming ten percent carpool with three person vehicle occupancy and drive alone for the remaining 70 employees). The morning and afternoon trips are the inbound and outbound trips, respectively, and are assumed to occur during the peak hour.
Artesa Vineyard Traffic Impact Study – Final Report Page 7 TJKM Transportation Consultants December 2, 2004

Truck Traffic Truck traffic varies with the season. Trucks transport grapes from vineyards to wineries during the harvest season, which runs about eight weeks between late August and late October. Non-harvest truck (gross vehicle weight less than 26,000 pounds) trips may include haulage of liquid fertilizers with a capacity of 3,000 gallons per truck. An estimate of 70 to 80 gallons of fertilizer is needed to fertilize one acre of vineyard. Fertilizer application depends upon vine needs. On the average, a 200-acre vineyard may require about six truck loads of fertilizer for the entire non-harvest seasons. Grapes are usually delivered in double gondola trucks carrying 22 tons of grapes each, or on flat bed trucks carrying 11 tons of grapes each. In order to estimate the number of trucks required to deliver grapes, a truck composition of 80 percent gondola trucks and 20 percent flat bed trucks is used. On the average, each truck hauling grapes will carry 19.8 tons of fruit. Two hundred acres of vineyard is estimated to yield 900 tons of grapes annually. This will require about 45 (= 900/19.8) trucks to haul the grapes during the harvest season. At an average harvest rate of 30 tons per day, about 30 maximum working days will be needed to harvest all 900 tons of grapes. About five days is assumed for other non-harvest activities such as loading trucks and preparing the soil for the next plantation. We can therefore estimate the total number of weekday truck trips for the harvest season as the total number of trucks divided by the number of weekdays for the harvest multiplied by two trips (one inbound and one outbound) per truck. This translates to an average of three truck trips per day required during the harvest season. Table IV below is a summary of peak hour traffic generated by the proposed vineyard.
TABLE II: PROJECT TRIP GENERATION
A.M. Peak Hour P.M. Peak Hour Employee Trips Truck Trips Total Trips Employee Trips Truck Trips Total Trips
In Out In Out In Out In Out In Out In Out 73 0 2 0 75 0 0 73 0 2 0 75
*Trips assumed to occur during a.m. and p.m. peak periods.
Artesa Vineyard Traffic Impact Study – Final Report Page 8 TJKM Transportation Consultants December 2, 2004

Artesa Vineyard Traffic Impact Study – Final Report Page 9 TJKM Transportation Consultants December 2, 2004
Vineyard Trip Distribution and Assignment
Trip distribution is the process of determining in what proportion vehicles would travel between the project site and various destinations within the study area. Trip assignment is the process of determining the various route vehicles would take from the project site to each destination. Traffic from SR-1 can only access the project site via Annapolis Road to the north and Stewarts Point Road to the south. Access via Annapolis Road appears to be the shorter of the two routes. Traffic using Stewarts Point Road will have to cross two narrow bridges with one-way traffic. This may result in more traffic using Annapolis Road to the site. Figure 4 illustrates the trip distribution assumptions. The assumptions are based on the existing traffic counts and knowledge of the area. Trips are distributed as follows:
30% of traffic using Annapolis Road will travel to and from North on SR-1 30% of traffic using Annapolis Road will travel to and from South on SR-1 5% will travel to and from the surrounding areas 5% of traffic using Stewarts Point Road will travel to and from North on SR-1 30% of traffic using Stewarts Point Road will travel to and from South on SR-1
Intersection Level of Service Analysis
Figure 5 illustrates the existing plus project traffic volume projections at the study intersections. Table III summarizes the intersection levels of service under this scenario. Detailed calculations are contained in Appendix C.

Figure
4117-075 - 1/14/04 - DM
County of SonomaArtesa Vineyards ProjectProposed Project Trip Distribution
Not to ScaleNorth
Study Intersection
LEGEND
ProjectSite
ANN APO LI
S RD.
SODA
SPRINGS RD.
KELL
Y R
D.
STEWA
R
TS POINT
STATE FORRESTRY R
D.
ANNAPOLIS
RD.
TIN BARN
RD .
KRUSE RANCH
RD.
KING RIDGE RD.
HAU
SER BRID GE RD
.
TIM
BERCOVE
RD.
SE
AV
IE
W R
D.
FORT ROS
S RD.
SKA GGS
SPRINGS RD.
OLD
STA
GE
RD
.
GUALALA RD.
13
2
35%
65%
5%

Figure
5117-075 - 1/4/04 - DM
County of SonomaArtesa Vineyards ProjectExisting + Project Turning Movement Volumes
Not to ScaleNorth
Study IntersectionAM Peak Hour VolumePM Peak Hour Volume
LEGEND
XX(XX)
ProjectSite
ANN APO LI
S RD.
SODA
SPRINGS RD.
KELL
Y R
D.
STEWA
RTS
POINT
STATE FORRESTRY R
D.
ANNAPOLIS
RD.
TIN BARN
RD .
KRUSE RANCH
RD.
KING RIDGE RD.
HAU
SER BRID GE RD
.
TIM
BERCOVE
RD.
SE
AV
IE
W R
D.
FORT ROS
S RD.
SKA GGS
SPRINGS RD.
OLD
STA
GE
RD
.
GUALALA RD.
13
2
1
Intersection #1State Route 1/Annapolis Rd.
Intersection #2State Route 1/Stewarts Point
Intersection #3Annapolis Rd./Stewarts Point
19 (8
)15
(14)
22 (2
0)12
(14)
8 (13)11 (27)
64 (
51)
25 (
25)
3 (8)0 (25)
4 (7)
3 (9
)45
(65
)13
(25
)
21 (10)23 (2)29 (25)
2 (1
5)49
(98
)30
(21
)
0 (3
8)89
(42
)61
(71
)
57 (73)20 (12)

Artesa Vineyard Traffic Impact Study – Final Report Page 12 TJKM Transportation Consultants December 2, 2004
TABLE III: EXISTING PLUS PROJECT CONDITIONS INTERSECTION LEVELS OF SERVICE
A.M. Peak Hour P.M. Peak Hour Intersection
Control Delay LOS Delay LOS
State Route 1/Stewarts Point Road Two-Way STOP 7.4(10.0) A (A) 8.6(10.4) A (A) Stewarts Point Road/Annapolis Road One-Way STOP 3.4(8.7) A (A) 4.2(8.7) A (A) State Route 1/Annapolis Road One-Way STOP 8.6(11.4) A (A) 6.7(9.9) A (A)
Note: LOS = Level of Service X = Intersection level of service X.X = Overall intersection delay in seconds per vehicle (X) = Level of service for the minor approach (X.X) = Average delay for the minor approach (in seconds per vehicle) Delay =Average stopped delay at signalized intersections and average delay for all movements at STOP-controlled intersections. Values in parenthesis indicated average delay for the critical movement at One- and Two-Way STOP-controlled intersections. With the addition of the project traffic, all the study intersections will operate at LOS A. A Comparison of Tables I and III illustrates that the levels of service for the study intersections remain unchanged with insignificant increase in approach delay in the near term.
Link Level of Service Analysis
The level of service for SR-1, Annapolis Road and Stewarts Point Road are summarized in Table IV. Detailed calculations are included in Appendix D. Table IV shows that SR-1, Annapolis Road and Stewarts Point Road in the project vicinity are expected to operate at LOS B or better under Existing plus Project traffic scenario. This result implies that, traffic generated by the proposed conversion of a timberland to a vineyard is not expected to cause any noticeable congestion on SR-1, Annapolis Road and Stewarts Point Road.
TABLE IV: EXISTING PEAK HOUR LEVEL OF SERVICE ON ARTERIAL ROADS
Road Lanes per Dir.
Hourly Capacity Time of Day Volume V/C LOS
AM 306 0.13 B State Route 1 (Class II) 1 2280 PM 272 0.12 B AM 164 0.09 B Annapolis Road (Class II) 1 1780 PM 182 0.10 B AM 114 0.07 A Stewarts Point Road (Class II) 1 1780 PM 106 0.06 A

The project contribution of the proposed project trips to each roadway segment is shown in Table V below. The table shows small percent project traffic contribution to the study roadway segments. For example, the project contributes about 32 percent of the traffic under Existing plus Project Traffic Conditions on Stewarts Point Road. This is not likely to have impact on the one-way traffic movement on the two small bridges on Annapolis Road and Stewarts Point Road.
TABLE V: PERCENT PROJECT CONTRIBUTION (LINK LEVEL) – EXISTING PLUS PROJECT CONDITIONS
Roadway Segment
Existing Traffic (a.m.)
Project Traffic (a.m.)
Total Traffic (a.m.)
Percent Project Traffic (a.m.)
Existing Traffic (p.m.)
Project Traffic (p.m.)
Total Traffic (p.m.)
Percent Project Traffic (p.m.)
State Route 1 (SB link)
248 58 306 19 124 58 272 22
Annapolis Road (WB link)
140 24 164 15 158 24 182 14
Stewarts Point Road (WB link)
80 34 114 30 72 34 106 32
Artesa Vineyard Traffic Impact Study – Final Report Page 13 TJKM Transportation Consultants December 2, 2004

Artesa Vineyard Traffic Impact Study – Final Report Page 14 TJKM Transportation Consultants December 2, 2004
FUTURE CONDITIONS
Future Traffic Conditions
Projected future traffic conditions (2025 planning horizon) are based on an annual growth factor derived from link traffic volumes in Sonoma County’s 1995 Congestion Management Program (CMP) Update. The County’s travel demand model, currently being updated, generated average P.M. peak volumes. The growth factor was calculated from 1995 existing model-calibrated volumes and 2000 estimated volumes on State Route 1 within the project area. The 2000 volumes assumed a full-build condition of the County’s Capital Improvement Program at the time. An annual growth factor of 9.7% was used to estimate growth in turning movements at all study-area intersections.
Intersection Level of Service, Future Conditions
Future 2025 A.M. and P.M. peak hour traffic turning movements for the study-area intersections are based on existing turning movement counts, which have been extrapolated to 2025 using the above-mentioned growth factor. Figure 6 shows the peak hour turning movement volumes at the study intersections. Under future conditions without the project, all the study intersections are expected to operate at an acceptable LOS B or better for both major and minor movements. Table VI summarizes the results of the intersection level of service analysis for future without project conditions. Detailed calculations are contained in Appendix E.
TABLE VI : FUTURE CONDITIONS INTERSECTION LEVEL OF SERVICE (NO PROJECT)
A.M. Peak Hour P.M. Peak Hour Intersection
Control Delay LOS Delay LOS
State Route 1/Stewarts Point Road Two-Way STOP 9.9 (9.9) A (A) 10.2 (10.2) B (B) Stewarts Point Road/Annapolis Road One-Way STOP 8.6 (8.6) A (A) 8.6 (8.6) A (A) State Route 1/Annapolis Road One-Way STOP 10.4(10.4) B (B) 9.9 (9.9) A (A)
Note: LOS = Level of Service X = Intersection level of service X.X = Overall intersection delay in seconds per vehicle (X) = Level of service for the minor approach (X.X) = Average delay for the minor approach (in seconds per vehicle) Delay = Values in parenthesis indicated average delay for the critical movement at One- and Two-Way STOP-controlled intersections.

Figure
6117-075 - 2/4/04 - AK
County of SonomaArtesa Vineyards ProjectFuture Turning Movement Volumes (2025)
Not to ScaleNorth
Study IntersectionAM Peak Hour VolumePM Peak Hour Volume
LEGEND
XX(XX)
ProjectSite
ANN APO LI
S RD.
SODA
SPRINGS RD.
KELL
Y R
D.
STEWA
RTS
POINT
STATE FORRESTRY R
D.
ANNAPOLIS
RD.
TIN BARN
RD .
KRUSE RANCH
RD.
KING RIDGE RD.
HAU
SER BRID GE RD
.
TIM
BERCOVE
RD.
SE
AV
IE
W R
D.
FORT ROS
S RD.
SKA GGS
SPRINGS RD.
OLD
STA
GE
RD
.
GUALALA RD.
13
2
1
Intersection #1State Route 1/Annapolis Rd.
Intersection #3Annapolis Rd./Stewarts Point
70 (
56)
27 (
27)
4 (9
)16
(15)
20 (2
2)13
(15)
98 (
46)
67 (
53)
37 (80)22 (13)
Intersection #2State Route 1/Stewarts Point
1 (9)0 (2)4 (8)
3 (8
)49
(71
)14
(13
)
9 (11)0 (2)32 (27)
2 (1
6)54
(97
)33
(23
)
9 (10)12 (13)

Artesa Vineyard Traffic Impact Study – Final Report Page 16 TJKM Transportation Consultants December 2, 2004
FUTURE PLUS PROJECT CONDITIONS
Trip Generation, Distribution, and Assignment
For the 2025 future plus project condition, the project’s trip generation, distribution, and directional assignment are all expected to be the same as in the existing plus project condition. This report’s section on existing plus project conditions contains the project’s expected trip generation, distribution, and directional assignment, along with all associated assumptions.
Intersection Level of Service Analysis
Figure 7 illustrates the 2025 future plus project traffic volume projections at the study area intersections. Table VII summarizes the intersection levels of service under this scenario. Detailed calculations are contained in Appendix F.

Figure
7117-075 - 2/4/04 - AK
County of SonomaArtesa Vineyards ProjectFuture + Project Turning Movement Volumes (2025)
Not to ScaleNorth
Study IntersectionAM Peak Hour VolumePM Peak Hour Volume
LEGEND
XX(XX)
ProjectSite
ANN APO LI
S RD.
SODA
SPRINGS RD.
KELL
Y R
D.
STEWA
RTS
POINT
STATE FORRESTRY R
D.
ANNAPOLIS
RD.
TIN BARN
RD .
KRUSE RANCH
RD.
KING RIDGE RD.
HAU
SER BRID GE RD
.
TIM
BERCOVE
RD.
SE
AV
IE
W R
D.
FORT ROS
S RD.
SKA GGS
SPRINGS RD.
OLD
STA
GE
RD
.
GUALALA RD.
13
2
1
Intersection #1State Route 1/Annapolis Rd.
Intersection #3Annapolis Rd./Stewarts Point
70 (
56)
27 (
27)
19 (9
)16
(15)
24 (2
2)13
(15)
0 (3
8)98
(46
)67
(76
)
60 (80)22 (13)
Intersection #2State Route 1/Stewarts Point
3 (9)0 (25)
4 (8)
3 (1
0)49
(71
)14
(26
)
22 (11)23 (2)32 (27)
2 (1
6)54
(10
7)33
(23
)
9 (14)12 (28)

Artesa Vineyard Traffic Impact Study – Final Report Page 18 TJKM Transportation Consultants December 2, 2004
TABLE VII: FUTURE PLUS PROJECT CONDITIONS: INTERSECTION LEVELS OF SERVICE
A.M. Peak Hour P.M. Peak Hour Intersection
Control Delay LOS Delay LOS
State Route 1/Stewarts Point Road Two-Way STOP 10.1(10.1) B (B) 10.4(10.4) B (B) Stewarts Point Road/Annapolis Road One-Way STOP 8.7 (8.7) A (A) 8.7 (8.7) A (A) State Route 1/Annapolis Road One-Way STOP 11.7(11.7) B (B) 10.0 (10.0) B (B)
Note: LOS = Level of Service X = Intersection level of service X.X = Overall intersection delay in seconds per vehicle (X) = Level of service for the minor approach (X.X) = Average delay for the minor approach (in seconds per vehicle) Delay =Average stopped delay at signalized intersections and average delay for all movements at STOP-controlled intersections. Values in parenthesis indicated average delay for the critical movement at One- and Two-Way STOP-controlled intersections. With the addition of the project traffic under future 2025 conditions, all of the study intersections are expected to operate at LOS B or better. A comparison of Tables VI and VII illustrates that the study intersections will experience small but insignificant increases in approach delay. Levels of service at two intersections will change from LOS A to LOS B, though such a change is not detectable by the average driver.
Link Level of Service Analysis, 2025 Future Plus Project Conditions
The link level of service for SR-1, Annapolis Road and Stewarts Point Road under 2025 future plus project conditions are summarized in Table VIII. Detailed calculations are included in Appendix G. Table VIII shows that SR-1, Annapolis Road and Stewarts Point Road in the project vicinity are expected to operate at LOS B or better under 2025 future plus project traffic conditions. This result implies that in the future, traffic generated by the proposed conversion of a timberland to a vineyard is not expected to cause any noticeable congestion on SR-1, Annapolis Road and Stewarts Point Road.
TABLE VIII: FUTURE + PROJECT CONDITIONS: PEAK HOUR LEVEL OF SERVICE ON ARTERIAL ROADS
Road Lanes per Dir.
Hourly Capacity Time of Day Volume V/C LOS
AM 330 0.14 B State Route 1 (Class II) 1 2280 PM 293 0.13 B AM 177 0.10 A Annapolis Road (Class II) 1 1780 PM 197 0.11 A AM 114 0.06 A Stewarts Point Road (Class II) 1 1780 PM 139 0.08 A
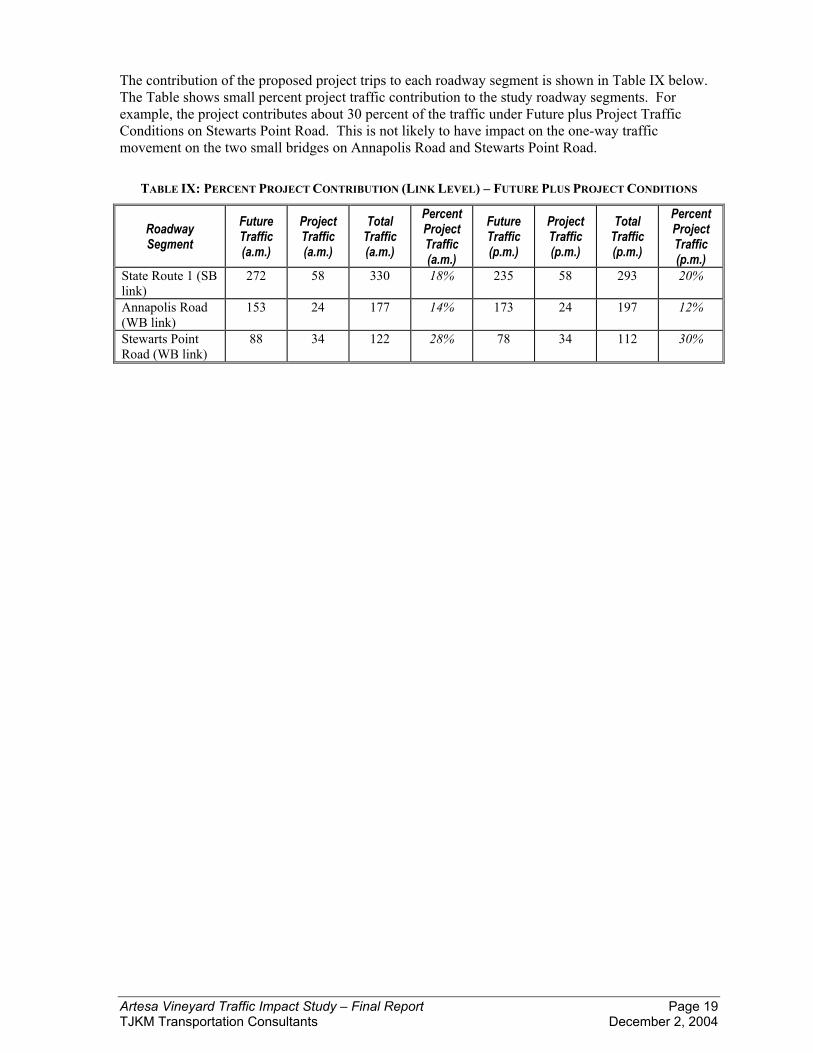
The contribution of the proposed project trips to each roadway segment is shown in Table IX below. The Table shows small percent project traffic contribution to the study roadway segments. For example, the project contributes about 30 percent of the traffic under Future plus Project Traffic Conditions on Stewarts Point Road. This is not likely to have impact on the one-way traffic movement on the two small bridges on Annapolis Road and Stewarts Point Road.
TABLE IX: PERCENT PROJECT CONTRIBUTION (LINK LEVEL) – FUTURE PLUS PROJECT CONDITIONS
Roadway Segment
Future Traffic (a.m.)
Project Traffic (a.m.)
Total Traffic (a.m.)
Percent Project Traffic (a.m.)
Future Traffic (p.m.)
Project Traffic (p.m.)
Total Traffic (p.m.)
Percent Project Traffic (p.m.)
State Route 1 (SB link)
272 58 330 18% 235 58 293 20%
Annapolis Road (WB link)
153 24 177 14% 173 24 197 12%
Stewarts Point Road (WB link)
88 34 122 28% 78 34 112 30%
Artesa Vineyard Traffic Impact Study – Final Report Page 19 TJKM Transportation Consultants December 2, 2004

Conclusions Existing and future 2025 traffic conditions will not be significantly impacted by the proposed vineyard project in Sonoma County. No measures are needed now or in the future to mitigate traffic that will be generated by the project. The two bridges on Annapolis Road and Stewarts Point Road are expected to adequately serve projected traffic associated with the timberland conversion to a vineyard.
Artesa Vineyard Traffic Impact Study – Final Report Page 20 TJKM Transportation Consultants December 2, 2004

STUDY REFERENCES
TJKM Personnel
Mousa Abbasi, PhD, PE Project Manager Andrew Kluter, EIT Project Engineer David Mahama, EIT Project Engineer Lily Moore Word Processing Geri Foley Graphics Designer
Data Collection
Baymetrics Traffic Resources
Persons Consulted
David DiPiero, Director of Vineyard Operations – Artesa Vineyards and Winery.
References
Transportation Research Board, Highway Capacity Manual 2000. Sonoma County General Plan, “Circulation Element”, March 1998. Sonoma County Congestion Management Program Update, Public Hearing Draft, October 1995. TJKM Transportation Consultants, Winery Trip Generation, October 1998. TJKM Transportation Consultants, Traffic Analysis, Cline Cellars, Sonoma, February 2000.
Artesa Vineyard Traffic Impact Study – Final Report Page 21 TJKM Transportation Consultants December 2, 2004

APPENDIX A – LEVEL OF SERVICE METHODOLOGY

APPENDIX A
LEVEL OF SERVICE The description and procedures for calculating capacity and level of service are found in Transportation Research Board, Highway Capacity Manual 2000. Highway Capacity Manual 2000 represents the latest research on capacity and quality of service for transportation facilities. Quality of service requires quantitative measures to characterize operational conditions within a traffic stream. Level of service is a quality measure describing operational conditions within a traffic stream, generally in terms of such service measures as speed and travel time, freedom to maneuver, traffic interruptions, and comfort and convenience. Six levels of service are defined for each type of facility that has analysis procedures available. Letters designate each level, from A to F, with level-of-service A representing the best operating conditions and level-of-service F the worst. Each level of service represents a range of operating conditions and the driver’s perception of these conditions. Safety is not included in the measures that establish service levels. A general description of service levels for various types of facilities is shown in Table A-I
Table A-I
Level of Service Description Uninterrupted Flow Interrupted Flow
Facility Type Freeways Multi-lane Highways Two-lane Highways Urban Streets
Signalized Intersections Unsignalized Intersections
Two-way Stop Control All-way Stop Control
LOS
A Free-flow Very low delay.
B Stable flow. Presence of other users noticeable.
Low delay.
C Stable flow. Comfort and convenience starts to decline.
Acceptable delay.
D High density stable flow. Tolerable delay.
E Unstable flow. Limit of acceptable delay.
F Forced or breakdown flow. Unacceptable delay
Source: Highway Capacity Manual 2000
Level of Service Page A-1 TJKM Transportation Consultants Appendix A

Urban Streets The term “urban streets” refers to urban arterials and collectors, including those in downtown areas. Arterial streets are roads that primarily serve longer through trips. However, providing access to abutting commercial and residential land uses is also an important function of arterials. Collector streets provide both land access and traffic circulation within residential, commercial and industrial areas. Their access function is more important than that of arterials, and unlike arterials their operation is not always dominated by traffic signals. Downtown streets are signalized facilities that often resemble arterials. They not only move through traffic but also provide access to local businesses for passenger cars, transit buses, and trucks. Pedestrian conflicts and lane obstructions created by stopping or standing buses, trucks and parking vehicles that cause turbulence in the traffic flow are typical of downtown streets. The speed of vehicles on urban streets is influenced by three main factors, street environment, interaction among vehicles and traffic control. As a result, these factors also affect quality of service. The street environment includes the geometric characteristics of the facility, the character of roadside activity and adjacent land uses. Thus, the environment reflects the number and width of lanes, type of median, driveway density, spacing between signalized intersections, existence of parking, level of pedestrian activity and speed limit. The interaction among vehicles is determined by traffic density, the proportion of trucks and buses, and turning movements. This interaction affects the operation of vehicles at intersections and, to a lesser extent, between signals. Traffic control (including signals and signs) forces a portion of all vehicles to slow or stop. The delays and speed changes caused by traffic control devices reduce vehicle speeds, however, such controls are needed to establish right-of-way. The average travel speed for through vehicles along an urban street is the determinant of the operating level of service. The travel speed along a segment, section or entire length of an urban street is dependent on the running speed between signalized intersections and the amount of control delay incurred at signalized intersections. Level-of-service A describes primarily free-flow operations. Vehicles are completely unimpeded in their ability to maneuver within the traffic stream. Control delay at signalized intersections is minimal. Level-of-service B describes reasonably unimpeded operations. The ability to maneuver within the traffic stream is only slightly restricted, and control delays at signalized intersections are not significant. Level-of-service C describes stable operations, however, ability to maneuver and change lanes in midblock location may be more restricted than at level-of-service B. Longer queues, adverse signal coordination, or both may contribute to lower travel speeds. Level-of-service D borders on a range in which in which small increases in flow may cause substantial increases in delay and decreases in travel speed. Level-of-service D may be due to adverse signal progression, inappropriate signal timing, high volumes, or a combination of these factors. Level-of-service E is characterized by significant delays and lower travel speeds. Such operations are
Level of Service Page A-2 TJKM Transportation Consultants Appendix A
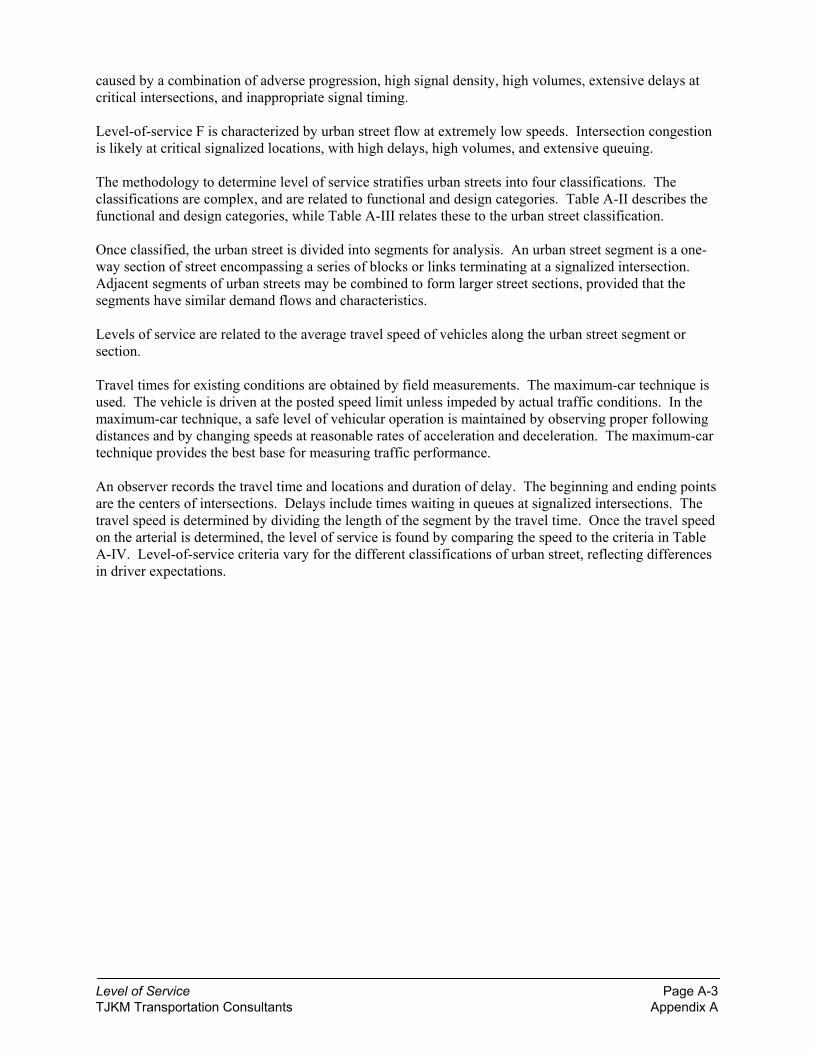
caused by a combination of adverse progression, high signal density, high volumes, extensive delays at critical intersections, and inappropriate signal timing. Level-of-service F is characterized by urban street flow at extremely low speeds. Intersection congestion is likely at critical signalized locations, with high delays, high volumes, and extensive queuing. The methodology to determine level of service stratifies urban streets into four classifications. The classifications are complex, and are related to functional and design categories. Table A-II describes the functional and design categories, while Table A-III relates these to the urban street classification. Once classified, the urban street is divided into segments for analysis. An urban street segment is a one-way section of street encompassing a series of blocks or links terminating at a signalized intersection. Adjacent segments of urban streets may be combined to form larger street sections, provided that the segments have similar demand flows and characteristics. Levels of service are related to the average travel speed of vehicles along the urban street segment or section. Travel times for existing conditions are obtained by field measurements. The maximum-car technique is used. The vehicle is driven at the posted speed limit unless impeded by actual traffic conditions. In the maximum-car technique, a safe level of vehicular operation is maintained by observing proper following distances and by changing speeds at reasonable rates of acceleration and deceleration. The maximum-car technique provides the best base for measuring traffic performance. An observer records the travel time and locations and duration of delay. The beginning and ending points are the centers of intersections. Delays include times waiting in queues at signalized intersections. The travel speed is determined by dividing the length of the segment by the travel time. Once the travel speed on the arterial is determined, the level of service is found by comparing the speed to the criteria in Table A-IV. Level-of-service criteria vary for the different classifications of urban street, reflecting differences in driver expectations.
Level of Service Page A-3 TJKM Transportation Consultants Appendix A
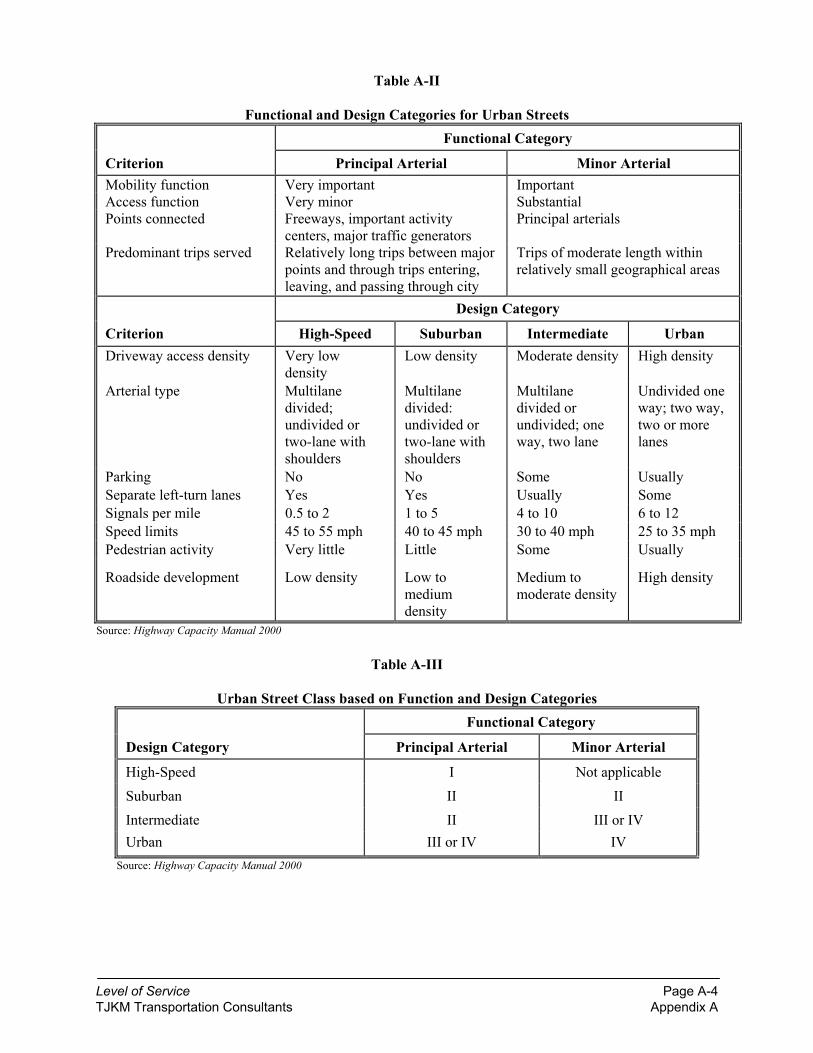
Table A-II Functional and Design Categories for Urban Streets
Functional Category
Criterion Principal Arterial Minor Arterial Mobility function Very important Important Access function Very minor Substantial Points connected Freeways, important activity
centers, major traffic generators Principal arterials
Predominant trips served Relatively long trips between major points and through trips entering, leaving, and passing through city
Trips of moderate length within relatively small geographical areas
Design Category
Criterion High-Speed Suburban Intermediate Urban Driveway access density Very low
density Low density Moderate density High density
Arterial type Multilane divided; undivided or two-lane with shoulders
Multilane divided: undivided or two-lane with shoulders
Multilane divided or undivided; one way, two lane
Undivided one way; two way, two or more lanes
Parking No No Some Usually Separate left-turn lanes Yes Yes Usually Some Signals per mile 0.5 to 2 1 to 5 4 to 10 6 to 12 Speed limits 45 to 55 mph 40 to 45 mph 30 to 40 mph 25 to 35 mph Pedestrian activity Very little Little Some Usually Roadside development
Low density
Low to medium density
Medium to moderate density
High density
Source: Highway Capacity Manual 2000
Table A-III
Urban Street Class based on Function and Design Categories Functional Category
Design Category Principal Arterial Minor Arterial
High-Speed I Not applicable Suburban II II Intermediate II III or IV Urban III or IV IV
Source: Highway Capacity Manual 2000
Level of Service Page A-4 TJKM Transportation Consultants Appendix A

Table A-IV
Urban Street Levels of Service by Class Urban Street Class I II III IV Range of Free Flow Speeds (mph)
45 to 55 35 to 45 30 to 35 25 to 35
Typical Free Flow Speed (mph) 50 40 33 30
Level of Service Average Travel Speed (mph)
A >42 >35 >30 >25 B >34 >28 >24 >19 C >27 >22 >18 >13 D >21 >17 >14 >9 E >16 >13 >10 >7 F ≤16 ≤13 ≤10 ≤7
Source: Highway Capacity Manual 2000
Interrupted Flow One of the more important elements limiting, and often interrupting the flow of traffic on a highway is the intersection. Flow on an interrupted facility is usually dominated by points of fixed operation such as traffic signals, stop and yield signs. These all operate quite differently and have differing impacts on overall flow. Signalized Intersections The capacity of a highway is related primarily to the geometric characteristics of the facility, as well as to the composition of the traffic stream on the facility. Geometrics are a fixed, or non-varying, characteristic of a facility. At the signalized intersection, an additional element is introduced into the concept of capacity: time allocation. A traffic signal essentially allocates time among conflicting traffic movements seeking use of the same physical space. The way in which time is allocated has a significant impact on the operation of the intersection and on the capacity of the intersection and its approaches. Level of service for signalized intersections is defined in terms of control delay, which is a measure of driver discomfort, frustration, fuel consumption, and increased travel time. The delay experienced by a motorist is made up of a number of factors that relate to control, traffic and incidents. Total delay is the difference between the travel time actually experienced and the reference travel time that would result during base conditions, i. e., in the absence of traffic control, geometric delay, any incidents, and any other vehicles. Specifically, level of service criteria for traffic signals are stated in terms of average control delay per vehicle, typically for a 15-minute analysis period. Delay is a complex measure and depends on a number of variables, including the quality of progression, the cycle length, the ratio of green time to cycle length and the volume to capacity ratio for the lane group. For each intersection analyzed the average control delay per vehicle per approach is determined for the peak hour. A weighted average of control delay per vehicle is then determined for the intersection. A level of service designation is given to the control delay to better describe the level of operation. A
Level of Service Page A-5 TJKM Transportation Consultants Appendix A

description of levels of service for signalized intersections can be found in Table A-V
Table A-V
Description of Level of Service for Signalized Intersections Level of Service Description
A Very low control delay, up to 10 seconds per vehicle. Progression is extremely favorable, and most vehicles arrive during the green phase. Many vehicles do not stop at all. Short cycle lengths may tend to contribute to low delay values.
B Control delay greater than 10 and up to 20 seconds per vehicle. There is good progression or short cycle lengths or both. More vehicles stop causing higher levels of delay.
C Control delay greater than 20 and up to 35 seconds per vehicle. Higher delays are caused by fair progression or longer cycle lengths or both. Individual cycle failures may begin to appear. Cycle failure occurs when a given green phase doe not serve queued vehicles, and overflow occurs. The number of vehicles stopping is significant, though many still pass through the intersection without stopping.
D Control delay greater than 35 and up to 55 seconds per vehicle. The influence of congestions becomes more noticeable. Longer delays may result from some combination of unfavorable progression, long cycle lengths, or high volumes. Many vehicles stop, the proportion of vehicles not stopping declines. Individual cycle failures are noticeable.
E Control delay greater than 55 and up to 80 seconds per vehicle. The limit of acceptable delay. High delays usually indicate poor progression, long cycle lengths, and high volumes. Individual cycle failures are frequent.
F Control delay in excess of 80 seconds per vehicle. Unacceptable to most drivers. Oversaturation, arrival flow rates exceed the capacity of the intersection. Many individual cycle failures. Poor progression and long cycle lengths may also be contributing factors to higher delay.
Source: Highway Capacity Manual 2000
The use of control delay, which may also be referred to as signal delay, was introduced in the 1997 update to the Highway Capacity Manual, and represents a departure from previous updates. In the third edition, published in 1985 and the 1994 update to the third edition, delay only included stopped delay. Thus, the level of service criteria listed in Table A-V differs from earlier criteria. Unsignalized Intersections The current procedures on unsignalized intersections were first introduced in the 1997 update to the Highway Capacity Manual and represent a revision of the methodology published in the 1994 update to the 1985 Highway Capacity Manual. The revised procedures use control delay as a measure of effectiveness to determine level of service. Delay is a measure of driver discomfort, frustration, fuel consumption, and increased travel time. The delay experienced by a motorist is made up of a number of factors that relate to control, traffic and incidents. Total delay is the difference between the travel time actually experienced and the reference travel time that would result during base conditions, i. e., in the absence of traffic control, geometric delay, any incidents, and any other vehicles. Control delay is the
Level of Service Page A-6 TJKM Transportation Consultants Appendix A

increased time of travel for a vehicle approaching and passing through an unsignalized intersection, compared with a free-flow vehicle if it were not required to slow or stop at the intersection. Two-Way Stop Controlled Intersections Two-way stop controlled intersections in which stop signs are used to assign the right-of-way, are the most prevalent type of intersection in the United States. At two-way stop-controlled intersections the stop-controlled approaches are referred as the minor street approaches and can be either public streets or private driveways. The approaches that are not controlled by stop signs are referred to as the major street approaches. The capacity of movements subject to delay is determined using the "critical gap" method of capacity analysis. Expected average control delay based on movement volume and movement capacity is calculated. A level of service designation is given to the expected control delay for each minor movement. Level of service is not defined for the intersection as a whole. Control delay is the increased time of travel for a vehicle approaching and passing through a stop-controlled intersection, compared with a free-flow vehicle if it were not required to slow or stop at the intersection. A description of levels of service for two-way stop-controlled intersections is found in Table A-VI.
Table A-VI
Description of Level of Service for Two-Way Stop Controlled Intersections Level of Service Description
A Very low control delay less than 10 seconds per vehicle for each movement subject to delay.
B Low control delay greater than 10 and up to 15 seconds per vehicle for each movement subject to delay.
C Acceptable control delay greater than 15 and up to 25 seconds per vehicle for each movement subject to delay.
D Tolerable control delay greater than 25 and up to 35 seconds per vehicle for each movement subject to delay.
E Limit of tolerable control delay greater than 35 and up to 50 seconds per vehicle for each movement subject to delay.
F Unacceptable control delay in excess of 50 seconds per vehicle for each movement subject to delay.
Source: Highway Capacity Manual 2000
Level of Service Page A-7 TJKM Transportation Consultants Appendix A

APPENDIX B – LEVEL OF SERVICE WORKSHEETS: EXISTING

Existing_AM Thu Dec 2, 2004 09:42:29 Page 2-1 -------------------------------------------------------------------------------- -------------------------------------------------------------------------------- Level Of Service Computation Report 2000 HCM Unsignalized Method (Base Volume Alternative) ******************************************************************************** Intersection #1 State Route 1/Stewarts Point ******************************************************************************** Average Delay (sec/veh): 8.6 Worst Case Level Of Service: A[ 9.7] ******************************************************************************** Approach: North Bound South Bound East Bound West Bound Movement: L - T - R L - T - R L - T - R L - T - R ------------|---------------||---------------||---------------||---------------| Control: Stop Sign Stop Sign Uncontrolled Uncontrolled Rights: Include Include Include Include Lanes: 0 0 1! 0 0 0 0 1! 0 0 0 0 1! 0 0 0 0 1! 0 0 ------------|---------------||---------------||---------------||---------------| Volume Module: Base Vol: 2 49 30 13 45 3 1 0 4 29 0 8 Growth Adj: 1.00 1.00 1.00 1.00 1.00 1.00 1.00 1.00 1.00 1.00 1.00 1.00 Initial Bse: 2 49 30 13 45 3 1 0 4 29 0 8 User Adj: 1.00 1.00 1.00 1.00 1.00 1.00 1.00 1.00 1.00 1.00 1.00 1.00 PHF Adj: 1.00 1.00 1.00 1.00 1.00 1.00 1.00 1.00 1.00 1.00 1.00 1.00 PHF Volume: 2 49 30 13 45 3 1 0 4 29 0 8 Reduct Vol: 0 0 0 0 0 0 0 0 0 0 0 0 Final Vol.: 2 49 30 13 45 3 1 0 4 29 0 8 ------------|---------------||---------------||---------------||---------------| Critical Gap Module: Critical Gp: 7.1 6.5 6.2 7.1 6.5 6.2 4.1 xxxx xxxxx 4.1 xxxx xxxxx FollowUpTim: 3.5 4.0 3.3 3.5 4.0 3.3 2.2 xxxx xxxxx 2.2 xxxx xxxxx ------------|---------------||---------------||---------------||---------------| Capacity Module: Cnflict Vol: 90 70 2 106 68 4 8 xxxx xxxxx 4 xxxx xxxxx Potent Cap.: 900 824 1088 879 826 1085 1625 xxxx xxxxx 1631 xxxx xxxxx Move Cap.: 847 809 1088 804 811 1085 1625 xxxx xxxxx 1631 xxxx xxxxx Volume/Cap: 0.00 0.06 0.03 0.02 0.06 0.00 0.00 xxxx xxxx 0.02 xxxx xxxx ------------|---------------||---------------||---------------||---------------| Level Of Service Module: Queue: xxxxx xxxx xxxxx xxxxx xxxx xxxxx 0.0 xxxx xxxxx 0.1 xxxx xxxxx Stopped Del:xxxxx xxxx xxxxx xxxxx xxxx xxxxx 7.2 xxxx xxxxx 7.2 xxxx xxxxx LOS by Move: * * * * * * A * * A * * Movement: LT - LTR - RT LT - LTR - RT LT - LTR - RT LT - LTR - RT Shared Cap.: xxxx 895 xxxxx xxxx 820 xxxxx xxxx xxxx xxxxx xxxx xxxx xxxxx SharedQueue:xxxxx 0.3 xxxxx xxxxx 0.2 xxxxx xxxxx xxxx xxxxx xxxxx xxxx xxxxx Shrd StpDel:xxxxx 9.4 xxxxx xxxxx 9.7 xxxxx xxxxx xxxx xxxxx xxxxx xxxx xxxxx Shared LOS: * A * * A * * * * * * * ApproachDel: 9.4 9.7 xxxxxx xxxxxx ApproachLOS: A A * * Traffix 7.6.0115 (c) 2004 Dowling Assoc. Licensed to TJKM, PLEASANTON, CA

Existing_AM Thu Dec 2, 2004 09:42:29 Page 3-1 -------------------------------------------------------------------------------- -------------------------------------------------------------------------------- Level Of Service Computation Report 2000 HCM Unsignalized Method (Base Volume Alternative) ******************************************************************************** Intersection #2 Annapolis Road/Stewarts Point ******************************************************************************** Average Delay (sec/veh): 2.8 Worst Case Level Of Service: A[ 8.6] ******************************************************************************** Approach: North Bound South Bound East Bound West Bound Movement: L - T - R L - T - R L - T - R L - T - R ------------|---------------||---------------||---------------||---------------| Control: Uncontrolled Uncontrolled Stop Sign Stop Sign Rights: Include Include Include Include Lanes: 0 1 0 0 0 0 0 0 1 0 0 0 1! 0 0 0 0 0 0 0 ------------|---------------||---------------||---------------||---------------| Volume Module: Base Vol: 4 15 0 0 12 18 8 0 11 0 0 0 Growth Adj: 1.00 1.00 1.00 1.00 1.00 1.00 1.00 1.00 1.00 1.00 1.00 1.00 Initial Bse: 4 15 0 0 12 18 8 0 11 0 0 0 User Adj: 1.00 1.00 1.00 1.00 1.00 1.00 1.00 1.00 1.00 1.00 1.00 1.00 PHF Adj: 1.00 1.00 1.00 1.00 1.00 1.00 1.00 1.00 1.00 1.00 1.00 1.00 PHF Volume: 4 15 0 0 12 18 8 0 11 0 0 0 Reduct Vol: 0 0 0 0 0 0 0 0 0 0 0 0 Final Vol.: 4 15 0 0 12 18 8 0 11 0 0 0 ------------|---------------||---------------||---------------||---------------| Critical Gap Module: Critical Gp: 4.1 xxxx xxxxx xxxxx xxxx xxxxx 6.4 xxxx 6.2 xxxxx xxxx xxxxx FollowUpTim: 2.2 xxxx xxxxx xxxxx xxxx xxxxx 3.5 xxxx 3.3 xxxxx xxxx xxxxx ------------|---------------||---------------||---------------||---------------| Capacity Module: Cnflict Vol: 30 xxxx xxxxx xxxx xxxx xxxxx 44 xxxx 21 xxxx xxxx xxxxx Potent Cap.: 1596 xxxx xxxxx xxxx xxxx xxxxx 972 xxxx 1062 xxxx xxxx xxxxx Move Cap.: 1596 xxxx xxxxx xxxx xxxx xxxxx 970 xxxx 1062 xxxx xxxx xxxxx Volume/Cap: 0.00 xxxx xxxx xxxx xxxx xxxx 0.01 xxxx 0.01 xxxx xxxx xxxx ------------|---------------||---------------||---------------||---------------| Level Of Service Module: Queue: 0.0 xxxx xxxxx xxxxx xxxx xxxxx xxxxx xxxx xxxxx xxxxx xxxx xxxxx Stopped Del: 7.3 xxxx xxxxx xxxxx xxxx xxxxx xxxxx xxxx xxxxx xxxxx xxxx xxxxx LOS by Move: A * * * * * * * * * * * Movement: LT - LTR - RT LT - LTR - RT LT - LTR - RT LT - LTR - RT Shared Cap.: xxxx xxxx xxxxx xxxx xxxx xxxxx xxxx 1021 xxxxx xxxx xxxx xxxxx SharedQueue: 0.0 xxxx xxxxx xxxxx xxxx xxxxx xxxxx 0.1 xxxxx xxxxx xxxx xxxxx Shrd StpDel: 7.3 xxxx xxxxx xxxxx xxxx xxxxx xxxxx 8.6 xxxxx xxxxx xxxx xxxxx Shared LOS: A * * * * * * A * * * * ApproachDel: xxxxxx xxxxxx 8.6 xxxxxx ApproachLOS: * * A * Traffix 7.6.0115 (c) 2004 Dowling Assoc. Licensed to TJKM, PLEASANTON, CA

Existing_AM Thu Dec 2, 2004 09:42:29 Page 4-1 -------------------------------------------------------------------------------- -------------------------------------------------------------------------------- Level Of Service Computation Report 2000 HCM Unsignalized Method (Base Volume Alternative) ******************************************************************************** Intersection #3 State Route 1/Annapolis Road ******************************************************************************** Average Delay (sec/veh): 9.0 Worst Case Level Of Service: B[ 10.4] ******************************************************************************** Approach: North Bound South Bound East Bound West Bound Movement: L - T - R L - T - R L - T - R L - T - R ------------|---------------||---------------||---------------||---------------| Control: Stop Sign Stop Sign Uncontrolled Uncontrolled Rights: Include Include Include Include Lanes: 0 0 0 1 0 0 1 0 0 0 0 0 0 0 0 0 0 1! 0 0 ------------|---------------||---------------||---------------||---------------| Volume Module: Base Vol: 0 64 25 61 89 0 0 0 0 20 0 34 Growth Adj: 1.00 1.00 1.00 1.00 1.00 1.00 1.00 1.00 1.00 1.00 1.00 1.00 Initial Bse: 0 64 25 61 89 0 0 0 0 20 0 34 User Adj: 1.00 1.00 1.00 1.00 1.00 1.00 1.00 1.00 1.00 1.00 1.00 1.00 PHF Adj: 1.00 1.00 1.00 1.00 1.00 1.00 1.00 1.00 1.00 1.00 1.00 1.00 PHF Volume: 0 64 25 61 89 0 0 0 0 20 0 34 Reduct Vol: 0 0 0 0 0 0 0 0 0 0 0 0 Final Vol.: 0 64 25 61 89 0 0 0 0 20 0 34 ------------|---------------||---------------||---------------||---------------| Critical Gap Module: Critical Gp:xxxxx 6.5 6.2 7.1 6.5 xxxxx xxxxx xxxx xxxxx 4.1 xxxx xxxxx FollowUpTim:xxxxx 4.0 3.3 3.5 4.0 xxxxx xxxxx xxxx xxxxx 2.2 xxxx xxxxx ------------|---------------||---------------||---------------||---------------| Capacity Module: Cnflict Vol: xxxx 74 0 89 57 xxxxx xxxx xxxx xxxxx 0 xxxx xxxxx Potent Cap.: xxxx 820 900 901 838 xxxxx xxxx xxxx xxxxx 900 xxxx xxxxx Move Cap.: xxxx 802 900 808 819 xxxxx xxxx xxxx xxxxx 900 xxxx xxxxx Volume/Cap: xxxx 0.08 0.03 0.08 0.11 xxxx xxxx xxxx xxxx 0.02 xxxx xxxx ------------|---------------||---------------||---------------||---------------| Level Of Service Module: Queue: xxxxx xxxx xxxxx xxxxx xxxx xxxxx xxxxx xxxx xxxxx 0.1 xxxx xxxxx Stopped Del:xxxxx xxxx xxxxx xxxxx xxxx xxxxx xxxxx xxxx xxxxx 9.1 xxxx xxxxx LOS by Move: * * * * * * * * * A * * Movement: LT - LTR - RT LT - LTR - RT LT - LTR - RT LT - LTR - RT Shared Cap.: xxxx xxxx 827 815 xxxx xxxxx xxxx xxxx xxxxx xxxx xxxx xxxxx SharedQueue:xxxxx xxxx 0.4 0.7 xxxx xxxxx xxxxx xxxx xxxxx xxxxx xxxx xxxxx Shrd StpDel:xxxxx xxxx 9.9 10.4 xxxx xxxxx xxxxx xxxx xxxxx xxxxx xxxx xxxxx Shared LOS: * * A B * * * * * * * * ApproachDel: 9.9 10.4 xxxxxx xxxxxx ApproachLOS: A B * * Traffix 7.6.0115 (c) 2004 Dowling Assoc. Licensed to TJKM, PLEASANTON, CA
Existing_PM Thu Dec 2, 2004 09:44:07 Page 2-1 -------------------------------------------------------------------------------- -------------------------------------------------------------------------------- Level Of Service Computation Report 2000 HCM Unsignalized Method (Base Volume Alternative) ******************************************************************************** Intersection #1 State Route 1/Stewarts Point ******************************************************************************** Average Delay (sec/veh): 9.0 Worst Case Level Of Service: B[ 10.2] ******************************************************************************** Approach: North Bound South Bound East Bound West Bound Movement: L - T - R L - T - R L - T - R L - T - R ------------|---------------||---------------||---------------||---------------| Control: Stop Sign Stop Sign Uncontrolled Uncontrolled Rights: Include Include Include Include Lanes: 0 0 1! 0 0 0 0 1! 0 0 0 0 1! 0 0 0 0 1! 0 0 ------------|---------------||---------------||---------------||---------------| Volume Module: Base Vol: 15 98 21 12 65 7 8 2 7 25 2 10 Growth Adj: 1.00 1.00 1.00 1.00 1.00 1.00 1.00 1.00 1.00 1.00 1.00 1.00 Initial Bse: 15 98 21 12 65 7 8 2 7 25 2 10 User Adj: 1.00 1.00 1.00 1.00 1.00 1.00 1.00 1.00 1.00 1.00 1.00 1.00 PHF Adj: 1.00 1.00 1.00 1.00 1.00 1.00 1.00 1.00 1.00 1.00 1.00 1.00 PHF Volume: 15 98 21 12 65 7 8 2 7 25 2 10 Reduct Vol: 0 0 0 0 0 0 0 0 0 0 0 0 Final Vol.: 15 98 21 12 65 7 8 2 7 25 2 10 ------------|---------------||---------------||---------------||---------------| Critical Gap Module: Critical Gp: 7.1 6.5 6.2 7.1 6.5 6.2 4.1 xxxx xxxxx 4.1 xxxx xxxxx FollowUpTim: 3.5 4.0 3.3 3.5 4.0 3.3 2.2 xxxx xxxxx 2.2 xxxx xxxxx ------------|---------------||---------------||---------------||---------------| Capacity Module: Cnflict Vol: 114 84 6 138 82 7 12 xxxx xxxxx 9 xxxx xxxxx Potent Cap.: 867 811 1083 837 812 1081 1620 xxxx xxxxx 1624 xxxx xxxxx Move Cap.: 795 794 1083 732 795 1081 1620 xxxx xxxxx 1624 xxxx xxxxx Volume/Cap: 0.02 0.12 0.02 0.02 0.08 0.01 0.00 xxxx xxxx 0.02 xxxx xxxx ------------|---------------||---------------||---------------||---------------| Level Of Service Module: Queue: xxxxx xxxx xxxxx xxxxx xxxx xxxxx 0.0 xxxx xxxxx 0.0 xxxx xxxxx Stopped Del:xxxxx xxxx xxxxx xxxxx xxxx xxxxx 7.2 xxxx xxxxx 7.3 xxxx xxxxx LOS by Move: * * * * * * A * * A * * Movement: LT - LTR - RT LT - LTR - RT LT - LTR - RT LT - LTR - RT Shared Cap.: xxxx 829 xxxxx xxxx 803 xxxxx xxxx xxxx xxxxx xxxx xxxx xxxxx SharedQueue:xxxxx 0.6 xxxxx xxxxx 0.3 xxxxx xxxxx xxxx xxxxx xxxxx xxxx xxxxx Shrd StpDel:xxxxx 10.2 xxxxx xxxxx 10.0 xxxxx xxxxx xxxx xxxxx xxxxx xxxx xxxxx Shared LOS: * B * * B * * * * * * * ApproachDel: 10.2 10.0 xxxxxx xxxxxx ApproachLOS: B B * * Traffix 7.6.0115 (c) 2004 Dowling Assoc. Licensed to TJKM, PLEASANTON, CA

Existing_PM Thu Dec 2, 2004 09:44:07 Page 3-1 -------------------------------------------------------------------------------- -------------------------------------------------------------------------------- Level Of Service Computation Report 2000 HCM Unsignalized Method (Base Volume Alternative) ******************************************************************************** Intersection #2 Annapolis Road/Stewarts Point ******************************************************************************** Average Delay (sec/veh): 3.1 Worst Case Level Of Service: A[ 8.6] ******************************************************************************** Approach: North Bound South Bound East Bound West Bound Movement: L - T - R L - T - R L - T - R L - T - R ------------|---------------||---------------||---------------||---------------| Control: Uncontrolled Uncontrolled Stop Sign Stop Sign Rights: Include Include Include Include Lanes: 0 1 0 0 0 0 0 0 1 0 0 0 1! 0 0 0 0 0 0 0 ------------|---------------||---------------||---------------||---------------| Volume Module: Base Vol: 8 14 0 0 14 20 9 0 12 0 0 0 Growth Adj: 1.00 1.00 1.00 1.00 1.00 1.00 1.00 1.00 1.00 1.00 1.00 1.00 Initial Bse: 8 14 0 0 14 20 9 0 12 0 0 0 User Adj: 1.00 1.00 1.00 1.00 1.00 1.00 1.00 1.00 1.00 1.00 1.00 1.00 PHF Adj: 1.00 1.00 1.00 1.00 1.00 1.00 1.00 1.00 1.00 1.00 1.00 1.00 PHF Volume: 8 14 0 0 14 20 9 0 12 0 0 0 Reduct Vol: 0 0 0 0 0 0 0 0 0 0 0 0 Final Vol.: 8 14 0 0 14 20 9 0 12 0 0 0 ------------|---------------||---------------||---------------||---------------| Critical Gap Module: Critical Gp: 4.1 xxxx xxxxx xxxxx xxxx xxxxx 6.4 xxxx 6.2 xxxxx xxxx xxxxx FollowUpTim: 2.2 xxxx xxxxx xxxxx xxxx xxxxx 3.5 xxxx 3.3 xxxxx xxxx xxxxx ------------|---------------||---------------||---------------||---------------| Capacity Module: Cnflict Vol: 34 xxxx xxxxx xxxx xxxx xxxxx 54 xxxx 24 xxxx xxxx xxxxx Potent Cap.: 1591 xxxx xxxxx xxxx xxxx xxxxx 959 xxxx 1058 xxxx xxxx xxxxx Move Cap.: 1591 xxxx xxxxx xxxx xxxx xxxxx 955 xxxx 1058 xxxx xxxx xxxxx Volume/Cap: 0.01 xxxx xxxx xxxx xxxx xxxx 0.01 xxxx 0.01 xxxx xxxx xxxx ------------|---------------||---------------||---------------||---------------| Level Of Service Module: Queue: 0.0 xxxx xxxxx xxxxx xxxx xxxxx xxxxx xxxx xxxxx xxxxx xxxx xxxxx Stopped Del: 7.3 xxxx xxxxx xxxxx xxxx xxxxx xxxxx xxxx xxxxx xxxxx xxxx xxxxx LOS by Move: A * * * * * * * * * * * Movement: LT - LTR - RT LT - LTR - RT LT - LTR - RT LT - LTR - RT Shared Cap.: xxxx xxxx xxxxx xxxx xxxx xxxxx xxxx 1012 xxxxx xxxx xxxx xxxxx SharedQueue: 0.0 xxxx xxxxx xxxxx xxxx xxxxx xxxxx 0.1 xxxxx xxxxx xxxx xxxxx Shrd StpDel: 7.3 xxxx xxxxx xxxxx xxxx xxxxx xxxxx 8.6 xxxxx xxxxx xxxx xxxxx Shared LOS: A * * * * * * A * * * * ApproachDel: xxxxxx xxxxxx 8.6 xxxxxx ApproachLOS: * * A * Traffix 7.6.0115 (c) 2004 Dowling Assoc. Licensed to TJKM, PLEASANTON, CA

Existing_PM Thu Dec 2, 2004 09:44:07 Page 4-1 -------------------------------------------------------------------------------- -------------------------------------------------------------------------------- Level Of Service Computation Report 2000 HCM Unsignalized Method (Base Volume Alternative) ******************************************************************************** Intersection #3 State Route 1/Annapolis Road ******************************************************************************** Average Delay (sec/veh): 7.0 Worst Case Level Of Service: A[ 9.9] ******************************************************************************** Approach: North Bound South Bound East Bound West Bound Movement: L - T - R L - T - R L - T - R L - T - R ------------|---------------||---------------||---------------||---------------| Control: Stop Sign Stop Sign Uncontrolled Uncontrolled Rights: Include Include Include Include Lanes: 0 0 0 1 0 0 1 0 0 0 0 0 0 0 0 0 0 1! 0 0 ------------|---------------||---------------||---------------||---------------| Volume Module: Base Vol: 0 51 25 48 42 0 0 0 0 12 0 73 Growth Adj: 1.00 1.00 1.00 1.00 1.00 1.00 1.00 1.00 1.00 1.00 1.00 1.00 Initial Bse: 0 51 25 48 42 0 0 0 0 12 0 73 User Adj: 1.00 1.00 1.00 1.00 1.00 1.00 1.00 1.00 1.00 1.00 1.00 1.00 PHF Adj: 1.00 1.00 1.00 1.00 1.00 1.00 1.00 1.00 1.00 1.00 1.00 1.00 PHF Volume: 0 51 25 48 42 0 0 0 0 12 0 73 Reduct Vol: 0 0 0 0 0 0 0 0 0 0 0 0 Final Vol.: 0 51 25 48 42 0 0 0 0 12 0 73 ------------|---------------||---------------||---------------||---------------| Critical Gap Module: Critical Gp:xxxxx 6.5 6.2 7.1 6.5 xxxxx xxxxx xxxx xxxxx 4.1 xxxx xxxxx FollowUpTim:xxxxx 4.0 3.3 3.5 4.0 xxxxx xxxxx xxxx xxxxx 2.2 xxxx xxxxx ------------|---------------||---------------||---------------||---------------| Capacity Module: Cnflict Vol: xxxx 97 0 86 61 xxxxx xxxx xxxx xxxxx 0 xxxx xxxxx Potent Cap.: xxxx 797 900 905 834 xxxxx xxxx xxxx xxxxx 900 xxxx xxxxx Move Cap.: xxxx 786 900 828 823 xxxxx xxxx xxxx xxxxx 900 xxxx xxxxx Volume/Cap: xxxx 0.06 0.03 0.06 0.05 xxxx xxxx xxxx xxxx 0.01 xxxx xxxx ------------|---------------||---------------||---------------||---------------| Level Of Service Module: Queue: xxxxx xxxx xxxxx xxxxx xxxx xxxxx xxxxx xxxx xxxxx 0.0 xxxx xxxxx Stopped Del:xxxxx xxxx xxxxx xxxxx xxxx xxxxx xxxxx xxxx xxxxx 9.1 xxxx xxxxx LOS by Move: * * * * * * * * * A * * Movement: LT - LTR - RT LT - LTR - RT LT - LTR - RT LT - LTR - RT Shared Cap.: xxxx xxxx 820 826 xxxx xxxxx xxxx xxxx xxxxx xxxx xxxx xxxxx SharedQueue:xxxxx xxxx 0.3 0.4 xxxx xxxxx xxxxx xxxx xxxxx xxxxx xxxx xxxxx Shrd StpDel:xxxxx xxxx 9.8 9.9 xxxx xxxxx xxxxx xxxx xxxxx xxxxx xxxx xxxxx Shared LOS: * * A A * * * * * * * * ApproachDel: 9.8 9.9 xxxxxx xxxxxx ApproachLOS: A A * * Traffix 7.6.0115 (c) 2004 Dowling Assoc. Licensed to TJKM, PLEASANTON, CA

APPENDIX C – LEVEL OF SERVICE WORKSHEETS: EXISTING + PROJECT

Existing+Project_AM Thu Dec 2, 2004 09:44:30 Page 2-1 -------------------------------------------------------------------------------- -------------------------------------------------------------------------------- Level Of Service Computation Report 2000 HCM Unsignalized Method (Future Volume Alternative) ******************************************************************************** Intersection #1 State Route 1/Stewarts Point ******************************************************************************** Average Delay (sec/veh): 7.4 Worst Case Level Of Service: A[ 10.0] ******************************************************************************** Approach: North Bound South Bound East Bound West Bound Movement: L - T - R L - T - R L - T - R L - T - R ------------|---------------||---------------||---------------||---------------| Control: Stop Sign Stop Sign Uncontrolled Uncontrolled Rights: Include Include Include Include Lanes: 0 0 1! 0 0 0 0 1! 0 0 0 0 1! 0 0 0 0 1! 0 0 ------------|---------------||---------------||---------------||---------------| Volume Module: Base Vol: 2 49 30 13 45 3 1 0 4 29 0 8 Growth Adj: 1.00 1.00 1.00 1.00 1.00 1.00 1.00 1.00 1.00 1.00 1.00 1.00 Initial Bse: 2 49 30 13 45 3 1 0 4 29 0 8 Added Vol: 0 0 0 0 0 0 2 0 0 0 22 12 PasserByVol: 0 0 0 0 0 0 0 0 0 0 0 0 Initial Fut: 2 49 30 13 45 3 3 0 4 29 22 20 User Adj: 1.00 1.00 1.00 1.00 1.00 1.00 1.00 1.00 1.00 1.00 1.00 1.00 PHF Adj: 1.00 1.00 1.00 1.00 1.00 1.00 1.00 1.00 1.00 1.00 1.00 1.00 PHF Volume: 2 49 30 13 45 3 3 0 4 29 22 20 Reduct Vol: 0 0 0 0 0 0 0 0 0 0 0 0 Final Vol.: 2 49 30 13 45 3 3 0 4 29 22 20 Critical Gap Module: Critical Gp: 7.1 6.5 6.2 7.1 6.5 6.2 4.1 xxxx xxxxx 4.1 xxxx xxxxx FollowUpTim: 3.5 4.0 3.3 3.5 4.0 3.3 2.2 xxxx xxxxx 2.2 xxxx xxxxx ------------|---------------||---------------||---------------||---------------| Capacity Module: Cnflict Vol: 122 108 2 138 100 32 42 xxxx xxxxx 4 xxxx xxxxx Potent Cap.: 858 786 1088 838 794 1048 1580 xxxx xxxxx 1631 xxxx xxxxx Move Cap.: 805 770 1088 763 778 1048 1580 xxxx xxxxx 1631 xxxx xxxxx Volume/Cap: 0.00 0.06 0.03 0.02 0.06 0.00 0.00 xxxx xxxx 0.02 xxxx xxxx ------------|---------------||---------------||---------------||---------------| Level Of Service Module: Queue: xxxxx xxxx xxxxx xxxxx xxxx xxxxx 0.0 xxxx xxxxx 0.1 xxxx xxxxx Stopped Del:xxxxx xxxx xxxxx xxxxx xxxx xxxxx 7.3 xxxx xxxxx 7.2 xxxx xxxxx LOS by Move: * * * * * * A * * A * * Movement: LT - LTR - RT LT - LTR - RT LT - LTR - RT LT - LTR - RT Shared Cap.: xxxx 865 xxxxx xxxx 785 xxxxx xxxx xxxx xxxxx xxxx xxxx xxxxx SharedQueue:xxxxx 0.3 xxxxx xxxxx 0.3 xxxxx xxxxx xxxx xxxxx xxxxx xxxx xxxxx Shrd StpDel:xxxxx 9.6 xxxxx xxxxx 10.0 xxxxx xxxxx xxxx xxxxx xxxxx xxxx xxxxx Shared LOS: * A * * A * * * * * * * ApproachDel: 9.6 10.0 xxxxxx xxxxxx ApproachLOS: A A * * Traffix 7.6.0115 (c) 2004 Dowling Assoc. Licensed to TJKM, PLEASANTON, CA
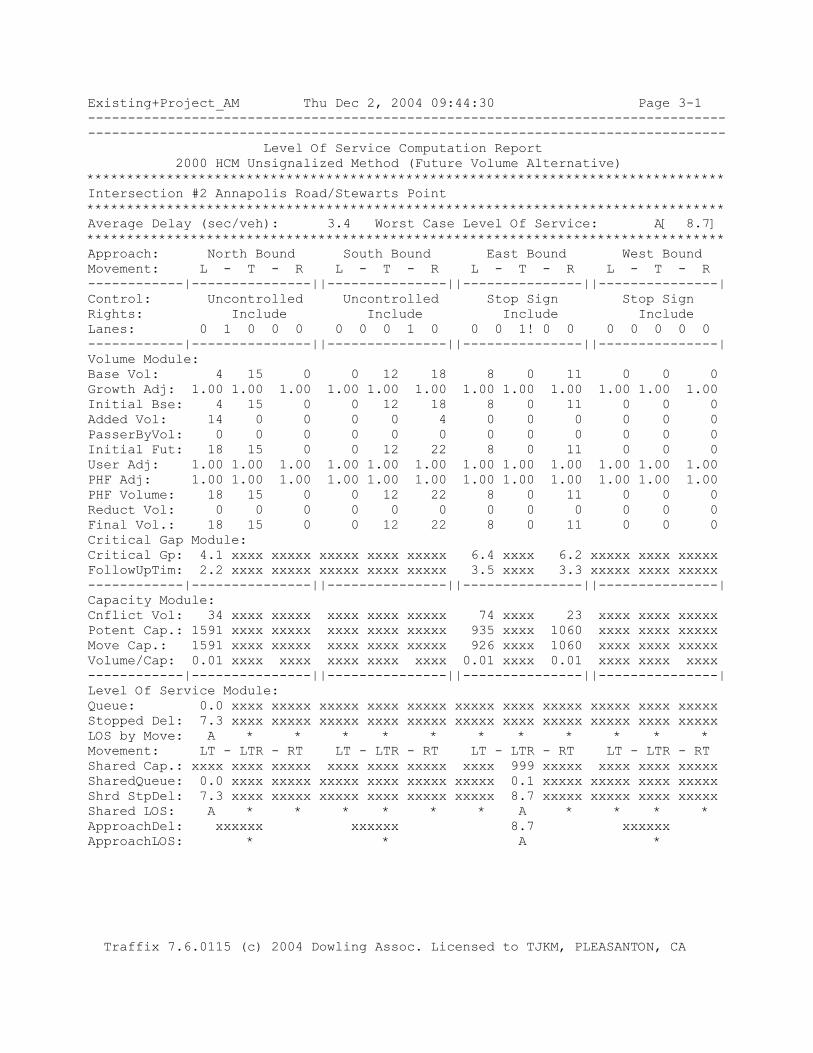
Existing+Project_AM Thu Dec 2, 2004 09:44:30 Page 3-1 -------------------------------------------------------------------------------- -------------------------------------------------------------------------------- Level Of Service Computation Report 2000 HCM Unsignalized Method (Future Volume Alternative) ******************************************************************************** Intersection #2 Annapolis Road/Stewarts Point ******************************************************************************** Average Delay (sec/veh): 3.4 Worst Case Level Of Service: A[ 8.7] ******************************************************************************** Approach: North Bound South Bound East Bound West Bound Movement: L - T - R L - T - R L - T - R L - T - R ------------|---------------||---------------||---------------||---------------| Control: Uncontrolled Uncontrolled Stop Sign Stop Sign Rights: Include Include Include Include Lanes: 0 1 0 0 0 0 0 0 1 0 0 0 1! 0 0 0 0 0 0 0 ------------|---------------||---------------||---------------||---------------| Volume Module: Base Vol: 4 15 0 0 12 18 8 0 11 0 0 0 Growth Adj: 1.00 1.00 1.00 1.00 1.00 1.00 1.00 1.00 1.00 1.00 1.00 1.00 Initial Bse: 4 15 0 0 12 18 8 0 11 0 0 0 Added Vol: 14 0 0 0 0 4 0 0 0 0 0 0 PasserByVol: 0 0 0 0 0 0 0 0 0 0 0 0 Initial Fut: 18 15 0 0 12 22 8 0 11 0 0 0 User Adj: 1.00 1.00 1.00 1.00 1.00 1.00 1.00 1.00 1.00 1.00 1.00 1.00 PHF Adj: 1.00 1.00 1.00 1.00 1.00 1.00 1.00 1.00 1.00 1.00 1.00 1.00 PHF Volume: 18 15 0 0 12 22 8 0 11 0 0 0 Reduct Vol: 0 0 0 0 0 0 0 0 0 0 0 0 Final Vol.: 18 15 0 0 12 22 8 0 11 0 0 0 Critical Gap Module: Critical Gp: 4.1 xxxx xxxxx xxxxx xxxx xxxxx 6.4 xxxx 6.2 xxxxx xxxx xxxxx FollowUpTim: 2.2 xxxx xxxxx xxxxx xxxx xxxxx 3.5 xxxx 3.3 xxxxx xxxx xxxxx ------------|---------------||---------------||---------------||---------------| Capacity Module: Cnflict Vol: 34 xxxx xxxxx xxxx xxxx xxxxx 74 xxxx 23 xxxx xxxx xxxxx Potent Cap.: 1591 xxxx xxxxx xxxx xxxx xxxxx 935 xxxx 1060 xxxx xxxx xxxxx Move Cap.: 1591 xxxx xxxxx xxxx xxxx xxxxx 926 xxxx 1060 xxxx xxxx xxxxx Volume/Cap: 0.01 xxxx xxxx xxxx xxxx xxxx 0.01 xxxx 0.01 xxxx xxxx xxxx ------------|---------------||---------------||---------------||---------------| Level Of Service Module: Queue: 0.0 xxxx xxxxx xxxxx xxxx xxxxx xxxxx xxxx xxxxx xxxxx xxxx xxxxx Stopped Del: 7.3 xxxx xxxxx xxxxx xxxx xxxxx xxxxx xxxx xxxxx xxxxx xxxx xxxxx LOS by Move: A * * * * * * * * * * * Movement: LT - LTR - RT LT - LTR - RT LT - LTR - RT LT - LTR - RT Shared Cap.: xxxx xxxx xxxxx xxxx xxxx xxxxx xxxx 999 xxxxx xxxx xxxx xxxxx SharedQueue: 0.0 xxxx xxxxx xxxxx xxxx xxxxx xxxxx 0.1 xxxxx xxxxx xxxx xxxxx Shrd StpDel: 7.3 xxxx xxxxx xxxxx xxxx xxxxx xxxxx 8.7 xxxxx xxxxx xxxx xxxxx Shared LOS: A * * * * * * A * * * * ApproachDel: xxxxxx xxxxxx 8.7 xxxxxx ApproachLOS: * * A * Traffix 7.6.0115 (c) 2004 Dowling Assoc. Licensed to TJKM, PLEASANTON, CA

Existing+Project_AM Thu Dec 2, 2004 09:44:30 Page 4-1 -------------------------------------------------------------------------------- -------------------------------------------------------------------------------- Level Of Service Computation Report 2000 HCM Unsignalized Method (Future Volume Alternative) ******************************************************************************** Intersection #3 State Route 1/Annapolis Road ******************************************************************************** Average Delay (sec/veh): 8.6 Worst Case Level Of Service: B[ 11.4] ******************************************************************************** Approach: North Bound South Bound East Bound West Bound Movement: L - T - R L - T - R L - T - R L - T - R ------------|---------------||---------------||---------------||---------------| Control: Stop Sign Stop Sign Uncontrolled Uncontrolled Rights: Include Include Include Include Lanes: 0 0 0 1 0 0 1 0 0 0 0 1 0 0 0 0 0 1! 0 0 ------------|---------------||---------------||---------------||---------------| Volume Module: Base Vol: 0 64 25 61 89 0 0 0 0 20 0 34 Growth Adj: 1.00 1.00 1.00 1.00 1.00 1.00 1.00 1.00 1.00 1.00 1.00 1.00 Initial Bse: 0 64 25 61 89 0 0 0 0 20 0 34 Added Vol: 0 0 0 0 0 0 36 2 0 0 0 22 PasserByVol: 0 0 0 0 0 0 0 0 0 0 0 0 Initial Fut: 0 64 25 61 89 0 36 2 0 20 0 56 User Adj: 1.00 1.00 1.00 1.00 1.00 1.00 1.00 1.00 1.00 1.00 1.00 1.00 PHF Adj: 1.00 1.00 1.00 1.00 1.00 1.00 1.00 1.00 1.00 1.00 1.00 1.00 PHF Volume: 0 64 25 61 89 0 36 2 0 20 0 56 Reduct Vol: 0 0 0 0 0 0 0 0 0 0 0 0 Final Vol.: 0 64 25 61 89 0 36 2 0 20 0 56 Critical Gap Module: Critical Gp:xxxxx 6.5 6.2 7.1 6.5 xxxxx 4.1 xxxx xxxxx 4.1 xxxx xxxxx FollowUpTim:xxxxx 4.0 3.3 3.5 4.0 xxxxx 2.2 xxxx xxxxx 2.2 xxxx xxxxx ------------|---------------||---------------||---------------||---------------| Capacity Module: Cnflict Vol: xxxx 170 2 187 142 xxxxx 56 xxxx xxxxx 2 xxxx xxxxx Potent Cap.: xxxx 727 1088 779 753 xxxxx 1562 xxxx xxxxx 1634 xxxx xxxxx Move Cap.: xxxx 701 1088 689 726 xxxxx 1562 xxxx xxxxx 1634 xxxx xxxxx Volume/Cap: xxxx 0.09 0.02 0.09 0.12 xxxx 0.02 xxxx xxxx 0.01 xxxx xxxx ------------|---------------||---------------||---------------||---------------| Level Of Service Module: Queue: xxxxx xxxx xxxxx xxxxx xxxx xxxxx 0.1 xxxx xxxxx 0.0 xxxx xxxxx Stopped Del:xxxxx xxxx xxxxx xxxxx xxxx xxxxx 7.4 xxxx xxxxx 7.2 xxxx xxxxx LOS by Move: * * * * * * A * * A * * Movement: LT - LTR - RT LT - LTR - RT LT - LTR - RT LT - LTR - RT Shared Cap.: xxxx xxxx 779 710 xxxx xxxxx xxxx xxxx xxxxx xxxx xxxx xxxxx SharedQueue:xxxxx xxxx 0.4 0.8 xxxx xxxxx 0.1 xxxx xxxxx xxxxx xxxx xxxxx Shrd StpDel:xxxxx xxxx 10.2 11.4 xxxx xxxxx 7.4 xxxx xxxxx xxxxx xxxx xxxxx Shared LOS: * * B B * * A * * * * * ApproachDel: 10.2 11.4 xxxxxx xxxxxx ApproachLOS: B B * * Traffix 7.6.0115 (c) 2004 Dowling Assoc. Licensed to TJKM, PLEASANTON, CA

Existing+Project_PM Thu Dec 2, 2004 09:45:06 Page 2-1 -------------------------------------------------------------------------------- -------------------------------------------------------------------------------- Level Of Service Computation Report 2000 HCM Unsignalized Method (Future Volume Alternative) ******************************************************************************** Intersection #1 State Route 1/Stewarts Point ******************************************************************************** Average Delay (sec/veh): 8.6 Worst Case Level Of Service: B[ 10.4] ******************************************************************************** Approach: North Bound South Bound East Bound West Bound Movement: L - T - R L - T - R L - T - R L - T - R ------------|---------------||---------------||---------------||---------------| Control: Stop Sign Stop Sign Uncontrolled Uncontrolled Rights: Include Include Include Include Lanes: 0 0 1! 0 0 0 0 1! 0 0 0 0 1! 0 0 0 0 1! 0 0 ------------|---------------||---------------||---------------||---------------| Volume Module: Base Vol: 15 98 21 12 65 7 8 2 7 25 2 10 Growth Adj: 1.00 1.00 1.00 1.00 1.00 1.00 1.00 1.00 1.00 1.00 1.00 1.00 Initial Bse: 15 98 21 12 65 7 8 2 7 25 2 10 Added Vol: 0 0 0 12 0 2 0 22 0 0 0 0 PasserByVol: 0 0 0 0 0 0 0 0 0 0 0 0 Initial Fut: 15 98 21 24 65 9 8 24 7 25 2 10 User Adj: 1.00 1.00 1.00 1.00 1.00 1.00 1.00 1.00 1.00 1.00 1.00 1.00 PHF Adj: 1.00 1.00 1.00 1.00 1.00 1.00 1.00 1.00 1.00 1.00 1.00 1.00 PHF Volume: 15 98 21 24 65 9 8 24 7 25 2 10 Reduct Vol: 0 0 0 0 0 0 0 0 0 0 0 0 Final Vol.: 15 98 21 24 65 9 8 24 7 25 2 10 Critical Gap Module: Critical Gp: 7.1 6.5 6.2 7.1 6.5 6.2 4.1 xxxx xxxxx 4.1 xxxx xxxxx FollowUpTim: 3.5 4.0 3.3 3.5 4.0 3.3 2.2 xxxx xxxxx 2.2 xxxx xxxxx ------------|---------------||---------------||---------------||---------------| Capacity Module: Cnflict Vol: 138 106 28 160 104 7 12 xxxx xxxxx 31 xxxx xxxxx Potent Cap.: 838 788 1054 810 790 1081 1620 xxxx xxxxx 1595 xxxx xxxxx Move Cap.: 765 772 1054 706 773 1081 1620 xxxx xxxxx 1595 xxxx xxxxx Volume/Cap: 0.02 0.13 0.02 0.03 0.08 0.01 0.00 xxxx xxxx 0.02 xxxx xxxx ------------|---------------||---------------||---------------||---------------| Level Of Service Module: Queue: xxxxx xxxx xxxxx xxxxx xxxx xxxxx 0.0 xxxx xxxxx 0.0 xxxx xxxxx Stopped Del:xxxxx xxxx xxxxx xxxxx xxxx xxxxx 7.2 xxxx xxxxx 7.3 xxxx xxxxx LOS by Move: * * * * * * A * * A * * Movement: LT - LTR - RT LT - LTR - RT LT - LTR - RT LT - LTR - RT Shared Cap.: xxxx 805 xxxxx xxxx 775 xxxxx xxxx xxxx xxxxx xxxx xxxx xxxxx SharedQueue:xxxxx 0.6 xxxxx xxxxx 0.4 xxxxx xxxxx xxxx xxxxx xxxxx xxxx xxxxx Shrd StpDel:xxxxx 10.4 xxxxx xxxxx 10.3 xxxxx xxxxx xxxx xxxxx xxxxx xxxx xxxxx Shared LOS: * B * * B * * * * * * * ApproachDel: 10.4 10.3 xxxxxx xxxxxx ApproachLOS: B B * * Traffix 7.6.0115 (c) 2004 Dowling Assoc. Licensed to TJKM, PLEASANTON, CA

Existing+Project_PM Thu Dec 2, 2004 09:45:06 Page 3-1 -------------------------------------------------------------------------------- -------------------------------------------------------------------------------- Level Of Service Computation Report 2000 HCM Unsignalized Method (Future Volume Alternative) ******************************************************************************** Intersection #2 Annapolis Road/Stewarts Point ******************************************************************************** Average Delay (sec/veh): 4.2 Worst Case Level Of Service: A[ 8.7] ******************************************************************************** Approach: North Bound South Bound East Bound West Bound Movement: L - T - R L - T - R L - T - R L - T - R ------------|---------------||---------------||---------------||---------------| Control: Uncontrolled Uncontrolled Stop Sign Stop Sign Rights: Include Include Include Include Lanes: 0 1 0 0 0 0 0 0 1 0 0 0 1! 0 0 0 0 0 0 0 ------------|---------------||---------------||---------------||---------------| Volume Module: Base Vol: 8 14 0 0 14 20 9 0 12 0 0 0 Growth Adj: 1.00 1.00 1.00 1.00 1.00 1.00 1.00 1.00 1.00 1.00 1.00 1.00 Initial Bse: 8 14 0 0 14 20 9 0 12 0 0 0 Added Vol: 0 0 0 0 0 0 4 0 14 0 0 0 PasserByVol: 0 0 0 0 0 0 0 0 0 0 0 0 Initial Fut: 8 14 0 0 14 20 13 0 26 0 0 0 User Adj: 1.00 1.00 1.00 1.00 1.00 1.00 1.00 1.00 1.00 1.00 1.00 1.00 PHF Adj: 1.00 1.00 1.00 1.00 1.00 1.00 1.00 1.00 1.00 1.00 1.00 1.00 PHF Volume: 8 14 0 0 14 20 13 0 26 0 0 0 Reduct Vol: 0 0 0 0 0 0 0 0 0 0 0 0 Final Vol.: 8 14 0 0 14 20 13 0 26 0 0 0 Critical Gap Module: Critical Gp: 4.1 xxxx xxxxx xxxxx xxxx xxxxx 6.4 xxxx 6.2 xxxxx xxxx xxxxx FollowUpTim: 2.2 xxxx xxxxx xxxxx xxxx xxxxx 3.5 xxxx 3.3 xxxxx xxxx xxxxx ------------|---------------||---------------||---------------||---------------| Capacity Module: Cnflict Vol: 34 xxxx xxxxx xxxx xxxx xxxxx 54 xxxx 24 xxxx xxxx xxxxx Potent Cap.: 1591 xxxx xxxxx xxxx xxxx xxxxx 959 xxxx 1058 xxxx xxxx xxxxx Move Cap.: 1591 xxxx xxxxx xxxx xxxx xxxxx 955 xxxx 1058 xxxx xxxx xxxxx Volume/Cap: 0.01 xxxx xxxx xxxx xxxx xxxx 0.01 xxxx 0.02 xxxx xxxx xxxx ------------|---------------||---------------||---------------||---------------| Level Of Service Module: Queue: 0.0 xxxx xxxxx xxxxx xxxx xxxxx xxxxx xxxx xxxxx xxxxx xxxx xxxxx Stopped Del: 7.3 xxxx xxxxx xxxxx xxxx xxxxx xxxxx xxxx xxxxx xxxxx xxxx xxxxx LOS by Move: A * * * * * * * * * * * Movement: LT - LTR - RT LT - LTR - RT LT - LTR - RT LT - LTR - RT Shared Cap.: xxxx xxxx xxxxx xxxx xxxx xxxxx xxxx 1022 xxxxx xxxx xxxx xxxxx SharedQueue: 0.0 xxxx xxxxx xxxxx xxxx xxxxx xxxxx 0.1 xxxxx xxxxx xxxx xxxxx Shrd StpDel: 7.3 xxxx xxxxx xxxxx xxxx xxxxx xxxxx 8.7 xxxxx xxxxx xxxx xxxxx Shared LOS: A * * * * * * A * * * * ApproachDel: xxxxxx xxxxxx 8.7 xxxxxx ApproachLOS: * * A * Traffix 7.6.0115 (c) 2004 Dowling Assoc. Licensed to TJKM, PLEASANTON, CA
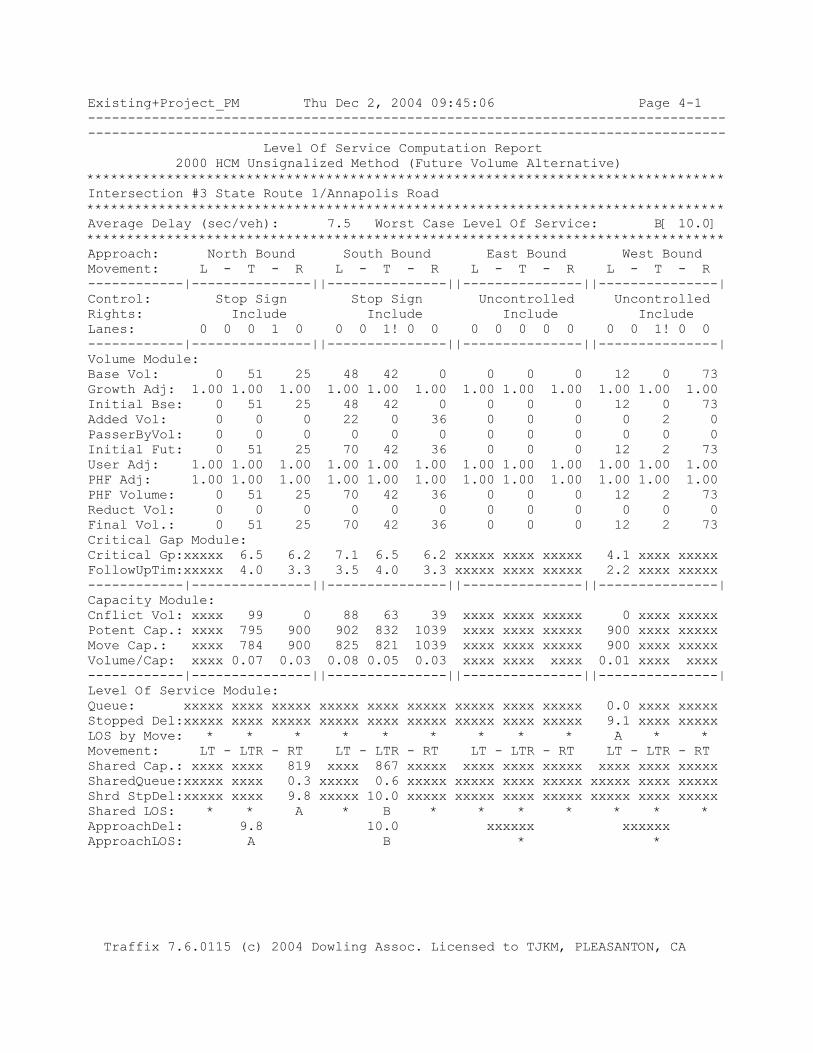
Existing+Project_PM Thu Dec 2, 2004 09:45:06 Page 4-1 -------------------------------------------------------------------------------- -------------------------------------------------------------------------------- Level Of Service Computation Report 2000 HCM Unsignalized Method (Future Volume Alternative) ******************************************************************************** Intersection #3 State Route 1/Annapolis Road ******************************************************************************** Average Delay (sec/veh): 7.5 Worst Case Level Of Service: B[ 10.0] ******************************************************************************** Approach: North Bound South Bound East Bound West Bound Movement: L - T - R L - T - R L - T - R L - T - R ------------|---------------||---------------||---------------||---------------| Control: Stop Sign Stop Sign Uncontrolled Uncontrolled Rights: Include Include Include Include Lanes: 0 0 0 1 0 0 0 1! 0 0 0 0 0 0 0 0 0 1! 0 0 ------------|---------------||---------------||---------------||---------------| Volume Module: Base Vol: 0 51 25 48 42 0 0 0 0 12 0 73 Growth Adj: 1.00 1.00 1.00 1.00 1.00 1.00 1.00 1.00 1.00 1.00 1.00 1.00 Initial Bse: 0 51 25 48 42 0 0 0 0 12 0 73 Added Vol: 0 0 0 22 0 36 0 0 0 0 2 0 PasserByVol: 0 0 0 0 0 0 0 0 0 0 0 0 Initial Fut: 0 51 25 70 42 36 0 0 0 12 2 73 User Adj: 1.00 1.00 1.00 1.00 1.00 1.00 1.00 1.00 1.00 1.00 1.00 1.00 PHF Adj: 1.00 1.00 1.00 1.00 1.00 1.00 1.00 1.00 1.00 1.00 1.00 1.00 PHF Volume: 0 51 25 70 42 36 0 0 0 12 2 73 Reduct Vol: 0 0 0 0 0 0 0 0 0 0 0 0 Final Vol.: 0 51 25 70 42 36 0 0 0 12 2 73 Critical Gap Module: Critical Gp:xxxxx 6.5 6.2 7.1 6.5 6.2 xxxxx xxxx xxxxx 4.1 xxxx xxxxx FollowUpTim:xxxxx 4.0 3.3 3.5 4.0 3.3 xxxxx xxxx xxxxx 2.2 xxxx xxxxx ------------|---------------||---------------||---------------||---------------| Capacity Module: Cnflict Vol: xxxx 99 0 88 63 39 xxxx xxxx xxxxx 0 xxxx xxxxx Potent Cap.: xxxx 795 900 902 832 1039 xxxx xxxx xxxxx 900 xxxx xxxxx Move Cap.: xxxx 784 900 825 821 1039 xxxx xxxx xxxxx 900 xxxx xxxxx Volume/Cap: xxxx 0.07 0.03 0.08 0.05 0.03 xxxx xxxx xxxx 0.01 xxxx xxxx ------------|---------------||---------------||---------------||---------------| Level Of Service Module: Queue: xxxxx xxxx xxxxx xxxxx xxxx xxxxx xxxxx xxxx xxxxx 0.0 xxxx xxxxx Stopped Del:xxxxx xxxx xxxxx xxxxx xxxx xxxxx xxxxx xxxx xxxxx 9.1 xxxx xxxxx LOS by Move: * * * * * * * * * A * * Movement: LT - LTR - RT LT - LTR - RT LT - LTR - RT LT - LTR - RT Shared Cap.: xxxx xxxx 819 xxxx 867 xxxxx xxxx xxxx xxxxx xxxx xxxx xxxxx SharedQueue:xxxxx xxxx 0.3 xxxxx 0.6 xxxxx xxxxx xxxx xxxxx xxxxx xxxx xxxxx Shrd StpDel:xxxxx xxxx 9.8 xxxxx 10.0 xxxxx xxxxx xxxx xxxxx xxxxx xxxx xxxxx Shared LOS: * * A * B * * * * * * * ApproachDel: 9.8 10.0 xxxxxx xxxxxx ApproachLOS: A B * * Traffix 7.6.0115 (c) 2004 Dowling Assoc. Licensed to TJKM, PLEASANTON, CA

APPENDIX D – TWO-WAY TWO-LANE HIGHWAY SEGMENT
WORKSHEETS, EXISTING PLUS PROJECT CONDITIONS
• STATE ROUTE 1 • ANNAPOLIS ROAD • STEWARTS POINT ROAD

HCS2000: Two-Lane Highways Release 4.1d ___________________Two-Way Two-Lane Highway Segment Analysis__________________ Analyst Andrew Kluter Agency/Co. TJKM Transport. Consultants Date Performed 12/1/2004 Analysis Time Period AM Peak Highway State Route 1 From/To Stewarts Point - Annapolis Rd Jurisdiction Sonoma County Analysis Year 2004-Existing+Project Description 117-075 - Artesa Winery - Sonoma County ___________________________________Input Data_________________________________ Highway class Class 2 Shoulder width 2.0 ft Peak-hour factor, PHF 0.85 Lane width 10.0 ft % Trucks and buses 5 % Segment length 4.0 mi % Recreational vehicles 7 % Terrain type Rolling % No-passing zones 40 % Grade: Length mi Access points/mi 10 /mi Up/down % Two-way hourly volume, V 306 veh/h Directional split 60 / 40 % ____________________________Average Travel Speed______________________________ Grade adjustment factor, fG 0.71 PCE for trucks, ET 2.5 PCE for RVs, ER 1.1 Heavy-vehicle adjustment factor, 0.924 Two-way flow rate,(note-1) vp 549 pc/h Highest directional split proportion (note-2) 329 pc/h Free-Flow Speed from Field Measurement: Field measured speed, SFM - mi/h Observed volume, Vf - veh/h Estimated Free-Flow Speed: Base free-flow speed, BFFS 50.0 mi/h Adj. for lane and shoulder width, fLS 3.7 mi/h Adj. for access points, fA 2.5 mi/h Free-flow speed, FFS 43.8 mi/h Adjustment for no-passing zones, fnp 2.1* mi/h Average travel speed, ATS 37.4 mi/h
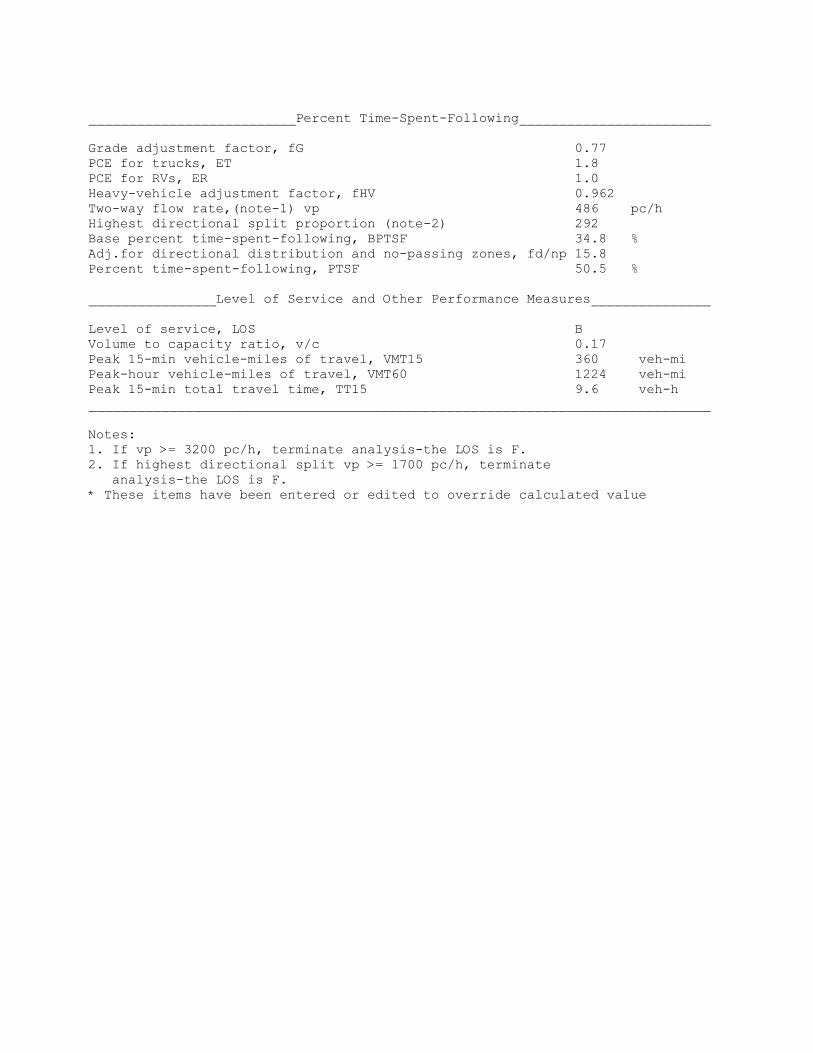
__________________________Percent Time-Spent-Following________________________ Grade adjustment factor, fG 0.77 PCE for trucks, ET 1.8 PCE for RVs, ER 1.0 Heavy-vehicle adjustment factor, fHV 0.962 Two-way flow rate,(note-1) vp 486 pc/h Highest directional split proportion (note-2) 292 Base percent time-spent-following, BPTSF 34.8 % Adj.for directional distribution and no-passing zones, fd/np 15.8 Percent time-spent-following, PTSF 50.5 % ________________Level of Service and Other Performance Measures_______________ Level of service, LOS B Volume to capacity ratio, v/c 0.17 Peak 15-min vehicle-miles of travel, VMT15 360 veh-mi Peak-hour vehicle-miles of travel, VMT60 1224 veh-mi Peak 15-min total travel time, TT15 9.6 veh-h ______________________________________________________________________________ Notes: 1. If vp >= 3200 pc/h, terminate analysis-the LOS is F. 2. If highest directional split vp >= 1700 pc/h, terminate analysis-the LOS is F. * These items have been entered or edited to override calculated value

HCS2000: Two-Lane Highways Release 4.1d ___________________Two-Way Two-Lane Highway Segment Analysis__________________ Analyst Andrew Kluter Agency/Co. TJKM Transport. Consultants Date Performed 12/1/2004 Analysis Time Period PM Peak Highway Annapolis Road From/To SR 1 - Stewarts Point Road Jurisdiction Sonoma County Analysis Year 2004-Existing+Project Description 117-075 - Artesa Winery - Sonoma County ___________________________________Input Data_________________________________ Highway class Class 2 Shoulder width 2.0 ft Peak-hour factor, PHF 0.85 Lane width 11.0 ft % Trucks and buses 5 % Segment length 8.0 mi % Recreational vehicles 7 % Terrain type Rolling % No-passing zones 40 % Grade: Length mi Access points/mi 10 /mi Up/down % Two-way hourly volume, V 182 veh/h Directional split 54 / 46 % ____________________________Average Travel Speed______________________________ Grade adjustment factor, fG 0.71 PCE for trucks, ET 2.5 PCE for RVs, ER 1.1 Heavy-vehicle adjustment factor, 0.924 Two-way flow rate,(note-1) vp 326 pc/h Highest directional split proportion (note-2) 176 pc/h Free-Flow Speed from Field Measurement: Field measured speed, SFM - mi/h Observed volume, Vf - veh/h Estimated Free-Flow Speed: Base free-flow speed, BFFS 50.0 mi/h Adj. for lane and shoulder width, fLS 3.7* mi/h Adj. for access points, fA 2.5 mi/h Free-flow speed, FFS 43.8 mi/h Adjustment for no-passing zones, fnp 1.3* mi/h Average travel speed, ATS 40.0 mi/h

__________________________Percent Time-Spent-Following________________________ Grade adjustment factor, fG 0.77 PCE for trucks, ET 1.8 PCE for RVs, ER 1.0 Heavy-vehicle adjustment factor, fHV 0.962 Two-way flow rate,(note-1) vp 289 pc/h Highest directional split proportion (note-2) 156 Base percent time-spent-following, BPTSF 22.4 % Adj.for directional distribution and no-passing zones, fd/np 17.5 Percent time-spent-following, PTSF 39.9 % ________________Level of Service and Other Performance Measures_______________ Level of service, LOS A Volume to capacity ratio, v/c 0.10 Peak 15-min vehicle-miles of travel, VMT15 428 veh-mi Peak-hour vehicle-miles of travel, VMT60 1456 veh-mi Peak 15-min total travel time, TT15 10.7 veh-h ______________________________________________________________________________ Notes: 1. If vp >= 3200 pc/h, terminate analysis-the LOS is F. 2. If highest directional split vp >= 1700 pc/h, terminate analysis-the LOS is F. * These items have been entered or edited to override calculated value

HCS2000: Two-Lane Highways Release 4.1d ___________________Two-Way Two-Lane Highway Segment Analysis__________________ Analyst Andrew Kluter Agency/Co. TJKM Transport. Consultants Date Performed 12/1/2004 Analysis Time Period AM Peak Highway Stewarts Point Road From/To SR 1 - Annapolis Road Jurisdiction Sonoma County Analysis Year 2004-Existing+Project Description 117-075 - Artesa Winery - Sonoma County ___________________________________Input Data_________________________________ Highway class Class 2 Shoulder width 3.0 ft Peak-hour factor, PHF 0.85 Lane width 11.0 ft % Trucks and buses 5 % Segment length 4.0 mi % Recreational vehicles 7 % Terrain type Rolling % No-passing zones 60 % Grade: Length mi Access points/mi 10 /mi Up/down % Two-way hourly volume, V 114 veh/h Directional split 54 / 46 % ____________________________Average Travel Speed______________________________ Grade adjustment factor, fG 0.71 PCE for trucks, ET 2.5 PCE for RVs, ER 1.1 Heavy-vehicle adjustment factor, 0.924 Two-way flow rate,(note-1) vp 204 pc/h Highest directional split proportion (note-2) 110 pc/h Free-Flow Speed from Field Measurement: Field measured speed, SFM - mi/h Observed volume, Vf - veh/h Estimated Free-Flow Speed: Base free-flow speed, BFFS 45.0 mi/h Adj. for lane and shoulder width, fLS 3.7* mi/h Adj. for access points, fA 2.5 mi/h Free-flow speed, FFS 38.8 mi/h Adjustment for no-passing zones, fnp 1.3* mi/h Average travel speed, ATS 35.9 mi/h

__________________________Percent Time-Spent-Following________________________ Grade adjustment factor, fG 0.77 PCE for trucks, ET 1.8 PCE for RVs, ER 1.0 Heavy-vehicle adjustment factor, fHV 0.962 Two-way flow rate,(note-1) vp 181 pc/h Highest directional split proportion (note-2) 98 Base percent time-spent-following, BPTSF 14.7 % Adj.for directional distribution and no-passing zones, fd/np 21.0 Percent time-spent-following, PTSF 35.8 % ________________Level of Service and Other Performance Measures_______________ Level of service, LOS A Volume to capacity ratio, v/c 0.06 Peak 15-min vehicle-miles of travel, VMT15 134 veh-mi Peak-hour vehicle-miles of travel, VMT60 456 veh-mi Peak 15-min total travel time, TT15 3.7 veh-h ______________________________________________________________________________ Notes: 1. If vp >= 3200 pc/h, terminate analysis-the LOS is F. 2. If highest directional split vp >= 1700 pc/h, terminate analysis-the LOS is F. * These items have been entered or edited to override calculated value
APPENDIX E – LEVEL OF SERVICE WORKSHEETS: FUTURE

Future_AM Thu Dec 2, 2004 09:48:10 Page 2-1 -------------------------------------------------------------------------------- -------------------------------------------------------------------------------- Level Of Service Computation Report 2000 HCM Unsignalized Method (Future Volume Alternative) ******************************************************************************** Intersection #1 State Route 1/Stewarts Point ******************************************************************************** Average Delay (sec/veh): 8.6 Worst Case Level Of Service: A[ 9.9] ******************************************************************************** Approach: North Bound South Bound East Bound West Bound Movement: L - T - R L - T - R L - T - R L - T - R ------------|---------------||---------------||---------------||---------------| Control: Stop Sign Stop Sign Uncontrolled Uncontrolled Rights: Include Include Include Include Lanes: 0 0 1! 0 0 0 0 1! 0 0 0 0 1! 0 0 0 0 1! 0 0 ------------|---------------||---------------||---------------||---------------| Volume Module: Future AM Peak Base Vol: 2 54 33 14 49 3 1 0 4 32 0 9 Growth Adj: 1.00 1.00 1.00 1.00 1.00 1.00 1.00 1.00 1.00 1.00 1.00 1.00 Initial Bse: 2 54 33 14 49 3 1 0 4 32 0 9 Added Vol: 0 0 0 0 0 0 0 0 0 0 0 0 PasserByVol: 0 0 0 0 0 0 0 0 0 0 0 0 Initial Fut: 2 54 33 14 49 3 1 0 4 32 0 9 User Adj: 1.00 1.00 1.00 1.00 1.00 1.00 1.00 1.00 1.00 1.00 1.00 1.00 PHF Adj: 1.00 1.00 1.00 1.00 1.00 1.00 1.00 1.00 1.00 1.00 1.00 1.00 PHF Volume: 2 54 33 14 49 3 1 0 4 32 0 9 Reduct Vol: 0 0 0 0 0 0 0 0 0 0 0 0 Final Vol.: 2 54 33 14 49 3 1 0 4 32 0 9 Critical Gap Module: Critical Gp: 7.1 6.5 6.2 7.1 6.5 6.2 4.1 xxxx xxxxx 4.1 xxxx xxxxx FollowUpTim: 3.5 4.0 3.3 3.5 4.0 3.3 2.2 xxxx xxxxx 2.2 xxxx xxxxx ------------|---------------||---------------||---------------||---------------| Capacity Module: Cnflict Vol: 99 77 2 116 75 5 9 xxxx xxxxx 4 xxxx xxxxx Potent Cap.: 888 817 1088 865 820 1085 1624 xxxx xxxxx 1631 xxxx xxxxx Move Cap.: 831 800 1088 783 803 1085 1624 xxxx xxxxx 1631 xxxx xxxxx Volume/Cap: 0.00 0.07 0.03 0.02 0.06 0.00 0.00 xxxx xxxx 0.02 xxxx xxxx ------------|---------------||---------------||---------------||---------------| Level Of Service Module: Queue: xxxxx xxxx xxxxx xxxxx xxxx xxxxx 0.0 xxxx xxxxx 0.1 xxxx xxxxx Stopped Del:xxxxx xxxx xxxxx xxxxx xxxx xxxxx 7.2 xxxx xxxxx 7.3 xxxx xxxxx LOS by Move: * * * * * * A * * A * * Movement: LT - LTR - RT LT - LTR - RT LT - LTR - RT LT - LTR - RT Shared Cap.: xxxx 888 xxxxx xxxx 808 xxxxx xxxx xxxx xxxxx xxxx xxxx xxxxx SharedQueue:xxxxx 0.3 xxxxx xxxxx 0.3 xxxxx xxxxx xxxx xxxxx xxxxx xxxx xxxxx Shrd StpDel:xxxxx 9.5 xxxxx xxxxx 9.9 xxxxx xxxxx xxxx xxxxx xxxxx xxxx xxxxx Shared LOS: * A * * A * * * * * * * ApproachDel: 9.5 9.9 xxxxxx xxxxxx ApproachLOS: A A * * Traffix 7.6.0115 (c) 2004 Dowling Assoc. Licensed to TJKM, PLEASANTON, CA

Future_AM Thu Dec 2, 2004 09:48:10 Page 3-1 -------------------------------------------------------------------------------- -------------------------------------------------------------------------------- Level Of Service Computation Report 2000 HCM Unsignalized Method (Future Volume Alternative) ******************************************************************************** Intersection #2 Annapolis Road/Stewarts Point ******************************************************************************** Average Delay (sec/veh): 2.8 Worst Case Level Of Service: A[ 8.6] ******************************************************************************** Approach: North Bound South Bound East Bound West Bound Movement: L - T - R L - T - R L - T - R L - T - R ------------|---------------||---------------||---------------||---------------| Control: Uncontrolled Uncontrolled Stop Sign Stop Sign Rights: Include Include Include Include Lanes: 0 1 0 0 0 0 0 0 1 0 0 0 1! 0 0 0 0 0 0 0 ------------|---------------||---------------||---------------||---------------| Volume Module: Future AM Peak Base Vol: 4 15 0 0 12 18 8 0 11 0 0 0 Growth Adj: 1.00 1.00 1.00 1.00 1.00 1.00 1.00 1.00 1.00 1.00 1.00 1.00 Initial Bse: 4 15 0 0 12 18 8 0 11 0 0 0 Added Vol: 0 0 0 0 0 0 0 0 0 0 0 0 PasserByVol: 0 0 0 0 0 0 0 0 0 0 0 0 Initial Fut: 4 15 0 0 12 18 8 0 11 0 0 0 User Adj: 1.00 1.00 1.00 1.00 1.00 1.00 1.00 1.00 1.00 1.00 1.00 1.00 PHF Adj: 1.00 1.00 1.00 1.00 1.00 1.00 1.00 1.00 1.00 1.00 1.00 1.00 PHF Volume: 4 15 0 0 12 18 8 0 11 0 0 0 Reduct Vol: 0 0 0 0 0 0 0 0 0 0 0 0 Final Vol.: 4 15 0 0 12 18 8 0 11 0 0 0 Critical Gap Module: Critical Gp: 4.1 xxxx xxxxx xxxxx xxxx xxxxx 6.4 xxxx 6.2 xxxxx xxxx xxxxx FollowUpTim: 2.2 xxxx xxxxx xxxxx xxxx xxxxx 3.5 xxxx 3.3 xxxxx xxxx xxxxx ------------|---------------||---------------||---------------||---------------| Capacity Module: Cnflict Vol: 30 xxxx xxxxx xxxx xxxx xxxxx 44 xxxx 21 xxxx xxxx xxxxx Potent Cap.: 1596 xxxx xxxxx xxxx xxxx xxxxx 972 xxxx 1062 xxxx xxxx xxxxx Move Cap.: 1596 xxxx xxxxx xxxx xxxx xxxxx 970 xxxx 1062 xxxx xxxx xxxxx Volume/Cap: 0.00 xxxx xxxx xxxx xxxx xxxx 0.01 xxxx 0.01 xxxx xxxx xxxx ------------|---------------||---------------||---------------||---------------| Level Of Service Module: Queue: 0.0 xxxx xxxxx xxxxx xxxx xxxxx xxxxx xxxx xxxxx xxxxx xxxx xxxxx Stopped Del: 7.3 xxxx xxxxx xxxxx xxxx xxxxx xxxxx xxxx xxxxx xxxxx xxxx xxxxx LOS by Move: A * * * * * * * * * * * Movement: LT - LTR - RT LT - LTR - RT LT - LTR - RT LT - LTR - RT Shared Cap.: xxxx xxxx xxxxx xxxx xxxx xxxxx xxxx 1021 xxxxx xxxx xxxx xxxxx SharedQueue: 0.0 xxxx xxxxx xxxxx xxxx xxxxx xxxxx 0.1 xxxxx xxxxx xxxx xxxxx Shrd StpDel: 7.3 xxxx xxxxx xxxxx xxxx xxxxx xxxxx 8.6 xxxxx xxxxx xxxx xxxxx Shared LOS: A * * * * * * A * * * * ApproachDel: xxxxxx xxxxxx 8.6 xxxxxx ApproachLOS: * * A * Traffix 7.6.0115 (c) 2004 Dowling Assoc. Licensed to TJKM, PLEASANTON, CA
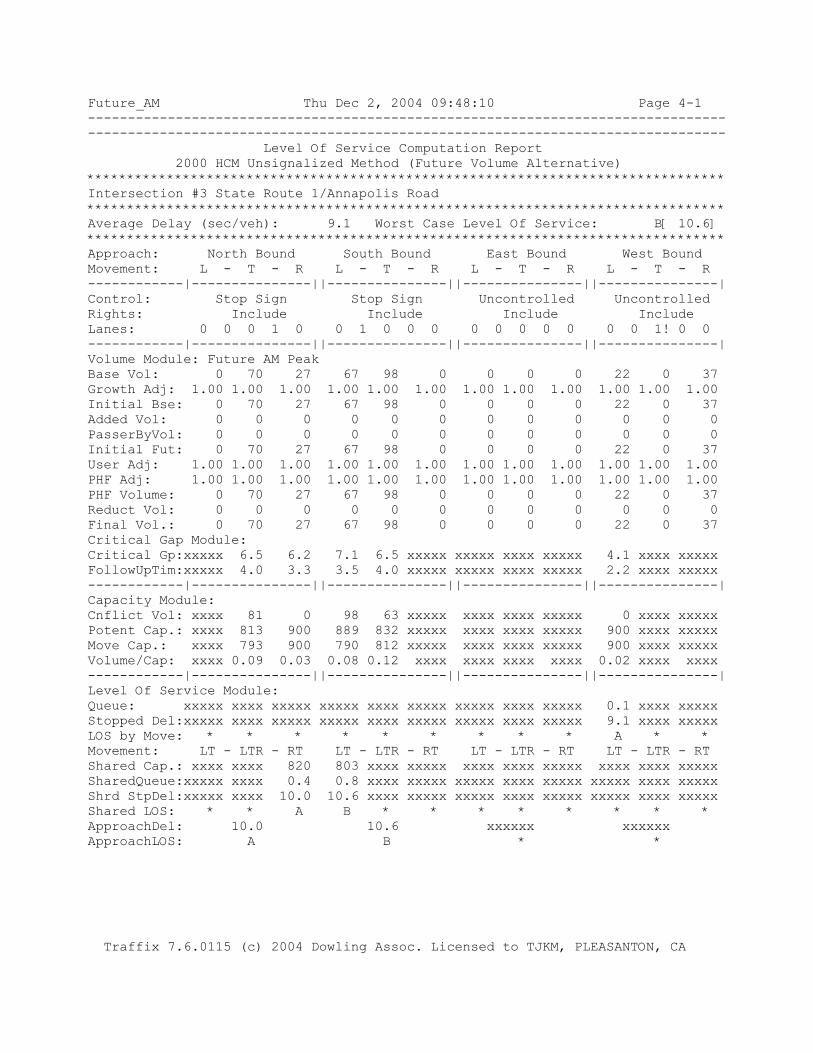
Future_AM Thu Dec 2, 2004 09:48:10 Page 4-1 -------------------------------------------------------------------------------- -------------------------------------------------------------------------------- Level Of Service Computation Report 2000 HCM Unsignalized Method (Future Volume Alternative) ******************************************************************************** Intersection #3 State Route 1/Annapolis Road ******************************************************************************** Average Delay (sec/veh): 9.1 Worst Case Level Of Service: B[ 10.6] ******************************************************************************** Approach: North Bound South Bound East Bound West Bound Movement: L - T - R L - T - R L - T - R L - T - R ------------|---------------||---------------||---------------||---------------| Control: Stop Sign Stop Sign Uncontrolled Uncontrolled Rights: Include Include Include Include Lanes: 0 0 0 1 0 0 1 0 0 0 0 0 0 0 0 0 0 1! 0 0 ------------|---------------||---------------||---------------||---------------| Volume Module: Future AM Peak Base Vol: 0 70 27 67 98 0 0 0 0 22 0 37 Growth Adj: 1.00 1.00 1.00 1.00 1.00 1.00 1.00 1.00 1.00 1.00 1.00 1.00 Initial Bse: 0 70 27 67 98 0 0 0 0 22 0 37 Added Vol: 0 0 0 0 0 0 0 0 0 0 0 0 PasserByVol: 0 0 0 0 0 0 0 0 0 0 0 0 Initial Fut: 0 70 27 67 98 0 0 0 0 22 0 37 User Adj: 1.00 1.00 1.00 1.00 1.00 1.00 1.00 1.00 1.00 1.00 1.00 1.00 PHF Adj: 1.00 1.00 1.00 1.00 1.00 1.00 1.00 1.00 1.00 1.00 1.00 1.00 PHF Volume: 0 70 27 67 98 0 0 0 0 22 0 37 Reduct Vol: 0 0 0 0 0 0 0 0 0 0 0 0 Final Vol.: 0 70 27 67 98 0 0 0 0 22 0 37 Critical Gap Module: Critical Gp:xxxxx 6.5 6.2 7.1 6.5 xxxxx xxxxx xxxx xxxxx 4.1 xxxx xxxxx FollowUpTim:xxxxx 4.0 3.3 3.5 4.0 xxxxx xxxxx xxxx xxxxx 2.2 xxxx xxxxx ------------|---------------||---------------||---------------||---------------| Capacity Module: Cnflict Vol: xxxx 81 0 98 63 xxxxx xxxx xxxx xxxxx 0 xxxx xxxxx Potent Cap.: xxxx 813 900 889 832 xxxxx xxxx xxxx xxxxx 900 xxxx xxxxx Move Cap.: xxxx 793 900 790 812 xxxxx xxxx xxxx xxxxx 900 xxxx xxxxx Volume/Cap: xxxx 0.09 0.03 0.08 0.12 xxxx xxxx xxxx xxxx 0.02 xxxx xxxx ------------|---------------||---------------||---------------||---------------| Level Of Service Module: Queue: xxxxx xxxx xxxxx xxxxx xxxx xxxxx xxxxx xxxx xxxxx 0.1 xxxx xxxxx Stopped Del:xxxxx xxxx xxxxx xxxxx xxxx xxxxx xxxxx xxxx xxxxx 9.1 xxxx xxxxx LOS by Move: * * * * * * * * * A * * Movement: LT - LTR - RT LT - LTR - RT LT - LTR - RT LT - LTR - RT Shared Cap.: xxxx xxxx 820 803 xxxx xxxxx xxxx xxxx xxxxx xxxx xxxx xxxxx SharedQueue:xxxxx xxxx 0.4 0.8 xxxx xxxxx xxxxx xxxx xxxxx xxxxx xxxx xxxxx Shrd StpDel:xxxxx xxxx 10.0 10.6 xxxx xxxxx xxxxx xxxx xxxxx xxxxx xxxx xxxxx Shared LOS: * * A B * * * * * * * * ApproachDel: 10.0 10.6 xxxxxx xxxxxx ApproachLOS: A B * * Traffix 7.6.0115 (c) 2004 Dowling Assoc. Licensed to TJKM, PLEASANTON, CA

Future_PM Thu Dec 2, 2004 09:49:00 Page 2-1 -------------------------------------------------------------------------------- -------------------------------------------------------------------------------- Level Of Service Computation Report 2000 HCM Unsignalized Method (Future Volume Alternative) ******************************************************************************** Intersection #1 State Route 1/Stewarts Point ******************************************************************************** Average Delay (sec/veh): 9.0 Worst Case Level Of Service: B[ 10.2] ******************************************************************************** Approach: North Bound South Bound East Bound West Bound Movement: L - T - R L - T - R L - T - R L - T - R ------------|---------------||---------------||---------------||---------------| Control: Stop Sign Stop Sign Uncontrolled Uncontrolled Rights: Include Include Include Include Lanes: 0 0 1! 0 0 0 0 1! 0 0 0 0 1! 0 0 0 0 1! 0 0 ------------|---------------||---------------||---------------||---------------| Volume Module: Future PM Peak Base Vol: 16 97 23 13 71 8 9 2 8 27 2 11 Growth Adj: 1.00 1.00 1.00 1.00 1.00 1.00 1.00 1.00 1.00 1.00 1.00 1.00 Initial Bse: 16 97 23 13 71 8 9 2 8 27 2 11 Added Vol: 0 0 0 0 0 0 0 0 0 0 0 0 PasserByVol: 0 0 0 0 0 0 0 0 0 0 0 0 Initial Fut: 16 97 23 13 71 8 9 2 8 27 2 11 User Adj: 1.00 1.00 1.00 1.00 1.00 1.00 1.00 1.00 1.00 1.00 1.00 1.00 PHF Adj: 1.00 1.00 1.00 1.00 1.00 1.00 1.00 1.00 1.00 1.00 1.00 1.00 PHF Volume: 16 97 23 13 71 8 9 2 8 27 2 11 Reduct Vol: 0 0 0 0 0 0 0 0 0 0 0 0 Final Vol.: 16 97 23 13 71 8 9 2 8 27 2 11 Critical Gap Module: Critical Gp: 7.1 6.5 6.2 7.1 6.5 6.2 4.1 xxxx xxxxx 4.1 xxxx xxxxx FollowUpTim: 3.5 4.0 3.3 3.5 4.0 3.3 2.2 xxxx xxxxx 2.2 xxxx xxxxx ------------|---------------||---------------||---------------||---------------| Capacity Module: Cnflict Vol: 125 91 6 146 89 8 13 xxxx xxxxx 10 xxxx xxxxx Potent Cap.: 854 803 1083 828 804 1081 1619 xxxx xxxxx 1623 xxxx xxxxx Move Cap.: 776 785 1083 721 786 1081 1619 xxxx xxxxx 1623 xxxx xxxxx Volume/Cap: 0.02 0.12 0.02 0.02 0.09 0.01 0.01 xxxx xxxx 0.02 xxxx xxxx ------------|---------------||---------------||---------------||---------------| Level Of Service Module: Queue: xxxxx xxxx xxxxx xxxxx xxxx xxxxx 0.0 xxxx xxxxx 0.1 xxxx xxxxx Stopped Del:xxxxx xxxx xxxxx xxxxx xxxx xxxxx 7.2 xxxx xxxxx 7.3 xxxx xxxxx LOS by Move: * * * * * * A * * A * * Movement: LT - LTR - RT LT - LTR - RT LT - LTR - RT LT - LTR - RT Shared Cap.: xxxx 822 xxxxx xxxx 795 xxxxx xxxx xxxx xxxxx xxxx xxxx xxxxx SharedQueue:xxxxx 0.6 xxxxx xxxxx 0.4 xxxxx xxxxx xxxx xxxxx xxxxx xxxx xxxxx Shrd StpDel:xxxxx 10.2 xxxxx xxxxx 10.1 xxxxx xxxxx xxxx xxxxx xxxxx xxxx xxxxx Shared LOS: * B * * B * * * * * * * ApproachDel: 10.2 10.1 xxxxxx xxxxxx ApproachLOS: B B * * Traffix 7.6.0115 (c) 2004 Dowling Assoc. Licensed to TJKM, PLEASANTON, CA

Future_PM Thu Dec 2, 2004 09:49:00 Page 3-1 -------------------------------------------------------------------------------- -------------------------------------------------------------------------------- Level Of Service Computation Report 2000 HCM Unsignalized Method (Future Volume Alternative) ******************************************************************************** Intersection #2 Annapolis Road/Stewarts Point ******************************************************************************** Average Delay (sec/veh): 3.1 Worst Case Level Of Service: A[ 8.6] ******************************************************************************** Approach: North Bound South Bound East Bound West Bound Movement: L - T - R L - T - R L - T - R L - T - R ------------|---------------||---------------||---------------||---------------| Control: Uncontrolled Uncontrolled Stop Sign Stop Sign Rights: Include Include Include Include Lanes: 0 1 0 0 0 0 0 0 1 0 0 0 1! 0 0 0 0 1! 0 0 ------------|---------------||---------------||---------------||---------------| Volume Module: Base Vol: 9 15 0 0 15 22 0 0 0 10 0 13 Growth Adj: 1.00 1.00 1.00 1.00 1.00 1.00 1.00 1.00 1.00 1.00 1.00 1.00 Initial Bse: 9 15 0 0 15 22 0 0 0 10 0 13 Added Vol: 0 0 0 0 0 0 0 0 0 0 0 0 PasserByVol: 0 0 0 0 0 0 0 0 0 0 0 0 Initial Fut: 9 15 0 0 15 22 0 0 0 10 0 13 User Adj: 1.00 1.00 1.00 1.00 1.00 1.00 1.00 1.00 1.00 1.00 1.00 1.00 PHF Adj: 1.00 1.00 1.00 1.00 1.00 1.00 1.00 1.00 1.00 1.00 1.00 1.00 PHF Volume: 9 15 0 0 15 22 0 0 0 10 0 13 Reduct Vol: 0 0 0 0 0 0 0 0 0 0 0 0 Final Vol.: 9 15 0 0 15 22 0 0 0 10 0 13 Critical Gap Module: Critical Gp: 4.1 xxxx xxxxx xxxxx xxxx xxxxx xxxxx xxxx xxxxx 6.4 xxxx 6.2 FollowUpTim: 2.2 xxxx xxxxx xxxxx xxxx xxxxx xxxxx xxxx xxxxx 3.5 xxxx 3.3 ------------|---------------||---------------||---------------||---------------| Capacity Module: Cnflict Vol: 37 xxxx xxxxx xxxx xxxx xxxxx xxxx xxxx xxxxx 59 xxxx 15 Potent Cap.: 1587 xxxx xxxxx xxxx xxxx xxxxx xxxx xxxx xxxxx 953 xxxx 1070 Move Cap.: 1587 xxxx xxxxx xxxx xxxx xxxxx xxxx xxxx xxxxx 949 xxxx 1070 Volume/Cap: 0.01 xxxx xxxx xxxx xxxx xxxx xxxx xxxx xxxx 0.01 xxxx 0.01 ------------|---------------||---------------||---------------||---------------| Level Of Service Module: Queue: 0.0 xxxx xxxxx xxxxx xxxx xxxxx xxxxx xxxx xxxxx xxxxx xxxx xxxxx Stopped Del: 7.3 xxxx xxxxx xxxxx xxxx xxxxx xxxxx xxxx xxxxx xxxxx xxxx xxxxx LOS by Move: A * * * * * * * * * * * Movement: LT - LTR - RT LT - LTR - RT LT - LTR - RT LT - LTR - RT Shared Cap.: xxxx xxxx xxxxx xxxx xxxx xxxxx xxxx 0 xxxxx xxxx 1014 xxxxx SharedQueue: 0.0 xxxx xxxxx xxxxx xxxx xxxxx xxxxx xxxx xxxxx xxxxx 0.1 xxxxx Shrd StpDel: 7.3 xxxx xxxxx xxxxx xxxx xxxxx xxxxx xxxx xxxxx xxxxx 8.6 xxxxx Shared LOS: A * * * * * * * * * A * ApproachDel: xxxxxx xxxxxx xxxxxx 8.6 ApproachLOS: * * * A Traffix 7.6.0115 (c) 2004 Dowling Assoc. Licensed to TJKM, PLEASANTON, CA

Future_PM Thu Dec 2, 2004 09:49:00 Page 4-1 -------------------------------------------------------------------------------- -------------------------------------------------------------------------------- Level Of Service Computation Report 2000 HCM Unsignalized Method (Future Volume Alternative) ******************************************************************************** Intersection #3 State Route 1/Annapolis Road ******************************************************************************** Average Delay (sec/veh): 7.0 Worst Case Level Of Service: B[ 10.0] ******************************************************************************** Approach: North Bound South Bound East Bound West Bound Movement: L - T - R L - T - R L - T - R L - T - R ------------|---------------||---------------||---------------||---------------| Control: Stop Sign Stop Sign Uncontrolled Uncontrolled Rights: Include Include Include Include Lanes: 0 0 0 1 0 0 1 0 0 0 0 0 0 0 0 0 0 1! 0 0 ------------|---------------||---------------||---------------||---------------| Volume Module: Future+Project_PM Base Vol: 0 56 27 53 46 0 0 0 0 13 0 80 Growth Adj: 1.00 1.00 1.00 1.00 1.00 1.00 1.00 1.00 1.00 1.00 1.00 1.00 Initial Bse: 0 56 27 53 46 0 0 0 0 13 0 80 Added Vol: 0 0 0 0 0 0 0 0 0 0 0 0 PasserByVol: 0 0 0 0 0 0 0 0 0 0 0 0 Initial Fut: 0 56 27 53 46 0 0 0 0 13 0 80 User Adj: 1.00 1.00 1.00 1.00 1.00 1.00 1.00 1.00 1.00 1.00 1.00 1.00 PHF Adj: 1.00 1.00 1.00 1.00 1.00 1.00 1.00 1.00 1.00 1.00 1.00 1.00 PHF Volume: 0 56 27 53 46 0 0 0 0 13 0 80 Reduct Vol: 0 0 0 0 0 0 0 0 0 0 0 0 Final Vol.: 0 56 27 53 46 0 0 0 0 13 0 80 Critical Gap Module: Critical Gp:xxxxx 6.5 6.2 7.1 6.5 xxxxx xxxxx xxxx xxxxx 4.1 xxxx xxxxx FollowUpTim:xxxxx 4.0 3.3 3.5 4.0 xxxxx xxxxx xxxx xxxxx 2.2 xxxx xxxxx ------------|---------------||---------------||---------------||---------------| Capacity Module: Cnflict Vol: xxxx 106 0 94 66 xxxxx xxxx xxxx xxxxx 0 xxxx xxxxx Potent Cap.: xxxx 788 900 894 829 xxxxx xxxx xxxx xxxxx 900 xxxx xxxxx Move Cap.: xxxx 776 900 811 816 xxxxx xxxx xxxx xxxxx 900 xxxx xxxxx Volume/Cap: xxxx 0.07 0.03 0.07 0.06 xxxx xxxx xxxx xxxx 0.01 xxxx xxxx ------------|---------------||---------------||---------------||---------------| Level Of Service Module: Queue: xxxxx xxxx xxxxx xxxxx xxxx xxxxx xxxxx xxxx xxxxx 0.0 xxxx xxxxx Stopped Del:xxxxx xxxx xxxxx xxxxx xxxx xxxxx xxxxx xxxx xxxxx 9.1 xxxx xxxxx LOS by Move: * * * * * * * * * A * * Movement: LT - LTR - RT LT - LTR - RT LT - LTR - RT LT - LTR - RT Shared Cap.: xxxx xxxx 813 813 xxxx xxxxx xxxx xxxx xxxxx xxxx xxxx xxxxx SharedQueue:xxxxx xxxx 0.3 0.4 xxxx xxxxx xxxxx xxxx xxxxx xxxxx xxxx xxxxx Shrd StpDel:xxxxx xxxx 9.9 10.0 xxxx xxxxx xxxxx xxxx xxxxx xxxxx xxxx xxxxx Shared LOS: * * A B * * * * * * * * ApproachDel: 9.9 10.0 xxxxxx xxxxxx ApproachLOS: A B * * Traffix 7.6.0115 (c) 2004 Dowling Assoc. Licensed to TJKM, PLEASANTON, CA

APPENDIX F – LEVEL OF SERVICE WORKSHEETS: FUTURE + PROJECT

Future+Project_AM Thu Dec 2, 2004 09:49:51 Page 2-1 -------------------------------------------------------------------------------- -------------------------------------------------------------------------------- Level Of Service Computation Report 2000 HCM Unsignalized Method (Future Volume Alternative) ******************************************************************************** Intersection #1 State Route 1/Stewarts Point ******************************************************************************** Average Delay (sec/veh): 7.5 Worst Case Level Of Service: B[ 10.1] ******************************************************************************** Approach: North Bound South Bound East Bound West Bound Movement: L - T - R L - T - R L - T - R L - T - R ------------|---------------||---------------||---------------||---------------| Control: Stop Sign Stop Sign Uncontrolled Uncontrolled Rights: Include Include Include Include Lanes: 0 0 1! 0 0 0 0 1! 0 0 0 0 1! 0 0 0 0 1! 0 0 ------------|---------------||---------------||---------------||---------------| Volume Module: Future AM Peak Base Vol: 2 54 33 14 49 3 1 0 4 32 0 9 Growth Adj: 1.00 1.00 1.00 1.00 1.00 1.00 1.00 1.00 1.00 1.00 1.00 1.00 Initial Bse: 2 54 33 14 49 3 1 0 4 32 0 9 Added Vol: 0 0 0 0 0 0 2 0 0 0 22 12 PasserByVol: 0 0 0 0 0 0 0 0 0 0 0 0 Initial Fut: 2 54 33 14 49 3 3 0 4 32 22 21 User Adj: 1.00 1.00 1.00 1.00 1.00 1.00 1.00 1.00 1.00 1.00 1.00 1.00 PHF Adj: 1.00 1.00 1.00 1.00 1.00 1.00 1.00 1.00 1.00 1.00 1.00 1.00 PHF Volume: 2 54 33 14 49 3 3 0 4 32 22 21 Reduct Vol: 0 0 0 0 0 0 0 0 0 0 0 0 Final Vol.: 2 54 33 14 49 3 3 0 4 32 22 21 Critical Gap Module: Critical Gp: 7.1 6.5 6.2 7.1 6.5 6.2 4.1 xxxx xxxxx 4.1 xxxx xxxxx FollowUpTim: 3.5 4.0 3.3 3.5 4.0 3.3 2.2 xxxx xxxxx 2.2 xxxx xxxxx ------------|---------------||---------------||---------------||---------------| Capacity Module: Cnflict Vol: 131 115 2 148 107 33 43 xxxx xxxxx 4 xxxx xxxxx Potent Cap.: 847 779 1088 825 787 1047 1579 xxxx xxxxx 1631 xxxx xxxxx Move Cap.: 790 762 1088 744 770 1047 1579 xxxx xxxxx 1631 xxxx xxxxx Volume/Cap: 0.00 0.07 0.03 0.02 0.06 0.00 0.00 xxxx xxxx 0.02 xxxx xxxx ------------|---------------||---------------||---------------||---------------| Level Of Service Module: Queue: xxxxx xxxx xxxxx xxxxx xxxx xxxxx 0.0 xxxx xxxxx 0.1 xxxx xxxxx Stopped Del:xxxxx xxxx xxxxx xxxxx xxxx xxxxx 7.3 xxxx xxxxx 7.3 xxxx xxxxx LOS by Move: * * * * * * A * * A * * Movement: LT - LTR - RT LT - LTR - RT LT - LTR - RT LT - LTR - RT Shared Cap.: xxxx 858 xxxxx xxxx 774 xxxxx xxxx xxxx xxxxx xxxx xxxx xxxxx SharedQueue:xxxxx 0.3 xxxxx xxxxx 0.3 xxxxx xxxxx xxxx xxxxx xxxxx xxxx xxxxx Shrd StpDel:xxxxx 9.7 xxxxx xxxxx 10.1 xxxxx xxxxx xxxx xxxxx xxxxx xxxx xxxxx Shared LOS: * A * * B * * * * * * * ApproachDel: 9.7 10.1 xxxxxx xxxxxx ApproachLOS: A B * * Traffix 7.6.0115 (c) 2004 Dowling Assoc. Licensed to TJKM, PLEASANTON, CA

Future+Project_AM Thu Dec 2, 2004 09:49:51 Page 3-1 -------------------------------------------------------------------------------- -------------------------------------------------------------------------------- Level Of Service Computation Report 2000 HCM Unsignalized Method (Future Volume Alternative) ******************************************************************************** Intersection #2 Annapolis Road/Stewarts Point ******************************************************************************** Average Delay (sec/veh): 3.4 Worst Case Level Of Service: A[ 8.7] ******************************************************************************** Approach: North Bound South Bound East Bound West Bound Movement: L - T - R L - T - R L - T - R L - T - R ------------|---------------||---------------||---------------||---------------| Control: Uncontrolled Uncontrolled Stop Sign Stop Sign Rights: Include Include Include Include Lanes: 0 1 0 0 0 0 0 0 1 0 0 0 1! 0 0 0 0 0 0 0 ------------|---------------||---------------||---------------||---------------| Volume Module: Future AM Peak Base Vol: 4 15 0 0 12 18 8 0 11 0 0 0 Growth Adj: 1.00 1.00 1.00 1.00 1.00 1.00 1.00 1.00 1.00 1.00 1.00 1.00 Initial Bse: 4 15 0 0 12 18 8 0 11 0 0 0 Added Vol: 14 0 0 0 0 4 0 0 0 0 0 0 PasserByVol: 0 0 0 0 0 0 0 0 0 0 0 0 Initial Fut: 18 15 0 0 12 22 8 0 11 0 0 0 User Adj: 1.00 1.00 1.00 1.00 1.00 1.00 1.00 1.00 1.00 1.00 1.00 1.00 PHF Adj: 1.00 1.00 1.00 1.00 1.00 1.00 1.00 1.00 1.00 1.00 1.00 1.00 PHF Volume: 18 15 0 0 12 22 8 0 11 0 0 0 Reduct Vol: 0 0 0 0 0 0 0 0 0 0 0 0 Final Vol.: 18 15 0 0 12 22 8 0 11 0 0 0 Critical Gap Module: Critical Gp: 4.1 xxxx xxxxx xxxxx xxxx xxxxx 6.4 xxxx 6.2 xxxxx xxxx xxxxx FollowUpTim: 2.2 xxxx xxxxx xxxxx xxxx xxxxx 3.5 xxxx 3.3 xxxxx xxxx xxxxx ------------|---------------||---------------||---------------||---------------| Capacity Module: Cnflict Vol: 34 xxxx xxxxx xxxx xxxx xxxxx 74 xxxx 23 xxxx xxxx xxxxx Potent Cap.: 1591 xxxx xxxxx xxxx xxxx xxxxx 935 xxxx 1060 xxxx xxxx xxxxx Move Cap.: 1591 xxxx xxxxx xxxx xxxx xxxxx 926 xxxx 1060 xxxx xxxx xxxxx Volume/Cap: 0.01 xxxx xxxx xxxx xxxx xxxx 0.01 xxxx 0.01 xxxx xxxx xxxx ------------|---------------||---------------||---------------||---------------| Level Of Service Module: Queue: 0.0 xxxx xxxxx xxxxx xxxx xxxxx xxxxx xxxx xxxxx xxxxx xxxx xxxxx Stopped Del: 7.3 xxxx xxxxx xxxxx xxxx xxxxx xxxxx xxxx xxxxx xxxxx xxxx xxxxx LOS by Move: A * * * * * * * * * * * Movement: LT - LTR - RT LT - LTR - RT LT - LTR - RT LT - LTR - RT Shared Cap.: xxxx xxxx xxxxx xxxx xxxx xxxxx xxxx 999 xxxxx xxxx xxxx xxxxx SharedQueue: 0.0 xxxx xxxxx xxxxx xxxx xxxxx xxxxx 0.1 xxxxx xxxxx xxxx xxxxx Shrd StpDel: 7.3 xxxx xxxxx xxxxx xxxx xxxxx xxxxx 8.7 xxxxx xxxxx xxxx xxxxx Shared LOS: A * * * * * * A * * * * ApproachDel: xxxxxx xxxxxx 8.7 xxxxxx ApproachLOS: * * A * Traffix 7.6.0115 (c) 2004 Dowling Assoc. Licensed to TJKM, PLEASANTON, CA
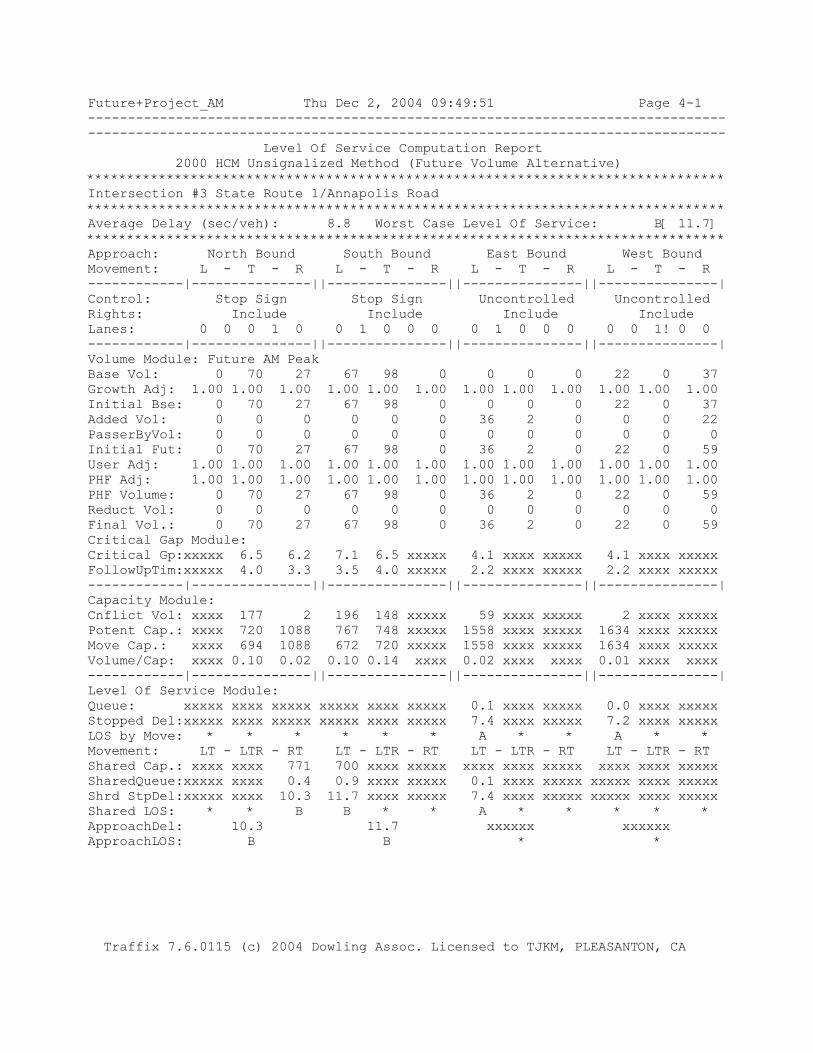
Future+Project_AM Thu Dec 2, 2004 09:49:51 Page 4-1 -------------------------------------------------------------------------------- -------------------------------------------------------------------------------- Level Of Service Computation Report 2000 HCM Unsignalized Method (Future Volume Alternative) ******************************************************************************** Intersection #3 State Route 1/Annapolis Road ******************************************************************************** Average Delay (sec/veh): 8.8 Worst Case Level Of Service: B[ 11.7] ******************************************************************************** Approach: North Bound South Bound East Bound West Bound Movement: L - T - R L - T - R L - T - R L - T - R ------------|---------------||---------------||---------------||---------------| Control: Stop Sign Stop Sign Uncontrolled Uncontrolled Rights: Include Include Include Include Lanes: 0 0 0 1 0 0 1 0 0 0 0 1 0 0 0 0 0 1! 0 0 ------------|---------------||---------------||---------------||---------------| Volume Module: Future AM Peak Base Vol: 0 70 27 67 98 0 0 0 0 22 0 37 Growth Adj: 1.00 1.00 1.00 1.00 1.00 1.00 1.00 1.00 1.00 1.00 1.00 1.00 Initial Bse: 0 70 27 67 98 0 0 0 0 22 0 37 Added Vol: 0 0 0 0 0 0 36 2 0 0 0 22 PasserByVol: 0 0 0 0 0 0 0 0 0 0 0 0 Initial Fut: 0 70 27 67 98 0 36 2 0 22 0 59 User Adj: 1.00 1.00 1.00 1.00 1.00 1.00 1.00 1.00 1.00 1.00 1.00 1.00 PHF Adj: 1.00 1.00 1.00 1.00 1.00 1.00 1.00 1.00 1.00 1.00 1.00 1.00 PHF Volume: 0 70 27 67 98 0 36 2 0 22 0 59 Reduct Vol: 0 0 0 0 0 0 0 0 0 0 0 0 Final Vol.: 0 70 27 67 98 0 36 2 0 22 0 59 Critical Gap Module: Critical Gp:xxxxx 6.5 6.2 7.1 6.5 xxxxx 4.1 xxxx xxxxx 4.1 xxxx xxxxx FollowUpTim:xxxxx 4.0 3.3 3.5 4.0 xxxxx 2.2 xxxx xxxxx 2.2 xxxx xxxxx ------------|---------------||---------------||---------------||---------------| Capacity Module: Cnflict Vol: xxxx 177 2 196 148 xxxxx 59 xxxx xxxxx 2 xxxx xxxxx Potent Cap.: xxxx 720 1088 767 748 xxxxx 1558 xxxx xxxxx 1634 xxxx xxxxx Move Cap.: xxxx 694 1088 672 720 xxxxx 1558 xxxx xxxxx 1634 xxxx xxxxx Volume/Cap: xxxx 0.10 0.02 0.10 0.14 xxxx 0.02 xxxx xxxx 0.01 xxxx xxxx ------------|---------------||---------------||---------------||---------------| Level Of Service Module: Queue: xxxxx xxxx xxxxx xxxxx xxxx xxxxx 0.1 xxxx xxxxx 0.0 xxxx xxxxx Stopped Del:xxxxx xxxx xxxxx xxxxx xxxx xxxxx 7.4 xxxx xxxxx 7.2 xxxx xxxxx LOS by Move: * * * * * * A * * A * * Movement: LT - LTR - RT LT - LTR - RT LT - LTR - RT LT - LTR - RT Shared Cap.: xxxx xxxx 771 700 xxxx xxxxx xxxx xxxx xxxxx xxxx xxxx xxxxx SharedQueue:xxxxx xxxx 0.4 0.9 xxxx xxxxx 0.1 xxxx xxxxx xxxxx xxxx xxxxx Shrd StpDel:xxxxx xxxx 10.3 11.7 xxxx xxxxx 7.4 xxxx xxxxx xxxxx xxxx xxxxx Shared LOS: * * B B * * A * * * * * ApproachDel: 10.3 11.7 xxxxxx xxxxxx ApproachLOS: B B * * Traffix 7.6.0115 (c) 2004 Dowling Assoc. Licensed to TJKM, PLEASANTON, CA

Future+Project_PM Thu Dec 2, 2004 09:50:16 Page 2-1 -------------------------------------------------------------------------------- -------------------------------------------------------------------------------- Level Of Service Computation Report 2000 HCM Unsignalized Method (Future Volume Alternative) ******************************************************************************** Intersection #1 State Route 1/Stewarts Point ******************************************************************************** Average Delay (sec/veh): 8.6 Worst Case Level Of Service: B[ 10.4] ******************************************************************************** Approach: North Bound South Bound East Bound West Bound Movement: L - T - R L - T - R L - T - R L - T - R ------------|---------------||---------------||---------------||---------------| Control: Stop Sign Stop Sign Uncontrolled Uncontrolled Rights: Include Include Include Include Lanes: 0 0 1! 0 0 0 0 1! 0 0 0 0 1! 0 0 0 0 1! 0 0 ------------|---------------||---------------||---------------||---------------| Volume Module: Future PM Peak Base Vol: 16 97 23 13 71 8 9 2 8 27 2 11 Growth Adj: 1.00 1.00 1.00 1.00 1.00 1.00 1.00 1.00 1.00 1.00 1.00 1.00 Initial Bse: 16 97 23 13 71 8 9 2 8 27 2 11 Added Vol: 0 0 0 12 0 2 0 22 0 0 0 0 PasserByVol: 0 0 0 0 0 0 0 0 0 0 0 0 Initial Fut: 16 97 23 25 71 10 9 24 8 27 2 11 User Adj: 1.00 1.00 1.00 1.00 1.00 1.00 1.00 1.00 1.00 1.00 1.00 1.00 PHF Adj: 1.00 1.00 1.00 1.00 1.00 1.00 1.00 1.00 1.00 1.00 1.00 1.00 PHF Volume: 16 97 23 25 71 10 9 24 8 27 2 11 Reduct Vol: 0 0 0 0 0 0 0 0 0 0 0 0 Final Vol.: 16 97 23 25 71 10 9 24 8 27 2 11 Critical Gap Module: Critical Gp: 7.1 6.5 6.2 7.1 6.5 6.2 4.1 xxxx xxxxx 4.1 xxxx xxxxx FollowUpTim: 3.5 4.0 3.3 3.5 4.0 3.3 2.2 xxxx xxxxx 2.2 xxxx xxxxx ------------|---------------||---------------||---------------||---------------| Capacity Module: Cnflict Vol: 148 113 28 168 112 8 13 xxxx xxxxx 32 xxxx xxxxx Potent Cap.: 825 781 1053 801 782 1081 1619 xxxx xxxxx 1593 xxxx xxxxx Move Cap.: 746 763 1053 695 765 1081 1619 xxxx xxxxx 1593 xxxx xxxxx Volume/Cap: 0.02 0.13 0.02 0.04 0.09 0.01 0.01 xxxx xxxx 0.02 xxxx xxxx ------------|---------------||---------------||---------------||---------------| Level Of Service Module: Queue: xxxxx xxxx xxxxx xxxxx xxxx xxxxx 0.0 xxxx xxxxx 0.1 xxxx xxxxx Stopped Del:xxxxx xxxx xxxxx xxxxx xxxx xxxxx 7.2 xxxx xxxxx 7.3 xxxx xxxxx LOS by Move: * * * * * * A * * A * * Movement: LT - LTR - RT LT - LTR - RT LT - LTR - RT LT - LTR - RT Shared Cap.: xxxx 798 xxxxx xxxx 768 xxxxx xxxx xxxx xxxxx xxxx xxxx xxxxx SharedQueue:xxxxx 0.6 xxxxx xxxxx 0.5 xxxxx xxxxx xxxx xxxxx xxxxx xxxx xxxxx Shrd StpDel:xxxxx 10.4 xxxxx xxxxx 10.4 xxxxx xxxxx xxxx xxxxx xxxxx xxxx xxxxx Shared LOS: * B * * B * * * * * * * ApproachDel: 10.4 10.4 xxxxxx xxxxxx ApproachLOS: B B * * Traffix 7.6.0115 (c) 2004 Dowling Assoc. Licensed to TJKM, PLEASANTON, CA

Future+Project_PM Thu Dec 2, 2004 09:50:16 Page 3-1 -------------------------------------------------------------------------------- -------------------------------------------------------------------------------- Level Of Service Computation Report 2000 HCM Unsignalized Method (Future Volume Alternative) ******************************************************************************** Intersection #2 Annapolis Road/Stewarts Point ******************************************************************************** Average Delay (sec/veh): 4.1 Worst Case Level Of Service: A[ 8.7] ******************************************************************************** Approach: North Bound South Bound East Bound West Bound Movement: L - T - R L - T - R L - T - R L - T - R ------------|---------------||---------------||---------------||---------------| Control: Uncontrolled Uncontrolled Stop Sign Stop Sign Rights: Include Include Include Include Lanes: 0 1 0 0 0 0 0 0 1 0 0 0 1! 0 0 0 0 1! 0 0 ------------|---------------||---------------||---------------||---------------| Volume Module: Base Vol: 9 15 0 0 15 22 0 0 0 10 0 13 Growth Adj: 1.00 1.00 1.00 1.00 1.00 1.00 1.00 1.00 1.00 1.00 1.00 1.00 Initial Bse: 9 15 0 0 15 22 0 0 0 10 0 13 Added Vol: 0 0 0 0 0 0 4 0 14 0 0 0 PasserByVol: 0 0 0 0 0 0 0 0 0 0 0 0 Initial Fut: 9 15 0 0 15 22 4 0 14 10 0 13 User Adj: 1.00 1.00 1.00 1.00 1.00 1.00 1.00 1.00 1.00 1.00 1.00 1.00 PHF Adj: 1.00 1.00 1.00 1.00 1.00 1.00 1.00 1.00 1.00 1.00 1.00 1.00 PHF Volume: 9 15 0 0 15 22 4 0 14 10 0 13 Reduct Vol: 0 0 0 0 0 0 0 0 0 0 0 0 Final Vol.: 9 15 0 0 15 22 4 0 14 10 0 13 Critical Gap Module: Critical Gp: 4.1 xxxx xxxxx xxxxx xxxx xxxxx 7.1 xxxx 6.2 7.1 xxxx 6.2 FollowUpTim: 2.2 xxxx xxxxx xxxxx xxxx xxxxx 3.5 xxxx 3.3 3.5 xxxx 3.3 ------------|---------------||---------------||---------------||---------------| Capacity Module: Cnflict Vol: 37 xxxx xxxxx xxxx xxxx xxxxx 66 xxxx 26 66 xxxx 15 Potent Cap.: 1587 xxxx xxxxx xxxx xxxx xxxxx 933 xxxx 1056 932 xxxx 1070 Move Cap.: 1587 xxxx xxxxx xxxx xxxx xxxxx 918 xxxx 1056 916 xxxx 1070 Volume/Cap: 0.01 xxxx xxxx xxxx xxxx xxxx 0.00 xxxx 0.01 0.01 xxxx 0.01 ------------|---------------||---------------||---------------||---------------| Level Of Service Module: Queue: 0.0 xxxx xxxxx xxxxx xxxx xxxxx xxxxx xxxx xxxxx xxxxx xxxx xxxxx Stopped Del: 7.3 xxxx xxxxx xxxxx xxxx xxxxx xxxxx xxxx xxxxx xxxxx xxxx xxxxx LOS by Move: A * * * * * * * * * * * Movement: LT - LTR - RT LT - LTR - RT LT - LTR - RT LT - LTR - RT Shared Cap.: xxxx xxxx xxxxx xxxx xxxx xxxxx xxxx 1021 xxxxx xxxx 997 xxxxx SharedQueue: 0.0 xxxx xxxxx xxxxx xxxx xxxxx xxxxx 0.1 xxxxx xxxxx 0.1 xxxxx Shrd StpDel: 7.3 xxxx xxxxx xxxxx xxxx xxxxx xxxxx 8.6 xxxxx xxxxx 8.7 xxxxx Shared LOS: A * * * * * * A * * A * ApproachDel: xxxxxx xxxxxx 8.6 8.7 ApproachLOS: * * A A Traffix 7.6.0115 (c) 2004 Dowling Assoc. Licensed to TJKM, PLEASANTON, CA

Future+Project_PM Thu Dec 2, 2004 09:50:16 Page 4-1 -------------------------------------------------------------------------------- -------------------------------------------------------------------------------- Level Of Service Computation Report 2000 HCM Unsignalized Method (Future Volume Alternative) ******************************************************************************** Intersection #3 State Route 1/Annapolis Road ******************************************************************************** Average Delay (sec/veh): 7.6 Worst Case Level Of Service: B[ 10.2] ******************************************************************************** Approach: North Bound South Bound East Bound West Bound Movement: L - T - R L - T - R L - T - R L - T - R ------------|---------------||---------------||---------------||---------------| Control: Stop Sign Stop Sign Uncontrolled Uncontrolled Rights: Include Include Include Include Lanes: 0 0 0 1 0 0 0 1! 0 0 0 0 0 0 0 0 0 1! 0 0 ------------|---------------||---------------||---------------||---------------| Volume Module: Future+Project_PM Base Vol: 0 56 27 53 46 0 0 0 0 13 0 80 Growth Adj: 1.00 1.00 1.00 1.00 1.00 1.00 1.00 1.00 1.00 1.00 1.00 1.00 Initial Bse: 0 56 27 53 46 0 0 0 0 13 0 80 Added Vol: 0 0 0 22 0 36 0 0 0 0 2 0 PasserByVol: 0 0 0 0 0 0 0 0 0 0 0 0 Initial Fut: 0 56 27 75 46 36 0 0 0 13 2 80 User Adj: 1.00 1.00 1.00 1.00 1.00 1.00 1.00 1.00 1.00 1.00 1.00 1.00 PHF Adj: 1.00 1.00 1.00 1.00 1.00 1.00 1.00 1.00 1.00 1.00 1.00 1.00 PHF Volume: 0 56 27 75 46 36 0 0 0 13 2 80 Reduct Vol: 0 0 0 0 0 0 0 0 0 0 0 0 Final Vol.: 0 56 27 75 46 36 0 0 0 13 2 80 Critical Gap Module: Critical Gp:xxxxx 6.5 6.2 7.1 6.5 6.2 xxxxx xxxx xxxxx 4.1 xxxx xxxxx FollowUpTim:xxxxx 4.0 3.3 3.5 4.0 3.3 xxxxx xxxx xxxxx 2.2 xxxx xxxxx ------------|---------------||---------------||---------------||---------------| Capacity Module: Cnflict Vol: xxxx 108 0 96 68 42 xxxx xxxx xxxxx 0 xxxx xxxxx Potent Cap.: xxxx 786 900 891 826 1034 xxxx xxxx xxxxx 900 xxxx xxxxx Move Cap.: xxxx 774 900 808 814 1034 xxxx xxxx xxxxx 900 xxxx xxxxx Volume/Cap: xxxx 0.07 0.03 0.09 0.06 0.03 xxxx xxxx xxxx 0.01 xxxx xxxx ------------|---------------||---------------||---------------||---------------| Level Of Service Module: Queue: xxxxx xxxx xxxxx xxxxx xxxx xxxxx xxxxx xxxx xxxxx 0.0 xxxx xxxxx Stopped Del:xxxxx xxxx xxxxx xxxxx xxxx xxxxx xxxxx xxxx xxxxx 9.1 xxxx xxxxx LOS by Move: * * * * * * * * * A * * Movement: LT - LTR - RT LT - LTR - RT LT - LTR - RT LT - LTR - RT Shared Cap.: xxxx xxxx 811 xxxx 853 xxxxx xxxx xxxx xxxxx xxxx xxxx xxxxx SharedQueue:xxxxx xxxx 0.3 xxxxx 0.7 xxxxx xxxxx xxxx xxxxx xxxxx xxxx xxxxx Shrd StpDel:xxxxx xxxx 9.9 xxxxx 10.2 xxxxx xxxxx xxxx xxxxx xxxxx xxxx xxxxx Shared LOS: * * A * B * * * * * * * ApproachDel: 9.9 10.2 xxxxxx xxxxxx ApproachLOS: A B * * Traffix 7.6.0115 (c) 2004 Dowling Assoc. Licensed to TJKM, PLEASANTON, CA
APPENDIX G – TWO-WAY TWO-LANE HIGHWAY SEGMENT
WORKSHEETS, FUTURE PLUS PROJECT CONDITIONS
• STATE ROUTE 1 • ANNAPOLIS ROAD • STEWARTS POINT ROAD

HCS2000: Two-Lane Highways Release 4.1d ___________________Two-Way Two-Lane Highway Segment Analysis__________________ Analyst Andrew Kluter Agency/Co. TJKM Transport. Consultants Date Performed 12/1/2004 Analysis Time Period AM Peak Highway State Route 1 From/To Stewarts Point - Annapolis Rd Jurisdiction Sonoma County Analysis Year 2025-Future+Project Description 117-075 - Artesa Winery - Sonoma County ___________________________________Input Data_________________________________ Highway class Class 2 Shoulder width 2.0 ft Peak-hour factor, PHF 0.85 Lane width 10.0 ft % Trucks and buses 5 % Segment length 4.0 mi % Recreational vehicles 7 % Terrain type Rolling % No-passing zones 40 % Grade: Length mi Access points/mi 10 /mi Up/down % Two-way hourly volume, V 330 veh/h Directional split 60 / 40 % ____________________________Average Travel Speed______________________________ Grade adjustment factor, fG 0.71 PCE for trucks, ET 2.5 PCE for RVs, ER 1.0* Heavy-vehicle adjustment factor, 0.930 Two-way flow rate,(note-1) vp 588 pc/h Highest directional split proportion (note-2) 353 pc/h Free-Flow Speed from Field Measurement: Field measured speed, SFM - mi/h Observed volume, Vf - veh/h Estimated Free-Flow Speed: Base free-flow speed, BFFS 50.0 mi/h Adj. for lane and shoulder width, fLS 3.7 mi/h Adj. for access points, fA 2.5 mi/h Free-flow speed, FFS 43.8 mi/h Adjustment for no-passing zones, fnp 2.7* mi/h Average travel speed, ATS 36.5 mi/h

__________________________Percent Time-Spent-Following________________________ Grade adjustment factor, fG 0.77 PCE for trucks, ET 1.8 PCE for RVs, ER 1.0 Heavy-vehicle adjustment factor, fHV 0.962 Two-way flow rate,(note-1) vp 524 pc/h Highest directional split proportion (note-2) 314 Base percent time-spent-following, BPTSF 36.9 % Adj.for directional distribution and no-passing zones, fd/np 15.6 Percent time-spent-following, PTSF 52.5 % ________________Level of Service and Other Performance Measures_______________ Level of service, LOS B Volume to capacity ratio, v/c 0.18 Peak 15-min vehicle-miles of travel, VMT15 388 veh-mi Peak-hour vehicle-miles of travel, VMT60 1320 veh-mi Peak 15-min total travel time, TT15 10.6 veh-h ______________________________________________________________________________ Notes: 1. If vp >= 3200 pc/h, terminate analysis-the LOS is F. 2. If highest directional split vp >= 1700 pc/h, terminate analysis-the LOS is F. * These items have been entered or edited to override calculated value

HCS2000: Two-Lane Highways Release 4.1d ___________________Two-Way Two-Lane Highway Segment Analysis__________________ Analyst Andrew Kluter Agency/Co. TJKM Transport. Consultants Date Performed 12/1/2004 Analysis Time Period PM Peak Highway Annapolis Road From/To SR 1 - Stewarts Point Road Jurisdiction Sonoma County Analysis Year 2025-Future+Project Description 117-075 - Artesa Winery - Sonoma County ___________________________________Input Data_________________________________ Highway class Class 2 Shoulder width 2.0 ft Peak-hour factor, PHF 0.85 Lane width 11.0 ft % Trucks and buses 5 % Segment length 8.0 mi % Recreational vehicles 7 % Terrain type Rolling % No-passing zones 40 % Grade: Length mi Access points/mi 10 /mi Up/down % Two-way hourly volume, V 197 veh/h Directional split 52 / 48 % ____________________________Average Travel Speed______________________________ Grade adjustment factor, fG 0.71 PCE for trucks, ET 2.5 PCE for RVs, ER 1.1 Heavy-vehicle adjustment factor, 0.924 Two-way flow rate,(note-1) vp 353 pc/h Highest directional split proportion (note-2) 184 pc/h Free-Flow Speed from Field Measurement: Field measured speed, SFM - mi/h Observed volume, Vf - veh/h Estimated Free-Flow Speed: Base free-flow speed, BFFS 50.0 mi/h Adj. for lane and shoulder width, fLS 3.0* mi/h Adj. for access points, fA 2.5 mi/h Free-flow speed, FFS 44.5 mi/h Adjustment for no-passing zones, fnp 1.4* mi/h Average travel speed, ATS 40.4 mi/h

__________________________Percent Time-Spent-Following________________________ Grade adjustment factor, fG 0.77 PCE for trucks, ET 1.8 PCE for RVs, ER 1.0 Heavy-vehicle adjustment factor, fHV 0.962 Two-way flow rate,(note-1) vp 313 pc/h Highest directional split proportion (note-2) 163 Base percent time-spent-following, BPTSF 24.1 % Adj.for directional distribution and no-passing zones, fd/np 17.9 Percent time-spent-following, PTSF 42.0 % ________________Level of Service and Other Performance Measures_______________ Level of service, LOS B Volume to capacity ratio, v/c 0.11 Peak 15-min vehicle-miles of travel, VMT15 464 veh-mi Peak-hour vehicle-miles of travel, VMT60 1576 veh-mi Peak 15-min total travel time, TT15 11.5 veh-h ______________________________________________________________________________ Notes: 1. If vp >= 3200 pc/h, terminate analysis-the LOS is F. 2. If highest directional split vp >= 1700 pc/h, terminate analysis-the LOS is F. * These items have been entered or edited to override calculated value

HCS2000: Two-Lane Highways Release 4.1d ___________________Two-Way Two-Lane Highway Segment Analysis__________________ Analyst Andrew Kluter Agency/Co. TJKM Transport. Consultants Date Performed 12/1/2004 Analysis Time Period AM Peak Highway Stewarts Point Road From/To SR 1 - Annapolis Road Jurisdiction Sonoma County Analysis Year 2025-Future+Project Description 117-075 - Artesa Winery - Sonoma County ___________________________________Input Data_________________________________ Highway class Class 2 Shoulder width 3.0 ft Peak-hour factor, PHF 0.85 Lane width 11.0 ft % Trucks and buses 5 % Segment length 4.0 mi % Recreational vehicles 7 % Terrain type Rolling % No-passing zones 60 % Grade: Length mi Access points/mi 10 /mi Up/down % Two-way hourly volume, V 114 veh/h Directional split 54 / 46 % ____________________________Average Travel Speed______________________________ Grade adjustment factor, fG 0.71 PCE for trucks, ET 2.5 PCE for RVs, ER 1.1 Heavy-vehicle adjustment factor, 0.924 Two-way flow rate,(note-1) vp 204 pc/h Highest directional split proportion (note-2) 110 pc/h Free-Flow Speed from Field Measurement: Field measured speed, SFM - mi/h Observed volume, Vf - veh/h Estimated Free-Flow Speed: Base free-flow speed, BFFS 45.0 mi/h Adj. for lane and shoulder width, fLS 3.0* mi/h Adj. for access points, fA 2.5 mi/h Free-flow speed, FFS 39.5 mi/h Adjustment for no-passing zones, fnp 1.3* mi/h Average travel speed, ATS 36.6 mi/h

__________________________Percent Time-Spent-Following________________________ Grade adjustment factor, fG 0.77 PCE for trucks, ET 1.8 PCE for RVs, ER 1.0 Heavy-vehicle adjustment factor, fHV 0.962 Two-way flow rate,(note-1) vp 181 pc/h Highest directional split proportion (note-2) 98 Base percent time-spent-following, BPTSF 14.7 % Adj.for directional distribution and no-passing zones, fd/np 21.0 Percent time-spent-following, PTSF 35.8 % ________________Level of Service and Other Performance Measures_______________ Level of service, LOS A Volume to capacity ratio, v/c 0.06 Peak 15-min vehicle-miles of travel, VMT15 134 veh-mi Peak-hour vehicle-miles of travel, VMT60 456 veh-mi Peak 15-min total travel time, TT15 3.7 veh-h ______________________________________________________________________________ Notes: 1. If vp >= 3200 pc/h, terminate analysis-the LOS is F. 2. If highest directional split vp >= 1700 pc/h, terminate analysis-the LOS is F. * These items have been entered or edited to override calculated value