traffic maps management
DESCRIPTION
Traffic maps management using planning tool.TRANSCRIPT

© Forsk 2014 Slide 1 Confidential – Do not share without prior permission
Traffic Maps Management Atoll 3.2.1

1. Introduction
2. User Profile Traffic Maps
3. Sector Traffic Maps
4. User Density Traffic Maps
5. Subscriber Database
© Forsk 2014 Slide 2 Confidential – Do not share without prior permission
Traffic Maps Management
Introduction
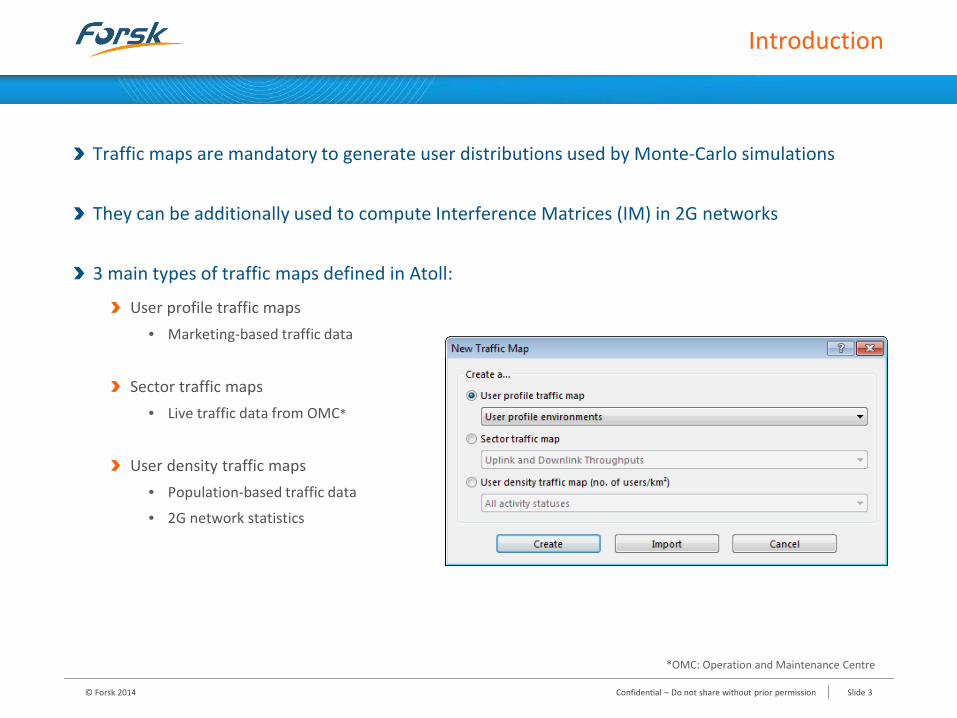
Traffic maps are mandatory to generate user distributions used by Monte-Carlo simulations
They can be additionally used to compute Interference Matrices (IM) in 2G networks
3 main types of traffic maps defined in Atoll:
User profile traffic maps • Marketing-based traffic data
Sector traffic maps • Live traffic data from OMC*
User density traffic maps • Population-based traffic data
• 2G network statistics
© Forsk 2014 Slide 3 Confidential – Do not share without prior permission
*OMC: Operation and Maintenance Centre
1. Introduction
2. User Profile Traffic Maps
3. Sector Traffic Maps
4. User Density Traffic Maps
5. Subscriber Database
© Forsk 2014 Slide 4 Confidential – Do not share without prior permission
Traffic Maps Management
User Profile Traffic Maps
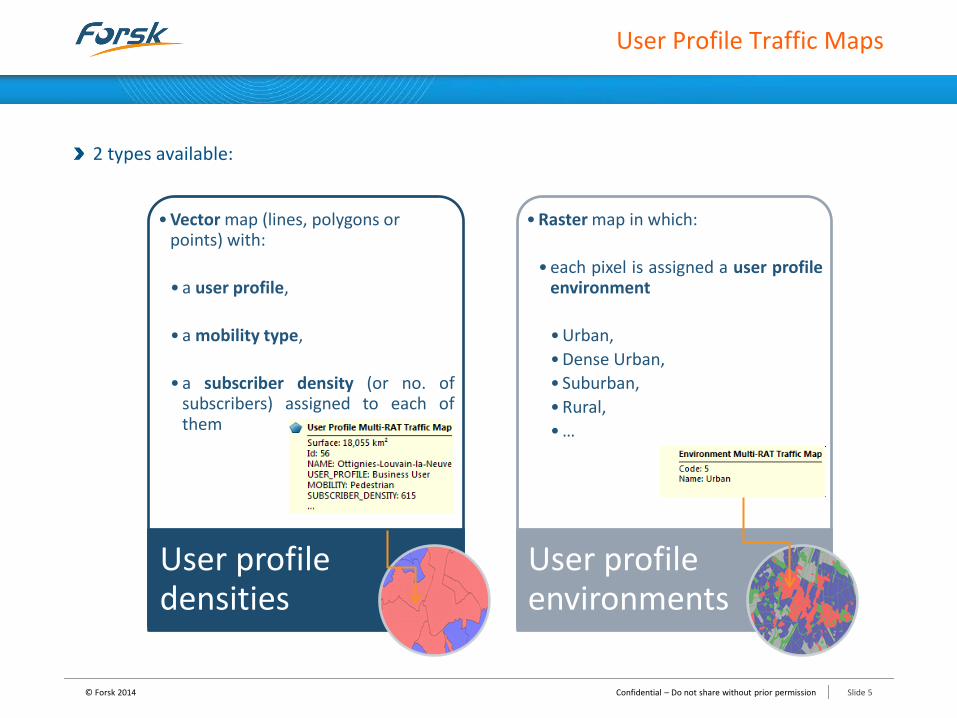
2 types available:
© Forsk 2014 Slide 5 Confidential – Do not share without prior permission
•Vector map (lines, polygons or points) with: •a user profile,
•a mobility type,
•a subscriber density (or no. of
subscribers) assigned to each of them
User profile densities
•Raster map in which: •each pixel is assigned a user profile
environment •Urban, •Dense Urban, • Suburban, •Rural, •…
User profile environments

User Profile Traffic Maps
Requirements (1/2)
Define User Profiles: • Description of the behaviour of different subscriber categories for given services:
• Terminal used
• Average number of calls (Voice) or sessions (Data) /hour
• Average duration (for Voice services, in seconds)
• UL & DL data volume (for Data services, in Kbytes)
• “Standard User” and “Business User” defined by default in Atoll
© Forsk 2014 Slide 6 Confidential – Do not share without prior permission

User Profile Traffic Maps
Requirements (2/2)
Define Environments: • Economic and social concept used to describe subscriber spatial distribution on
the map
• Each user profile is associated with:
• A mobility type
• A density (number of users with the same profile per km²)
© Forsk 2014 Slide 7 Confidential – Do not share without prior permission
List of user profiles with associated mobility and density
Clutter weighting and indoor ratio per clutter class to get an accurate user distribution
User Profile Traffic Maps
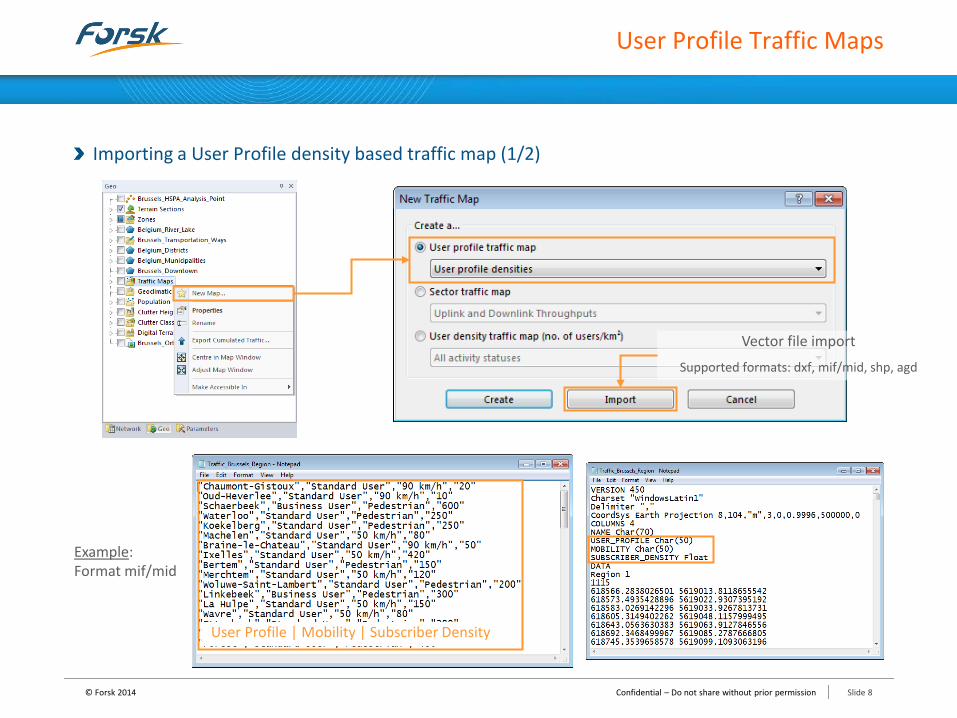
Importing a User Profile density based traffic map (1/2)
© Forsk 2014 Slide 8 Confidential – Do not share without prior permission
Vector file import
Supported formats: dxf, mif/mid, shp, agd
Example: Format mif/mid
User Profile | Mobility | Subscriber Density

User Profile Traffic Maps
Importing a User Profile density based traffic map (2/2)
You must specify the source of traffic information: • Attributes of polygons/lines/points described in the imported file
• User-definable global information
© Forsk 2014 Slide 9 Confidential – Do not share without prior permission
Option “by value”: selection of a user profile, a mobility, and specification of a density/no. of subscribers Global information for all polygons or lines (here Mobility = 50km/h for all polygons)
Option “by field”: selection of the corresponding field in the imported file, for each data (user profile, mobility, density) Detailed information per polygon or line
Possible clutter weighting and indoor/outdoor ratio per clutter class in order to get a more accurate user distribution

User Profile Traffic Maps
Same management features as vectors
Attributes listed in a manageable table
Sort and filter criteria on vector display
Generic display dialog
Access to any single vector property
Possibility to export traffic map • Mif/mid, shp, agd formats
© Forsk 2014 Slide 10 Confidential – Do not share without prior permission
User Profile Traffic Maps
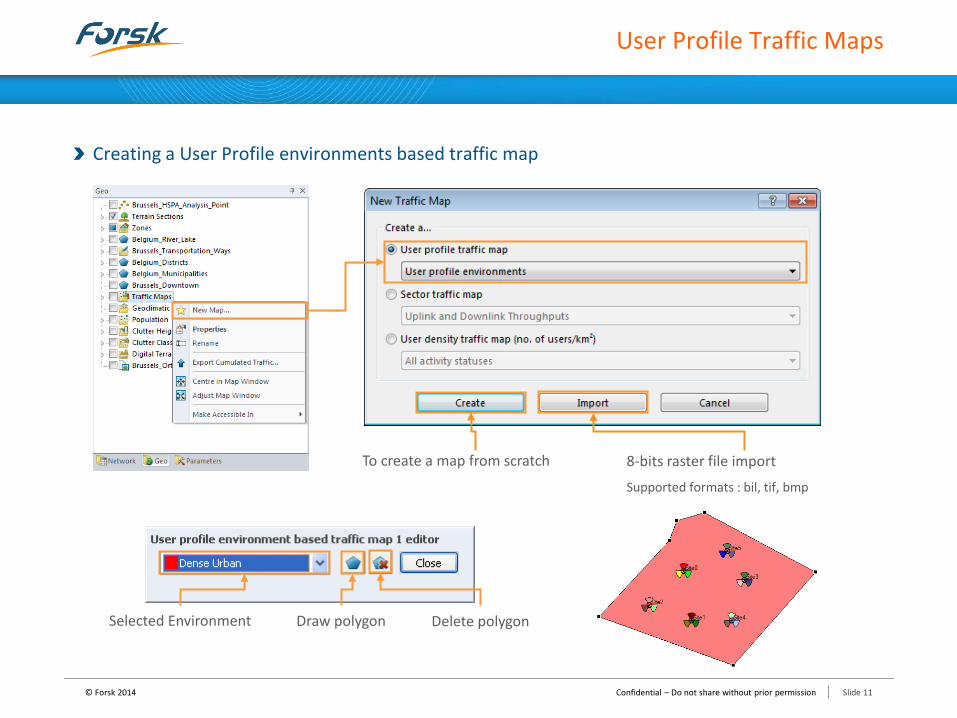
Creating a User Profile environments based traffic map
© Forsk 2014 Slide 11 Confidential – Do not share without prior permission
8-bits raster file import
Supported formats : bil, tif, bmp
To create a map from scratch
Draw polygon Delete polygon Selected Environment
User Profile Traffic Maps
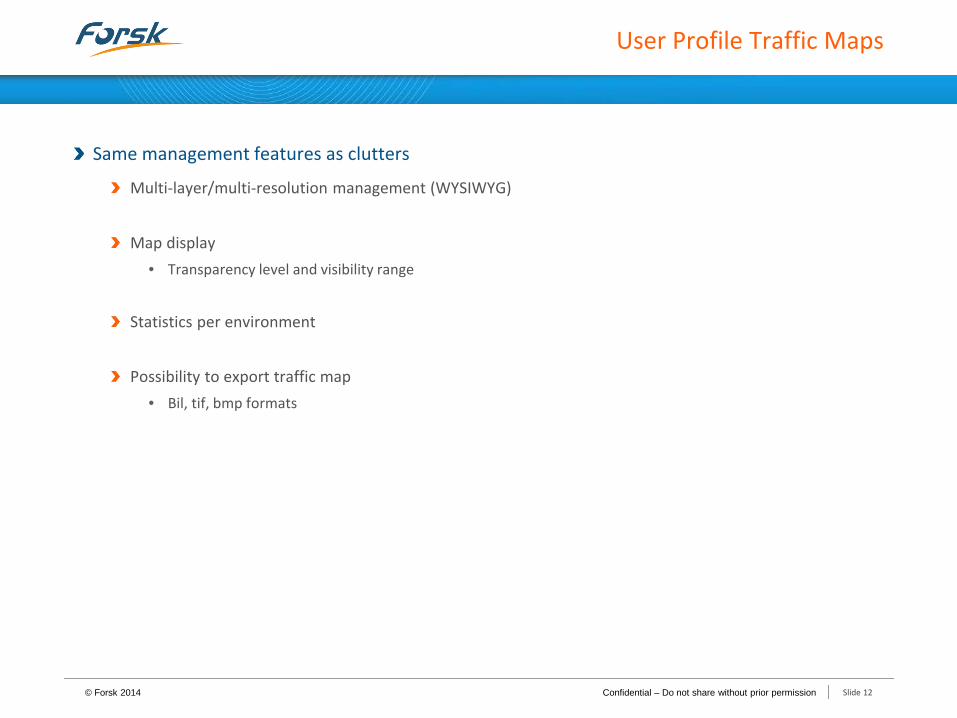
Same management features as clutters
Multi-layer/multi-resolution management (WYSIWYG)
Map display • Transparency level and visibility range
Statistics per environment
Possibility to export traffic map • Bil, tif, bmp formats
© Forsk 2014 Slide 12 Confidential – Do not share without prior permission

1. Introduction
2. User Profile Traffic Maps
3. Sector Traffic Maps
4. User Density Traffic Maps
5. Subscriber Database
© Forsk 2014 Slide 13 Confidential – Do not share without prior permission
Traffic Maps Management
Sector Traffic Maps
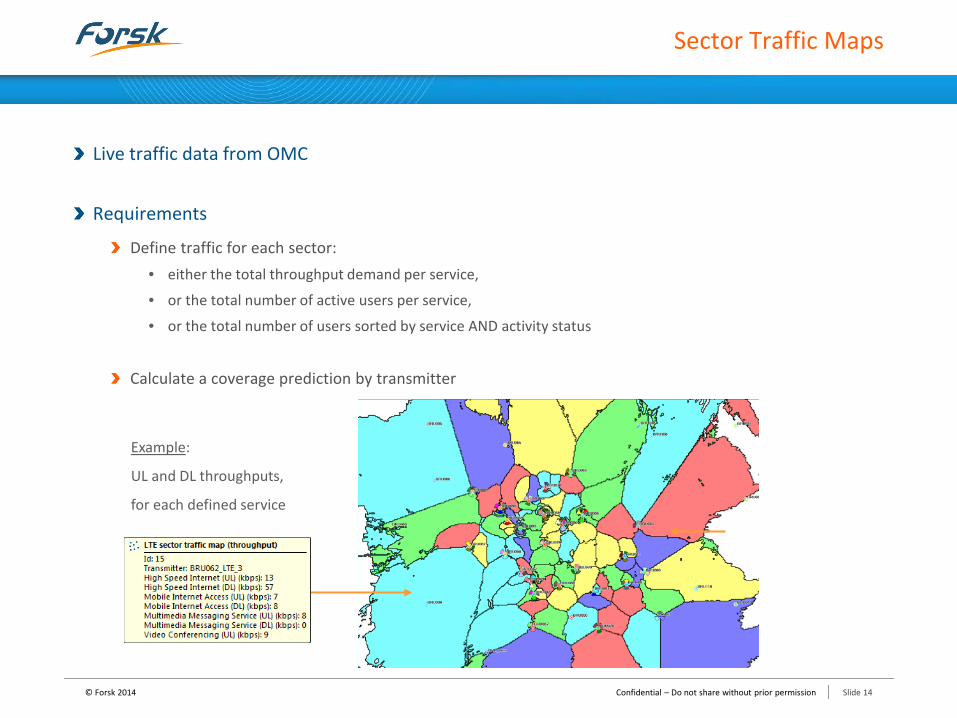
Live traffic data from OMC
Requirements
Define traffic for each sector: • either the total throughput demand per service,
• or the total number of active users per service,
• or the total number of users sorted by service AND activity status
Calculate a coverage prediction by transmitter
© Forsk 2014 Slide 14 Confidential – Do not share without prior permission
Example:
UL and DL throughputs,
for each defined service
Sector Traffic Maps
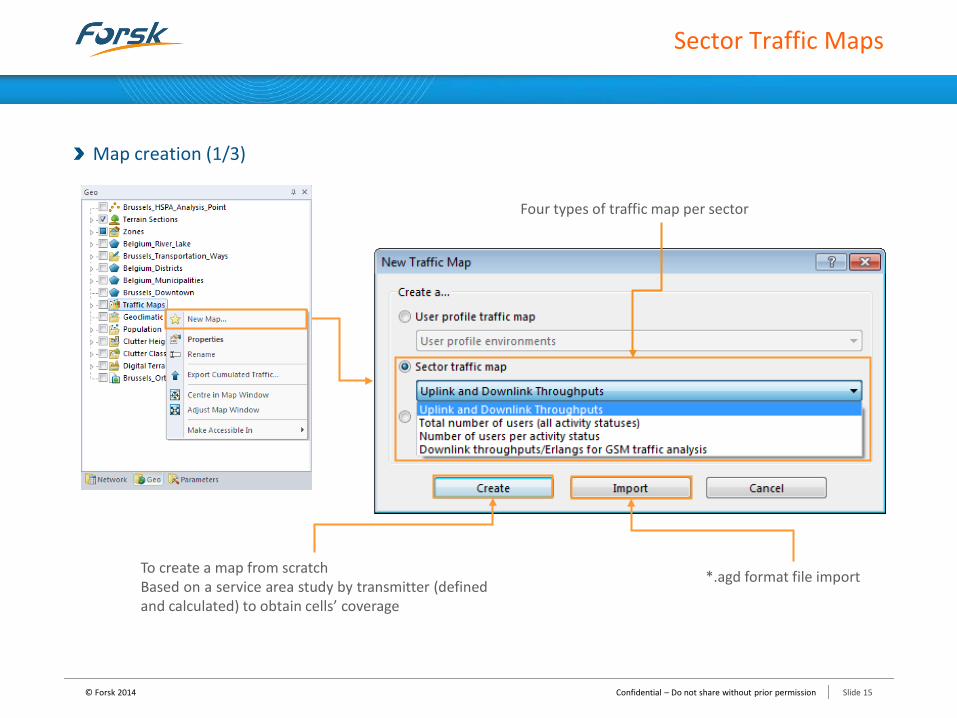
Map creation (1/3)
© Forsk 2014 Slide 15 Confidential – Do not share without prior permission
To create a map from scratch Based on a service area study by transmitter (defined and calculated) to obtain cells’ coverage
Four types of traffic map per sector
*.agd format file import

Sector Traffic Maps
Map creation (2/3)
© Forsk 2014 Slide 16 Confidential – Do not share without prior permission
Defined Transmitters List of all defined services
UL and DL throughputs (or number of users) for each sector
Coverage by Transmitter (Mandatory)

Sector Traffic Maps
Map creation (3/3)
© Forsk 2014 Slide 17 Confidential – Do not share without prior permission
Distribution of Mobility type used in the map
Distribution of Terminal used in the map
Possible clutter weighting and indoor/outdoor ratio per clutter class in order to get a more accurate user distribution
Map type selection: • Throughputs, • Number of active users, • Number of users per activity status
Sector Traffic Maps
Management features
Traffic description in a manageable table
Sort and filter criteria on display
Generic display dialog
Possibility to export traffic map • Agd format
© Forsk 2014 Slide 18 Confidential – Do not share without prior permission

1. Introduction
2. User Profile Traffic Maps
3. Sector Traffic Maps
4. User Density Traffic Maps
5. Subscriber Database
© Forsk 2014 Slide 19 Confidential – Do not share without prior permission
Traffic Maps Management

User Density Traffic Maps
Based on population statistics (density of inhabitants, or 2G traffic statistics)
Inputs
Density of users (number of user/km²) per pixel • Can be deduced from population maps and sector traffic maps
Users can be inactive, active UL, active DL or active UL+DL • One map per activity status
© Forsk 2014 Slide 20 Confidential – Do not share without prior permission
Density of active users (number of users/km²) on each pixel
User Density Traffic Maps
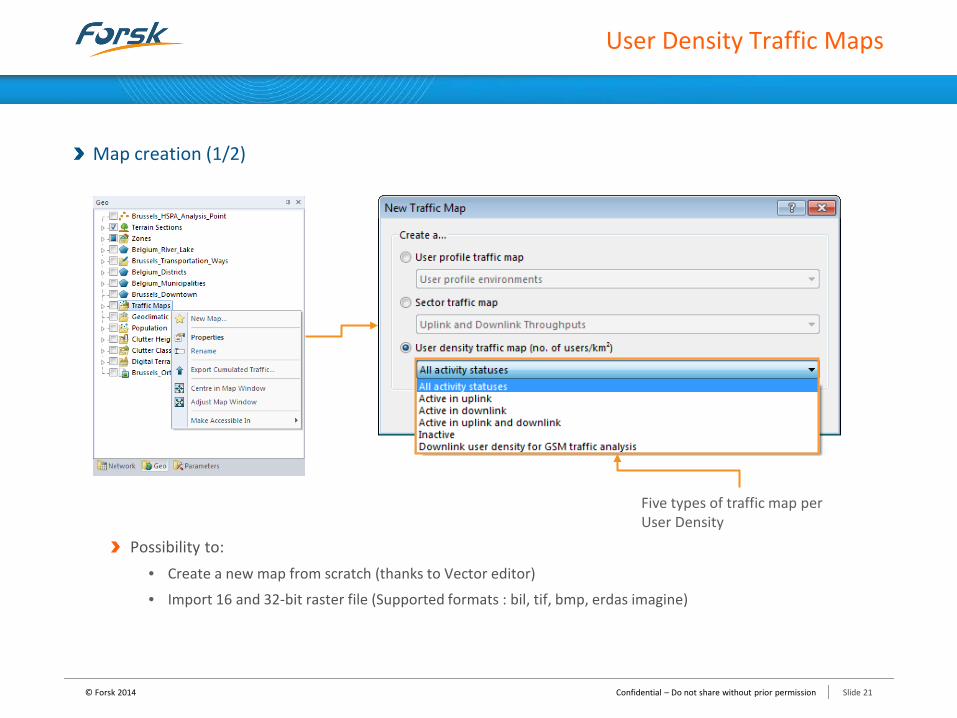
Map creation (1/2)
Possibility to: • Create a new map from scratch (thanks to Vector editor)
• Import 16 and 32-bit raster file (Supported formats : bil, tif, bmp, erdas imagine)
© Forsk 2014 Slide 21 Confidential – Do not share without prior permission
Five types of traffic map per User Density

User Density Traffic Maps
Map creation (2/2)
© Forsk 2014 Slide 22 Confidential – Do not share without prior permission
Percentage of each Terminal used in the map Percentage of
each Mobility type used in the map
Percentage of each Service used in the map
Percentage of indoor users per clutter class during the Monte-Carlo distribution
Activity status to be considered in the simulation

User Density Traffic Maps
Management features of user density based traffic maps
Generic display dialog
Statistics
Possibility to export traffic map • Bil, bmp formats
© Forsk 2014 Slide 23 Confidential – Do not share without prior permission

1. Introduction
2. User Profile Traffic Maps
3. Sector Traffic Maps
4. User Density Traffic Maps
5. Subscriber Database
© Forsk 2014 Slide 24 Confidential – Do not share without prior permission
Traffic Maps Management

Subscriber Database
Basically used to model fixed user distributions in a network
Rely on Subscriber Lists in Atoll, managed from the Network tab
Supported by the LTE, Wi-Fi and WiMAX modules
Importing Subscriber Lists
Supported formats: .txt and .csv
© Forsk 2014 Slide 25 Confidential – Do not share without prior permission
Example of a Subscriber List:
Subscriber Database
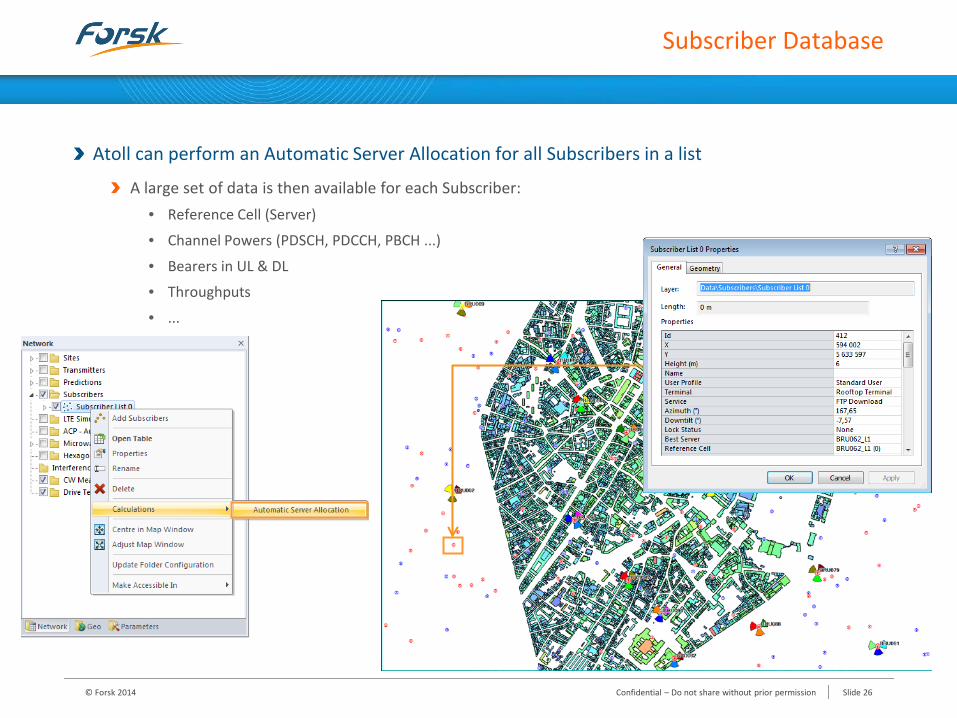
Atoll can perform an Automatic Server Allocation for all Subscribers in a list
A large set of data is then available for each Subscriber: • Reference Cell (Server)
• Channel Powers (PDSCH, PDCCH, PBCH ...)
• Bearers in UL & DL
• Throughputs
• ...
© Forsk 2014 Slide 26 Confidential – Do not share without prior permission

© Forsk 2014 Slide 27 Confidential – Do not share without prior permission
Thank you