trai audit wireless report-assam circle - jfm quarter, 2015
TRANSCRIPT

TRAI Audit Wireless Report-Assam Circle JFM Quarter-2015
1
EAST
ZONE TRAI AUDIT WIRELESS REPORT-ASSAM
CIRCLE - JFM QUARTER, 2015

TRAI Audit Wireless Report-Assam Circle JFM Quarter-2015
2
1 TABLE OF CONTENTS
2 Introduction .................................................................................................................................................. 6
2.1 About TRAI .......................................................................................................................................... 6
2.2 Objectives ............................................................................................................................................ 6
2.3 Coverage ............................................................................................................................................... 7
2.4 Framework Used ................................................................................................................................. 7
2.4.1 PMR Reports ................................................................................................................................... 8
2.4.2 Live Calling ..................................................................................................................................... 17
2.4.3 Drive Test ...................................................................................................................................... 20
2.5 Operators Covered ............................................................................................................................ 23
2.6 Colour Codes to read the report ...................................................................................................... 23
3 Executive Summary .................................................................................................................................... 24
3.1 PMR Data – 3 Months- Consolidated .............................................................................................. 24
3.1.1 PMR Data - January ...................................................................................................................... 26
3.1.2 PMR Data – February ................................................................................................................... 26
3.1.3 PMR Data - March ........................................................................................................................ 27
3.2 3 Day Data – Consolidated ............................................................................................................... 27
3.2.1 3 Day Data - January ..................................................................................................................... 29
3.2.2 3 Day Data – February .................................................................................................................. 29
3.2.3 3 Day Data - March ....................................................................................................................... 30
3.3 Live Calling Data - Consolidated ..................................................................................................... 30
3.4 Billing and customer care - Consolidated ...................................................................................... 32
3.5 Inter Operator Call Assessment - Consolidated ............................................................................ 34
4 Critical Findings.......................................................................................................................................... 35
5 Parameter Description & Detailed Findings - Comparison Between PMR Data, 3 Day Live Data and Live Calling Data ................................................................................................................................................ 36
5.1 BTS Accumulated Downtime ........................................................................................................... 36
5.1.1 Parameter Description ................................................................................................................. 36
5.1.2 Key Findings - Consolidated ........................................................................................................ 37
5.2 Worst Affected BTS due to downtime ............................................................................................ 38

TRAI Audit Wireless Report-Assam Circle JFM Quarter-2015
3
5.2.1 Parameter Description ................................................................................................................. 39
5.2.2 Key Findings – Consolidated ....................................................................................................... 39
5.3 Call Set Up Success Rate................................................................................................................... 42
5.3.1 Parameter Description ................................................................................................................. 42
5.3.2 Key Findings - Consolidated ........................................................................................................ 43
5.4 Network Channel Congestion- Paging Channel /TCH Congestion/POI .................................... 45
5.4.1 Parameter Description ................................................................................................................. 45
5.4.2 Key Findings - SDCCH/Paging Channel Congestion (Consolidated) ..................................... 46
5.4.3 Key Findings – TCH Congestion (Consolidated)....................................................................... 48
5.4.4 Key Findings – POI Congestion (Consolidated) – Average of 3 months ................................. 50
5.5 Call Drop Rate ................................................................................................................................... 55
5.5.1 Parameter Description ................................................................................................................. 55
5.5.2 Key Findings - Consolidated ........................................................................................................ 55
5.6 Cells having greater than 3% TCH drop ......................................................................................... 57
5.6.1 Parameter Description ................................................................................................................. 57
5.6.2 Key Findings - Consolidated ........................................................................................................ 58
5.7 Voice Quality ..................................................................................................................................... 60
5.7.1 Parameter Description ................................................................................................................. 60
5.7.2 Key Findings .................................................................................................................................. 60
6 Parameter Description and Detailed Findings – Non-Network Parameters ........................................ 63
6.1 Metering and billing credibility ....................................................................................................... 63
6.1.1 Parameter Description ................................................................................................................. 63
6.1.2 Key Findings – Metering and billing credibility (Postpaid) ..................................................... 64
6.1.3 Key Findings - Metering and billing credibility (Prepaid) ....................................................... 65
6.2 Resolution of Billing/ Charging Complaints .................................................................................. 66
6.2.1 Parameter Description ................................................................................................................. 66
6.2.2 Key Findings - within 4 weeks ..................................................................................................... 67
6.2.3 Key Findings within 6 weeks ....................................................................................................... 67
6.3 Period of Applying Credit/Wavier .................................................................................................. 68
6.3.1 Parameter Description ................................................................................................................. 68

TRAI Audit Wireless Report-Assam Circle JFM Quarter-2015
4
6.3.2 Key Findings .................................................................................................................................. 68
6.4 Call Centre Performance-IVR .......................................................................................................... 69
6.4.1 Parameter Description ................................................................................................................. 69
6.4.2 Key Findings .................................................................................................................................. 69
6.5 Call Centre Performance-Voice to Voice ........................................................................................ 70
6.5.1 Parameter Description ................................................................................................................. 70
6.5.2 Key Findings .................................................................................................................................. 70
6.6 Termination/Closure of Service ........................................................................................................ 71
6.6.1 Parameter Description .................................................................................................................. 71
6.6.2 Key Findings .................................................................................................................................. 72
6.7 Refund of Deposits After closure ..................................................................................................... 72
6.7.1 Parameter Description ................................................................................................................. 72
6.7.2 Key Findings .................................................................................................................................. 73
7 Detailed Findings - Drive Test Data ......................................................................................................... 74
7.1 Operator Assisted Drive Test ........................................................................................................... 74
7.1.1 January - DIBRUGARH SSA ......................................................................................................... 75
7.1.2 February – KAMRUP SSA ............................................................................................................ 83
7.1.3 March – SILCHAR SSA ................................................................................................................. 92
8 Annexure - Consolidated .......................................................................................................................... 101
8.1 Network Availability ........................................................................................................................ 101
8.2 Connection Establishment (Accessibility) .................................................................................... 102
8.3 Connection Maintenance (Retainability) ......................................................................................104
8.4 Voice quality .................................................................................................................................... 106
8.5 POI Congestion ................................................................................................................................ 107
8.6 Total call made during the drive test-voice quality ..................................................................... 108
8.7 Metering and Billing credibility ..................................................................................................... 109
8.8 Customer Care .................................................................................................................................. 114
8.9 Termination / closure of service ...................................................................................................... 117
8.10 Time taken for refund of deposits after closure ............................................................................. 117
8.11 Additional Network Related parameters ....................................................................................... 118

TRAI Audit Wireless Report-Assam Circle JFM Quarter-2015
5
8.12 Live Calling Results for Resolution of Service Requests .............................................................. 118
8.13 Live Calling Results for Level 1 Services ......................................................................................... 119
8.14 Level 1 Service calls made ................................................................................................................ 120
8.15 Counter Details ................................................................................................................................ 127
8.15.1 Ericsson .................................................................................................................................... 129
8.15.2 NSN (Nokia Siemens Networks) ............................................................................................. 131
9 Annexure – January ................................................................................................................................... 133
10 Annexure – February ................................................................................................................................. 138
11 Annexure – March ..................................................................................................................................... 143
12 Abbreviations .............................................................................................................................................148

TRAI Audit Wireless Report-Assam Circle JFM Quarter-2015
6
2 INTRODUCTION
2.1 ABOUT TRAI
TRAI's mission is to create and nurture conditions for growth of telecommunications in the country in a
manner and at a pace that will enable India to play a leading role in the emerging global information
society. One of the main objectives of TRAI is to provide a fair and transparent policy environment
which promotes a level playing field and facilitates fair competition.
In pursuance of above objective, TRAI has been issuing regulations, order and directives to deal with
the issues or complaints raised by the operators as well as the consumers. These regulations, order and
directives have helped to nurture the growth of multi operator multi service - an open competitive
market from a government owned monopoly. Also, the directions, orders and regulations issued cover a
wide range of subjects including tariff, interconnection and quality of service as well as governance of
the Authority.
TRAI initiated a regulation - The Standard of Quality of Service of Basic Telephone Service (Wireline)
and Cellular Mobile Telephone Service regulations, 2009 (7 of 2009) dated March 20, 2009 and Quality
of Service of Broadband Service Regulations, 2006 (11 of 2006) dated January 6, 2006 that provide the
benchmarks for the parameters on customer perception of service to be achieved by service provider.
In order to assess the above regulations, TRAI has commissioned a third party agency to conduct the
audit of the service providers and check the performance of the operators on the various benchmarks
set by Telecom Regulatory Authority of India (TRAI).
2.2 OBJECTIVES
The primary objective of the Audit module is to
Audit and Assess the Quality of Services being rendered by Basic (Wireline), Cellular Mobile
(Wireless), and Broadband service against the parameters notified by TRAI. (The parameters of
Quality of Services (QoS) have been specified by in the respective regulations published by
TRAI).
This report covers the audit results of the audit conducted for Cellular Mobile (Wireless)
services in Assam Circle.

TRAI Audit Wireless Report-Assam Circle JFM Quarter-2015
7
2.3 COVERAGE
The audit was conducted in Assam circle covering all the SSAs (Secondary Switching Areas).
Image Source: BSNL website
2.4 FRAMEWORK USED
Let’s discuss each of the activity in detail and the methodology adopted for each of the module.
Audit Actvities
PMR Reports
Monthly PMR
3 Day Live Data
Customer Service
Drive Test
Operator Assisted
Independent
Live Calling
Billing Complaints
Service Requests
Level 1 Service
Customer Care
Inter Operator call

TRAI Audit Wireless Report-Assam Circle JFM Quarter-2015
8
2.4.1 PMR REPORTS
2.4.1.1 SIGNIFICANCE AND METHODOLOGY
PMR or Performance Monitoring Reports are generated to assess the various Quality of Service
parameters involved in the mobile telephony service, which indicate the overall health of service for an
operator.
The PMR report for network parameters is taken for each month of the audit quarter and is generally
extracted and verified in the first week of the subsequent month of the audit month. For example,
February 2015 audit data was collected in the month of March 2015.
The PMR report for customer service parameters is extracted from Customer Service Center and verified
once every quarter in the subsequent month of the last month of the quarter. For example, data for
quarter ending Mar 2015 (JFM’15) was collected in the month of Apr 2015.
The raw data is extracted from operator’s systems to create PMR in the following three formats.
Monthly PMR (Network Parameters)
3 Day Live Measurement Data (Network Parameters)
Customer Service Data
Let us understand these formats in detail.
The newly created PMR reports are then taken in hard copy, duly signed by the competent authority of operators. IMRB auditors also sign the same report.
All the calculations are done by IMRB auditors to generate a new PMR report from that raw data.
During TRAI audit, raw data is extracted from the operator’s server/ NOC/ exchange/ OMC/ customer service center/ billing center etc. by the IMRB auditor with assistance
from the operator personnel in order to generate PMR reports (Network/ Billing /Customer Service etc).
The IMRB auditors inform the operators about the audit schedule in advance. As per schedule, the auditors visit the operator premises to conduct the audit.

TRAI Audit Wireless Report-Assam Circle JFM Quarter-2015
9
2.4.1.2 MONTHLY PMR
This involved calculation of the various Quality of Service network parameters through monthly
Performance Monitoring Reports (PMR). The PMR reports were generated from the data extracted from
operator’s systems in presence of IMRB representative at the operator’s premises for the month of Oct,
Nov and Dec 2015. The performance of operators on various parameters was assessed against the
benchmarks. Parameters include-
All the parameters have been described in detail along with key findings of the parameters in section 5
of the report. The benchmark values for each parameter have been given in the table below.
• BTS accumulated downtime
• Worst affected BTS due to downtime
Network Availability
• Call Set Up success Rate (CSSR)
Connection Establishment (Accessibility)
• SDCCH/Paging Channel Congestion
• TCH Congestion
• Point of Interconnection
Network Congestion Parameters
• Call Drop rate
• Worst affected cells having more than 3% TCH drop
Connection Maintenance
• % Connections with good voice quality
Voice Quality

TRAI Audit Wireless Report-Assam Circle JFM Quarter-2015
10
2.4.1.3 AUDIT PARAMETERS - NETWORK
Let us now look at the various parameters involved in the audit reports.
Network Related
2.4.1.4 POINT OF DATA EXTRACTION
The data is extracted from a terminal/computer connected to OMCR & OSS on the operator network.

TRAI Audit Wireless Report-Assam Circle JFM Quarter-2015
11
2.4.1.5 STEP BY STEP AUDIT PROCEDURE
The key steps followed for extraction of reports at the operator premises are given below.
Data has been extracted and calculated as per the counter details provided by the operators. The details
of counters have been provided in section 8.15 of the report. The calculation methodology for each
parameter has been stated in the table given below.
The final audit or PMR sheet is signed by the operator person in-charge along with authorized stamp.
IMRB auditors validate the values with raw data and also provide their comments, wherever required.
IMRB auditors then prepare a PMR report from the extracted data with assistance from the operator.
The extracted data is validated and verfied by the IMRB auditors.
IMRB auditors visit the operator's server/exchange/central NOC to extract data from operator's systems. Operator personnel assist the auditor in extraction process.
Audit formats and schedule is shared with the operators in advance. Details include day of the visit and date of 3 day data collection and other requirements.
All the operators operating in the Wireless domain are informed about the Audit. Tender document and latest list of licencees as per TRAI is taken as a reference document for
assimilating the presence of operators.

TRAI Audit Wireless Report-Assam Circle JFM Quarter-2015
12
2.4.1.6 CALCULATION METHODOLOGY – NETWORK PARAMETERS
Parameter Calculation Methodology
BTS Accumulated Downtime
Sum of downtime of BTSs in a month in hours i.e.
total outage time of all BTSs in hours during a month
/ (24 x Number of days in a month x Number of BTSs
in the network in licensed service area) x 100
Worst Affected BTS Due to Downtime
(Number of BTSs having accumulated downtime
greater than 24 hours in a month / Number of BTS in
Licensed Service Area) * 100
Call Setup Success Rate (Calls Established / Total Call Attempts) * 100
SDCCH/ Paging Channel Congestion
SDCCH / TCH Congestion% = [(A1 x C1) + (A2 x C2)
+…….+ (An x Cn)] / (A1 + A2 +…+ An)
Where:
A1 = Number of attempts to establish SDCCH / TCH
made on day 1
C1 = Average SDCCH / TCH Congestion % on day 1
A2 = Number of attempts to establish SDCCH / TCH
made on day 2
C2 = Average SDCCH / TCH Congestion % on day 2
An = Number of attempts to establish SDCCH / TCH
made on day n
Cn = Average SDCCH / TCH Congestion % on day n
TCH Congestion
POI Congestion
POI Congestion% = [(A1 x C1) + (A2 x C2) +…….+ (An
x Cn)] / (A1 + A2 +…+ An)
Where:
A1 = POI traffic offered on all POIs (no. of calls) on
day 1
C1 = Average POI Congestion % on day 1
A2 = POI traffic offered on all POIs (no. of calls) on
day 2
C2 = Average POI Congestion % on day 2
An = POI traffic offered on all POIs (no. of calls) on
day n
Cn = Average POI Congestion % on day n
Call Drop Rate Total Calls Dropped / Total Calls Established x 100
Worst Affected Cells having more than 3%
TCH drop
Total number of cells having more than 3% TCH drop
during CBBH/ Total number of cells in the LSA x 100
Connections with good voice quality No. of voice samples with good voice quality / Total
number of samples x 100
TRAI Audit Wireless Report-Assam Circle JFM Quarter-2015
13
2.4.1.7 3 DAY LIVE DATA
The main purpose of 3 day live measurement is to evaluate the network parameters on intraday basis.
While the monthly PMR report provides an overall view of the performance of QoS parameters, the 3
day live data helps looking at intraday performance on the network parameters discussed earlier. All the
calculations are done on the basis of that raw data of 3 days.
The 3 day live data provides a sample of 9 days in a quarter (3 days each month of a quarter) with hourly
performance, which enables the auditor to identify and validate intraday issues for an operator on the
Q0S network parameters. For example, network congestion being faced by an operator during
busy/peak hours.
Network related parameters were evaluated for a period of 3 days in each month. 3 day live audit was
conducted for 3 consecutive weekdays for each month. The data was extracted from each operator’s
server/ NOC etc. at the end of the 3rd
day. The extracted data is then used to create a report (similar to
PMR report) to assess the various QoS parameters.
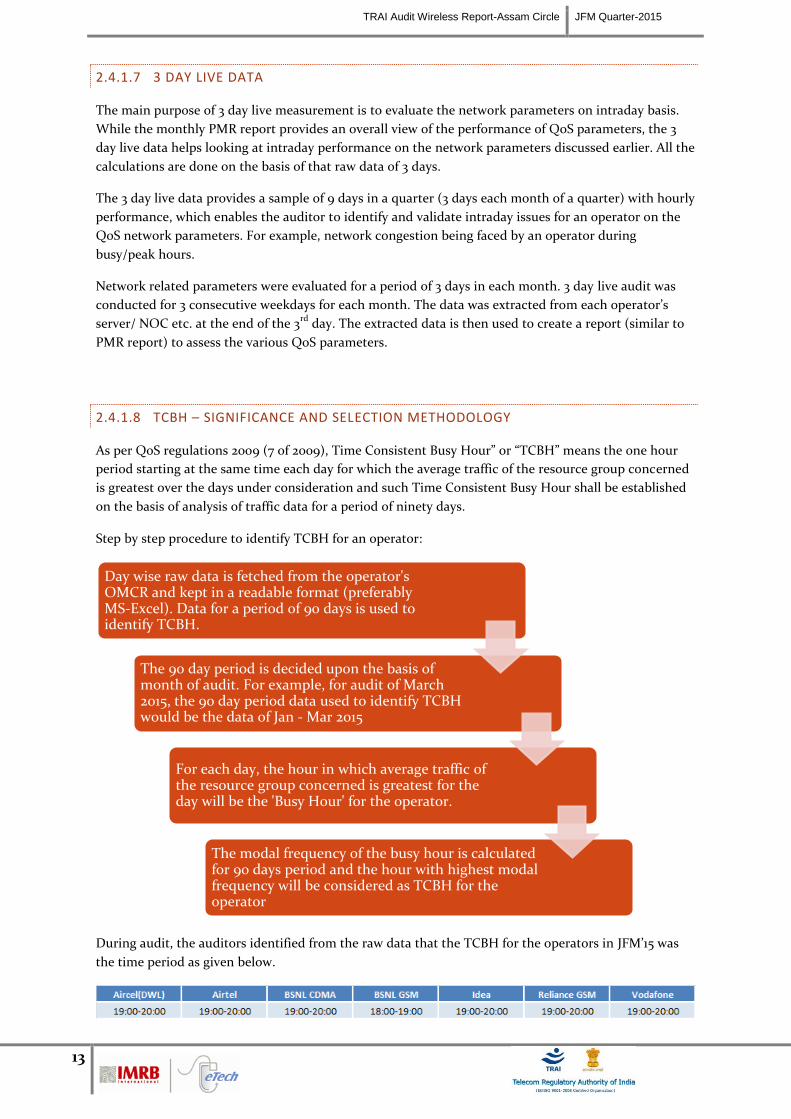
2.4.1.8 TCBH – SIGNIFICANCE AND SELECTION METHODOLOGY
As per QoS regulations 2009 (7 of 2009), Time Consistent Busy Hour” or “TCBH” means the one hour
period starting at the same time each day for which the average traffic of the resource group concerned
is greatest over the days under consideration and such Time Consistent Busy Hour shall be established
on the basis of analysis of traffic data for a period of ninety days.
Step by step procedure to identify TCBH for an operator:
During audit, the auditors identified from the raw data that the TCBH for the operators in JFM’15 was
the time period as given below.
Day wise raw data is fetched from the operator's OMCR and kept in a readable format (preferably MS-Excel). Data for a period of 90 days is used to identify TCBH.
The 90 day period is decided upon the basis of month of audit. For example, for audit of March 2015, the 90 day period data used to identify TCBH would be the data of Jan - Mar 2015
For each day, the hour in which average traffic of the resource group concerned is greatest for the day will be the 'Busy Hour' for the operator.
The modal frequency of the busy hour is calculated for 90 days period and the hour with highest modal frequency will be considered as TCBH for the operator

TRAI Audit Wireless Report-Assam Circle JFM Quarter-2015
14
2.4.1.9 CBBH – SIGNIFICANCE AND SELECTION METHODOLOGY
As per QoS regulations 2009 (7 of 2009), Cell Bouncing Busy Hour (CBBH) means the one hour period
in a day during which a cell in cellular mobile telephone network experiences the maximum traffic.
Step by step procedure to identify CBBH for an operator:
During audit, the auditors identified from the raw data that the CBBH for the operators in JFM’15 was
the time period as given below.
2.4.1.10 CUSTOMER SERVICE PARAMETERS
The data to generate PMR report for customer service parameters is extracted at the operator premises
and verified once every quarter in the subsequent month of the last month of the quarter. For example,
data for quarter ending Mar 2015 (JFM’15) was collected in the month of Apr 2015. To extract the data for
customer service parameters for the purpose of audit, IMRB auditors primarily visit the following
locations/ departments/ offices at the operator’s end.
Central Billing Center
Central Customer Service Center
The operators are duly informed in advance about the audit schedule.
The Customer Service Quality Parameters include the following:
Metering and billing credibility (postpaid and prepaid)
Resolution of billing/charging complaints
Period of applying credit/waiver/adjustment to customer’s account
Response time to the customer for assistance
Termination/closure of service
Time taken for refund of security deposit after closures.
Most of the customer service parameters were calculated by averaging over the quarter; however billing
parameters were calculated by averaging over one billing cycle for a quarter.
Day wise raw data is fetched from the operator's OMCR and kept in a readable format (preferably MS-Excel). Data for a period of 90 days is used to identify CBBH.
For each day, the hour in which a cell in cellular mobile telephone network experiences maximum traffic for the day will be the 'Busy Hour' for the operator.
The modal frequency of the busy hour is calculated for 90 days period and the hour with highest modal frequency will be considered as CBBH for the operator

TRAI Audit Wireless Report-Assam Circle JFM Quarter-2015
15
All the parameters have been described in detail along with key findings of the parameter in section 6 of
the report. The benchmark values for each parameter have been given in the table below.
2.4.1.11 AUDIT PARAMETERS – CUSTOMER SERVICE

TRAI Audit Wireless Report-Assam Circle JFM Quarter-2015
16
2.4.1.12 CALCULATION METHODOLOGY – CUSTOMER SERVICE PARAMETERS
Parameter Calculation Methodology
Metering and billing credibility - Postpaid
Total billing complaints received during the
relevant billing cycle / Total bills generated
during the relevant billing cycle *100
Metering and billing credibility – Prepaid
Total charging complaints received during the
quarter/ Total number of subscribers reported
by the operator at the end of the quarter * 100
Resolution of billing/ charging complaints
(Postpaid + Prepaid)
There are two benchmarks involved here:
Billing or Charging Complaints resolved in 4
weeks from date of receipt / Total billing or
charging complaints received during the
quarter) x 100
Billing or Charging Complaints resolved in 6
weeks from date of receipt / Total billing or
charging complaints received during the
quarter) x 100
Period of applying credit waiver
Number of cases where credit waiver is applied
within 7 days/ total number of cases eligible for
credit waiver * 100
Call centre performance IVR (Calling getting
connected and answered by IVR)
Number of calls connected and answered by
IVR/ All calls attempted to IVR * 100
Call centre performance (Voice to Voice)
Call centre performance Voice to Voice =
(Number of calls answered by operator within
90 seconds/ All calls attempted to connect to
the operator) * 100
The calculation excludes the calls dropped
before 90 seconds
Time taken for termination/ closure of service Number of closures done within 7 days/ total
number of closure requests * 100
Time taken for refund for deposit after closures
Number of cases of refund after closure done
within 60 days/ total number of cases of refund
after closure * 100

TRAI Audit Wireless Report-Assam Circle JFM Quarter-2015
17
2.4.2 LIVE CALLING
2.4.2.1 SIGNIFICANCE AND METHODOLOGY
The main purpose of live calling is to verify the performance of various customer service parameters by
doing test calls to the subscribers/ specific numbers. Below is a step wise procedure of live calling.
Live calling activity was carried out during the period of Mar 2015. The data considered for live calling
was for the month prior to the month in which the live calling activity was being conducted. In this
case, data of Feb 2015 was considered for live calling activity conducted in Mar 2015.
A detailed explanation of each parameter is explained below.
2.4.2.2 BILLING COMPLAINTS
Live calling is done to verify Resolution of billing complaints within stipulated time. The process for this
parameter is stated below.
Auditors request the operator provided the database of all the subscribers who reported billing
complaints in one month prior to IMRB auditor visit. In case of BSNL, data for the complaints
from the subscribers belonging to the sample exchanges is requested specifically
A sample of 10% or 100 complainants, whichever is less, is selected randomly from the list
provided by operator
Calls are made by auditors to the sample of subscribers to check and record whether the complaint was
resolved within the timeframes as mentioned in the benchmark.
Using operator SIM, the auditors also make test calls to subscribers of other operators to assess the inter-operator call connectivity in the same licensed service area
The auditors also verify the performance of call center, level 1 services by calling the numbers using operator SIM. The list of call center numbers is provided by the operator. The process followed to test Level 1 services has been stated below.
IMRB auditors then make live calls using operator SIM to a random sample of subscribers from the raw data provided to verify the resolution of complaints
The IMRB auditor visits each operator premises to do live calling. The operators provide the raw data of customer complaints (billing & service) and also the list of
customer service numbers to be verified through live calling

TRAI Audit Wireless Report-Assam Circle JFM Quarter-2015
18
All the complaints related to billing as per clause 3.7.2 of QoS regulation of 20th
March, 2009 were
considered as population for selection of samples. A complete list of the same has been provided in
Section 6.1.1.
TRAI benchmark-
Resolution of billing/ charging complaints - 98% within 4 weeks, 100% within 6 weeks
2.4.2.3 SERVICE COMPLAINTS REQUESTS
“Service request” means a request made to a service provider by its consumer pertaining to his account,
and includes.
A request for change of tariff plan
A request for activation or deactivation of a value added service or a supplementary
service or a special pack
A request for activation of any service available on the service provider’s network
A request for shift or closure or termination of service or for billing details
All the complaints other than billing were covered. A total of 100 calls per service provider for each
service in licensed service area were done by the IMRB auditors.
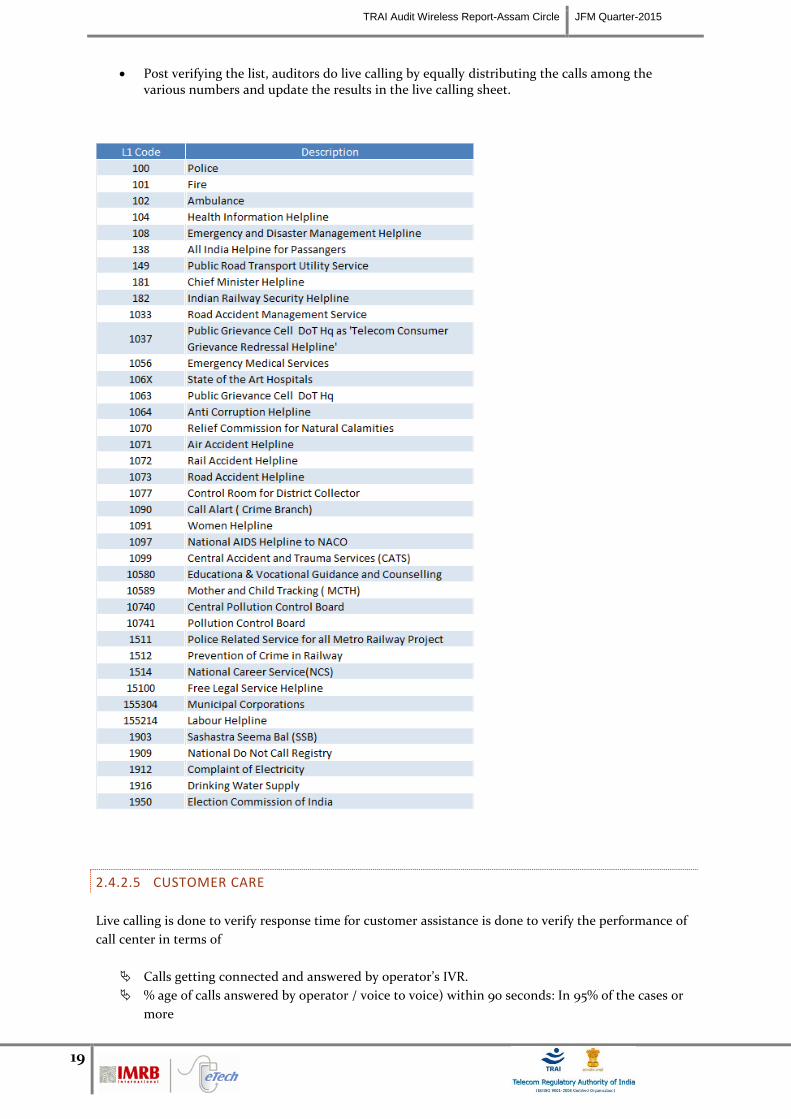
2.4.2.4 LEVEL 1 SERVICE
Level 1 is used for accessing special services like emergency services, supplementary services, inquiry
and operator-assisted services.
Level 1 Services include services such as police, fire, ambulance (Emergency services). Test calls were
made from operator SIMs. A total of 150 test calls were made per service provider in the quarter.
While most of the Level 1 services are toll free, it has been observed that some Level 1 services may not
be toll free. In JFM’15, IMRB has tried contacting the list of Level 1 services provided by TRAI as per the
NNP (National Numbering Plan).
2.4.2.4.1 PROCESS TO TEST LEVEL 1 SERVICES
On visiting the operator’s premises (Exchange/Central Server etc.), auditors ask the operator authorized personnel to provide a list of Level 1 services being active in their service. The list should contain a description of the numbers along with dialing code.
Operators might provide a long list of L1 services. To identify emergency L1 service numbers, auditors check if there is any number that starts with code ‘10’ in that list. If auditors find any emergency number in addition to the below list, that number is also tested during live calling.
On receiving the list, auditors verify it if the below given list of numbers are active in the service provider’s network.
If there are any other additional numbers provided by the operator, auditors also do live calling on those numbers along with below list.
If any of these numbers is not active, then we would write the same in our report, auditors write in the report.
TRAI Audit Wireless Report-Assam Circle JFM Quarter-2015
19
Post verifying the list, auditors do live calling by equally distributing the calls among the various numbers and update the results in the live calling sheet.
2.4.2.5 CUSTOMER CARE
Live calling is done to verify response time for customer assistance is done to verify the performance of
call center in terms of
Calls getting connected and answered by operator’s IVR.
% age of calls answered by operator / voice to voice) within 90 seconds: In 95% of the cases or
more

TRAI Audit Wireless Report-Assam Circle JFM Quarter-2015
20
The process for this parameter is stated below.
Overall sample size is 100 calls per service provider per circle at different points of time, evenly
distributed across the selected exchanges – 50 calls between 1100 HRS to 1400 HRS and 50 calls
between 1600 HRS to 1900 HRS.
Time to answer the call by the operator was assessed from the time interviewer pressed the
requisite button for being assisted by the operator.
All the supplementary services that have any kind of human intervention are to be covered
here. It also includes the IVR assisted services.
2.4.2.6 INTER OPERATOR CALL ASSESEMENT
A total of 100 calls per service provider to all the other service providers in a licensed service area were
done for the purpose of audit.
2.4.3 DRIVE TEST
2.4.3.1 SIGNIFICANCE AND METHODOLOGY
Drive test, as the name suggests, is conducted to measure the outdoor coverage in a moving vehicle in a
specified network coverage area.
The main purpose of the drive test is to check the health of the mobile network of various operators in
the area in terms of coverage (signal strength), voice quality, call drop rate, call set up success rate etc.
To assess the indoor coverage, the test is also conducted at two static indoor locations in each SSA, such
as Malls, office buildings, shopping complexes, government buildings etc.
IMRB conducted two types of drive tests as mentioned below.
Operator Assisted Drive Test
Independent Drive Test
The main difference between the two is that in the operator assisted, operators participate in the drive
test along with their hardware, software, phones etc. while in the independent drive test IMRB conducts
the drive test on solitary basis and uses its own hardware. Operators generally do not have any
knowledge of the drive test being conducted.
A detailed explanation of the two methodologies has been provided below.
2.4.3.2 OPERATOR ASSISTED DRIVE TEST
A total of 3 SSA were selected and audited in each quarter, 1 SSA in each month. The methodology
adopted for the drive test-
3 consecutive days drive test in one SSA every month. SSA would be defined as per BSNL and
month wise SSA list will be finalized by regional TRAI office.
On an average, a minimum of 100 kilometers were covered each day

TRAI Audit Wireless Report-Assam Circle JFM Quarter-2015
21
Route map was designed in such a way that all the major roads, highways and all the important
towns and villages were covered as part of audit.
Special emphasis was given to those areas where the number of complaints received were on
the higher side, if provided by TRAI.
The route is defined in a way that we cover maximum area in the SSA and try to cover
maximum villages and cities within the SSA. The route is designed such that there is no overlap
of roads and we can start from the point from where we had left last day (if possible).
The route was classified as-
o With In city
o Major Roads
o Highways
o Shopping complex/ Mall
o Office Complex/ Government Building
There were no fixed calls which we need to do for within city, major roads and highways, but a
minimum of 30 calls in each route, i.e., within city, major roads and highways on each day. For
indoors, 20 calls each for shopping and office complex each day preferably in relatively bigger
city.
The drive test covered selected cities and adjoining towns/rural areas where the service
provider has commenced service, including congested areas and indoor sites.
The drive test of each mobile network was conducted between 10 am and 8 pm on weekdays.
The Vehicle used in the drive tests was equipped with the test tool that automatically generates
calls on the mobile telephone networks.
The speed of the vehicle was kept at around 30 km/hr.
The holding period of each test call was 120 seconds.
A test call was generated 10 seconds after the previous test call is completed.
Height of the antenna was kept uniform in case of all service providers.
2.4.3.3 INDEPENDENT DRIVE TEST
The number of independent drive tests to be conducted and their locations are decided basis TRAI
recommendation.
A minimum of 100 kilometers was traversed during the independent drive test in a SSA. The
SSA would be defined as per BSNL and SSA list will be finalized by regional TRAI office.
Route map was designed in such a way that all the major roads, highways and all the important
towns and villages were covered as part of audit.
Special emphasis was given to those areas where the number of complaints received were on
the higher side, if provided by TRAI.
The route is defined in a way that we cover maximum area in the SSA and try to cover
maximum villages and cities within the SSA. The route is designed such that there is no overlap
of roads (if possible).
The route was classified as-
o With In city
o Major Roads
o Highways
o Shopping complex/ Mall
o Office Complex/ Government Building
There were no fixed calls which we need to do for within city, major roads and highways, but a
minimum of 30 calls in each route, i.e., within city, major roads and highways on each day. For

TRAI Audit Wireless Report-Assam Circle JFM Quarter-2015
22
indoors, 20 calls each for shopping and office complex each day preferably in relatively bigger
city.
The drive test covered selected cities and adjoining towns/rural areas where the service
provider has commenced service, including congested areas and indoor sites.
The drive test of each mobile network was conducted between 10 am and 8 pm on weekdays.
The Vehicle used in the drive tests was equipped with the test tool that automatically generates
calls on the mobile telephone networks.
The speed of the vehicle was kept at around 30 km/hr.
The holding period of each test call was 120 seconds.
A test call was generated 10 seconds after the previous test call is completed.
Height of the antenna was kept uniform in case of all service providers.
2.4.3.4 PARAMETERS EVALUATED DURING DRIVE TEST
The parameters which were captured during the drive test include. Below are the parameters which are
captured for the GSM and CDMA operators.
Coverage-Signal strength (GSM)
Total calls made (A)
Number of calls with signal strength between 0 to -75 dBm
Number of calls with signal strength between 0 to -85 dBm
Number of calls with signal strength between 0 to -95 dBm
Coverage-Signal strength (CDMA)
Total Ec/Io BINS (A)
Total Ec/Io BINS with less than –15 (B)
Low Interference = [1 - (B/A)] x 100
Voice quality (GSM)
Total RxQual Samples– A
RxQual samples with 0-5 value – B
%age samples with good voice quality = B/A x 100
Voice quality (CDMA)
Total FER BINs (forward FER) – A
FER BINs with 0-2 value (forward FER) – B
FER BINs with 0-4 value (forward FER) – C
%age samples with FER bins having 0-2 value (forward FER) = B/A x 100
%age samples with FER bins having 0-4 value (forward FER) = C/A x 100
No. of FER samples with value > 4 = [A-C]
Call setup success rate
Total number of call attempts – A
Total Calls successfully established – B
Call success rate (%age) = (B/A) x 100
Blocked calls
100% - Call Set up Rate
Call drop rate
Total Calls successfully established – A
Total calls dropped after being established – B
Call Drop Rate (%age) = (B/A) x 100

TRAI Audit Wireless Report-Assam Circle JFM Quarter-2015
23
2.5 OPERATORS COVERED
Mar’15 VLR data was considered for the number of subscribers.
2.6 COLOUR CODES TO READ THE REPORT
Not Meeting the benchmark Best Performing Operator

TRAI Audit Wireless Report-Assam Circle JFM Quarter-2015
24
3 EXECUTIVE SUMMARY
The objective assessment of Quality of Service (QoS) carried out by IMRB gives an insight into the
overall performance of various operators in the Assam circle, with a parameter wise performance
evaluation as compared to TRAI benchmark.
3.1 PMR DATA – 3 MONTHS- CONSOLIDATED
NA: SDCCH/ Paging channel congestion not applicable for CDMA operators. Hence, it has been
reported as NA for BSNL CDMA.
Following are the parameter wise observations for wireless operators for Assam circle:
BTSs Accumulated Downtime:
Aircel, BSNL CDMA & BSNL GSM did not meet the benchmark. Minimum BTS Accumulated downtime
was recorded for Airtel at 0.13%.
Worst Affected BTSs Due to Downtime:
Aircel, BSNL CDMA and BSNL GSM failed to meet the benchmark. Minimum worst affected BTSs due
to downtime was recorded for Airtel at 0.54%.

TRAI Audit Wireless Report-Assam Circle JFM Quarter-2015
25
Call Set-up Success Rate (CSSR):
BSNL GSM failed to meet the benchmark for CSSR. During the audits, the maximum CSSR was
observed for Vodafone with 99.52%.
All the operators were found to be calculating the parameter as per the norm specified by TRAI, as
given in parameter description section.
Network Congestion parameters:
Aircel failed to meet the benchmark on SDCCH / Paging Channel Congestion as well as TCH
congestion.
Reliance GSM recorded the best SDCCH / Paging Channel Congestion as well as TCH congestion.
The calculation methodology (given in parameter description section) followed by the operators was
found to be in complete accordance with what has been specified by TRAI.
Call Drop Rate:
All operators met the benchmark for the parameter. Minimum call drop rate was recorded for Vodafone
at 0.55%.
Worst Affected Cells Having More than 3% TCH Drop:
Aircel, BSNL CDMA and BSNL GSM failed to meet the benchmark. Best performance was recorded for
Reliance GSM at 0.15%.
Voice Quality
Aircel, BSNL CDMA and BSNL GSM failed to meet the benchmark. Best performance was recorded for
Airtel at 98.61%.
All the service providers were measuring this parameter as per the TRAI guidelines that have been
stated in parameter description section.

TRAI Audit Wireless Report-Assam Circle JFM Quarter-2015
26
Below are the month wise summary tables for each network parameter basis PMR data.
3.1.1 PMR DATA - JANUARY
3.1.2 PMR DATA – FEBRUARY

TRAI Audit Wireless Report-Assam Circle JFM Quarter-2015
27
3.1.3 PMR DATA - MARCH
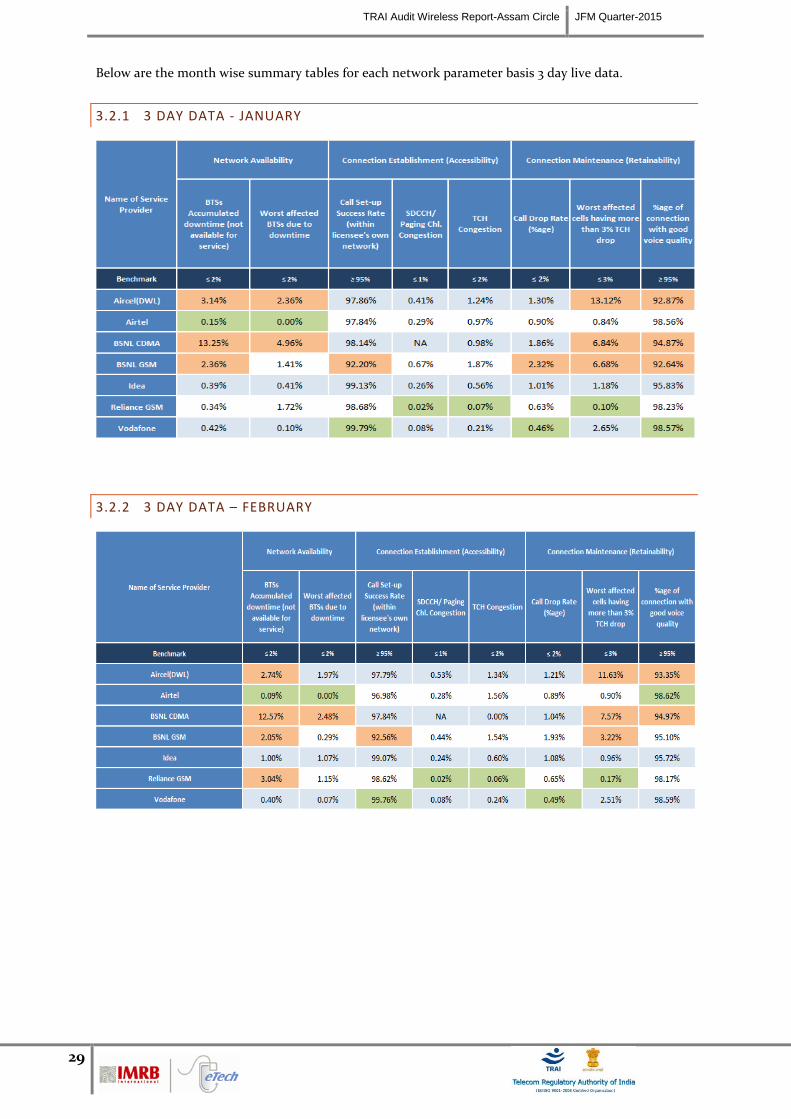
3.2 3 DAY DATA – CONSOLIDATED
A three day live measurement was conducted to measure the QoS provided by the operators. It was
seen from the live data collected, that the performance of the operators across all parameters more or
less corroborated with the audit data collected.
NA: SDCCH/ Paging channel congestion not applicable for CDMA operators. Hence, it has been
reported as NA for BSNL CDMA.
BTSs Accumulated Downtime:
Aircel, BSNL CDMA, BSNL GSM and Reliance GSM failed to meet the TRAI specified benchmark.
Minimum BTS Accumulated downtime was recorded for Airtel at 0.11%.

TRAI Audit Wireless Report-Assam Circle JFM Quarter-2015
28
Worst Affected BTSs Due to Downtime:
Aircel and BSNL CDMA failed to meet the TRAI specified benchmark. Airtel was the best performer
with 0% worst affected BTSs due to downtime.
Call Set-up Success Rate (CSSR):
BSNL GSM failed to meet the benchmark for CSSR. During the audits, the maximum CSSR was
observed for Vodafone with 99.80%.
All the operators were found to be calculating the parameter as per the norm specified by TRAI, as
given in parameter description section.
Network Congestion parameters:
All operators met the benchmark on SDCCH / Paging Channel Congestion as well as TCH congestion.
Reliance GSM recorded the best SDCCH / Paging Channel Congestion as well as TCH congestion.
The calculation methodology (given in parameter description section) followed by the operators was
found to be in complete accordance with what has been specified by TRAI.
Call Drop Rate:
BSNL GSM failed to meet the benchmark. Minimum call drop rate was recorded for Vodafone at 0.46%.
Worst Affected Cells Having More than 3% TCH Drop:
Aircel, BSNL CDMA and BSNL GSM failed to meet the benchmark. Best performance was recorded for
Reliance GSM at 0.15%.
Voice Quality
Aircel, BSNL CDMA and BSNL GSM failed to meet the benchmark. Best performance was recorded for
Airtel at 98.64%.
All the service providers were measuring this parameter as per the TRAI guidelines that have been
stated in parameter description section.
TRAI Audit Wireless Report-Assam Circle JFM Quarter-2015
29
Below are the month wise summary tables for each network parameter basis 3 day live data.
3.2.1 3 DAY DATA - JANUARY
3.2.2 3 DAY DATA – FEBRUARY

TRAI Audit Wireless Report-Assam Circle JFM Quarter-2015
30
3.2.3 3 DAY DATA - MARCH
3.3 LIVE CALLING DATA - CONSOLIDATED
Resolution of billing complaints
As per the consumers (live calling exercise) none of the operators was able to meet the benchmark of
resolving 98% complaints within 4 weeks and 100% complaints within 6 weeks.
Note: Auditors did not receive the raw data for live calling from the central billing center of BSNL
CDMA as the operator was unable to provide the same due to low base of complaints.

TRAI Audit Wireless Report-Assam Circle JFM Quarter-2015
31
Complaint/Request Attended to Satisfaction
All operators performed satisfactorily in terms of satisfaction of the customers for service requests.
Vodafone recorded the best performance at 88%.
Note: Auditors did not receive the raw data for live calling from the central customer service center of
BSNL CDMA as the operator was unable to provide the same due to low base of complaints.
Level 1 Service
As per the live calling results, all operators met the TRAI benchmark for level 1 service with calls being
answered. The details of live calling done for the level 1 service have been provided in the annexure for
each operator.
Accessibility of Call Centre/Customer Care-IVR
For the IVR aspect, all operators met the TRAI benchmark of 95% with most of the operators recording
100% for the parameter.
Customer Care / Helpline Assessment
Excluding Aircel, all operators failed to meet the benchmark for the parameter.

TRAI Audit Wireless Report-Assam Circle JFM Quarter-2015
32
3.4 BILLING AND CUSTOMER CARE - CONSOLIDATED
Metering and Billing Credibility – Postpaid Subscribers
For the billing disputes of postpaid subscribers, it was observed that Vodafone failed to meet the TRAI benchmark for the parameter. BSNL GSM had the best
performance with 0.01% billing disputes.
Metering and Billing Credibility – Prepaid Subscribers
For the prepaid customers, Aircel and Idea failed to meet the benchmark of billing disputes. BSNL CDMA performed the best with 0.00% disputes.

TRAI Audit Wireless Report-Assam Circle JFM Quarter-2015
33
Resolution of billing complaints
All operators met the TRAI benchmark of resolution of billing complaints within 4 weeks as well as 6 weeks.
It is to be noted that Aircel, Airtel, Idea and Vodafone have reported high ratio of invalid complaints. Auditors recommend further investigation of the issue
independently by TRAI. For details, kindly refer to the annexure (section 8.7).
Response Time to customer for assistance - % of cases in which advance waiver is received within one week
All the operators met the TRAI benchmark of providing credit or waiver within one week in case of complaints received.
Customer Care Percentage of calls answered by the IVR
Aircel did not meet the benchmark of 95% of its IVR call being attended. BSNL CDMA recorded the best performance for the parameter.
Customer Care Percentage of calls answered by the operators (Voice to Voice) within 90 seconds
Aircel and Reliance GSM failed to meet the TRAI specified benchmark of 95%. Vodafone recorded the best performance for the parameter.

TRAI Audit Wireless Report-Assam Circle JFM Quarter-2015
34
3.5 INTER OPERATOR CALL ASSESSMENT - CONSOLIDATED
In the inter-operator call assessment, most of the operators did not face any problems in connecting to other operators.
Maximum Problem faced by the calling operator to other operator. The orange colour denotes performance below circle average.
TRAI Audit Wireless Report-Assam Circle JFM Quarter-2015
35
4 CRITICAL FINDINGS
PMR Consolidated (Network Parameters)
Aircel, BSNL CDMA and BSNL GSM failed to meet the benchmark for majority network parameters.
3 Day Live Measurement (Network Parameters)
Aircel, BSNL CDMA and BSNL GSM failed to meet the benchmark for majority network parameters.
For Worst affected BTS due to downtime, significant difference was observed between PMR & live
measurement data for Aircel, BSNL CDMA and BSNL GSM. The possible reason for the variation could
be the difference in time frame of data as PMR data is for 30 days and live measurement data is for three
days.
Live Calling
None of the operators met the benchmark for complaints resolved within 4 weeks, complaints resolved
within 6 weeks and Level 1 services.
As per live calling conducted for ‘level 1’ services, a number of Category-I (i.e. mandatory) services were
not being operated by most of the operators.
Billing and Customer Service
Vodafone failed to meet the benchmark of metering and billing credibility for postpaid while Aircel and
Idea failed to meet the benchmark of metering and billing credibility for prepaid.
It is to be noted that Aircel, Airtel, Idea and Vodafone have reported high ratio of invalid complaints. Auditors recommend further investigation of the issue independently by TRAI and operators should provide detailed explanation of reasons for reporting majority of their complaints as invalid to TRAI.
Drive Test (Operator Assisted)
During all the drive tests, it was observed that BSNL CDMA is the key concern operator in terms of
Voice Quality, CSSR and Call Drop Rate. BSNL GSM also missed benchmark for the key parameters
during all drive tests.

TRAI Audit Wireless Report-Assam Circle JFM Quarter-2015
36
5 PARAMETER DESCRIPTION & DETAILED FINDINGS - COMPARISON BETWEEN
PMR DATA, 3 DAY LIVE DATA AND LIVE CALLING DATA
5.1 BTS ACCUMULATED DOWNTIME
5.1.1 PARAMETER DESCRIPTION
The parameter of network availability would be measured from following sub-parameters
1. BTSs Accumulated downtime (not available for service)
2. Worst affected BTSs due to downtime
1. Definition - BTSs (Base Transceiver Station) accumulated downtime (not available for
service) shall basically measure the downtime of the BTSs, including its transmission
links/circuits during the period of a month, but excludes all planned service downtime for any
maintenance or software up gradation. For measuring the performance against the benchmark
for this parameter the downtime of each BTS lasting more than 1 hour at a time in a day during
the period of a month were considered.
2. Computation Methodology –
BTS accumulated downtime (not available for service) = Sum of downtime of BTSs in a
month in hours i.e. total outage time of all BTSs in hours during a month / (24 x
Number of days in a month x Number of BTSs in the network in licensed service area) x
100
3. TRAI Benchmark –
a. BTSs Accumulated downtime (not available for service) ≤ 2%
4. Audit Procedure –
The fault alarm details at the OMC (MSC) for the network outages (due to own
network elements and infrastructure service provider end outages) was audited
All the BTS in service area were considered. Planned outages due to network
up gradation, routine maintenance were not considered.
Any outage as a result of force majeure were not considered at the time of
calculation
Data is extracted from system log of the server of the operator. This data is in
raw format which is further processed to arrive at the cumulative values.
List of operating sites with cell details and ids are taken from the operator.
When there is any outage a performance report gets generated in line with that
cell resulting and master base of the Accumulated downtime and worst
affected BTS due to downtime.

TRAI Audit Wireless Report-Assam Circle JFM Quarter-2015
37
5.1.2 KEY FINDINGS - CONSOLIDATED
Data Source: Operations and Maintenance Center (OMC) of the operators
Aircel, BSNL CDMA and BSNL GSM did not meet the benchmark on aspect of BTS accumulated
downtime as per audit/PMR data.
5.1.2.1 KEY FINDINGS – MONTH 1
3.32% 0.13% 13.80% 2.12% 0.69% 0.31% 0.49%
3.14%
0.11%
13.41%
2.15%
0.70%
2.14% 0.38%
0%
2%
4%
6%
8%
10%
12%
14%
16%
18%
20%
BTS
s n
ot
avai
lab
le f
or
serv
ice
BTSs acumulated downtime
PMR Data -3 Month Average Live Measurement- 3 Month Average
TRAI Benchmark ≤ 2%

TRAI Audit Wireless Report-Assam Circle JFM Quarter-2015
38
Data Source: Operations and Maintenance Center (OMC) of the operators
5.1.2.2 KEY FINDINGS – MONTH 2
Data Source: Operations and Maintenance Center (OMC) of the operators
5.1.2.3 KEY FINDINGS – MONTH 3
Data Source: Operations and Maintenance Center (OMC) of the operators
5.2 WORST AFFECTED BTS DUE TO DOWNTIME

TRAI Audit Wireless Report-Assam Circle JFM Quarter-2015
39
5.2.1 PARAMETER DESCRIPTION
1. Definition – Worst Affected BTS due to downtime shall basically measure percentage of
BTS having downtime greater than 24 hours in a month. Planned outages were not considered
as part while computing.
For measuring the parameter “Percentage of worst affected BTSs due to downtime" the
downtime of each BTS lasting for more than 1 hour at a time in a day during the period of a
month was considered.
2. Computation Methodology –
Worst affected BTSs due to downtime = (Number of BTSs having accumulated
downtime greater than 24 hours in a month / Number of BTS in Licensed Service Area)
* 100
3. TRAI Benchmark –
a. Worst affected BTSs due to downtime ≤ 2%
4. Audit Procedure –
i. The fault alarm details at the OMC (MSC) for the network outages (due to own
network elements and infrastructure service provider end outages) was audited
ii. All the BTS in service area were considered. Planned outages due to network
up gradation, routine maintenance were not considered.
iii. Data is extracted from system log of the server of the operator. This data is in
raw format which is further processed to arrive at the cumulative values.
iv. Any outage as a result of force majeure was not considered at the time of
calculation.
v. List of operating sites with cell details and ids are taken from the operator.
vi. All the BTS having down time greater than 24 hours is assessed and values of
BTS accumulated downtime is computed in accordance.
5.2.2 KEY FINDINGS – CONSOLIDATED

TRAI Audit Wireless Report-Assam Circle JFM Quarter-2015
40
Data Source: Operations and Maintenance Center (OMC) of the operators
Aircel, BSNL CDMA, and BSNL GSM did not meet the benchmark for worst affected BTSs due to
downtime as per audit/PMR data.
Significant difference was observed between PMR & live measurement data for Aircel, BSNL CDMA and
BSNL GSM. The possible reason for the variation could be the difference in time frame of data as PMR
data is for 30 days and live measurement data is for three days.
5.2.2.1 KEY FINDINGS – MONTH 1
Data Source: Operations and Maintenance Center (OMC) of the operators
5.2.2.2 KEY FINDINGS – MONTH 2

TRAI Audit Wireless Report-Assam Circle JFM Quarter-2015
41
Data Source: Operations and Maintenance Center (OMC) of the operators
5.2.2.3 KEY FINDINGS – MONTH 3
Data Source: Operations and Maintenance Center (OMC) of the operators

TRAI Audit Wireless Report-Assam Circle JFM Quarter-2015
42
5.3 CALL SET UP SUCCESS RATE
5.3.1 PARAMETER DESCRIPTION
1. Definition: The ratio of successful calls established to total calls is known as Call Set-Up
Success Rate (CSSR).
2. Computation Methodology-
(Calls Established / Total Call Attempts) * 100
Call Established means the following events have happened in call setup:-
call attempt is made
the TCH is allocated
the call is routed to the outward path of the concerned MSC
3. TRAI Benchmark ≥ 95%
4. Audit Procedure –
The cell-wise data generated through counters/ MMC available in the switch
for traffic measurements
CSSR calculation should be measured using OMC generated data only
Measurement should be only in Time Consistent Busy Hour (CBBH) period for
all days of the week
Counter data is extracted from the NOC of the operators.
Total calls established include all calls established excluding Signaling
blocking, TCH Drop and TCH blocking.
The numerator and denominator values are derived from adding the counter
values from the MSC.

TRAI Audit Wireless Report-Assam Circle JFM Quarter-2015
43
5.3.2 KEY FINDINGS - CONSOLIDATED
Data Source: Network Operations Center (NOC) of the operators
Aircel failed to meet the TRAI benchmark as per audit/PMR data.
5.3.2.1 KEY FINDINGS – MONTH 1
Data Source: Network Operations Center (NOC) of the operators

TRAI Audit Wireless Report-Assam Circle JFM Quarter-2015
44
5.3.2.2 KEY FINDINGS – MONTH 2
Data Source: Network Operations Center (NOC) of the operators
5.3.2.3 KEY FINDINGS – MONTH 3
Data Source: Network Operations Center (NOC) of the operators

TRAI Audit Wireless Report-Assam Circle JFM Quarter-2015
45
5.4 NETWORK CHANNEL CONGESTION- PAGING CHANNEL /TCH
CONGESTION/POI
5.4.1 PARAMETER DESCRIPTION
1. Definition: It means a call is not connected because there is no free channel to serve the call
attempt. This parameter represents congestion in the network. It happens at three levels:
SDCCH Level: Stand-alone dedicated control channel
TCH Level: Traffic Channel
POI Level: Point of Interconnect
2. Computational Methodology:
SDCCH / TCH Congestion% = [(A1 x C1) + (A2 x C2) +…….+ (An x Cn)] / (A1 + A2 +…+ An)
Where:-A1 = Number of attempts to establish SDCCH / TCH made on day 1
C1 = Average SDCCH / TCH Congestion % on day 1
A2 = Number of attempts to establish SDCCH / TCH made on day 2
C2 = Average SDCCH / TCH Congestion % on day 2
An = Number of attempts to establish SDCCH / TCH made on day n
Cn = Average SDCCH / TCH Congestion % on day n
POI Congestion% = [(A1 x C1) + (A2 x C2) +…….+ (An x Cn)] / (A1 + A2 +…+ An)
Where:-A1 = POI traffic offered on all POIs (no. of calls) on day 1
C1 = Average POI Congestion % on day 1
A2 = POI traffic offered on all POIs (no. of calls) on day 2
C2 = Average POI Congestion % on day 2
An = POI traffic offered on all POIs (no. of calls) on day n
Cn = Average POI Congestion % on day n
3. Benchmark:
SDCCH Congestion: ≤ 1%, TCH Congestion: ≤ 2%, POI Congestion: ≤ 0.5%
4. Audit Procedure –
Audit of the details of SDCCH and TCH congestion percentages computed by
the operator (using OMC–Switch data only) would be conducted
The operator should be measuring this parameter during Time consistent busy
hour (TCBH) only SDCCH

TRAI Audit Wireless Report-Assam Circle JFM Quarter-2015
46
5.4.2 KEY FINDINGS - SDCCH/PAGING CHANNEL CONGESTION (CONSOLIDATED)
Data Source: Network Operations Center (NOC) of the operators
All operators met the benchmark as per PMR/audit Data.
Significant difference was observed between PMR & live measurement data for Aircel and BSNL GSM.
The possible reason for the variation could be the difference in time frame of data as PMR data is for 30
days and live measurement data is for 3 days.
NA: SDCCH/ Paging channel congestion not applicable for CDMA operators. Hence, it has been
reported as NA for BSNL CDMA.
5.4.2.1 KEY FINDINGS – MONTH 1
1.40%
0.45%
NA
0.84%
0.58%
0.02%
0.13%
0.52%
0.31%
NA
0.50%
0.27%
0.02% 0.07%
0.0%
0.2%
0.4%
0.6%
0.8%
1.0%
1.2%
1.4%
1.6%
%ag
e co
nge
stio
n
SDCCH/Paging Channel Congestion
PMR DATA- 3 Month Average Live Measurement- 3 Month Average
TRAI Benchmark ≤ 1%
1.51%
0.31%
NA
0.90%
0.33%
0.02% 0.11%
0.41%
0.29% NA
0.67% 0.26%
0.02% 0.08%
0.0%
1.0%
2.0%
%ag
e co
nge
stio
n
SDCCH/Paging Channel Congestion
PMR Data Live Data
TRAI Benchmark ≤ 1%

TRAI Audit Wireless Report-Assam Circle JFM Quarter-2015
47
Data Source: Network Operations Center (NOC) of the operators
5.4.2.2 KEY FINDINGS – MONTH 2
Data Source: Network Operations Center (NOC) of the operators
5.4.2.3 KEY FINDINGS – MONTH 3
Data Source: Network Operations Center (NOC) of the operators
1.52%
0.65%
NA
0.75%
0.57%
0.02%
0.14%
0.53%
0.28% NA 0.44%
0.24%
0.02% 0.08%
0.0%
1.0%
2.0%
%ag
e co
nge
stio
n
SDCCH/Paging Channel Congestion
PMR Data Live Data
TRAI Benchmark ≤ 1%
1.17%
0.39%
NA
0.86% 0.83%
0.02%
0.13%
0.63%
0.35%
NA
0.40%
0.30%
0.02% 0.06%
0.0%
0.2%
0.4%
0.6%
0.8%
1.0%
1.2%
1.4%
%ag
e co
nge
stio
n
SDCCH/Paging Channel Congestion
PMR Data Live Data
TRAI Benchmark ≤ 1%

TRAI Audit Wireless Report-Assam Circle JFM Quarter-2015
48
5.4.3 KEY FINDINGS – TCH CONGESTION (CONSOLIDATED)
Data Source: Network Operations Center (NOC) of the operators
Aircel failed to meet the benchmark as per audit/PMR report.
Significant difference was observed between PMR & live measurement data for Aircel, BSNL GSM and
Idea. The possible reason for the variation could be the difference in time frame of data as PMR data is
for 30 days and live measurement data is for three days.
5.4.3.1 KEY FINDINGS – MONTH 1
Data Source: Network Operations Center (NOC) of the operators
3.93%
1.10%
0.00%
1.12%
1.84%
0.07% 0.48%
1.36%
1.17%
0.33%
1.75%
0.49%
0.07% 0.20%
0.0%
0.5%
1.0%
1.5%
2.0%
2.5%
3.0%
3.5%
4.0%
4.5%
%ag
e c
on
gest
ion
TCH Congestion
PMR DATA- 3 Month Average Live Measurement- 3 Month Average
TRAI Benchmark ≤ 2%

TRAI Audit Wireless Report-Assam Circle JFM Quarter-2015
49
5.4.3.2 KEY FINDINGS – MONTH 2
Data Source: Network Operations Center (NOC) of the operators
5.4.3.3 KEY FINDINGS – MONTH 3
Data Source: Network Operations Center (NOC) of the operators

TRAI Audit Wireless Report-Assam Circle JFM Quarter-2015
50
5.4.4 KEY FINDINGS – POI CONGESTION (CONSOLIDATED) – AVERAGE OF 3 MONTHS
Data Source: Network Operations Center (NOC) of the operators
All operators met the benchmark of POI Congestion as per PMR/audit Data.
Note: Auditors were not able to get the POI data from BSNL CDMA as operator uses the POI of BSNL GSM for its connectivity to other operators.

TRAI Audit Wireless Report-Assam Circle JFM Quarter-2015
51
5.4.4.1 KEY FINDINGS – MONTH 1
Data Source: Network Operations Center (NOC) of the operators

TRAI Audit Wireless Report-Assam Circle JFM Quarter-2015
52
5.4.4.2 KEY FINDINGS – MONTH 2
Data Source: Network Operations Center (NOC) of the operators

TRAI Audit Wireless Report-Assam Circle JFM Quarter-2015
53
5.4.4.3 KEY FINDINGS – MONTH 3
Data Source: Network Operations Center (NOC) of the operators

TRAI Audit Wireless Report-Assam Circle JFM Quarter-2015
54

TRAI Audit Wireless Report-Assam Circle JFM Quarter-2015
55
5.5 CALL DROP RATE
5.5.1 PARAMETER DESCRIPTION
1. Definition - The dropped call rate is the ratio of successfully originated calls that were found
to drop to the total number of successfully originated calls that were correctly released.
Total calls dropped = All calls ceasing unnaturally i.e. due to handover or due to radio
loss
Total calls established = All calls that have TCH allocation during busy hour
2. Computational Methodology: (Total Calls Dropped / Total Calls Established) x 100
3. TRAI Benchmark –
Call drop rate ≤ 2%
4. Audit Procedure –
Audit of traffic data of the relevant quarter kept in OMC-R at MSCs and used for
arriving at CDR was used
The operator should only be considering those calls which are dropped during Time
consistent busy hour (TCBH) for all days of the relevant quarter.
5.5.2 KEY FINDINGS - CONSOLIDATED
Data Source: Network Operations Center (NOC) of the operators
All operators met the benchmark for call drop rate during audit. The call drop rate during drive test and
live measurement was observed to be higher than audit for BSNL CDMA and BSNL GSM.

TRAI Audit Wireless Report-Assam Circle JFM Quarter-2015
56
5.5.2.1 KEY FINDINGS – MONTH 1
Data Source: Network Operations Center (NOC) of the operators
5.5.2.2 KEY FINDINGS – MONTH 2
Data Source: Network Operations Center (NOC) of the operators

TRAI Audit Wireless Report-Assam Circle JFM Quarter-2015
57
5.5.2.3 KEY FINDINGS – MONTH 3
Data Source: Network Operations Center (NOC) of the operators
5.6 CELLS HAVING GREATER THAN 3% TCH DROP
5.6.1 PARAMETER DESCRIPTION
1. Definition- Worst Affected Cells having more than 3% TCH drop shall measure the ratio
of total number of cells in the network to the ratio of cells having more than 3% TCH drop.
2. Computational Methodology: (Total number of cells having more than 3% TCH drop
during CBBH/ Total number of cells in the network) x 100
3. TRAI Benchmark –
Worst affected cells having more than 3% TCH drop rate ≤ 3%
4. Audit Procedure –
Audit of traffic data of the relevant quarter kept in OMC-R at MSCs and used for
arriving at CDR would be conducted.
The operator should only be considering those calls which are dropped during Cell Bouncing Busy hour
(CBBH) for all days of the relevant quarter.

TRAI Audit Wireless Report-Assam Circle JFM Quarter-2015
58
5.6.2 KEY FINDINGS - CONSOLIDATED
Data Source: Network Operations Center (NOC) of the operators
Aircel, BSNL CDMA and BSNL GSM did not meet the benchmark during audit.
5.6.2.1 KEY FINDINGS – MONTH 1
Data Source: Network Operations Center (NOC) of the operators
15.16% 0.99%
10.04%
4.35% 1.15% 0.10% 2.69%
13.12%
0.84%
6.84%
6.68%
1.18%
0.10%
2.65%
0.0%
2.0%
4.0%
6.0%
8.0%
10.0%
12.0%
14.0%
16.0%
%a
ge
ca
lls d
rop
pe
d
Cells having >3% TCH Drop
PMR Data Live Data
TRAI Benchmark ≤ 3%

TRAI Audit Wireless Report-Assam Circle JFM Quarter-2015
59
5.6.2.2 KEY FINDINGS – MONTH 2
Data Source: Network Operations Center (NOC) of the operators
5.6.2.3 KEY FINDINGS – MONTH 3
Data Source: Network Operations Center (NOC) of the operators

TRAI Audit Wireless Report-Assam Circle JFM Quarter-2015
60
5.7 VOICE QUALITY
5.7.1 PARAMETER DESCRIPTION
1. Definition:
for GSM service providers the calls having a value of 0 –5 are considered to be of good
quality (on a seven point scale)
For CDMA the measure of voice quality is Frame Error Rate (FER). FER is the
probability that a transmitted frame will be received incorrectly. Good voice quality of
a call is considered when it FER value lies between 0 – 4 %
2. Computational Methodology:
% Connections with good voice quality = (No. of voice samples with good voice
quality / Total number of samples) x 100
3. TRAI Benchmark: ≥ 95%
4. Audit Procedure –
a. A sample of calls would be taken randomly from the total calls established.
b. The operator should only be considering those calls which are meeting the desired
benchmark of good voice quality.
5.7.2 KEY FINDINGS
Data Source: Network Operations Center (NOC) of the operators
Aircel, BSNL CDMA and BSNL GSM were not able to meet the benchmark for Voice quality as per PMR
data.
91.40%
98.61% 94.84% 94.64% 95.08%
98.27% 98.17%
93.12% 98.64% 94.84% 94.64% 95.76% 98.19% 98.56%
95.56% 95.31% 94.84%
91.73%
95.56%
92.56%
94.68%
60%
65%
70%
75%
80%
85%
90%
95%
100%
%ag
e c
on
ne
ctio
ns
wit
h g
oo
d v
oic
e q
ual
ity
Voice Quality
PMR DATA- 3 Month Average Live Measurement- 3 Month Average Drive Test- 3 Month Average
TRAI Benchmark ≥ 95%

TRAI Audit Wireless Report-Assam Circle JFM Quarter-2015
61
5.7.2.1 KEY FINDINGS – MONTH 1
5.7.2.2 KEY FINDINGS – MONTH 2
Data Source: Network Operations Center (NOC) of the operators

TRAI Audit Wireless Report-Assam Circle JFM Quarter-2015
62
5.7.2.3 KEY FINDINGS – MONTH 3
Data Source: Network Operations Center (NOC) of the operators

TRAI Audit Wireless Report-Assam Circle JFM Quarter-2015
63
6 PARAMETER DESCRIPTION AND DETAILED FINDINGS – NON-NETWORK
PARAMETERS
6.1 METERING AND BILLING CREDIBILITY
The billing complaints for postpaid are calculated by averaging over one billing cycle in a quarter. For
example, there are three billing cycles in a quarter, the data for each billing cycle is calculated separately
and then averaged over.
The charging complaints for prepaid are calculated by taking all complaints in a quarter.
6.1.1 PARAMETER DESCRIPTION
All the complaints related to billing/ charging as per clause 3.7.2 of QoS regulation of 20th
March, 2009
were covered. The types of billing complaints covered are listed below.
Payments made and not credited to the subscriber account
Payment made on time but late payment charge levied wrongly
Wrong roaming charges
Double charges
Charging for toll free services
Local calls charged/billed as STD/ISD or vice versa
Calls or messages made disputed
Validity related complaints
Credit agreed to be given in resolution of complaint, but not accounted in the bill
Charging for services provided without consent
Charging not as per tariff plans or top up vouchers/ special packs etc.
Overcharging or undercharging
In addition to the above, any billing complaint which leads to billing error, waiver, refund, credit, or any adjustment is also considered as valid billing complaint for calculating the number of disputed bills.
Computational Methodology:
Billing complaints per 100 bills issued (Postpaid) = (Total billing complaints**
received during the relevant billing cycle / Total bills generated* during the relevant
billing cycle)*100
*Operator to include all types of bills generated for customers. This would include
printed bills, online bills and any other forms of bills generated

TRAI Audit Wireless Report-Assam Circle JFM Quarter-2015
64
**Billing complaints here shall include only dispute related issues (including those that
may arise because of a lack of awareness at the subscribers’ end). It does not include
any provisional issues (such as delayed dispatch of billing statements, etc.) in which
the operator has opened a ticket internally.
Charging complaints per 100 subscribers (Prepaid) = (Total charging complaints
received during the quarter/ Total number of subscribers reported by the operator at
the end of the quarter) * 100
TRAI Benchmark: <= 0.1%
Audit Procedure:
Audit of billing complaint details for the complaints received during the quarter and
used for arriving at the benchmark reported to TRAI would be conducted
For Postpaid, the total billing complaints would be audited by averaging over
billing cycles in a quarter
For Prepaid, the data of total charging complaints in a quarter would be taken
for the purpose of audit
6.1.2 KEY FINDINGS – METERING AND BILLING CREDIBILITY (POSTPAID)
Data Source: Billing Center of the operators
Vodafone failed to meet the benchmark of 0.1% postpaid metering and billing credibility.
Data Source: Billing Center of the operators
0.04% 0.04% 0.05%
0.01%
0.07%
0.09%
0.33%
0.00%
0.05%
0.10%
0.15%
0.20%
0.25%
0.30%
0.35%
Pe
rce
nta
ge
bill
s d
isp
ute
d
Metering and billing credibility - Postpaid
Audit Results for Billing performance Postpaid-Consolidated
TRAI Benchmark ≤ 0.1%

TRAI Audit Wireless Report-Assam Circle JFM Quarter-2015
65
6.1.3 KEY FINDINGS - METERING AND BILLING CREDIBILITY (PREPAID)
Data Source: Billing Center of the operators
Aircel and Idea failed to meet the benchmark for metering and billing credibility of prepaid subscribers.
0.04%
0.06%
0.03%
0.01%
0.08% 0.09%
0.36%
0.05% 0.04% 0.04%
0.01%
0.08% 0.09%
0.33%
0.05% 0.02% 0.06%
0.01% 0.06%
0.09%
0.29%
0.00%
0.05%
0.10%
0.15%
0.20%
0.25%
0.30%
0.35%
0.40%P
erc
en
tage
bill
s d
isp
ute
d
Metering and billing credibility - Postpaid (Billing cycle wise)
January February March
TRAI Benchmark ≤ 0.1%
0.63%
0.02% 0.00%
0.07%
0.17%
0.08% 0.10%
0.00%
0.10%
0.20%
0.30%
0.40%
0.50%
0.60%
0.70%
Pe
rce
nta
ge
bill
s d
isp
ute
d
Metering and billing credibility - Prepaid TRAI Benchmark ≤ 0.1%
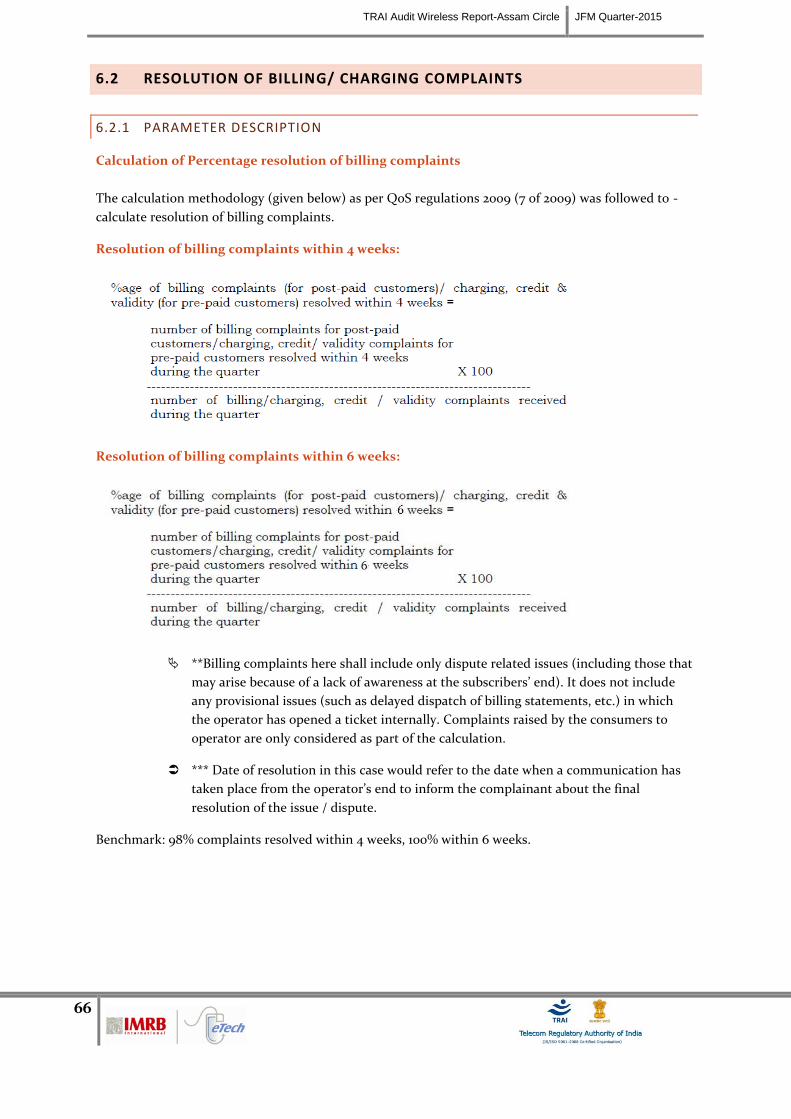
TRAI Audit Wireless Report-Assam Circle JFM Quarter-2015
66
6.2 RESOLUTION OF BILLING/ CHARGING COMPLAINTS
6.2.1 PARAMETER DESCRIPTION
Calculation of Percentage resolution of billing complaints
The calculation methodology (given below) as per QoS regulations 2009 (7 of 2009) was followed to -
calculate resolution of billing complaints.
Resolution of billing complaints within 4 weeks:
Resolution of billing complaints within 6 weeks:
**Billing complaints here shall include only dispute related issues (including those that
may arise because of a lack of awareness at the subscribers’ end). It does not include
any provisional issues (such as delayed dispatch of billing statements, etc.) in which
the operator has opened a ticket internally. Complaints raised by the consumers to
operator are only considered as part of the calculation.
*** Date of resolution in this case would refer to the date when a communication has
taken place from the operator’s end to inform the complainant about the final
resolution of the issue / dispute.
Benchmark: 98% complaints resolved within 4 weeks, 100% within 6 weeks.

TRAI Audit Wireless Report-Assam Circle JFM Quarter-2015
67
6.2.2 KEY FINDINGS - WITHIN 4 WEEKS
Data Source: Billing Center of the operators
6.2.3 KEY FINDINGS WITHIN 6 WEEKS
Data Source: Billing Center of the operators
All operators met the TRAI benchmark of resolution of billing complaints within 4 weeks as well as 6
weeks. However, as per live calling done to customers, the performance of all operators was observed to
be far inferior to the PMR data.
It is to be noted that Aircel, Airtel, Idea and Vodafone have reported high ratio of invalid complaints.
Auditors recommend further investigation of the issue independently by TRAI. For details, kindly refer
to the annexure (section 8.7).
100.00% 100.00% 100.00% 100.00% 100.00% 100.00% 100.00%
63.00%
80.00%
NA
70.00% 74.00% 81.00% 82.00%
0%
20%
40%
60%
80%
100%
Pe
rce
nta
ge
ca
se
s r
eso
lve
d in
4 w
ee
ks
Resolution of billing complaints 4 Weeks
Percentage cases resolved in 4 weeks:Audit results Percentage cases resolved in 4 weeks:Live calling
TRAI Benchmark =98%
100.00% 100.00% 100.00% 100.00% 100.00% 100.00% 100.00%
74.00%
87.00%
NA
78.00% 81.00% 88.00% 90.00%
0%
20%
40%
60%
80%
100%
Pe
rce
nta
ge
ca
se
s r
eso
lve
d in
6 w
ee
ks
Resolution of billing complaints 6 Weeks
Percentage of complaints resolved within 6 weeks from date of receipt Percentage cases resolved in 6 weeks
TRAI Benchmark =100%

TRAI Audit Wireless Report-Assam Circle JFM Quarter-2015
68
Note: Auditors did not receive the raw data for live calling from the central billing center of BSNL
CDMA as the operator was unable to provide the same due to low base of complaints.
6.3 PERIOD OF APPLYING CREDIT/WAVIER
6.3.1 PARAMETER DESCRIPTION
Computational Methodology:
Period of applying credit waiver = (number of cases where credit waiver is applied within 7 days/ total number of cases eligible for credit waiver) * 100
TRAI Benchmark:
Period of applying credit waiver within 7 days: 100%
Audit Procedure:
Operator to provide details of:-
List of all eligible cases along with
Date of applying credit waiver to all the eligible cases.
Date of resolution of complaint for all eligible cases
6.3.2 KEY FINDINGS
Data Source: Billing Center of the operators
All operators met the benchmark for this parameter.
100.00% 100.00% 100.00% 100.00% 100.00% 100.00% 100.00%
0%
20%
40%
60%
80%
100%
Pe
rce
nta
ge
ca
se
s c
red
it/w
aiv
er
ap
plie
d w
ith
in 1
w
ee
k
Period of applying credit/waiver
Percentage cases credit/waiver applied within 1 week
TRAI Benchmark =100%

TRAI Audit Wireless Report-Assam Circle JFM Quarter-2015
69
6.4 CALL CENTRE PERFORMANCE-IVR
6.4.1 PARAMETER DESCRIPTION
Computational Methodology:
Call centre performance IVR = (Number of calls connected and answered by
IVR/ All calls attempted to IVR) * 100
TRAI Benchmark: >= 95%
Audit Procedure:
Operators provide details of the following from their central call centre/ customer
service database:
Total calls connected and answered by IVR
Total calls attempted to IVR
Also live calling is done to test the calls connected and answered by IVR
6.4.2 KEY FINDINGS
Data Source: Customer Service Center of the operators
As per PMR data, Aircel was not able to meet the benchmark.
92.83% 99.99% 100.00% 98.68% 99.45% 98.99% 99.99%
100.00% 97.00%
100.00% 100.00% 100.00% 100.00% 100.00%
40%
45%
50%
55%
60%
65%
70%
75%
80%
85%
90%
95%
100%
%a
ge
ca
lls c
on
ne
cte
d a
nd
an
sw
ere
d
Calls connected and answered
Percentage calls conncted and answered:Three month data Percentage calls connected and answered:Live calling
TRAI Benchmark ≥95%

TRAI Audit Wireless Report-Assam Circle JFM Quarter-2015
70
6.5 CALL CENTRE PERFORMANCE-VOICE TO VOICE
6.5.1 PARAMETER DESCRIPTION
Computational Methodology:
Call centre performance Voice to Voice = (Number of calls answered by operator
within 90 seconds/ All calls attempted to connect to the operator) * 100
Audit Procedure:
Operators provide details of the following from their central call centre/ customer
service database:
Total calls connected and answered by operator within 90 seconds
Total calls attempted to connect to the operator
Also live calling was done to test the calls answered within 90 seconds by the operator
Benchmark: 95% calls to be answered within 90 seconds
6.5.2 KEY FINDINGS
Data Source: Customer Service Center of the operators
Aircel and Reliance GSM were not able to meet the benchmark as per audit. However, as per live calling
done to customers, the performance of BSNL CDMA, BSNL GSM, Idea and Vodafone was far inferior to
the PMR data.
92.97% 98.85% 97.17% 96.02% 98.47%
84.29%
100.00%
100.00%
94.85%
78.41%
68.42%
84.00% 81.43%
86.00%
40%
45%
50%
55%
60%
65%
70%
75%
80%
85%
90%
95%
100%
%a
ge
ca
lls a
nsw
ere
d in
90
se
co
nd
s
Calls answered in 90 seconds (Voice to Voice)
Percentage calls answered within 90 seconds (Avg of 3 months) Live Calling Percentage calls getting connected and answered
TRAI Benchmark ≥ 95%

TRAI Audit Wireless Report-Assam Circle JFM Quarter-2015
71
Data Source: Customer Service Center of the operators
6.6 TERMINATION/CLOSURE OF SERVICE
6.6.1 PARAMETER DESCRIPTION
Computational Methodology:
Time taken for closure of service = (number of closures done within 7 days/ total number of closure requests) * 100
TRAI Benchmark:
Termination/Closure of Service: <=7 days
Audit Procedure:
Operator provide details of the following from their central billing/CS database:
Date of lodging the closure request (all requests in given period)
Date of closure of service
91.84%
99.42% 98.05% 94.60%
98.02%
76.94%
100.00%
96.01% 98.02% 97.33% 97.12% 98.37%
83.15%
100.00%
91.23% 99.05% 96.25% 96.30% 98.95% 93.37% 100.00%
40%
45%
50%
55%
60%
65%
70%
75%
80%
85%
90%
95%
100%%
ag
e c
alls
an
sw
ere
d in
90
se
co
nd
s
Calls answered in 90 seconds (Voice to Voice)
January February March
TRAI Benchmark ≥ 95%
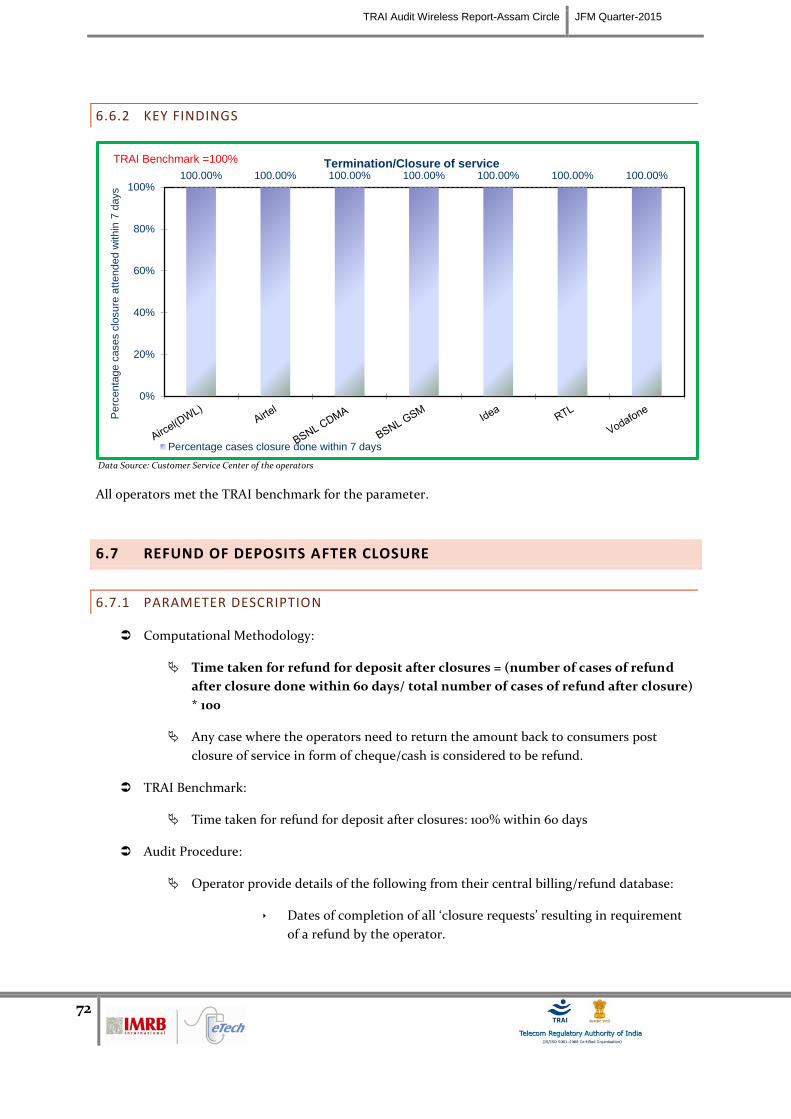
TRAI Audit Wireless Report-Assam Circle JFM Quarter-2015
72
6.6.2 KEY FINDINGS
Data Source: Customer Service Center of the operators
All operators met the TRAI benchmark for the parameter.
6.7 REFUND OF DEPOSITS AFTER CLOSURE
6.7.1 PARAMETER DESCRIPTION
Computational Methodology:
Time taken for refund for deposit after closures = (number of cases of refund
after closure done within 60 days/ total number of cases of refund after closure)
* 100
Any case where the operators need to return the amount back to consumers post
closure of service in form of cheque/cash is considered to be refund.
TRAI Benchmark:
Time taken for refund for deposit after closures: 100% within 60 days
Audit Procedure:
Operator provide details of the following from their central billing/refund database:
Dates of completion of all ‘closure requests’ resulting in requirement
of a refund by the operator.
100.00% 100.00% 100.00% 100.00% 100.00% 100.00% 100.00%
0%
20%
40%
60%
80%
100%
Perc
enta
ge c
ases c
losure
att
ended w
ithin
7 d
ays
Termination/Closure of service
Percentage cases closure done within 7 days
TRAI Benchmark =100%

TRAI Audit Wireless Report-Assam Circle JFM Quarter-2015
73
Dates of refund pertaining to all closure request received during the
relevant quarter
6.7.2 KEY FINDINGS
Data Source: Customer Service Center of the operators
All operators met the TRAI benchmark for the parameter.
100.00% 100.00% 100.00% 100.00% 100.00% 100.00% 100.00%
0%
20%
40%
60%
80%
100%
Perc
enta
ge c
ases r
efu
nd p
rovid
ed w
ithin
60 d
ays
Refund of deposts after closure
Percentage cases closure done within 7 days
TRAI Benchmark =100%

TRAI Audit Wireless Report-Assam Circle JFM Quarter-2015
74
7 DETAILED FINDINGS - DRIVE TEST DATA
7.1 OPERATOR ASSISTED DRIVE TEST
The drive test was conducted simultaneously for all the operators present in the Assam circle. As per the new directive given by TRAI headquarters, drive test for the
month of January, February and March 2015 were conducted at a SSA level. Drive test was conducted for three days in each SSA and the selection of routes ensured
that the maximum towns, villages, highways are covered as part of drive test. The routes were selected post discussion with TRAI advisors. IMRB auditors were
present in vehicles of every operator. The holding period for all test calls was 120 seconds and gap between calls was 10 seconds.
For measuring voice quality RxQual samples for GSM operators and Frame Error Rate (FERs) for CDMA service providers were measured. RxQual greater than 5
meant that the sample was not of appropriate voice quality and for CDMA operators FERs of more than 4 were considered bad. Call drops were measured by the
number of calls that were dropped to the total number of calls established during the drive test. Similarly CSSR was measured as the ratio of total calls established to
the total call attempts made. Signal strength was measured in Dbm with strength > -75 dbm for indoor, -85 dbm for in-vehicle and > -95 dbm outdoor routes.
The schedule and operators involved in the operator assisted drive test for Assam circle are given below.

TRAI Audit Wireless Report-Assam Circle JFM Quarter-2015
75
7.1.1 JANUARY - DIBRUGARH SSA
7.1.1.1 ROUTE DETAILS - DIBRUGARH SSA
The route maps given in the report are provided for the purpose of identifying the routes traversed during the drive tests. We may observe three different colours
(Red/Green/Yellow) of the lines, which signify signal strength; however these maps are for a single operator and have not been referred to any findings in this report.
IMRB submits detailed operator wise Drive Test reports separately.
7.1.1.2 KILOMETERS TRAVELLED- DIBRUGARH SSA

TRAI Audit Wireless Report-Assam Circle JFM Quarter-2015
76
7.1.1.3 ROUTE MAP - DIBRUGARH DAY 1
Day 1 – Within City
Rx Level Plot- Day 1 Date of Drive Test- 28/01/2015 Name of SDCAs Covered- Dibrugarh
Part 1
Part 3
Part 2
Part 4
Part 1
Part 2
Part 4 Part 3
Route Covered-Day 1 1- PHOOL BAGAAN,
CHAUNKIDINGNI, MILAN NAGAR, POLICE CHOWK, AMOLAPATTY,
MEDICAL COLLEGE
2- PALTAN BAZAAR,
3- MALWADIPATTY

TRAI Audit Wireless Report-Assam Circle JFM Quarter-2015
77
Day 1 – Highways
Rx Level Plot- Day 1Date of Drive Test-28/01/2015Name of SDCAs Covered- Dibrugarh(Highway Drive)
Nearest site is near about 4.5 km so coverage fluctuated
Rajgarh RTL site was down so coverage fluctuated
Route Covered-Day 1
1- DIBRUGARH
,MORANHAT,
BARBORA
2- RAJGARH
3- NAHARKATIYA

TRAI Audit Wireless Report-Assam Circle JFM Quarter-2015
78
7.1.1.4 ROUTE MAP - DIBRUGARH DAY 2
Day 2 – Within City
Rx Level Plot- Day 2Date of Drive Test- 29/1/2015Name of SDCAs Covered- Digboi
Part 1
Part 3
Part 2
Part 4
Route Covered-Day 2
1- DIGBOI MARKET
2- DURGABADI
3- OIL INDIA SUPER MARKET
4-OIL INDIA CIVIL HOSPITAL
OIL INDIA OFFICE
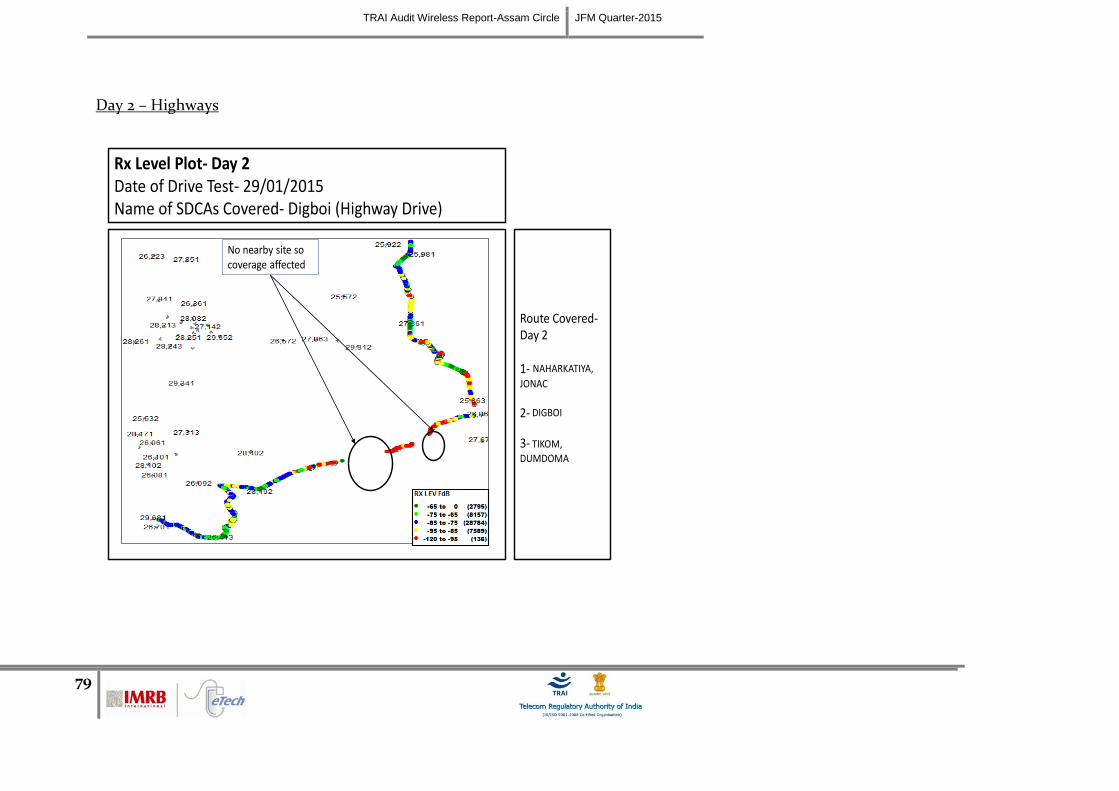
TRAI Audit Wireless Report-Assam Circle JFM Quarter-2015
79
Day 2 – Highways
Rx Level Plot- Day 2Date of Drive Test- 29/01/2015Name of SDCAs Covered- Digboi (Highway Drive)
No nearby site so coverage affected
Route Covered-Day 2
1- NAHARKATIYA,
JONAC
2- DIGBOI
3- TIKOM,
DUMDOMA

TRAI Audit Wireless Report-Assam Circle JFM Quarter-2015
80
7.1.1.5 ROUTE MAP - DIBRUGARH DAY 3
Day 3 – Within City
Rx Level Plot- Day 3Date of Drive Test- 30/01/2015Name of SDCAs Covered- Tinsukia
Part 2
Part 3
Part 1
Part 4
Route Covered-Day 3
1- TINSUKIYA, MALL
ROAD, MARUTI HOTEL
2- POLICE CHOWK
3- CENTRAL
MARKET, RAILWAY STATION

TRAI Audit Wireless Report-Assam Circle JFM Quarter-2015
81
Day 3 – Highways
Rx Level Plot- Day 3Date of Drive Test- 30/01/2015Name of SDCAs Covered- Tinsukia Highway Drive
GPS issueRoute Covered-Day 3
1- DUMDONA,
MAKOM
2- PANITOLA,
CHUBAYA
3- DIKOM,
DIBRUGARH

TRAI Audit Wireless Report-Assam Circle JFM Quarter-2015
82
7.1.1.6 DRIVE TEST RESULTS - DIBRUGARH SSA
Data Source: Drive test reports submitted by operators to auditors
Voice Quality
BSNL GSM failed to meet the benchmark in outdoor as well as indoor locations. BSNL CDMA and Reliance GSM did not meet the benchmark in outdoor locations.
Call Set Success Rate (CSSR)
All operators met the benchmark for CSSR in outdoor as well as indoor locations.
Call Drop Rate
BSNL CDMA and BSNL GSM failed to meet the benchmark in outdoor locations.

TRAI Audit Wireless Report-Assam Circle JFM Quarter-2015
83
7.1.2 FEBRUARY – KAMRUP SSA
7.1.2.1 ROUTE DETAILS – KAMRUP SSA
The route maps given in the report are provided for the purpose of identifying the routes traversed during the drive tests. We may observe three different colours
(Red/Green/Yellow) of the lines, which signify signal strength; however these maps are for a single operator and have not been referred to any findings in this report.
IMRB submits detailed operator wise Drive Test reports separately.
7.1.2.2 KILOMETERS TRAVELLED– KAMRUP SSA

TRAI Audit Wireless Report-Assam Circle JFM Quarter-2015
84
7.1.2.3 ROUTE MAP KAMRUP DAY 1
Day 1 – Within City
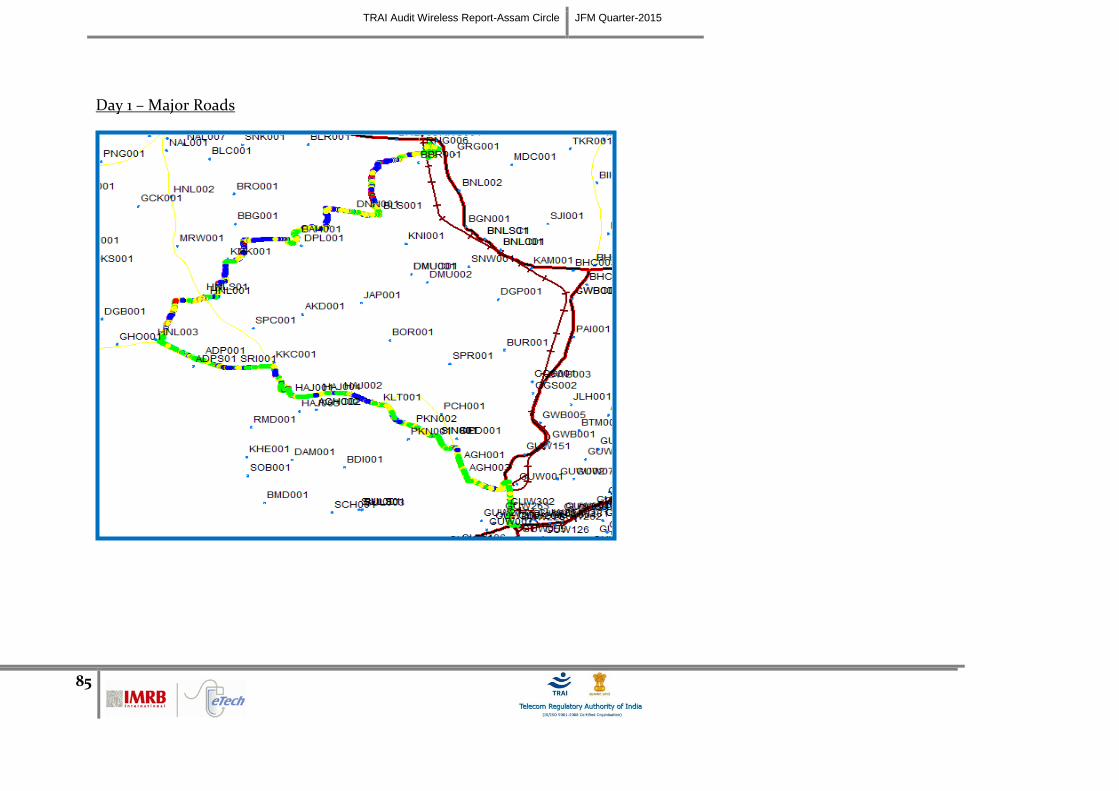
TRAI Audit Wireless Report-Assam Circle JFM Quarter-2015
85
Day 1 – Major Roads

TRAI Audit Wireless Report-Assam Circle JFM Quarter-2015
86
7.1.2.4 ROUTE MAP KAMRUP DAY 2
Day 2 – Within City

TRAI Audit Wireless Report-Assam Circle JFM Quarter-2015
87
Day 2 – Highways

TRAI Audit Wireless Report-Assam Circle JFM Quarter-2015
88
Day 2 – Major Roads

TRAI Audit Wireless Report-Assam Circle JFM Quarter-2015
89
7.1.2.5 ROUTE MAP KAMRUP DAY 3
Day 3 – Within City

TRAI Audit Wireless Report-Assam Circle JFM Quarter-2015
90
Day 3 – Highways

TRAI Audit Wireless Report-Assam Circle JFM Quarter-2015
91
7.1.2.6 DRIVE TEST RESULTS – KAMRUP SSA
Data Source: Drive test reports submitted by operators to auditors
Voice Quality
Aircel, Airtel, BSNL CDMA, BSNL GSM, Reliance GSM and Vodafone did not meet the benchmark of 95% in outdoor areas.
Call Set Success Rate (CSSR)
BSNL CDMA and Reliance GSM failed to meet the benchmark in outdoor locations.
Call Drop Rate
BSNL CDMA and BSNL GSM failed to meet the benchmark in outdoor areas.

TRAI Audit Wireless Report-Assam Circle JFM Quarter-2015
92
7.1.3 MARCH – SILCHAR SSA
7.1.3.1 ROUTE DETAILS – SILCHAR SSA
The route maps given in the report are provided for the purpose of identifying the routes traversed during the drive tests. We may observe three different colours
(Red/Green/Yellow) of the lines, which signify signal strength; however these maps are for a single operator and have not been referred to any findings in this report.
IMRB submits detailed operator wise Drive Test reports separately.
7.1.3.2 KILOMETERS TRAVELLED – SILCHAR SSA

TRAI Audit Wireless Report-Assam Circle JFM Quarter-2015
93
7.1.3.3 ROUTE MAP SILCHAR DAY 1
Day 1 – Within City

TRAI Audit Wireless Report-Assam Circle JFM Quarter-2015
94
Day 1 – Highways
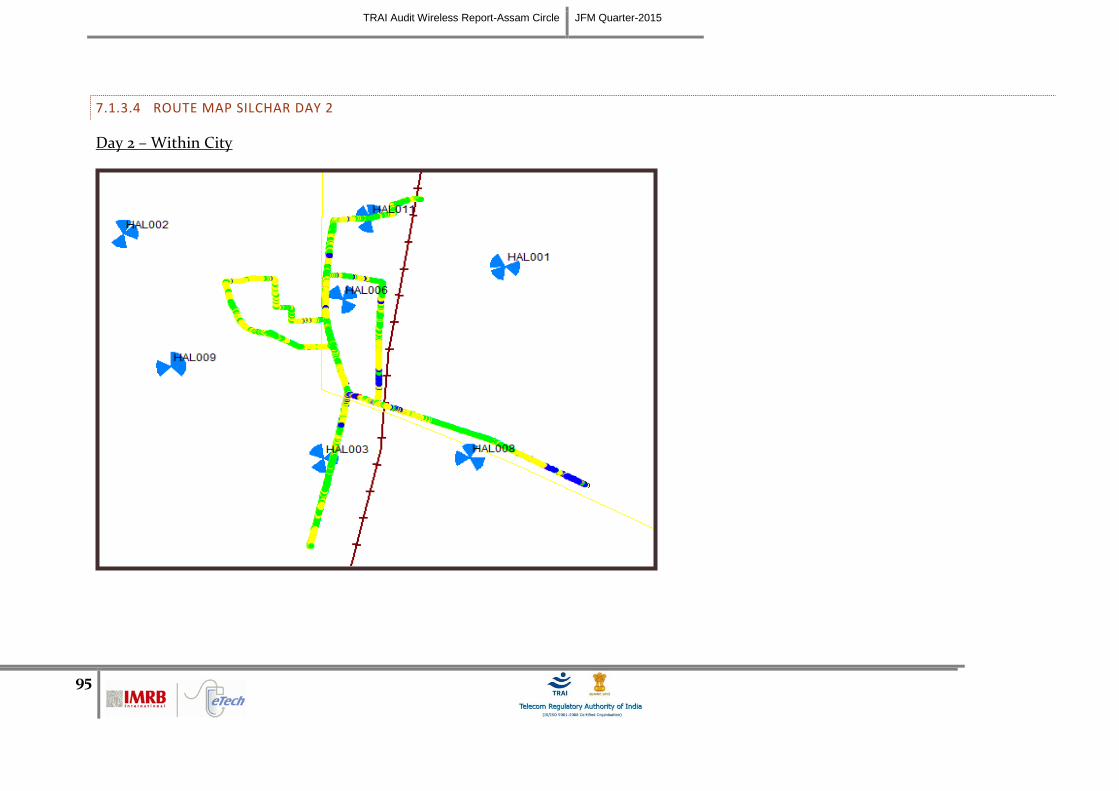
TRAI Audit Wireless Report-Assam Circle JFM Quarter-2015
95
7.1.3.4 ROUTE MAP SILCHAR DAY 2
Day 2 – Within City

TRAI Audit Wireless Report-Assam Circle JFM Quarter-2015
96
Day 2 – Highways

TRAI Audit Wireless Report-Assam Circle JFM Quarter-2015
97
7.1.3.5 ROUTE MAP SILCHAR DAY 3
Day 3 – Within City

TRAI Audit Wireless Report-Assam Circle JFM Quarter-2015
98
Day 3 – Highways

TRAI Audit Wireless Report-Assam Circle JFM Quarter-2015
99
7.1.3.6 DRIVE TEST RESULTS – SILCHAR SSA
Data Source: Drive test reports submitted by operators to auditors
Voice Quality
BSNL CDMA, BSNL GSM, Idea, Reliance GSM and Vodafone failed to meet the benchmark in outdoor areas.
Call Set Success Rate (CSSR)
BSNL CDMA and BSNL GSM failed to meet the benchmark in outdoor locations.
Call Drop Rate
BSNL CDMA and BSNL GSM failed to meet the benchmark in outdoor locations.

TRAI Audit Wireless Report-Assam Circle JFM Quarter-2015
100

TRAI Audit Wireless Report-Assam Circle JFM Quarter-2015
101
8 ANNEXURE - CONSOLIDATED
8.1 NETWORK AVAILABILITY
Data Source: Operations and Maintenance Center (OMC) of the operators

TRAI Audit Wireless Report-Assam Circle JFM Quarter-2015
102
8.2 CONNECTION ESTABLISHMENT (ACCESSIBILITY)
Data Source: Network Operations Center (NOC) of the operators

TRAI Audit Wireless Report-Assam Circle JFM Quarter-2015
103
Data Source: Network Operations Center (NOC) of the operators
Data Source: Drive test reports submitted by operators to auditors

TRAI Audit Wireless Report-Assam Circle JFM Quarter-2015
104
8.3 CONNECTION MAINTENANCE (RETAINABILITY)
Data Source: Network Operations Center (NOC) of the operators and Drive test reports submitted by operators to auditors

TRAI Audit Wireless Report-Assam Circle JFM Quarter-2015
105
Data Source: Network Operations Center (NOC) of the operators and Drive test reports submitted by operators to auditors

TRAI Audit Wireless Report-Assam Circle JFM Quarter-2015
106
8.4 VOICE QUALITY
Data Source: Network Operations Center (NOC) of the operators and Drive test reports submitted by operators to auditors

TRAI Audit Wireless Report-Assam Circle JFM Quarter-2015
107
8.5 POI CONGESTION
Data Source: Network Operations Center (NOC) of the operators

TRAI Audit Wireless Report-Assam Circle JFM Quarter-2015
108
Note: Auditors were not able to get the POI data from BSNL CDMA as the operator has been using the POI of BSNL GSM.
8.6 TOTAL CALL MADE DURING THE DRIVE TEST-VOICE QUALITY
Data Source: Drive test reports submitted by operators to auditos

TRAI Audit Wireless Report-Assam Circle JFM Quarter-2015
109
8.7 METERING AND BILLING CREDIBILITY
Data Source: Billing Center of the operators

TRAI Audit Wireless Report-Assam Circle JFM Quarter-2015
110
Data Source: Billing Center of the operators

TRAI Audit Wireless Report-Assam Circle JFM Quarter-2015
111
Data Source: Billing Center of the operators

TRAI Audit Wireless Report-Assam Circle JFM Quarter-2015
112
Data Source: Billing Center of the operators

TRAI Audit Wireless Report-Assam Circle JFM Quarter-2015
113
Data Source: Billing Center of the operators

TRAI Audit Wireless Report-Assam Circle JFM Quarter-2015
114
8.8 CUSTOMER CARE
Data Source: Customer Service Center of the operators
Data Source: Customer Service Center of the operators

TRAI Audit Wireless Report-Assam Circle JFM Quarter-2015
115
Data Source: Live calls made by auditors from operator’s network
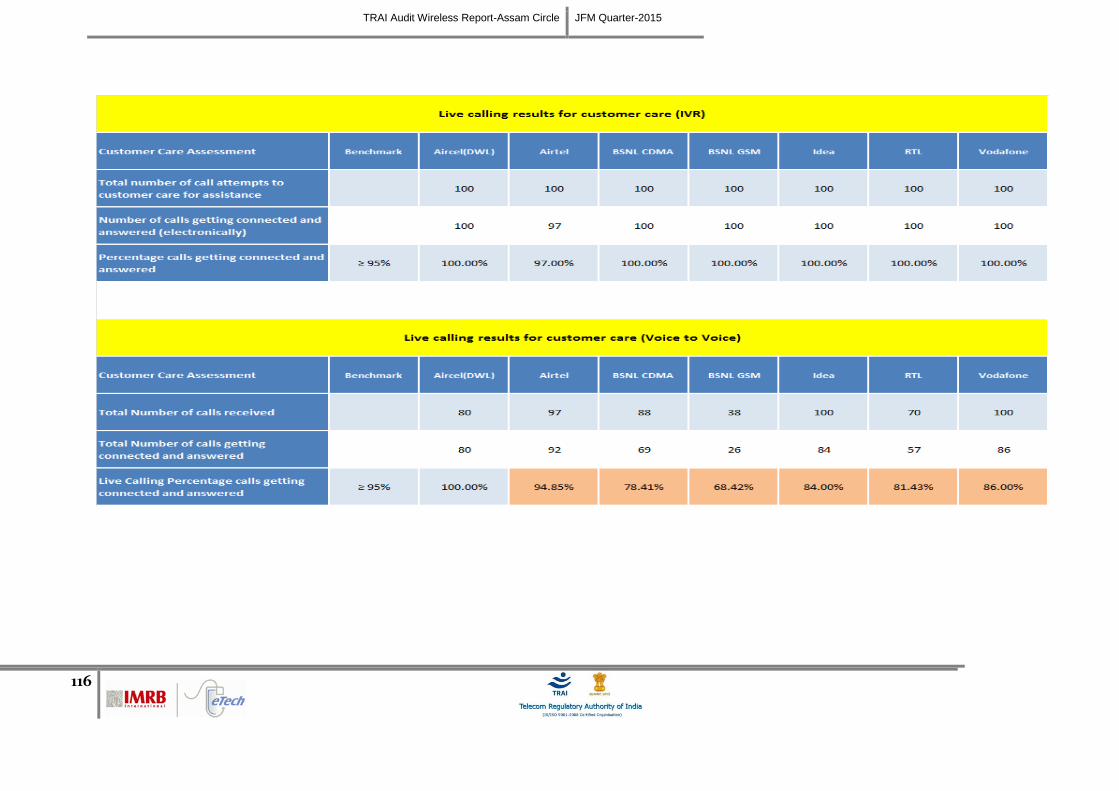
TRAI Audit Wireless Report-Assam Circle JFM Quarter-2015
116

TRAI Audit Wireless Report-Assam Circle JFM Quarter-2015
117
8.9 TERMINATION / CLOSURE OF SERVICE
Data Source: Customer Service Center of the operators
8.10 TIME TAKEN FOR REFUND OF DEPOSITS AFTER CLOSURE
Data Source: Billing Center of the operators

TRAI Audit Wireless Report-Assam Circle JFM Quarter-2015
118
8.11 ADDITIONAL NETWORK RELATED PARAMETERS
Data Source: Network Operations Center (NOC) of the operators
8.12 LIVE CALLING RESULTS FOR RESOLUTION OF SERVICE REQUESTS
Data Source: Live calls made by auditors from operator’s network
Note: Auditors were not able to get the raw data for live calling from the central customer service center of BSNL CDMA as the operator was unable to provide the
same due to low base of service complaints.

TRAI Audit Wireless Report-Assam Circle JFM Quarter-2015
119
8.13 LIVE CALLING RESULTS FOR LEVEL 1 SERVICES
Data Source: Live calls made by auditors from operator’s network

TRAI Audit Wireless Report-Assam Circle JFM Quarter-2015
120
8.14 LEVEL 1 SERVICE CALLS MADE
All the numbers given in mandatory list in Section 2.4.2.4.1 were tested. The following table provides
the numbers that are activated for each operator. A tick () for an operator signifies that the number
was active for the operator.
Live calls were made to the active numbers to test the calls answered. The details of the same have been
given below for each operator.
Aircel
Level 1 Number
Type of Service Working Not
Working Calls
Made Calls
Connected
100 Police 15 14
101 Fire
102 Ambulance 14 13
104 Health Information Helpline
108 Emergency and Disaster Management
Helpline 15 14
138 All India Helpine for Passangers 14 13
149 Public Road Transport Utility Service
181 Chief Minister Helpline
182 Indian Railway Security Helpline 14 13
1033 Road Accident Management Service
1037 Public Grievance Cell DoT Hq as 'Telecom Consumer Grievance Redressal Helpline'
1056 Emergency Medical Services
106X State of the Art Hospitals
1063 Public Grievance Cell DoT Hq 12 12
1064 Anti Corruption Helpline
1070 Relief Commission for Natural Calamities
1071 Air Accident Helpline
1072 Rail Accident Helpline
1073 Road Accident Helpline
1077 Control Room for District Collector 12 12
1090 Call Alart ( Crime Branch)
1091 Women Helpline
1097 National AIDS Helpline to NACO 13 13
1099 Central Accident and Trauma Services (CATS)
10580 Educationa & Vocational Guidance and
Counselling
10589 Mother and Child Tracking ( MCTH)
10740 Central Pollution Control Board
10741 Pollution Control Board
1511 Police Related Service for all Metro Railway
Project
1512 Prevention of Crime in Railway
1514 National Career Service(NCS)
15100 Free Legal Service Helpline
155304 Municipal Corporations
155214 Labour Helpline
1903 Sashastra Seema Bal (SSB) 14 14
1909 National Do Not Call Registry 14 14
1912 Complaint of Electricity 13 13
1916 Drinking Water Supply

TRAI Audit Wireless Report-Assam Circle JFM Quarter-2015
121
1950 Election Commission of India
Airtel
Level 1 Number
Type of Service Working Not
Working Calls
Made Calls
Connected
100 Police 14 14
101 Fire
102 Ambulance 13 13
104 Health Information Helpline 14 14
108 Emergency and Disaster Management
Helpline 14 14
138 All India Helpine for Passangers 15 15
149 Public Road Transport Utility Service
181 Chief Minister Helpline
182 Indian Railway Security Helpline
1033 Road Accident Management Service
1037 Public Grievance Cell DoT Hq as 'Telecom Consumer Grievance Redressal Helpline'
1056 Emergency Medical Services
106X State of the Art Hospitals
1063 Public Grievance Cell DoT Hq 13 13
1064 Anti Corruption Helpline
1070 Relief Commission for Natural Calamities 13 13
1071 Air Accident Helpline
1072 Rail Accident Helpline 14 14
1073 Road Accident Helpline
1077 Control Room for District Collector
1090 Call Alart ( Crime Branch)
1091 Women Helpline
1097 National AIDS Helpline to NACO 13 13
1099 Central Accident and Trauma Services (CATS)
10580 Educationa & Vocational Guidance and
Counselling
10589 Mother and Child Tracking ( MCTH)
10740 Central Pollution Control Board
10741 Pollution Control Board
1511 Police Related Service for all Metro Railway
Project
1512 Prevention of Crime in Railway 14 14
1514 National Career Service(NCS)
15100 Free Legal Service Helpline
155304 Municipal Corporations
155214 Labour Helpline
1903 Sashastra Seema Bal (SSB)
1909 National Do Not Call Registry 13 13
1912 Complaint of Electricity
1916 Drinking Water Supply
1950 Election Commission of India
BSNL CDMA
Level 1 Number
Type of Service Working Not
Working Calls
Made Calls
Connected
100 Police 18 18
101 Fire
102 Ambulance
104 Health Information Helpline 16 16
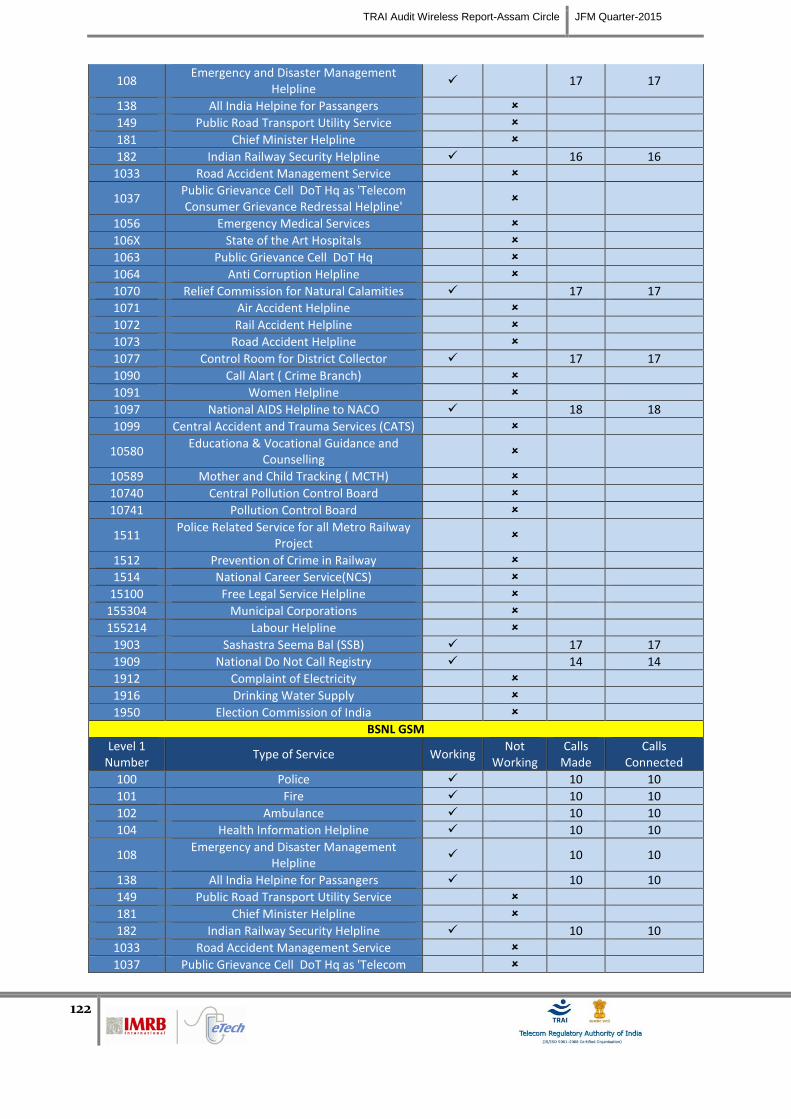
TRAI Audit Wireless Report-Assam Circle JFM Quarter-2015
122
108 Emergency and Disaster Management
Helpline 17 17
138 All India Helpine for Passangers
149 Public Road Transport Utility Service
181 Chief Minister Helpline
182 Indian Railway Security Helpline 16 16
1033 Road Accident Management Service
1037 Public Grievance Cell DoT Hq as 'Telecom Consumer Grievance Redressal Helpline'
1056 Emergency Medical Services
106X State of the Art Hospitals
1063 Public Grievance Cell DoT Hq
1064 Anti Corruption Helpline
1070 Relief Commission for Natural Calamities 17 17
1071 Air Accident Helpline
1072 Rail Accident Helpline
1073 Road Accident Helpline
1077 Control Room for District Collector 17 17
1090 Call Alart ( Crime Branch)
1091 Women Helpline
1097 National AIDS Helpline to NACO 18 18
1099 Central Accident and Trauma Services (CATS)
10580 Educationa & Vocational Guidance and
Counselling
10589 Mother and Child Tracking ( MCTH)
10740 Central Pollution Control Board
10741 Pollution Control Board
1511 Police Related Service for all Metro Railway
Project
1512 Prevention of Crime in Railway
1514 National Career Service(NCS)
15100 Free Legal Service Helpline
155304 Municipal Corporations
155214 Labour Helpline
1903 Sashastra Seema Bal (SSB) 17 17
1909 National Do Not Call Registry 14 14
1912 Complaint of Electricity
1916 Drinking Water Supply
1950 Election Commission of India
BSNL GSM
Level 1 Number
Type of Service Working Not
Working Calls
Made Calls
Connected
100 Police 10 10
101 Fire 10 10
102 Ambulance 10 10
104 Health Information Helpline 10 10
108 Emergency and Disaster Management
Helpline 10 10
138 All India Helpine for Passangers 10 10
149 Public Road Transport Utility Service
181 Chief Minister Helpline
182 Indian Railway Security Helpline 10 10
1033 Road Accident Management Service
1037 Public Grievance Cell DoT Hq as 'Telecom

TRAI Audit Wireless Report-Assam Circle JFM Quarter-2015
123
Consumer Grievance Redressal Helpline'
1056 Emergency Medical Services
106X State of the Art Hospitals
1063 Public Grievance Cell DoT Hq
1064 Anti Corruption Helpline
1070 Relief Commission for Natural Calamities 10 10
1071 Air Accident Helpline
1072 Rail Accident Helpline
1073 Road Accident Helpline
1077 Control Room for District Collector 10 10
1090 Call Alart ( Crime Branch) 10 10
1091 Women Helpline
1097 National AIDS Helpline to NACO 10 10
1099 Central Accident and Trauma Services (CATS)
10580 Educationa & Vocational Guidance and
Counselling
10589 Mother and Child Tracking ( MCTH)
10740 Central Pollution Control Board
10741 Pollution Control Board
1511 Police Related Service for all Metro Railway
Project
1512 Prevention of Crime in Railway
1514 National Career Service(NCS)
15100 Free Legal Service Helpline 10 10
155304 Municipal Corporations
155214 Labour Helpline
1903 Sashastra Seema Bal (SSB) 10 10
1909 National Do Not Call Registry 10 10
1912 Complaint of Electricity 10 10
1916 Drinking Water Supply
1950 Election Commission of India
Idea
Level 1 Number
Type of Service Working Not
Working Calls
Made Calls
Connected
100 Police 15 15
101 Fire 15 15
102 Ambulance
104 Health Information Helpline
108 Emergency and Disaster Management
Helpline 15 15
138 All India Helpline for Passangers
149 Public Road Transport Utility Service
181 Chief Minister Helpline
182 Indian Railway Security Helpline 15 15
1033 Road Accident Management Service
1037 Public Grievance Cell DoT Hq as 'Telecom Consumer Grievance Redressal Helpline'
1056 Emergency Medical Services
106X State of the Art Hospitals
1063 Public Grievance Cell DoT Hq
1064 Anti Corruption Helpline
1070 Relief Commission for Natural Calamities
1071 Air Accident Helpline
1072 Rail Accident Helpline

TRAI Audit Wireless Report-Assam Circle JFM Quarter-2015
124
1073 Road Accident Helpline
1077 Control Room for District Collector 15 15
1090 Call Alart ( Crime Branch)
1091 Women Helpline
1097 National AIDS Helpline to NACO 15 15
1099 Central Accident and Trauma Services (CATS)
10580 Educationa & Vocational Guidance and
Counselling
10589 Mother and Child Tracking ( MCTH)
10740 Central Pollution Control Board
10741 Pollution Control Board
1511 Police Related Service for all Metro Railway
Project
1512 Prevention of Crime in Railway
1514 National Career Service(NCS)
15100 Free Legal Service Helpline 15 15
155304 Municipal Corporations
155214 Labour Helpline
1903 Sashastra Seema Bal (SSB) 15 15
1909 National Do Not Call Registry 15 15
1912 Complaint of Electricity 15 15
1916 Drinking Water Supply
1950 Election Commission of India
Reliance
Level 1 Number
Type of Service Working Not
Working Calls
Made Calls
Connected
100 Police 10 10
101 Fire
102 Ambulance 10 10
104 Health Information Helpline 10 10
108 Emergency and Disaster Management
Helpline 10 10
138 All India Helpine for Passangers 10 10
149 Public Road Transport Utility Service
181 Chief Minister Helpline
182 Indian Railway Security Helpline 10 10
1033 Road Accident Management Service
1037 Public Grievance Cell DoT Hq as 'Telecom Consumer Grievance Redressal Helpline'
1056 Emergency Medical Services
106X State of the Art Hospitals
1063 Public Grievance Cell DoT Hq
1064 Anti Corruption Helpline
1070 Relief Commission for Natural Calamities 10 10
1071 Air Accident Helpline
1072 Rail Accident Helpline
1073 Road Accident Helpline
1077 Control Room for District Collector 10 10
1090 Call Alart ( Crime Branch)
1091 Women Helpline
1097 National AIDS Helpline to NACO 10 10
1099 Central Accident and Trauma Services (CATS)
10580 Educationa & Vocational Guidance and
Counselling

TRAI Audit Wireless Report-Assam Circle JFM Quarter-2015
125
10589 Mother and Child Tracking ( MCTH)
10740 Central Pollution Control Board
10741 Pollution Control Board
1511 Police Related Service for all Metro Railway
Project N
1512 Prevention of Crime in Railway 10 10
1514 National Career Service(NCS) N
15100 Free Legal Service Helpline 10 10
155304 Municipal Corporations
155214 Labour Helpline
1903 Sashastra Seema Bal (SSB) 10 10
1909 National Do Not Call Registry 10 10
1912 Complaint of Electricity 10 10
1916 Drinking Water Supply 10 10
1950 Election Commission of India
Vodafone
Level 1 Number
Type of Service Working Not
Working Calls
Made Calls
Connected
100 Police 11 11
101 Fire
102 Ambulance 11 11
104 Health Information Helpline 11 11
108 Emergency and Disaster Management
Helpline 11 11
138 All India Helpine for Passangers 10 10
149 Public Road Transport Utility Service
181 Chief Minister Helpline
182 Indian Railway Security Helpline 10 10
1033 Road Accident Management Service
1037 Public Grievance Cell DoT Hq as 'Telecom Consumer Grievance Redressal Helpline'
1056 EmergenMedical Services
106X State of the Art Hospitals
1063 Public Grievance Cell DoT Hq 11 11
1064 Anti Corruption Helpline
1070 Relief Commission for Natural Calamities 11 11
1071 Air Accident Helpline
1072 Rail Accident Helpline
1073 Road Accident Helpline
1077 Control Room for District Collector 10 10
1090 Call Alart ( Crime Branch)
1091 Women Helpline
1097 National AIDS Helpline to NACO 10 10
1099 Central Accident and Trauma Services (CATS)
10580 Educationa & Vocational Guidance and
Counselling
10589 Mother and Child Tracking ( MCTH)
10740 Central Pollution Control Board
10741 Pollution Control Board
1511 Police Related Service for all Metro Railway
Project
1512 Prevention of Crime in Railway 11 11
1514 National Career Service(NCS)
15100 Free Legal Service Helpline

TRAI Audit Wireless Report-Assam Circle JFM Quarter-2015
126
155304 Municipal Corporations
155214 Labour Helpline
1903 Sashastra Seema Bal (SSB) 11 11
1909 National Do Not Call Registry 11 11
1912 Complaint of Electricity 11 11
1916 Drinking Water Supply
1950 Election Commission of India

TRAI Audit Wireless Report-Assam Circle JFM Quarter-2015
127
Data Source: Live calls made by auditors from operator’s network
8.15 COUNTER DETAILS
Sl No. KPI Formula with Counter Description
1 CSSR= (No of established Calls / No of Attempted
Calls)%
No of established Calls = ([Assignment Requests]-([Failed Assignments (Signaling Channel)]+[Failed Assignments during MOC on the A Interface (Including Directed Retry)]+[Failed Assignments during MTC on the A Interface (Including Directed Retry)]+[Failed Assignments during Emergency Call on the A Interface (Including Directed Retry)] +[Failed Assignments during Call Re-establishment on the A Interface (Including Directed Retry)]+[Failed Mode
Modify Attempts (MOC) (TCHF)]+[Failed Mode Modify Attempts (MTC) (TCHF)]+[Failed Mode Modify Attempts (Emergency Call) (TCHF)]+[Failed Mode Modify Attempts (Call Re-establishment) (TCHF)]+[Failed Mode Modify Attempts (MOC) (TCHH)]+[Failed Mode Modify Attempts (MTC) (TCHH)]+[Failed
Mode Modify Attempts (Call Re-establishment) (TCHH)]))/No of Attempted Calls = ([Assignment Requests (Signaling Channel) (TCH)] + [Assignment Requests (Signaling Channel) (SDCCH)] + [Assignment Requests (TCHF Only)] + [Assignment Requests (TCHH Only)] + [Assignment Requests (TCHF
Preferred, Channel Type Unchangeable)] + [Assignment Requests (TCHH Preferred, Channel Type Unchangeable)] + [Assignment Requests (TCHF or TCHH, Channel Type Unchangeable)] + [Assignment Requests (TCHF Preferred, Channel Type Changeable)] + [Assignment Requests (TCHH Preferred, Channel
Type Changeable)] + [Assignment Requests (TCHF or TCHH, Channel Type Changeable)])
2 SDCCH congestion=
(SDCCH Failure/SDCCH attempts)%
SDCCH Failure= ([Channel Assignment Failures (All Channels Busy or Channels Unconfigured) in Immediate Assignment Procedure (SDCCH)] + [Failed Internal Intra-Cell Handovers (No Channel Available) (SDCCH)] + [Number of Unsuccessful Incoming Internal Inter-Cell Handovers (No Channel Available)
(SDCCH)] + [Failed Incoming External Inter-Cell Handovers (No Channel Available) (SDCCH)])/SDCCH attempts = ([Channel Assignment Requests in Immediate Assignment Procedure (SDCCH)] + [Internal Intra-Cell Handover Requests (SDCCH)] + [Number of Incoming Internal Inter-Cell Handover Requests (SDCCH) (900/850/810-900/850/810)] + [Number of Incoming Internal Inter-Cell Handover Requests (SDCCH) (1800/1900-1800/1900)] +
[Number of Incoming Internal Inter-Cell Handover Requests (SDCCH) (900/850/810-1800/1900)] + [Number of Incoming Internal Inter-Cell Handover Requests (SDCCH) (1800/1900-900/850/810)] + [Incoming External Inter-Cell Handover Requests (SDCCH) (900/850/810-900/850/810)] + [Incoming External Inter-Cell Handover Requests (SDCCH) (1800/1900-1800/1900)] + [Incoming External Inter-Cell Handover Requests (SDCCH) (900/850/810-
1800/1900)] + [Incoming External Inter-Cell Handover Requests (SDCCH) (1800/1900-900/850/810)])
3 TCH congestion= (TCH
Failures /TCH Attempts)%
TCH Failures= ((Failed TCH Seizures due to Busy TCH (Signaling Channel)+([Failed Assignments (First Assignment, No Channel Available in Assignment Procedure)]+[Failed Assignments (First Assignment, No Channel Available in Directed Retry Procedure)]+[Failed Assignments (Reconnection to Old
Channels, No Channel Available in Assignment)]+[Failed Assignments (Reconnection to Old Channels, No Channel Available in Directed Retry)])/TCH Attempts = ([Assignment Requests (Signaling Channel) (TCH)] + [Assignment Requests (Signaling Channel) (SDCCH)] + [Assignment Requests (TCHF Only)] + [Assignment Requests (TCHH Only)] + [Assignment Requests (TCHF Preferred, Channel Type Unchangeable)] + [Assignment Requests (TCHH Preferred, Channel Type Unchangeable)] + [Assignment Requests (TCHF or TCHH, Channel Type Unchangeable)] + [Assignment Requests (TCHF Preferred, Channel
Type Changeable)] + [Assignment Requests (TCHH Preferred, Channel Type Changeable)] + [Assignment Requests (TCHF or TCHH, Channel Type

TRAI Audit Wireless Report-Assam Circle JFM Quarter-2015
128
Changeable)])
4
Call Drop Rate= (The total no of dropped
calls*100)/Total no of calls successfully
established (where traffic channel is allotted)
The total no of dropped calls= ([Call Drops on Radio Interface in Stable State (Traffic Channel)] + [Call Drops on Radio Interface in Handover State (Traffic Channel)] + [Call Drops Due to No MR from MS for a Long Time (Traffic Channel)] + [Call Drops due to Abis Terrestrial Link Failure (Traffic Channel)] + [Call
Drops due to Equipment Failure (Traffic Channel)] + [Call Drops due to Forced Handover (Traffic Channel)] + [Call Drops due to local switching Start Failure] + [Call Drops due to Failures to Return to Normal Call from local switching])/Total no of calls successfully established (where traffic channel is allotted) = ([Assignment Requests]-([Failed Assignments (Signaling Channel)]+[Failed Assignments during MOC on the A Interface (Including Directed Retry)]+[Failed Assignments during MTC on the A Interface (Including Directed Retry)]+[Failed Assignments during Emergency Call on the A Interface
(Including Directed Retry)] +[Failed Assignments during Call Re-establishment on the A Interface (Including Directed Retry)]+[Failed Mode Modify Attempts (MOC) (TCHF)]+[Failed Mode Modify Attempts (MTC) (TCHF)]+[Failed Mode Modify Attempts (Emergency Call) (TCHF)]+[Failed Mode Modify Attempts (Call Re-establishment) (TCHF)]+[Failed Mode Modify Attempts (MOC) (TCHH)]+[Failed Mode Modify Attempts (MTC) (TCHH)]+[Failed Mode
Modify Attempts (Call Re-establishment) (TCHH)])
5
Call Drop Rate= (No of cells having call drop rate
>3% during CBBH in a month*100)/Total no of
cells in the licensed service area
Above formula with counters being used in CBBH.
6
Connection with good quality voice= (Connection
with good quality voice/Total voice
samples)%
Connection with good quality voice = ((Number of MRs on Downlink TCHF (Receive Quality Rank 0)+Number of MRs on Downlink TCHF (Receive Quality Rank 1)+Number of MRs on Downlink TCHF (Receive Quality Rank 2)+Number of MRs on Downlink TCHF (Receive Quality Rank 3)+Number of MRs on
Downlink TCHF (Receive Quality Rank 4)+Number of MRs on Downlink TCHF (Receive Quality Rank 5)+Number of MRs on Downlink TCHH (Receive Quality Rank 0)+Number of MRs on Downlink TCHH (Receive Quality Rank 1)+Number of MRs on Downlink TCHH (Receive Quality Rank 2)+Number of
MRs on Downlink TCHH (Receive Quality Rank 3)+Number of MRs on Downlink TCHH (Receive Quality Rank 4)+Number of MRs on Downlink TCHH (Receive Quality Rank 5)) /Total voice samples= ((Number of MRs on Downlink TCHF (Receive Quality Rank 0)+Number of MRs on Downlink TCHF (Receive Quality Rank 1)+Number of MRs on Downlink TCHF (Receive Quality Rank 2)+Number of MRs on Downlink TCHF (Receive Quality Rank 3)+Number of MRs on Downlink TCHF (Receive Quality Rank 4)+Number of MRs on Downlink TCHF (Receive Quality Rank 5)+Number of MRs on
Downlink TCHF (Receive Quality Rank 6)+Number of MRs on Downlink TCHF (Receive Quality Rank 7)+Number of MRs on Downlink TCHH (Receive Quality Rank 0)+:Number of MRs on Downlink TCHH (Receive Quality Rank 1)+Number of MRs on Downlink TCHH (Receive Quality Rank 2)+Number of
MRs on Downlink TCHH (Receive Quality Rank 3)+Number of MRs on Downlink TCHH (Receive Quality Rank 4)+Number of MRs on Downlink TCHH

TRAI Audit Wireless Report-Assam Circle JFM Quarter-2015
129
(Receive Quality Rank 5)+Number of MRs on Downlink TCHH (Receive Quality Rank 6)+Number of MRs on Downlink TCHH (Receive Quality Rank 7))
8.15.1 ERICSSON
Ericsson provides network support to Vodafone, Aircel, Idea and Reliance GSM in the circle.
Sl No. KPI Ericsson
1 CSSR= (No of established Calls / No of Attempted Calls)%
CSSR (No of established Calls / No of Attempted Calls)=(TCASSALL/TASSALL)*100
2 SDCCH congestion= (SDCCH Failure/SDCCH attempts)%
SDCCH congestion (SDCCH Failure/SDCCH attempts)% = (CCONGS/CCALLS)*100
3 TCH congestion= (TCH Failures /TCH Attempts)%
TCH congestion (TCH Failures /TCH Attempts)%= (CNRELCONG+TNRELCONG)/TASSALL)*100
4
Call Drop Rate= (The total no of dropped calls*100)/Total no of calls successfully established (where traffic channel is allotted)
Call Drop Rate (Total no dropped calls/No of established calls)%= (TNDROP)/TCASSALL*100

TRAI Audit Wireless Report-Assam Circle JFM Quarter-2015
130
5
Call Drop Rate= (No of cells having call drop rate >3% during CBBH in a month*100)/Total no of cells in the licensed service area
Above formula with counters being used in CBBH.
6
Connection with good quality voice= (Connection with good quality voice/Total voice samples)%
Connection with good quality voice (Connection with good quality voice samples 0-5 /Total voice samples)= 100 * (QUAL50DL + QUAL40DL + QUAL30DL + QUAL20DL + QUAL10DL + QUAL00DL) / (QUAL70DL + QUAL60DL + QUAL50DL + QUAL40DL + QUAL30DL + QUAL20DL + QUAL10DL + QUAL00DL)
Ericsson Counters
Counter Counter Description
TCASSALL Number of assignment complete messages on TCH for all MS classes
TASSALL Number of first assignment attempts on TCH for all MS classes.
CNRELCONG Number of released connections on SDCCH due to TCH or Transcoder (TRA) congestion.
TNRELCONG Number of released TCH signalling connections due to transcoder resource congestion during immediate assignment on TCH
CCONGS Congestion counter for SDCCH. Stepped per congested allocation attempt.
CCALLS Channel allocation attempt counter on SDCCH.
TNDROP The total number of dropped TCH Connections.
QUAL00DL Number of quality 0 reported on downlink.
QUAL10DL Number of quality 1 reported on downlink.
QUAL20DL Number of quality 2 reported on downlink.
QUAL30DL Number of quality 3 reported on downlink.
QUAL40DL Number of quality 4 reported on downlink.
QUAL50DL Number of quality 5 reported on downlink.
QUAL60DL Number of quality 6 reported on downlink.
QUAL70DL Number of quality 7 reported on downlink.

TRAI Audit Wireless Report-Assam Circle JFM Quarter-2015
131
8.15.2 NSN (NOKIA SIEMENS NETWORKS)
NSN provides network support to Airtel in the circle.
Sl No. KPI NSN
1 CSSR= (No of established Calls / No of
Attempted Calls)%
CSSR= 100-100*((SDCCH_BUSY_ATT)-(TCH_SEIZ_DUE_SDCCH_CON) + (SDCCH_RADIO_FAIL)+(SDCCH_RF_OLD_HO)+(SDCCH_USER_ACT)+(SDCCH_BCSU_RESET)+(SDCCH_NETW_ACT)+(SDCCH_BTS_FAIL)+(SDCCH_LAPD_FAIL)+ (BLCK_8I_NOM)/ {(CH_REQ_MSG_REC)+(PACKET_CH_REQ)}-
{(GHOST_CCCH_RES)-(REJ_SEIZ_ATT_DUE_DIST)}
2 SDCCH congestion= (SDCCH Failure/SDCCH attempts)%
SDCCH congestion = (sdcch_busy_att - .tch_seiz_due_sdcch_con)/{(CH_REQ_MSG_REC)+(PACKET_CH_REQ)}-{(GHOST_CCCH_RES)-(REJ_SEIZ_ATT_DUE_DIST)}
3 TCH congestion= (TCH Failures /TCH
Attempts)% TCH congestion = BLCK_8I_NOM / {(TCH_NORM_SEIZ)+(MSC_I_SDCCH_TCH_AT)+(BSC_I_SDCCH_TCH_AT)}
4
Call Drop Rate= (The total no of dropped calls*100)/Total no of calls successfully
established (where traffic channel is allotted)
TCH Drop = ( drop_after_tch_assign)-(tch_re_est_release) / {(TCH_NORM_SEIZ)+(MSC_I_SDCCH_TCH_AT)+(BSC_I_SDCCH_TCH_AT)}
5
Call Drop Rate= (No of cells having call drop rate >3% during CBBH in a
month*100)/Total no of cells in the licensed service area
Above formula with counters being used in CBBH.
6 Connection with good quality voice=
(Connection with good quality voice/Total voice samples)%
Connection with good quality voice= (FREQ_DL_QUAL0+FREQ_DL_QUAL1+FREQ_DL_QUAL2+FREQ_DL_QUAL3+FREQ_DL_QUAL4+FREQ_DL_QUAL
5) / (FREQ_DL_QUAL0+FREQ_DL_QUAL1+FREQ_DL_QUAL2+FREQ_DL_QUAL3+FREQ_DL_QUAL4+FREQ_DL_QUAL
5+FREQ_DL_QUAL6+FREQ_DL_QUAL7)

TRAI Audit Wireless Report-Assam Circle JFM Quarter-2015
132

TRAI Audit Wireless Report-Assam Circle JFM Quarter-2015
133
9 ANNEXURE – JANUARY
PERFORMANCE REPORTS - PARAMETER WISE
1. Network Availability
Audit Results for Network Availability- PMR data-January Benchmark Aircel(DWL) Airtel BSNL CDMA BSNL GSM Idea Reliance GSM Vodafone
Number of BTSs in the licensed service area
2601 3274 242 1344 1212 1569 2941
Sum of downtime of BTSs in a month (in hours)
63523 3939 24102 25632 3233 3786 12456
BTSs accumulated downtime (not available for service)
≤ 2% 3.28% 0.16% 13.39% 2.56% 0.36% 0.32% 0.57%
Number of BTSs having accumulated downtime >24 hours
449 25 58 93 8 27 49
Worst affected BTSs due to downtime ≤ 2% 17.26% 0.76% 23.97% 6.92% 0.66% 1.72% 1.67%
Live Measurement Results for Network Availability- 3 Day live data-January Benchmark Aircel(DWL) Airtel BSNL CDMA BSNL GSM Idea Reliance GSM Vodafone
Number of BTSs in the licensed service area
2588 3274 242 1344 1212 1569 2941
Sum of downtime of BTSs in a month (in hours)
5846 353 2308 2286 343 387 899
BTSs accumulated downtime (not available for service)
≤ 2% 3.14% 0.15% 13.25% 2.36% 0.39% 0.34% 0.42%
Number of BTSs having accumulated 61 0 12 19 5 27 3
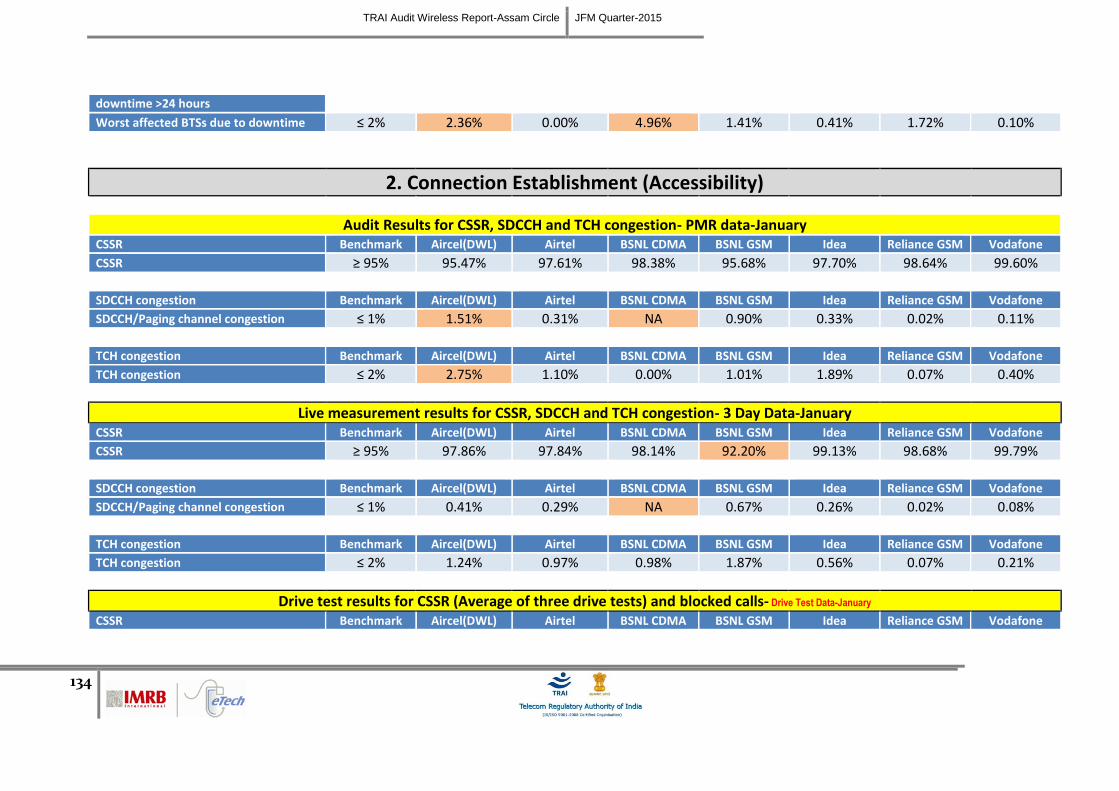
TRAI Audit Wireless Report-Assam Circle JFM Quarter-2015
134
downtime >24 hours
Worst affected BTSs due to downtime ≤ 2% 2.36% 0.00% 4.96% 1.41% 0.41% 1.72% 0.10%
2. Connection Establishment (Accessibility)
Audit Results for CSSR, SDCCH and TCH congestion- PMR data-January CSSR Benchmark Aircel(DWL) Airtel BSNL CDMA BSNL GSM Idea Reliance GSM Vodafone
CSSR ≥ 95% 95.47% 97.61% 98.38% 95.68% 97.70% 98.64% 99.60%
SDCCH congestion Benchmark Aircel(DWL) Airtel BSNL CDMA BSNL GSM Idea Reliance GSM Vodafone
SDCCH/Paging channel congestion ≤ 1% 1.51% 0.31% NA 0.90% 0.33% 0.02% 0.11%
TCH congestion Benchmark Aircel(DWL) Airtel BSNL CDMA BSNL GSM Idea Reliance GSM Vodafone
TCH congestion ≤ 2% 2.75% 1.10% 0.00% 1.01% 1.89% 0.07% 0.40%
Live measurement results for CSSR, SDCCH and TCH congestion- 3 Day Data-January CSSR Benchmark Aircel(DWL) Airtel BSNL CDMA BSNL GSM Idea Reliance GSM Vodafone
CSSR ≥ 95% 97.86% 97.84% 98.14% 92.20% 99.13% 98.68% 99.79%
SDCCH congestion Benchmark Aircel(DWL) Airtel BSNL CDMA BSNL GSM Idea Reliance GSM Vodafone
SDCCH/Paging channel congestion ≤ 1% 0.41% 0.29% NA 0.67% 0.26% 0.02% 0.08%
TCH congestion Benchmark Aircel(DWL) Airtel BSNL CDMA BSNL GSM Idea Reliance GSM Vodafone
TCH congestion ≤ 2% 1.24% 0.97% 0.98% 1.87% 0.56% 0.07% 0.21%
Drive test results for CSSR (Average of three drive tests) and blocked calls- Drive Test Data-January CSSR Benchmark Aircel(DWL) Airtel BSNL CDMA BSNL GSM Idea Reliance GSM Vodafone

TRAI Audit Wireless Report-Assam Circle JFM Quarter-2015
135
Total number of call attempts 413 398 425 377 405 281 405 Total number of successful calls established
409 398 413 366 398 272 405
CSSR ≥ 95% 99.03% 100.00% 97.18% 97.08% 98.27% 96.80% 100.00%
Blocked calls Benchmark Aircel(DWL) Airtel BSNL CDMA BSNL GSM Idea Reliance GSM Vodafone
%age blocked calls 0.97% 0.00% 2.82% 2.92% 1.73% 3.20% 0.00%
3. Connection Maintenance (Retainability)
Audit Results for Call drop rate and for number of cells having more than 3% TCH-PMR data-January Call drop rate Benchmark Aircel(DWL) Airtel BSNL CDMA BSNL GSM Idea Reliance GSM Vodafone
Total number of calls established 179402673 190040204 679075 450979447 25955791 60742151 3929499
Total number of calls dropped 2933755 1939478 9942 9109785 348427 408968 21369
Call drop rate ≤ 2% 1.64% 1.02% 1.46% 2.02% 1.34% 0.67% 0.54%
Cells having more than 3% TCH Benchmark Aircel(DWL) Airtel BSNL CDMA BSNL GSM Idea Reliance GSM Vodafone
Total number of cells in the network 7651 9806 687 3981 3637 4798 8858 Total number of cells having more than 3% TCH
1160 97 69 173 42 5 238
Worst affected cells having more than 3% TCH
≤ 3% 15.16% 0.99% 10.04% 4.35% 1.15% 0.10% 2.69%
Live measurement results for Call drop rate and for number of cells having more than 3% TCH- 3 Day data-January Call drop rate Benchmark Aircel(DWL) Airtel BSNL CDMA BSNL GSM Idea Reliance GSM Vodafone
Total number of calls established 205736853 19072871 59838 45429678 30637701 7932272 2081940
Total number of calls dropped 2670789 172602 1111 1053968 308457 50148 9539
Call drop rate ≤ 2% 1.30% 0.90% 1.86% 2.32% 1.01% 0.63% 0.46%

TRAI Audit Wireless Report-Assam Circle JFM Quarter-2015
136
Cells having more than 3% TCH Benchmark Aircel(DWL) Airtel BSNL CDMA BSNL GSM Idea Reliance GSM Vodafone
Total number of cells in the network 7677 9849 687 3981 3637 4798 8858 Total number of cells having more than 3% TCH
1007 83 47 266 43 5 235
Worst affected cells having more than 3% TCH
≤ 3% 13.12% 0.84% 6.84% 6.68% 1.18% 0.10% 2.65%
Drive test results for Call drop rate (Average of three drive tests) - Drive Test Data-January Call drop rate Benchmark Aircel(DWL) Airtel BSNL CDMA BSNL GSM Idea Reliance GSM Vodafone
Total number of calls established 409 398 413 366 398 272 405
Total number of calls dropped 0 0 17 9 0 3 0
Call drop rate ≤ 2% 0.00% 0.00% 4.12% 2.46% 0.00% 1.10% 0.00%
4. Voice quality
Audit Results for Voice quality -PMR Data-January Voice quality Benchmark Aircel(DWL) Airtel BSNL CDMA BSNL GSM Idea Reliance GSM Vodafone
Total number of sample calls 18479052580 19970868124 78816 61117 3428976017 8942055918 692503935 Total number of calls with good voice quality
16758833966 19669227114 74769 56616 3263110311 8788974682 679771648
%age calls with good voice quality ≥ 95% 90.69% 98.49% 94.87% 92.64% 95.16% 98.29% 98.16%
Live measurement results for Voice quality-3 Day data-January Voice quality Benchmark Aircel(DWL) Airtel BSNL CDMA BSNL GSM Idea Reliance GSM Vodafone
Total number of sample calls 19714907414 2003046689 78816 61117 3540443449 1099385384 350564087 Total number of calls with good voice quality
18310106075 1974253400 74769 56616 3392879672 1079979554 345561045

TRAI Audit Wireless Report-Assam Circle JFM Quarter-2015
137
%age calls with good voice quality ≥ 95% 92.87% 98.56% 94.87% 92.64% 95.83% 98.23% 98.57%
Drive test results for Voice quality (Average of three drive tests) - DT data-January Voice quality Benchmark Aircel(DWL) Airtel BSNL CDMA BSNL GSM Idea Reliance GSM Vodafone
Total number of sample calls 613404 627832 78816 548126 653686 564319 691613 Total number of calls with good voice quality
588720 604883 74769 500157 625584 522033 666825
%age calls with good voice quality ≥ 95% 95.98% 96.34% 94.87% 91.25% 95.70% 92.51% 96.42%
5. POI Congestion
Audit Results for POI Congestion- PMR data-January POI congestion Benchmark Aircel(DWL) Airtel BSNL CDMA BSNL GSM Idea Reliance GSM Vodafone
Total number of working POIs 51 15 0 19 30 23 28
No. of POIs not meeting benchmark 0 0 0 0 0 0 0
Total Capacity of all POIs (A) - in erlangs 86669 103472 0 19643 21836 30624 59993259
Traffic served for all POIs (B)- in erlangs 57141 35502 0 19305 17147 19794 15701337
POI congestion ≤ 0.5% 0.00% 0.00% 0.00% 0.00% 0.00% 0.00% 0.00%
Live Measurement Results for POI Congestion- 3 Day data-January POI congestion Benchmark Aircel(DWL) Airtel BSNL CDMA BSNL GSM Idea Reliance GSM Vodafone
Total number of working POIs 51 15 0 19 30 23 28
No. of POIs not meeting benchmark 0 0 0 0 0 0 0
Total Capacity of all POIs (A) - in erlangs 86669 103453 0 19643 21861 30624 6008811
Traffic served for all POIs (B)- in erlangs 58158 34030 0 17331 16117 19794 1586768
POI congestion ≤ 0.5% 0.00% 0.00% 0.00% 0.00% 0.00% 0.00% 0.00%

TRAI Audit Wireless Report-Assam Circle JFM Quarter-2015
138
10 ANNEXURE – FEBRUARY
PERFORMANCE REPORTS - PARAMETER WISE
1. Network Availability
Audit Results for Network Availability- PMR data-February Benchmark Aircel(DWL) Airtel BSNL CDMA BSNL GSM Idea Reliance GSM Vodafone
Number of BTSs in the licensed service area
2635 3284 243 1359 1218 1567 2982
Sum of downtime of BTSs in a month (in hours)
55469 2627 22503 18297 7023 3435 9172
BTSs accumulated downtime (not available for service)
≤ 2% 3.13% 0.12% 13.78% 2.00% 0.86% 0.33% 0.46%
Number of BTSs having accumulated downtime >24 hours
443 17 51 27 15 18 46
Worst affected BTSs due to downtime ≤ 2% 16.81% 0.52% 20.99% 1.99% 1.23% 1.15% 1.54%
Live Measurement Results for Network Availability- 3 Day live data-February Benchmark Aircel(DWL) Airtel BSNL CDMA BSNL GSM Idea Reliance GSM Vodafone
Number of BTSs in the licensed service area
2635 3274 242 1359 1213 1567 2982
Sum of downtime of BTSs in a month (in hours)
5200 222 2190 2009 877 3435 849
BTSs accumulated downtime (not available for service)
≤ 2% 2.74% 0.09% 12.57% 2.05% 1.00% 3.04% 0.40%
Number of BTSs having accumulated 52 0 6 4 13 18 2

TRAI Audit Wireless Report-Assam Circle JFM Quarter-2015
139
downtime >24 hours
Worst affected BTSs due to downtime ≤ 2% 1.97% 0.00% 2.48% 0.29% 1.07% 1.15% 0.07%
2. Connection Establishment (Accessibility)
Audit Results for CSSR, SDCCH and TCH congestion- PMR data-February CSSR Benchmark Aircel(DWL) Airtel BSNL CDMA BSNL GSM Idea Reliance GSM Vodafone
CSSR ≥ 95% 94.12% 97.15% 98.16% 96.17% 97.36% 98.57% 99.45%
SDCCH congestion Benchmark Aircel(DWL) Airtel BSNL CDMA BSNL GSM Idea Reliance GSM Vodafone
SDCCH/Paging channel congestion ≤ 1% 1.52% 0.65% NA 0.75% 0.57% 0.02% 0.14%
TCH congestion Benchmark Aircel(DWL) Airtel BSNL CDMA BSNL GSM Idea Reliance GSM Vodafone
TCH congestion ≤ 2% 4.11% 1.20% 0.00% 1.09% 1.94% 0.07% 0.55%
Live measurement results for CSSR, SDCCH and TCH congestion- 3 Day Data-February CSSR Benchmark Aircel(DWL) Airtel BSNL CDMA BSNL GSM Idea Reliance GSM Vodafone
CSSR ≥ 95% 97.79% 96.98% 97.84% 92.56% 99.07% 98.62% 99.76%
SDCCH congestion Benchmark Aircel(DWL) Airtel BSNL CDMA BSNL GSM Idea Reliance GSM Vodafone
SDCCH/Paging channel congestion ≤ 1% 0.53% 0.28% NA 0.44% 0.24% 0.02% 0.08%
TCH congestion Benchmark Aircel(DWL) Airtel BSNL CDMA BSNL GSM Idea Reliance GSM Vodafone
TCH congestion ≤ 2% 1.34% 1.56% 0.00% 1.54% 0.60% 0.06% 0.24%
Drive test results for CSSR (Average of three drive tests) and blocked calls- Drive Test Data-February CSSR Benchmark Aircel(DWL) Airtel BSNL CDMA BSNL GSM Idea Reliance GSM Vodafone

TRAI Audit Wireless Report-Assam Circle JFM Quarter-2015
140
Total number of call attempts 602 549 828 602 513 577 596 Total number of successful calls established
598 547 720 579 511 552 591
CSSR ≥ 95% 99.34% 99.64% 86.96% 96.18% 99.61% 95.67% 99.16%
Blocked calls Benchmark Aircel(DWL) Airtel BSNL CDMA BSNL GSM Idea Reliance GSM Vodafone
%age blocked calls 0.66% 0.36% 13.04% 3.82% 0.39% 4.33% 0.84%
3. Connection Maintenance (Retainability)
Audit Results for Call drop rate and for number of cells having more than 3% TCH-PMR data-February Call drop rate Benchmark Aircel(DWL) Airtel BSNL CDMA BSNL GSM Idea Reliance GSM Vodafone
Total number of calls established 160787808 178150354 531839 421256204 27149503 65329899 4115771
Total number of calls dropped 2494652 1641923 8641 7077104 355374 446824 22930
Call drop rate ≤ 2% 1.55% 0.92% 1.62% 1.68% 1.31% 0.68% 0.56%
Cells having more than 3% TCH Benchmark Aircel(DWL) Airtel BSNL CDMA BSNL GSM Idea Reliance GSM Vodafone
Total number of cells in the network 7804 9854 687 3981 3655 4798 8998 Total number of cells having more than 3% TCH
939 93 70 120 38 8 251
Worst affected cells having more than 3% TCH
≤ 3% 12.03% 0.94% 10.19% 3.01% 1.04% 0.17% 2.79%
Live measurement results for Call drop rate and for number of cells having more than 3% TCH- 3 Day data-February Call drop rate Benchmark Aircel(DWL) Airtel BSNL CDMA BSNL GSM Idea Reliance GSM Vodafone
Total number of calls established 195982600 19447414 39265 45529173 32355629 6258520 2104608
Total number of calls dropped 2370389 172362 410 878713 348956 40670 10218
Call drop rate ≤ 2% 1.21% 0.89% 1.04% 1.93% 1.08% 0.65% 0.49%

TRAI Audit Wireless Report-Assam Circle JFM Quarter-2015
141
Cells having more than 3% TCH Benchmark Aircel(DWL) Airtel BSNL CDMA BSNL GSM Idea Reliance GSM Vodafone
Total number of cells in the network 7759 9850 687 3981 3640 4798 8998 Total number of cells having more than 3% TCH
902 89 52 128 35 8 226
Worst affected cells having more than 3% TCH
≤ 3% 11.63% 0.90% 7.57% 3.22% 0.96% 0.17% 2.51%
Drive test results for Call drop rate (Average of three drive tests) - Drive Test Data-February Call drop rate Benchmark Aircel(DWL) Airtel BSNL CDMA BSNL GSM Idea Reliance GSM Vodafone
Total number of calls established 598 547 828 579 511 552 591
Total number of calls dropped 0 1 49 21 0 4 3
Call drop rate ≤ 2% 0.00% 0.18% 5.92% 3.63% 0.00% 0.72% 0.51%
4. Voice quality
Audit Results for Voice quality -PMR Data-February Voice quality Benchmark Aircel(DWL) Airtel BSNL CDMA BSNL GSM Idea Reliance GSM Vodafone
Total number of sample calls 18322850680 18064747285 59085 49377 3399572238 10066539646 729393100 Total number of calls with good voice quality
16808949493 17814497349 56115 46959 3231390108 9891632419 715998111
%age calls with good voice quality ≥ 95% 91.74% 98.61% 94.97% 95.10% 95.05% 98.26% 98.16%
Live measurement results for Voice quality-3 Day data-February Voice quality Benchmark Aircel(DWL) Airtel BSNL CDMA BSNL GSM Idea Reliance GSM Vodafone
Total number of sample calls 19988627533 1985289892 59085 49377 3694727635 1074366637 356923801 Total number of calls with good voice quality
18659277681 1957959555 56115 46959 3536638525 1054698745 351888130

TRAI Audit Wireless Report-Assam Circle JFM Quarter-2015
142
%age calls with good voice quality ≥ 95% 93.35% 98.62% 94.97% 95.10% 95.72% 98.17% 98.59%
Drive test results for Voice quality (Average of three drive tests) - DT data-February Voice quality Benchmark Aircel(DWL) Airtel BSNL CDMA BSNL GSM Idea Reliance GSM Vodafone
Total number of sample calls 840717 836839 59085 865289 796679 919227 926034 Total number of calls with good voice quality
802572 787037 56115 789546 768020 837217 877122
%age calls with good voice quality ≥ 95% 95.46% 94.05% 94.97% 91.25% 96.40% 91.08% 94.72%
5. POI Congestion
Audit Results for POI Congestion- PMR data-February POI congestion Benchmark Aircel(DWL) Airtel BSNL CDMA BSNL GSM Idea Reliance GSM Vodafone
Total number of working POIs 51 15 0 19 30 23 28
No. of POIs not meeting benchmark 0 0 0 0 0 0 0
Total Capacity of all POIs (A) - in erlangs 86729 105233 0 19643 24228 31701 56074902
Traffic served for all POIs (B)- in erlangs 60426 36253 0 20056 17790 20531 15071445
POI congestion ≤ 0.5% 0.00% 0.00% 0.00% 0.00% 0.00% 0.00% 0.00%
Live Measurement Results for POI Congestion- 3 Day data-February POI congestion Benchmark Aircel(DWL) Airtel BSNL CDMA BSNL GSM Idea Reliance GSM Vodafone
Total number of working POIs 51 16 0 19 30 23 28
No. of POIs not meeting benchmark 0 0 0 0 0 0 0
Total Capacity of all POIs (A) - in erlangs 86729 105440 0 19643 22172 31701 6008811
Traffic served for all POIs (B)- in erlangs 60563 36597 0 18212 17064 20531 1617287
POI congestion ≤ 0.5% 0.00% 0.00% 0.00% 0.00% 0.00% 0.00% 0.00%

TRAI Audit Wireless Report-Assam Circle JFM Quarter-2015
143
11 ANNEXURE – MARCH
PERFORMANCE REPORTS - PARAMETER WISE
1. Network Availability
Audit Results for Network Availability- PMR data-March Benchmark Aircel(DWL) Airtel BSNL CDMA BSNL GSM Idea Reliance GSM Vodafone
Number of BTSs in the licensed service area
2668 3297 243 1359 1288 1567 3128
Sum of downtime of BTSs in a month (in hours)
70703 2906 25723 18098 8206 3435 10295
BTSs accumulated downtime (not available for service)
≤ 2% 3.56% 0.12% 14.23% 1.79% 0.86% 0.29% 0.44%
Number of BTSs having accumulated downtime >24 hours
546 11 66 25 24 18 48
Worst affected BTSs due to downtime ≤ 2% 20.46% 0.33% 27.16% 1.84% 1.86% 1.15% 1.53%
Live Measurement Results for Network Availability- 3 Day live data-March Benchmark Aircel(DWL) Airtel BSNL CDMA BSNL GSM Idea Reliance GSM Vodafone
Number of BTSs in the licensed service area
2668 3281 243 1359 1288 1567 3128
Sum of downtime of BTSs in a month (in hours)
6785 182 2522 2003 645 3435 730
BTSs accumulated downtime (not available for service)
≤ 2% 3.53% 0.08% 14.41% 2.05% 0.70% 3.04% 0.32%
Number of BTSs having accumulated 70 0 7 4 17 18 3

TRAI Audit Wireless Report-Assam Circle JFM Quarter-2015
144
downtime >24 hours
Worst affected BTSs due to downtime ≤ 2% 2.62% 0.00% 2.88% 0.29% 1.32% 1.15% 0.10%
2. Connection Establishment (Accessibility)
Audit Results for CSSR, SDCCH and TCH congestion- PMR data-March CSSR Benchmark Aircel(DWL) Airtel BSNL CDMA BSNL GSM Idea Reliance GSM Vodafone
CSSR ≥ 95% 93.42% 97.69% 98.00% 96.03% 96.50% 98.62% 99.52%
SDCCH congestion Benchmark Aircel(DWL) Airtel BSNL CDMA BSNL GSM Idea Reliance GSM Vodafone
SDCCH/Paging channel congestion ≤ 1% 1.17% 0.39% NA 0.86% 0.83% 0.02% 0.13%
TCH congestion Benchmark Aircel(DWL) Airtel BSNL CDMA BSNL GSM Idea Reliance GSM Vodafone
TCH congestion ≤ 2% 4.93% 1.01% 0.00% 1.27% 1.69% 0.06% 0.48%
Live measurement results for CSSR, SDCCH and TCH congestion- 3 Day Data-March CSSR Benchmark Aircel(DWL) Airtel BSNL CDMA BSNL GSM Idea Reliance GSM Vodafone
CSSR ≥ 95% 97.59% 97.72% 98.26% 92.45% 99.05% 98.57% 99.84%
SDCCH congestion Benchmark Aircel(DWL) Airtel BSNL CDMA BSNL GSM Idea Reliance GSM Vodafone
SDCCH/Paging channel congestion ≤ 1% 0.63% 0.35% NA 0.40% 0.30% 0.02% 0.06%
TCH congestion Benchmark Aircel(DWL) Airtel BSNL CDMA BSNL GSM Idea Reliance GSM Vodafone
TCH congestion ≤ 2% 1.50% 0.99% 0.00% 1.84% 0.32% 0.07% 0.16%
Drive test results for CSSR (Average of three drive tests) and blocked calls- Drive Test Data-March CSSR Benchmark Aircel(DWL) Airtel BSNL CDMA BSNL GSM Idea Reliance GSM Vodafone

TRAI Audit Wireless Report-Assam Circle JFM Quarter-2015
145
Total number of call attempts 445 455 549 521 395 421 465 Total number of successful calls established
444 453 499 493 388 402 463
CSSR ≥ 95% 99.78% 99.56% 90.89% 94.63% 98.23% 95.49% 99.57%
Blocked calls Benchmark Aircel(DWL) Airtel BSNL CDMA BSNL GSM Idea Reliance GSM Vodafone
%age blocked calls 0.22% 0.44% 9.11% 5.37% 1.77% 4.51% 0.43%
3. Connection Maintenance (Retainability)
Audit Results for Call drop rate and for number of cells having more than 3% TCH-PMR data-March Call drop rate Benchmark Aircel(DWL) Airtel BSNL CDMA BSNL GSM Idea Reliance GSM Vodafone
Total number of calls established 187018237 199382255 524924 445652385 32322298 65329899 4053891
Total number of calls dropped 2876557 1644730 9877 8110873 396302 446824 21943
Call drop rate ≤ 2% 1.54% 0.82% 1.88% 1.82% 1.23% 0.68% 0.54%
Cells having more than 3% TCH Benchmark Aircel(DWL) Airtel BSNL CDMA BSNL GSM Idea Reliance GSM Vodafone
Total number of cells in the network 7921 9883 687 3981 3864 4798 9436 Total number of cells having more than 3% TCH
997 86 67 119 43 8 274
Worst affected cells having more than 3% TCH
≤ 3% 12.59% 0.87% 9.75% 2.99% 1.11% 0.17% 2.90%
Live measurement results for Call drop rate and for number of cells having more than 3% TCH- 3 Day data-March Call drop rate Benchmark Aircel(DWL) Airtel BSNL CDMA BSNL GSM Idea Reliance GSM Vodafone
Total number of calls established 204512522 19745388 50618 42722227 34299630 6258520 2171313
Total number of calls dropped 2370389 166382 952 850173 321545 40670 9335
Call drop rate ≤ 2% 1.16% 0.84% 1.88% 1.99% 0.94% 0.65% 0.43%

TRAI Audit Wireless Report-Assam Circle JFM Quarter-2015
146
Cells having more than 3% TCH Benchmark Aircel(DWL) Airtel BSNL CDMA BSNL GSM Idea Reliance GSM Vodafone
Total number of cells in the network 7883 9873 687 3981 3864 4798 9436 Total number of cells having more than 3% TCH
945 92 54 129 43 8 247
Worst affected cells having more than 3% TCH
≤ 3% 11.99% 0.93% 7.86% 3.24% 1.11% 0.17% 2.62%
Drive test results for Call drop rate (Average of three drive tests) - Drive Test Data-March Call drop rate Benchmark Aircel(DWL) Airtel BSNL CDMA BSNL GSM Idea Reliance GSM Vodafone
Total number of calls established 444 453 507 493 388 402 465
Total number of calls dropped 0 0 19 20 1 3 1
Call drop rate ≤ 2% 0.00% 0.00% 3.75% 4.06% 0.26% 0.75% 0.22%
4. Voice quality
Audit Results for Voice quality -PMR Data-March Voice quality Benchmark Aircel(DWL) Airtel BSNL CDMA BSNL GSM Idea Reliance GSM Vodafone
Total number of sample calls 21349097689 19232062888 47384 97534 3978465632 10066539646 760580377 Total number of calls with good voice quality
19590515109 18988488931 44868 93807 3780630286 9891632419 746870865
%age calls with good voice quality ≥ 95% 91.76% 98.73% 94.69% 96.18% 95.03% 98.26% 98.20%
Live measurement results for Voice quality-3 Day data-March Voice quality Benchmark Aircel(DWL) Airtel BSNL CDMA BSNL GSM Idea Reliance GSM Vodafone
Total number of sample calls 20798817096 1890298595 47384 97534 3856164457 1074366637 366925310 Total number of calls with good voice quality
19369495808 1866230145 44868 93807 3691356808 1054698745 361523124

TRAI Audit Wireless Report-Assam Circle JFM Quarter-2015
147
%age calls with good voice quality ≥ 95% 93.13% 98.73% 94.69% 96.18% 95.73% 98.17% 98.53%
Drive test results for Voice quality (Average of three drive tests) - DT data-March Voice quality Benchmark Aircel(DWL) Airtel BSNL CDMA BSNL GSM Idea Reliance GSM Vodafone
Total number of sample calls 705816 638971 47384 709383 699022 659401 708598 Total number of calls with good voice quality
672160 610422 44868 657608 661079 620376 658195
%age calls with good voice quality ≥ 95% 95.23% 95.53% 94.69% 92.70% 94.57% 94.08% 92.89%
5. POI Congestion
Audit Results for POI Congestion- PMR data-March POI congestion Benchmark Aircel(DWL) Airtel BSNL CDMA BSNL GSM Idea Reliance GSM Vodafone
Total number of working POIs 51 15 0 19 30 23 28
No. of POIs not meeting benchmark 0 0 0 0 0 0 0
Total Capacity of all POIs (A) - in erlangs 87905 104406 0 19643 30347 31590 62132270
Traffic served for all POIs (B)- in erlangs 62748 37543 0 21306 17822 21112 16848628
POI congestion ≤ 0.5% 0.00% 0.00% 0.00% 0.08% 0.00% 0.00% 0.00%
Live Measurement Results for POI Congestion- 3 Day data-March POI congestion Benchmark Aircel(DWL) Airtel BSNL CDMA BSNL GSM Idea Reliance GSM Vodafone
Total number of working POIs 51 16 0 19 30 23 28
No. of POIs not meeting benchmark 0 0 0 0 0 0 0
Total Capacity of all POIs (A) - in erlangs 86944 105536 0 19643 28946 31542 5957687
Traffic served for all POIs (B)- in erlangs 59584 37445 0 18628 17353 21811 1623470
POI congestion ≤ 0.5% 0.00% 0.00% 0.00% 0.00% 0.00% 0.00% 0.00%

TRAI Audit Wireless Report-Assam Circle JFM Quarter-2015
148
12 ABBREVIATIONS
Following terms/abbreviations have been used in this report. This section provides meaning of the
abbreviations used in the report.
1. TRAI – Telecom Regulatory Authority of India
2. QoS – Quality of Service
3. JFM’15 – Refers to the quarter of January, February and March 2015
4. IMRB – Refers to IMRB International, the audit agency for this report
5. SSA – Secondary Switching Area
6. NOC – Network Operation Center
7. OMC – Operations and Maintenance Center
8. MSC – Mobile Switching Center
9. PMR – Performance Monitoring Reports
10. TCBH – Time Consistent Busy Hour
11. CBBH - Cell Bouncing Busy Hour
12. BTS – Base Transceiver Station
13. CSSR – Call Setup Success Rate
14. TCH – Traffic Channel
15. SDCCH – Standalone Dedicated Control Channel
16. CDR – Call Drop Rate
17. FER – Frame Error Rate
18. SIM – Subscriber Identity Module
19. GSM – Global System for Mobile
20. CDMA – Code Division Multiple Access
21. NA – Not Applicable
22. NC – Non Compliance
23. POI – Point of Interconnection
24. IVR – Interactive Voice Response
25. STD – Standard Trunk Dialing
26. ISD – International Subscriber Dialing

TRAI Audit Wireless Report-Assam Circle JFM Quarter-2015
149
SCO 47, 5th
Floor, Old Judicial Complex, Sector 15
Part 1, Gurgaon, Haryana – 122001
+91 (124) 4217300
www.imrbint.com