training report 1
TRANSCRIPT

i
ACKNOWLEDGEMENTS
The experience gained through this industrial training program will be of a great value in
future career. I am fortunate to have my training in Project Engineering Institutional Consultant
Service in the Jaffna-Kilinochchi Water Supply and Sanitation Project in Jaffna. Several people have
provided considerable encouragement and assistance to complete my training successfully. First, a
special acknowledgement is going to the project leader for assigning me as a trainee in their
organization and for giving me extremely valuable advices to do my training. I have a great pleasure to
tell my sincere thanks to the all other staff members of the organization.
I would like to express my sincere gratitude to the Industrial Training Career Guidance Unit of the
Faculty of Engineering and the Head of the Civil Engineering Department, for organizing and
coordinating my industrial program and for having made it a success experience.
Thanks to my training mates who have given me encouragement and support in various ways during
the training period.
ABERATHNE A.S.T
E/11/003
Faculty of Engineering
University of Peradeniya

ii
CONTENTS
Acknowledgements i
Contents ii
List Of Figures iii
List Of Tables iv
List Of Attribute v
Chapter 1 INTRODUCTION
1.1 Project Background 1
1.2 Project Out Line 1
1.3 Project Objective 4
Chapter 2 SEWER SYSTEM DESIGN
2.1 Basic Design Procedure 5
2.2 General Topography 5
2.3 Key Strategy 5
2.4 Design Population 5
2.4 Design The Waste Water Load And Other Factors 7
Chapter 3 SEWER PIPE NETWORK DESIGN
3.1 Software Used 10
3.2 Network Design 10
3.3 Hydraulic Analysis Of The Proposed Sewerage System 10
3.4 Model Set-Up 10
3.5 Sewer Pipe Network 11
Chapter 4 PUMPING STATION AND SUB CATCHMENT
4.1Pump Station Selection Criteria 18
4.2 Submersible Pumping Station 18
4.3 Sub-Catchment Division Of Jaffna 19
4.4 Major PS Sub-Catchments 20
4.5 Medium PS Sub-Catchment 20
4.6 Small PS Sub-Catchment 21
Chapter 5 CHAMBER SURVEY
5.1 Introduction 23

iii
5.2 Inspection Chamber(IC) Marking 23
5.3 IC Survey 24
Chapter 6 ISSUES & RISKS
6.1Shallow Bed-Rock 25
6.2 Ground Water 25
Chapter 7 CONCLUSION 26

iv
LIST OF FIGURES
Figure 1.1 Project Area 2
Figure 1.2 Project Management Frame 3
Figure 2.1 Design Flow Chart 5
Figure 3.1 Proposed Man Hole 15
Figure 3.2 Proposed Inspection Chamber 16
Figure 4.1 Division Of Sub Catchment 20
Figure 4.2 Main Pumping Station 20
Figure 4.3 Medium Pumping Station 21
Figure 4.4 Small Pumping Station 21
Figure 4.5 Main Network 22
Figure 5.1 Location Of The IC Point 24
Figure 5.2 IC Survey Sample Sheet 24

v
LIST OF TABLE
Table 2.1 Catchment No. 2 Sewerage Flow Estimates
Based on Projected GND Populations 8
Table 3.1 Depth of flow in the sewer system 12
Table 3.2 Pipe Roughness Coefficients for Gravity Sewers 13
Table 3.3 Pipe Roughness Coefficients for Pumping Mains 13
Table 3.4 Approximate Self Cleansing Velocities for Conventional Sewers 14
Table 3.5 Maximum Manhole Spacing for conventional sewers 14
Table 4.1 Wet Well Operation Requirement 17
Table 9.1 Recommended Design Parameters for Pump Stations 18

vi
LIST OF ABBREVIATIONS
ABBREVATION DISCRIPTION
JKWSSP Jaffna-Kilinochchi Water Supply and Sanitation Project
WWTP Waste water treatment plant
MC Municipal council
ADB Asian development bank
AFD Agence Fancies development
GOSL Government of Sri Lanka
NWSDB National water supply and drainage board
GND Grama Niladari division
CW Colebrook White
GRP Glass-reinforced-plastic
IC Inspection chamber
HDPE High Density Poly Ethylene
GIS Geographic Information System
PWWF Peak Wet Weather Flow
DSS Desired Standards of Services
GRP Glass Reinforced Pipe
1
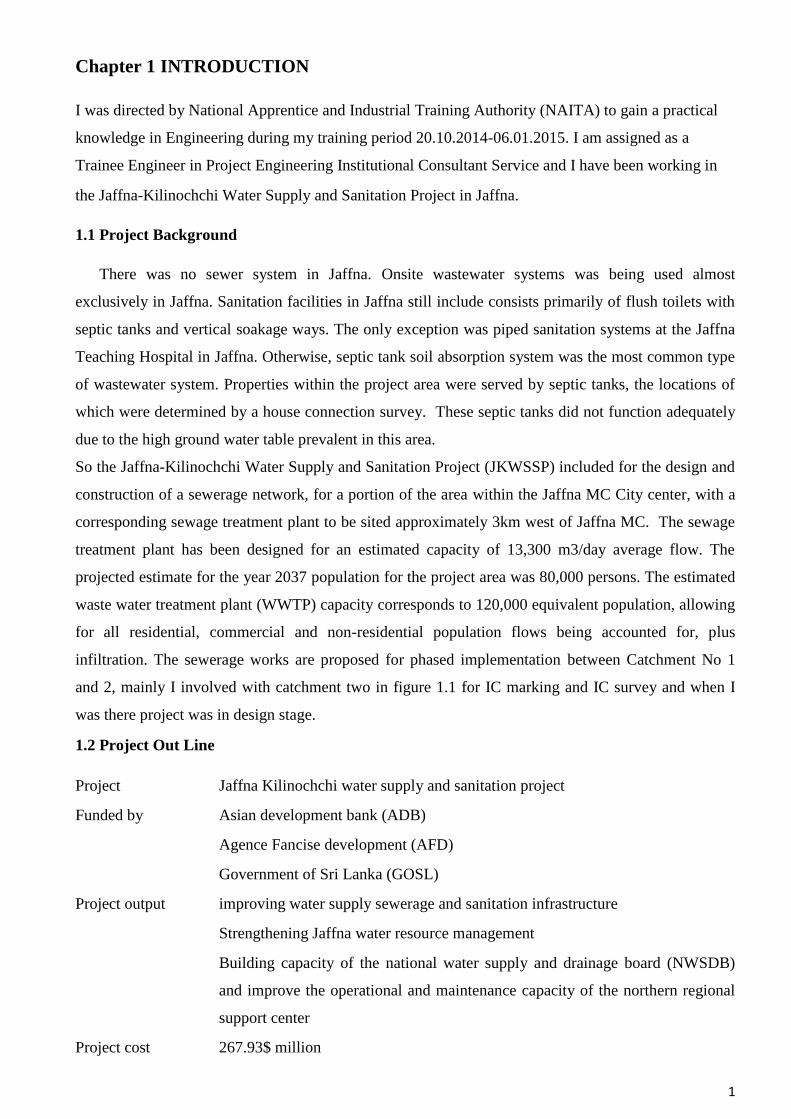
Chapter 1 INTRODUCTION
I was directed by National Apprentice and Industrial Training Authority (NAITA) to gain a practical
knowledge in Engineering during my training period 20.10.2014-06.01.2015. I am assigned as a
Trainee Engineer in Project Engineering Institutional Consultant Service and I have been working in
the Jaffna-Kilinochchi Water Supply and Sanitation Project in Jaffna.
1.1 Project Background
There was no sewer system in Jaffna. Onsite wastewater systems was being used almost
exclusively in Jaffna. Sanitation facilities in Jaffna still include consists primarily of flush toilets with
septic tanks and vertical soakage ways. The only exception was piped sanitation systems at the Jaffna
Teaching Hospital in Jaffna. Otherwise, septic tank soil absorption system was the most common type
of wastewater system. Properties within the project area were served by septic tanks, the locations of
which were determined by a house connection survey. These septic tanks did not function adequately
due to the high ground water table prevalent in this area.
So the Jaffna-Kilinochchi Water Supply and Sanitation Project (JKWSSP) included for the design and
construction of a sewerage network, for a portion of the area within the Jaffna MC City center, with a
corresponding sewage treatment plant to be sited approximately 3km west of Jaffna MC. The sewage
treatment plant has been designed for an estimated capacity of 13,300 m3/day average flow. The
projected estimate for the year 2037 population for the project area was 80,000 persons. The estimated
waste water treatment plant (WWTP) capacity corresponds to 120,000 equivalent population, allowing
for all residential, commercial and non-residential population flows being accounted for, plus
infiltration. The sewerage works are proposed for phased implementation between Catchment No 1
and 2, mainly I involved with catchment two in figure 1.1 for IC marking and IC survey and when I
was there project was in design stage.
1.2 Project Out Line
Project Jaffna Kilinochchi water supply and sanitation project
Funded by Asian development bank (ADB)
Agence Fancise development (AFD)
Government of Sri Lanka (GOSL)
Project output improving water supply sewerage and sanitation infrastructure
Strengthening Jaffna water resource management
Building capacity of the national water supply and drainage board (NWSDB)
and improve the operational and maintenance capacity of the northern regional
support center
Project cost 267.93$ million

2
Project implement by National water supply and drainage board
(NWSDB)
Consultancy by Grontmij A/S Denmark in association with HIFAB international(Sweden),
Greentech consultance(Pvt), Lanka Hydraulic institute (LTD)and total
Management solutions company(PVT)
Fig 1.1: Project Area

3
microbiologist
Institution development specialist
Social/ community mobility officer
Team leader
Deputy team leader (Water)
Legal officer
Deputy team leader
(Sewerage)
Ground water modeler
Water supply Engineer
Resident Engineer
Water network design modeling Engineer
Resettlement specialist
Architect QS IT officer Electrical-
mechanical Engineer
Water resource Engineer
Structural Engineer
Water supply Engineer
Water treatment Engineer
QS IT
office
Accounting finance specialist
Resident engineer
Environment specialist
Sewerage treatment specialist
Sewerage network engineer
Elect-Mechanical Engineer
QS Architect Training
Engineers IT officer
Fig 1.2 Project Management Frame

4
1.3 Project Objective
The purpose of this project was to produce efficient design for the implementation of the preferred
engineering solution, which is technically sound, cost effective, safe, constructible and maintainable.
The principal objectives of the design was as follows:
Design the new sewerage serving the Jaffna study area to discharge into the Kalundai WWTP.
Allow in the design for connection of future developments, if any.
Design the sewers to have some spare capacity to carry the maximum amount of 13,000 m3 per
day.
Design the sewers in such manner that a self-cleansing velocity would be achieved even if the
maximum amount of sewerage per day will not be achieved.
Design a pumping station in such manner that it could be used in future without any major
modifications.

5
Chapter 2 SEWER SYSTEM DESIGN
2.1 Basic Design Procedure
Fig 2.1 Design Flow Chart
Basic map of the catchment
area
Digitizing households, roads
other important feature of the
catchment area in GIS
Existing topography data
from survey department
Improved GIS map with
feature attributes
Population survey (estimate
to 2037)
Identification of sub
catchment , pumping
station ect.
Evaluation of the pumping
station locations, alternatives
and sociology and EIA evaluation
Conceptual sewer gems
model
Identification of IC
(inspection chamber)
for household
Topography survey for
household features and
IC
Improving model adjusting
sewer network
Optimizing network
(depth of cut satisfying
various constrains) for
individual sub catchment
Finalizing
pumping station
location
Improving GIS maps
Identification of missing
by roads (walk through
survey)
Topography survey
for the missing roads
and by lands

6
2.2 General Topography
The Jaffna Project Area was generally flat, that was, there was no obvious hills and valleys but rather
mounds and depressions which were not immediately obvious. For this reason, the natural policy of
gravitating flows to low points and then pumping to treatment was identified. In the absence of an
obvious solution such as would be the case in critical areas.
2.3 Key Strategy
The Strategy for the Project Area was” To provide effective (i.e. trouble free) sewerage scheme with
the minimum number of Pumping Stations thereby keeping operation and maintenance costs to a
minimum”.
The following key factors will be followed in preparing the sewerage design:
Evaluating the topography
Reviewing all existing and proposed services
Population and associated flow generation
Establishment of design criteria for sewer and pumping stations
Verifying catchment areas and establishing effects of any adjacent catchments and,
Preparing and evaluating appropriate sewerage options for approval and design
development
2.4 Design Population
A household capacity of 7.8 persons per current household was applied. This was larger than typical
person per household rates, in order to reflect the projected increase in population from 2011 and up to
the 2037 target year, due to population growth through e.g. subdivision of lots, increase in apartment
buildings, etc., in the future. The projected increase from 2011 to 2037 was estimated at 48%, and
thus the value of 7.8 reflected a current household capacity of 5.27 persons. After all residential
information is input to the model, plus buildings with large residential populations, the household
average capacity of 7.8 was finally adjusted. This adjustment was made such that the total populations
compare favourably against the projected 2037 domestic population estimated from the Supplementary
Sewerage Concept Design Report (which were based on projected actual 2011 GND populations).

7
2.4 Design The Waste Water Load And Other Factors
2.4.1 Sewerage Flow Estimates Based On GIS Survey Information
Sewer-GEMS hydraulic model incorporating all residential lots and non-residential inputs from GIS
information, with detailed populations and calculated sewage flows.
There was expected to be approximately 5,000 residential and non-residential lots. This data needed to
be input to the GIS-based model. Information required includes for details of houses, multi-story
residential apartment occupancy and commercial buildings’ employees, schools and students, hospitals
and beds, and other commercial and government institutions.
The hydraulic model summation results for domestic populations was compared against the projected
population estimates from GND’s , which were based on actual 2011 GND populations projected to
2037. This was carried out by adjusting the estimated criteria for average number of persons per
household within the model, as described below.
The sewerage model flows was based on the following criteria:
All domestic flows to be based on actual house-lots itemised from GIS information
Per capita water-use of 120 l/c/d (average day) with;
Sewerage capture rate of 80%, giving a generated sewage flow of 96 l/c/d;
Non-domestic flows input to the model via actual institutions, will be assigned water-use
criteria as follows:
The student University and Campus to be assigned a peak flow of approx. 51.5 l/sec;
Schools at 30 l/student/Ave day, including infiltration and allowance;
Commercial employees at 96 l/employee/day average day sewerage capture;
Hospitals, 250 l/hospital bed/day sewerage capture including allowance.
Buildings need to be identified through the GIS and be assigned population information to be
input to the model, such as commercial and residential buildings, churches, schools, hospitals,
and any other.
Peak flows are calculated using a Peak factor of 4 times the average flow;
Infiltration is applied at 15% of peak dry weather flow.
The Catchment No.2 main pump station capacity was expected to be approximately 245 l/sec.

8
Pumping main lengths and sizes were revised, and were confirmed by running the sewerage model.
Similarly, trunk sewer and gravity sewer sizes and lengths were revised, and confirmed following the
detailed inputs of the redirected sewers and pump station locations into the hydraulic model.
2.4.2 Sewerage Flow Estimates Based on Projected GND Populations
The sewerage flow estimates based on the populations projected to 2037 from each GND population
are shown in Table 2.1. An estimate of the University sewage flows was also included by using an
approximate 8,064 equivalent campus population. Non-domestic flows were not identified to date from
the GIS and not allocated to each individual GND. Flow estimates will increase after this information
is received, but for the calculation purpose, an estimate of 25% of domestic flow has been applied at
this time.
Table 2.1: Catchment No. 2 Sewerage Flow Estimates Based on Projected GND Populations
Ward (GND) Population Peak
Domestic
Flow (as
m3/day)
Non-
Domestic
No.
Peak
Non-
Domestic
Flow (as
m3/day)
Total
Peak
Sewerage
Flow (as
m3/day)
Total Peak
Sewerage
Flow (l/sec)
Navanthurai South 2,759 1,218 25% 305 1,523 17.63
Navanthurai North 699 309 25% 77 386 4.47
Moor Street North 1,877 829 25% 207 1,036 11.99
Moor Street South 2,274 1,004 25% 251 1,255 14.53
Iyanar Kovilady 2,553 1,127 25% 282 1,409 16.31
Vannarpannai
North 2,964 1,309
25% 327 1,636 18.94
Vannarpannai NW 3,908 1,726 25% 431 2,157 24.97
Vannarpannai NE 3,301 1,458 25% 364 1,822 21.09
Neeraviyady 2,207 975 25% 244 1,218 14.10
Kantharmadam
NW 2,650 1,170
25% 293 1,463 16.93
Kantharmadam NE 437 193 25% 48 241 2.79
Kantharmadam SW 764 337 25% 84 422 4.88
University 8,064 3,561 25% 890 4,451 51.5
9
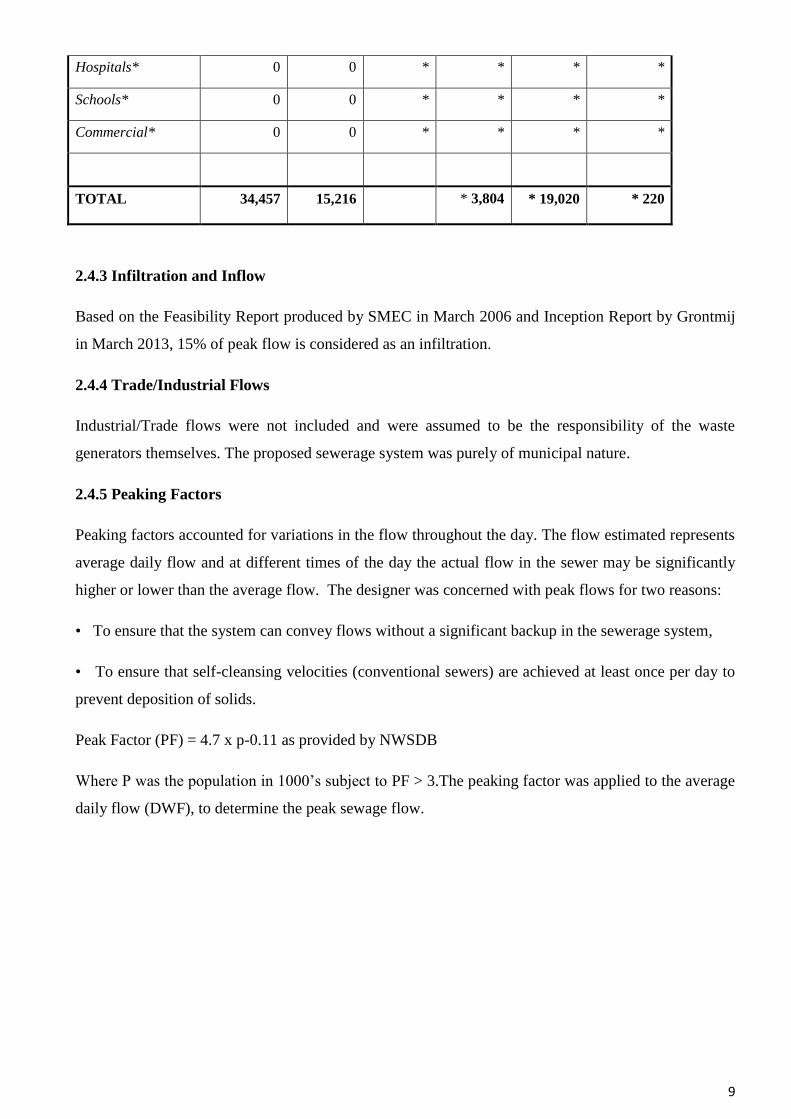
2.4.3 Infiltration and Inflow
Based on the Feasibility Report produced by SMEC in March 2006 and Inception Report by Grontmij
in March 2013, 15% of peak flow is considered as an infiltration.
2.4.4 Trade/Industrial Flows
Industrial/Trade flows were not included and were assumed to be the responsibility of the waste
generators themselves. The proposed sewerage system was purely of municipal nature.
2.4.5 Peaking Factors
Peaking factors accounted for variations in the flow throughout the day. The flow estimated represents
average daily flow and at different times of the day the actual flow in the sewer may be significantly
higher or lower than the average flow. The designer was concerned with peak flows for two reasons:
• To ensure that the system can convey flows without a significant backup in the sewerage system,
• To ensure that self-cleansing velocities (conventional sewers) are achieved at least once per day to
prevent deposition of solids.
Peak Factor (PF) = 4.7 x p-0.11 as provided by NWSDB
Where P was the population in 1000’s subject to PF > 3.The peaking factor was applied to the average
daily flow (DWF), to determine the peak sewage flow.
Hospitals* 0 0 * * * *
Schools* 0 0 * * * *
Commercial* 0 0 * * * *
TOTAL 34,457 15,216 * 3,804 * 19,020 * 220

10
Chapter 3 SEWER PIPE NETWORK DESIGN
3.1 Software Used
SewerGEMS software package was used to build the network model of the Jaffna sewerage
system. SewerGEMS is a hydraulic modelling and data handling software package. This software
is considered suitable for modelling and design of sewerage networks and complex ancillaries. It
allows the modelling of sewerage systems, analysis of the results permitting identification of
potential problem areas in the sewerage system and the design of sewerage system.
ArcGIS version 10.1 and MS Excel 2000 were used for data manipulation, analysis and
presentation. Wastewater Planning Users Group, Code of Practice (WPUG CoP) for the Hydraulic
Modelling of Sewer Systems (2nd Edition) standards have been adopted in construction of the
network model.
3.2 Network Design
Network design was carried out utilizing the collected population data from the planned surveys. Network
design was a joint exercise between the team .The network model run with the design constraint parameters
such as depth, velocity and slope constraints.
The model designed system carefully examined and based on the depth restriction, the pumping station
locations were determined. In our training time the model was run with steady state parameters. A detailed
Extended Period Analysis will be performed at later stage.
3.3 Hydraulic Analysis Of The Proposed Sewerage System
The network model was build and tested for population projections for year 2038. The wastewater
collection system always started at house with the kitchen, bathroom, laundry and toilet plumbing and
include the house connection to the branch and main trunk sewer through manhole system.
A complete gravity system in Jaffna was not possible so combination of gravity and pumping station was
considered. Pumping stations was proposed to convey the sewage flows to a higher point from there it can
gravitate to lower point where the next pumping station was proposed.
It was proposed to connect the grey-water and sewage from toilets through the house connection sewer,
branch sewer to the main trunk sewer. Since, there was no sufficient information available on the house
connection levels, only branch and trunk sewer connections were considered and after finishing the IC
marking, IC survey will be started to take the levels.
3.4 Model Set-Up
A detailed SewerGEMS model was developed incorporating all the proposed sewerage system
assets and topographical features.
General assumptions used in the interpretation of model build data include the following:

11
The outgoing pipe from a manhole is always lower than or equal to the level of the incoming
pipe
the pipe gradient is assumed to be constant i.e. an average gradient is used between upstream
and downstream nodes
Pipe diameters and shapes do not change between manholes
Pipe diameters increase down the system
Where possible, the interpolation of missing data was carried out by manual calculation. It was
necessary to emphasize that any hydraulic computer model output accuracy dependent on the
data used in its construction.
o The base model was built to cater for flows that arise from projected population for year
2028.
The model was run at PWWF with proposed pump stations modelled using fixed pumps.
Gravity mains were sized in accordance with the DSS and taken into account the topography of
the proposed routes as much as possible.
Rising mains were sized based on the minimum and maximum velocities specified in the DSS.
Consideration will also be given to the total head that could be achieved by a typical pump,
which is assumed to be 60 m.
The optimal staging of pump capacities was generally considered to be at 20 year intervals,
based on the typical pump and switchboard asset life. Gravity mains were sized to cater for
ultimate development and was not be staged due to the relatively high construction cost of
gravity mains compared to rising mains (even of the same diameter), which reduces the
financial benefit of staging.
In order to perform a decent design using the sewer model, the following data is required:
Population projections for the design horizon;
Ground levels or spot-heights along the proposed sewer route;
Proposed house-connection coverage;
Soil and ground water table data;
And to describe pumping stations in the model, the following data is required:
Proposed pumping station catchment
Location of pumping station and land availability
Groundwater condition;
12
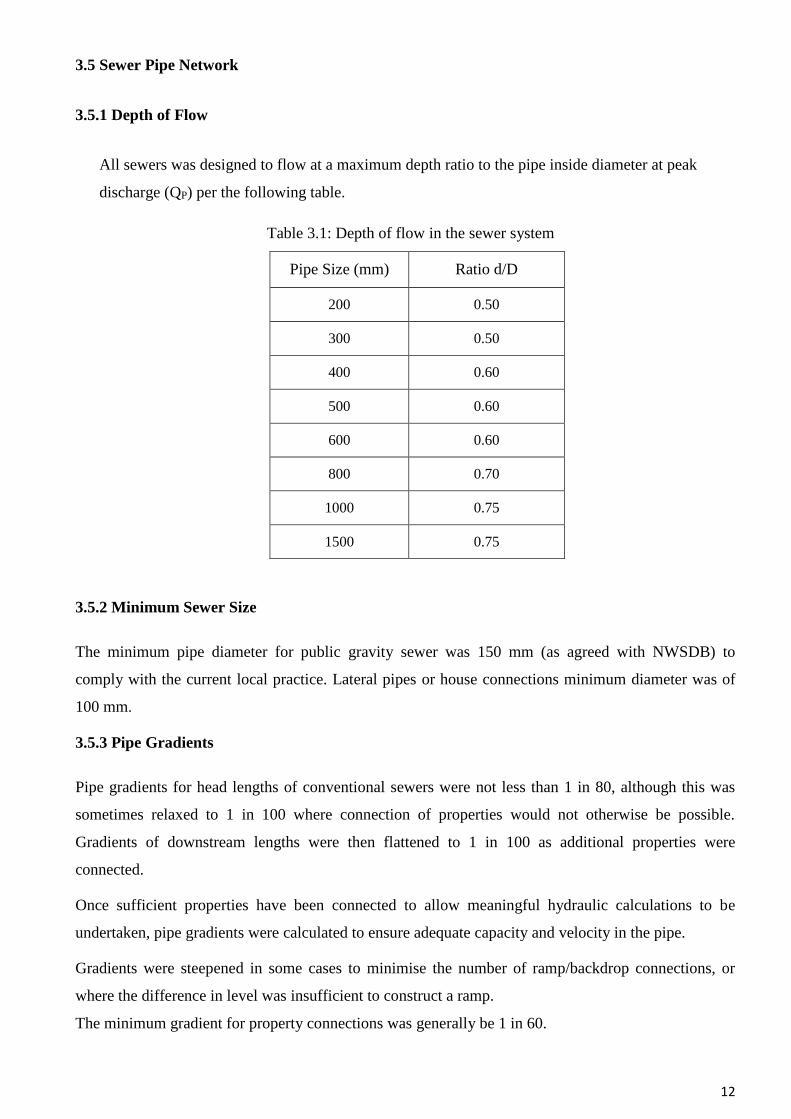
3.5 Sewer Pipe Network
3.5.1 Depth of Flow
All sewers was designed to flow at a maximum depth ratio to the pipe inside diameter at peak
discharge (QP) per the following table.
Table 3.1: Depth of flow in the sewer system
Pipe Size (mm) Ratio d/D
200 0.50
300 0.50
400 0.60
500 0.60
600 0.60
800 0.70
1000 0.75
1500 0.75
3.5.2 Minimum Sewer Size
The minimum pipe diameter for public gravity sewer was 150 mm (as agreed with NWSDB) to
comply with the current local practice. Lateral pipes or house connections minimum diameter was of
100 mm.
3.5.3 Pipe Gradients
Pipe gradients for head lengths of conventional sewers were not less than 1 in 80, although this was
sometimes relaxed to 1 in 100 where connection of properties would not otherwise be possible.
Gradients of downstream lengths were then flattened to 1 in 100 as additional properties were
connected.
Once sufficient properties have been connected to allow meaningful hydraulic calculations to be
undertaken, pipe gradients were calculated to ensure adequate capacity and velocity in the pipe.
Gradients were steepened in some cases to minimise the number of ramp/backdrop connections, or
where the difference in level was insufficient to construct a ramp.
The minimum gradient for property connections was generally be 1 in 60.

13
3.5.4 Sewer Layout
The following was adopted in the design and layout of the sewers.
Sewers were designed to serve all existing property plots for the proposed land-uses. As per
international standard requirements, the trunk sewer diameters were not be less than 150mm
and for small bore sewers the minimum diameter is 100mm.
To avoid future conflict during any future maintenance (repair operations), minimum clearance
between all proposed pipelines, inspection chambers/manholes, rising mains and existing
utilities were 0.5 metres or as specified by the respective utility authority.
The Colebrook-White formula was used for the flow analysis. A global Colebrook White (CW)
pipe roughness coefficient of 0.6mm was established. The following design roughness
coefficients were used for gravity sewer and pumping mains as shown in below Tables.
Table 3.2: Pipe Roughness Coefficients for Gravity Sewers
Pipe Material Roughness
Coefficient
Normal 0.6
VC 1.5
DI 0.3
Table 3.3: Pipe Roughness Coefficients for Pumping Mains
Depth of the sewer was determined by hydraulic consideration. A minimum depth of
cover of 1.2m for conventional sewers.
Sewer pipes were PVC up to 300mm pipe and pipes between 375 - 600mm were
HDPE. Any pipes above 600mm were concrete pipe. The pipes were laid and protected
by a granular bed and surround. Where pipes were laid in more onerous conditions,
such as at shallow depth with a heavy traffic loading, a concrete bed and surround or
Velocities Roughness
Coefficient
Up to 1 m/s 0.3
Between 1.1 m/s and 1.5 m/s 0.15
Over 1.5 m/s 0.06

14
other means of support were used. When pipes were laid below the ground water level,
the granular surround were protected by a geo-textile membrane.
There were no special provision for sewer ventilation incorporated in the network
design. It was expected that sewers will be vented through the vent pipes at the
dwelling.
The hydraulic design of major and small-bore sewers were based upon charts for the Hydraulic Design
of Channels and Pipes using the appropriate roughness coefficient and a minimum design actual
velocity of 0.6 m/s in conventional sewers and 0.3 m/s for small-bore sewers at peak flow. Below
tables shows the minimum velocities and gradients for pipelines to give a self-cleansing velocity at
least once per day:
Table 3.4: Approximate Self Cleansing Velocities for Conventional Sewers
Pipe Diameter (mm) Velocity (m/s)
200-300 0.60
400 0.77
500 0.82
600 0.86
800 0.88
Maximum flow depth (d/D) 0.50
Maximum flow velocity (m/s) 2.5
3.5.6 Manholes
A manhole were proposed for each of the following cases:
Change of alignment
Change of slope
At each house connection to the main line
Change of pipe diameter
Change of pipe material
At the beginning of each sewer
Manhole spacing as in table 3.5 did not generally exceed 100m except on large diameter sewers (over 600mm),
and particularly those to be installed by micro-tunnelling, where manhole spacing up to 120m had been
considered. House connections were made to the line via laterals and in some cases to the manholes.

15
Table 3.5: Maximum Manhole Spacing for conventional sewers
Manholes on sewers were located at all junctions, changes in direction and gradient and at spacing to
suit the house connections. Manhole covers were provided with glass-reinforced-plastic (GRP) sealing
plates. Access to manholes was to be by GRP ladders.
Manholes were constructed from in-situ concrete. To resist corrosion the manholes were lined with
GRP or other approved liner, and was have tanking protection fixed to the outside.
The soffit of pipes entering a manhole was not be lower than the soffit of the outlet pipe except in
special cases to minimise turbulences.
Manhole internal surfaces, including the benching, were to incorporate a suitable corrosion resistant
lining such as Sulphur resisting cement.
Flushing and inspection points for small-bore sewers were installed at all changes in direction. These
chambers were provided at the junction of two sewers where the sewer depth was less than 2.5 m.
Chambers were provided at every 120 m, at each household connection point and at the upstream
terminal of the sewers or just upstream of the treatment facility.
3.5.7 Inspection Chamber
An Inspection Chamber was a clean-out generally installed at the property line of a building. It allowed
the municipality or city to access the sanitary or storm sewers without disturbing the building owner.
The municipality or city could service the laterals to the building with cleaning equipment for
blockages or they could camera the lateral for inspection purposes. An Inspection Chamber installed at
the property line could indicate whether the blockage was on the building owner’s side or the
city/municipality’s side and whose responsibility it was for cleaning. Inspection Chambers could also
be used for ‘sampling’ what was going through the lateral should the need arise to take samples.
Depth to base of inspection chamber
Maximum 1.5 m
Minimum 0.6m
So design average of 1.2m
Inspection chambers should extend to at least 1.0m meter into the property
Pipe diameter (mm) Max Spacing (m)
Above 150 mm and below 300 mm 100
Between 400 and 800 mm 120

16
3.5.8 Pipe Materials
There are a number of pipe materials which can be used for sewers and pumping mains. Sewers can
be constructed using asbestos cement, vitrified clay, concrete, PVC and GRP. Pumping Mains can be
constructed using PVC, GRP, and pre-stressed concrete and ductile iron.
Most types of pipe have been used in the Asia and it has generally been accepted that for sewers,
asbestos cement pipes were not suitable as they were not resistant to chemical attack arising from
septic sewage. This also applies to concrete pipes.
GRP pipes have been used successfully in some locations for both sewers and pumping mains. These
pipes have the advantage that they are resistant to both internal aggression (i.e. sulphuric acid formed
from hydrogen sulphide) and external aggression due to chlorides. However, they have the
disadvantage that their structural integrity is dependent on the backfill.
PVC pipes are not subject to degradation due to internal and external aggressive materials and have
been used extensively for sewers in the past with no history of problems. PVC pipes were used for all
sewers up to 300 mm diameter since they were readily available, cost-effective, durable and resistant
to chemical attack from hydrogen sulphide and chlorides. Pipe diameters above 300mm, HDPE pipes
were used and the same characteristics as PVC apply.
Ductile Iron pipes were used extensively for pumping mains. They are strong and with suitable lining
provide long term service. They can subject to erosion by aggressive ground conditions but this can be
overcome by suitable protection (tape wrapping).
3.5.9 Construction Material
The following materials are recommended for the construction of this scheme. Their selection is based
on availability, durability and cost.
Sewer Pipes (in trench) : PVC up to 300mm and HDPE above 300mm pipe diameter
Manholes : In situ concrete with GRP or other suitable linings
Manhole Covers : Ductile iron with a GRP sealing plate
Concrete : Sulphur Resistant Cement
Concrete Protection : Faces in contact with sewage - GRP lined
Faces in contact with ground – waterproof membrane
Reinforcement : High yield steel.

17
Chapter 4 PUMPING STATION AND SUB CATCHMENT
4.1 Pump Station Selection Criteria
Submersible pumping stations are generally selected for flows up to 100 l/s and wet well stations for
larger flows. However, each station should be treated on its own merits and the following
considerations assessed:
Space available for pumping station (submersible stations usually require less space);
Initial and final design flow;
Total head on the pumps;
Proximity of housing or public areas (opening submersible pump wells may create odor
nuisance).
For current scheme, submersible/wet-well pumping station arrangements were considered due to space
restrictions within the catchment.
The following table gives an overview on the wet-well sizing
Table 4.1: Wet Well Operation Requirement
Sewerage pump stations
Wet-well operating
requirements
V (m3) = 0.9 x pump rate (L/s)
N
Where N is the acceptable number of starts per hour
Pump Rate (L/s) = capacity of the largest duty pump
N = 12 for motors <= 15 kW
N = 8 for motors 15kW - 200 kW
N = 5 for motors > 200 kW
The minimum depth between duty start and duty off is 100 mm and
ideally should be 300 mm or greater.
4.2 Submersible Pumping Station
Submersible pumping stations should incorporate the following features:
Minimum of one duty and one standby pump;
Non-return valve and gate valves for isolation of each pump;

18
Valves to be in a separate, easily accessible chamber adjacent to the pump sump;
Air reaction operation level controls as follows:
- High level alarm (also float);
- Pump start;
- Pump stop;
- Low level pumps protection (also float).
The following table gives an overview on the recommended design parameters for pumping stations
Table 9.1: Recommended Design Parameters for Pump Stations
Design Parameters
Description Unit 10,000 < PE ≤
20,000
10,000 < PE ≤
20,000
PE >20,000
Type of station Wet well Wet well Wet well
Number of pumps
(all identical and work
sequentially)
2
1 duty,
1 stand-by
100% standby
4 (2 sets)
1 duty, 1 assist,
Per set
(100% standby)
6 (3 sets)
1 duty, 1 assist,
Per set
(50 % standby)
Pump design flow each at Q peak each at 0.5 Q peak each at 0.25 Q
peak
Maximum retention
time at Qave
min 30 30 30
Min pass through
openings
mm 75 75 75
Minimum suction and
discharge
openings
mm 100 100 100
Pumping cycle
(average flow
conditions)
Start/hour 6 min and 15
max
6 min and 15
max
6-15

19
4.3 Sub-Catchment Division Of Jaffna
In order to achieve the conveyance of flows from various sub-catchments to the proposed
wastewater treatment facility; combination of gravity and pressure system was considered. The whole
Jaffna catchment was divided into several pumping station catchments that received flows to a low
level pumping station from there the flows were pumped to the next highest point to allow them to
flow under gravity.
Figure below shows the division of the Jaffna sewerage catchment into 4 major sub-catchments which
were served with gravity and pumping system.
Figure 4.1: Division of sub Catchment
Estimation of population for each sub-catchment was calculated based on the survey performed by the
TA’s allocated for the project by NWSDB. The Jaffna catchment was divided into 5 large, 12 medium
and 38 small pumping station catchments that eventually discharge them into the proposed wastewater
treatment system at Kalundai.
4.4 Major PS in Sub-Catchments
The current Jaffna catchment (proposed sewerage catchment) was divided into 5 major PS’s
that were operating at a flow capacity above 100L/s. These major PSs received flows from medium
and small PSs and convey them to the PSs downstream or in two cases to the proposed WWTP. Below
figure shows the distribution of major pumping stations within the project area.

20
Fig 4.2: Main Pumping Station
4.5 Medium Ps in Sub-Catchment
Further, the major PSs were fed by 13 medium sized PSs that were operating at a flow capacity
between 20 and 100L/s. These medium PSs received flows from the small PSs and discharged them
into the major PS for further disposal. Below figure shows the distribution of major pumping stations
within the project area.
Fig 4.3 Medium pumping station
4.6 Small Ps in Sub-Catchment
Due to the topography, depth restriction of 4m and complexity of the project area, it was difficult to
run the gravity system for more than 1 km. So designed a gravity system that discharge into several
small PSs that was operate at a flow capacity up to 20L/s . These small PSs were spread all over the
catchment to receive flows for further disposal into the medium PSs. Below figure shows the
distribution of small pumping stations within the project area.

21
Fig 4.4 Small Pumping Station
Figure 4.5 indicate the whole main pumping network.
Fig 4.5: Main Network

22
Chapter 5 INSPECTION CHAMBER SURVEY
5.1 Introduction
An Inspection Chamber is a clean-out generally installed at the property line of a building. It allows
the municipality or city to access the sanitary or storm sewers without disturbing the building owner.
The municipality or city can service the laterals to the building with cleaning equipment for blockages
or they can camera the lateral for inspection purposes. An Inspection Chamber installed at the property
line can indicate whether the blockage is on the building owner’s side or the city/municipality’s side
and whose responsibility it is for cleaning. Inspection Chambers can also be used for ‘sampling’ what
is going through the lateral should the need arise to take samples. The Mainline Adapt-a-Valve
Inspection Chamber is versatile in that it can be adapted to become an extendible backwater valve or
can be used to pressure test the lateral or isolate the lateral if need be. The body of the Mainline
Adapt-a-Valve Inspection Chamber has a special slot molded right into it that is designed to accept the
backwater valve gate or the test/isolation n gate. Inspection chambers may be constructed from
class B engineering bricks or precast concrete sections surrounded in concrete or in-situ concrete or
glass-fiber plastic.
5.2 Inspection Chamber(IC) Marking
Following regulation should be considered in IC marking
Upstream of inspection chambers, internal network should be allowed for at 1 in 60 grade
and
IC should be at least 5m away from the well.
In special causes, the above requirements could be considered to be relaxed to 1 in 100
grade for the internal pipework
House connection shall be provided through Inspection chambers at suitable
locations,
considering the location of the low end of the property , the location of the branch sewer,
and the location of the exiting septic tank
For battle-axe blocks, the IC should be placed within the main body of the property.
House connection shall be provided for all residential properties, non-residential
properties including properties with currently houses and empty plots
Marked IC point is shown in below

23
Fig 5.1: Location Of The IC Point
5.3: IC Survey
Purpose of the IC survey is improve the SewerGems Model and add information. IC survey is done
with the help of surveys. Surveys use GPS technic to measure the points. At least 3 point measurement
is needed in a property. That’s outlet of the toilet, outlet of the bath and well, outlet of the kitchen and
location of the inspection chamber. From these reading with the help of Arc -GIC can calculate
the flow direction. Sheet used to marked IC show in below.
Fig 5.2 IC Survey Sample Sheet

24
Chapter 6 ISSUES & RISKS
6.1 Shallow Bed-Rock
The limestone of Jaffna "is a grey yellow and white organogenic, porous limestone (reef limestone)"
and "is typically a compact, hard, partly crystalline rock". The depth of limestone existence
varies across the study area.
6.1.1 Geotechnical Data
It is understood that no site investigation works including geophysical survey or intrusive exploratory
holes are planned until the construction phase of this project. It is our opinion that if the site
Investigation is carried out after design completion, major changes in detailed design may be required
With considerable impact on cost and construction program.
In view of the above, consideration should be given to undertaking a site investigation
comprising intrusive exploratory holes and geophysical survey to support the geotechnical
detailed design. A geotechnical desk study, which will comprise collection and collation of
historical information from the general vicinities of the pipeline route, will be carried out to allow
determination of the scope of the site investigation. It is anticipated that the availability of significant
geotechnical information will greatly reduce the scope of the proposed investigation.
6.1.2 Impact Of Limestone Bedrock On Network Design
Since the modeler has no comprehensive information on the existing ground conditions within
the Jaffna study area, it has been assumed that the depth of weathered hard limestone is in the range of
4m.However, the Railway Contractors have provided bore-hole information along the railway line. As
per the survey information provided by them, the depth of limestone rock along South of Stanley Road
is in the range of 2.0m. This restricts both the sewer and pumping station depth to 2.0m.
At a depth of 2.0m, the pipe can only run for 300m to meet the minimum self-cleansing
velocity. This means, number of pumping stations within the study area might go over 90. This would
Increase the capital costs for PS and annual operation & maintenance costs. Since the modeler has no
evidence of depth of limestone in other areas within the catchment, it is difficult to arrive
with a meaningful and reasonable design.

25
6.2 Ground Water
The groundwater table is located at 0m to 3m below ground level. The conductivity is very high. The
estimated shallow wells are over 80,000 in number constructed up to depths of 5m to 10m. Over 50%
of the wells in the Jaffna Peninsula have high salinity water. Most well-water falls into low to medium
sodium and phosphorus content. Nitrate or N levels in most agro-wells are higher than the permissible
level. Due to the disposal of sewage from pit-latrines, soakage ways and septic tanks, fecal
contaminated groundwater has been reported from several places in the Jaffna Peninsula

26
Chapter 7 CONCLUSION
Engineering is not an easy task as a carrier. It is essential to have good practical knowledge and also
experience to do the task effectively. As an engineer he is responsible to do several occupations. Once
he is an adviser, once he is a manager, once he is a supervisor likewise an engineer should have good
personality to handle everything properly. As an Engineer he should be able to associate every person
in the site well. He should be able to create good communication with each other to enhance the work
in the site.
As a trainee at Project Engineering Institutional Consultant Service and I have been working in the
Jaffna-Kilinochchi Water Supply and Sanitation Project in Jaffna. I experienced lot and was able to get
some basic knowledge regarding the field of civil engineering. As this is my first training I was able to
gain the knowledge not only about the engineering field but also who is an engineer, What are his
duties, How about his participation to the job well, In my training period I was able to understand how
the theoretical relations applied to the practical purposes. I got opportunity to associate people who are
working in various stages such as senior engineers, site engineers, managers, technical offices, labors
etc. As an undergraduate during my three month short training period I saw the reality of the
engineering world. I understood one thing we should always try to learning through observation to full
fill the necessity of the engineering knowledge to the world.