training report on hospital pharmacy melo.pdf · hospitals, as the case for some iv solutions. the...
TRANSCRIPT

David Silva Melo
TRAINING REPORT ON HOSPITAL PHARMACY
Training report on Hospital Pharmacy executed in the Capital´s Region Pharmacy, under the guidance of Dr. Vagn Handlos, within the Master of Pharmaceutical Sciences from the Faculty of Pharmacy, University of Coimbra.
September of 2015
Training Report on Hospital Pharmacy executed in the Capital´s Region Pharmacy,
under the guidance of Dr. Vagn Handlos, within the Master of Pharmaceutical Sciences from
the Faculty of Pharmacy, University of Coimbra
Coimbra, September 2015.
Signature: _______________________________________
David Silva Melo
(Intern)
Signature: _______________________________________
Dr. Vagn Handlos
(Supervisor)

2
Table of contents
1. Introduction…………………………………………………………………………………3 1.1 Report format…………………………………………………………………………………………4
2. The Region Hovedstadens organization……………………………………….6 2.1 The Region Hovedstadens Apotek……………………………..…………………………..6
3. About Heparin……………………………………………………………………………..9 3.1 Brief history……………………………………………………………………………………………8
3.2 Anticoagulant action of heparin…………………………………………………………….8
3.3 Heparin sodium……………………………………………………………………….……………10
3.4 Production scandal……………………………………………………………………...……….11
3.5 Biological assays……………………………………………………………………………………12
3.6 Heparin anti-factor IIa assay principle and summary……………………….….13
4. Role and contribution for the Heparin anti-factor IIa assay..………14 4.1 First steps……………………………………………………………………………………………..14
4.2 Developing and optimizing the method……………………………………………….15
4.3 Results outcome…………………………………………………………………………………..15
5. Other projects……………………………………………………………………………16 5.1 Cytotoxic contamination in the workplace of hospital pharmacies…….…16
6. Discussion………………………………………………………………………………….18
7. Bibliography………………………………………………………………………………19
8. Validation Report Annex……………………………………………………………20

3
1. Introduction
As part of my curricular training for the Integrated Master in Pharmaceutical
Sciences from the Faculty of Pharmacy, University of Coimbra in Portugal, I had the
opportunity to travel to Denmark to contact with different hospital pharmacy
professional practices and learn more about a new (to me) healthcare system “in situ”.
The training was planned and agreed upon the frame of European programme
Erasmus Plus and it is equivalent to 280 hours, from the total of 920 hours required for
the curricular training.
Right after finishing the first part of my training in community pharmacy, in
Portugal, I headed north to Copenhagen to start the second chapter of my final
training. The internship is inserted in the area of hospital pharmacy and lasted three
months, from 5th of April till 6th of June, 2015.
The planning for the internship started to take place in December 2013, after the
Region Hovedstadens Apotek (RAP) – The Capital´s Region Pharmacy - accepted me to
collaborate with the organization, and by mid-2014 the backbone for the internship
was completed.
My main supervisor and contact person was professor doctor Vagn Handlos, the
senior scientist in Research and Development (R&D) department at RAP in
Marielundvej, Herlev, the pharmacy headquarters where the central production is
located. Among many things, it is worth mention that Vagn was the former Hospital
Pharmacy Director at Rigshospitalet, from 1987 to 2005, and former Director of
Education, Science and Research for the European Association of Hospital
Pharmacists (EAHP), as for the new insights he has brought to me about hospital
pharmacists in Denmark and in Europe are due to his large experience in the area.
I collaborated in a validation project from the quality control department aiming
for the implementation of a new method for the quantification of Heparin in IV
solutions, according to the new volume of European Pharmacopeia (8.3), Pharm. Eur.
(8.3) supplement, which came into force on January 2015. The assay is classified as a
Biological Assay and, being so, was expected to be a great challenge to validate since it
was the first time Vagn, my supervisor, and I to work with this type of assay.
The project was divided in two parts, first the quantification of heparin potency
using anti-factor IIa for testing the final product and, second, quantification using anti-
factor Xa to analyse the raw material. During my stay, I only worked in the first part.
The deadline for the project, established by the Danish Medicine Agency authorities,
was 01/07/15. The culmination of the work developed resulted in a validation report
that was sent out to the regulatory authorities.
The reason for RAP´s decision to take home the heparin assay was because,
recently, they had encountered deviations in potency from the expected values in their
heparin IV products. For quality control and batch released, the heparin products were
analysed in an outside laboratory which still uses the previous method, using sheep

4
blood. In order to better understand if the differences in potencies were due to
laboratory testing or production process, RAP made the decision to implement the
method so that they could make their own analysis for their IV products. Also, from
the economical point of view, taking home the assay has a very positive economical
outcome for RAP.
Besides the work mentioned above, several opportunities were given to me to
participate in many other areas such as having close contact and being constantly
expose and updated about the activities in quality control (QC) and quality assurance
(QA) departments and taken part in a project studying cytotoxic contamination in the
workplace of hospital pharmacies in Denmark.
Also, I may add that I feel I had an excellent integration in both work and in the
“Danish lifestyle”. Vagn Handlos, along with the staff from QC and QA, always had the
willingness to care and provide help for any problem I encountered, from automatic
pipetting to bicycle punctures, and for that I am immensely grateful.

5
1.1. Report Format
To simplify the report I divided it in four parts.
The first part will be about the RAP organization. Here I make a brief overview
about the services provided and the goals of the pharmacy.
Secondly, I approach the heparin project, starting with some theoretical details
and up-to-date trivia about heparin and biological assays in order to better understand
the drug and the analytical work developed. Right after, I describe my work within the
heparin assay, however, here, I will not go into details about all the results and method
improvements, but instead I´ll focus on my contribution and know-how from what I
could learn from the analytical work developed. Therefore, I present a short list of
challenges and problems faced and how we overcame them. The English version of the
report is annexed in the end of the report and contains the data gathered and selected
for the regulatory authorities.
Then, I talk about another project I got in contact with about cytotoxic
contamination in the workplace of hospital pharmacies.

6
2. The Region Hovedstadens Organization
The Region Hovedstadens - Capital Region of Denmark - is a public authority
headed by democratically elected politicians and a professional board of directors. The
organization manages hospitals, performs research and services for the disabled and
undertakes environmental duties. It collaborates with municipalities and the business
community on developments concerning traffic, business and education. In total, there
are 5 administratives Regions in Denmark: Region Hovedstaden, Region Sjælland,
Region Nordjylland, Region Midjylland and Region Syddanmark.
2.1. Region Hovedstadens Apoteket
In total, there are 12 hospital
pharmacies in Denmark. The Region
Hovedstadens Apoteket (RAP), The
Capital´s Region Pharmacy, is the
hospital pharmacy for the Capital
Region of Denmark.
It was established in 2007 as a
result of a merger of the hospital
pharmacies in the area of Copenhagen
and Hillerød. The pharmacy delivers
drugs and hospital pharmacy services,
serving 2300 wards and other
customers. The yearly turnover is
about 360 million Euro (2011), and Fig.4 - Map of Denmark and the hospital pharmacies.
Fig.2 - Region Hovedstaden logo.
Fig.3 - Region Hovedstaden Apoteket (RAP) logo.
Fig.1 – Administratives Regions in Denmark.

7
has approximately 510 employees, including 75 pharmacists and 230 pharmacy
technicians at all hospitals in the region.
RAP delivers registered drugs from own production facilities and clinical
pharmaceutical services, including: clinical pharmacy, Top-Up service, service
production of antibiotics and cytotoxics and drug information. The centralized
pharmacy functions can be found at:
Marielundvej, Herlev: Logistics; central production; quality assurance (QA) and
quality control (QC); IT department; administration.
Rigshospitalet: central production.
Frederiksberg hospital: Central production, unit dose dispensing.
Bispebjerg hospital: drug information, production of reagents.
Nordsjællands Hospital, Hillerød: decentralized service production.
The hospital pharmacy supports 3 centres for cancer treatment and prepares
approximately 80.000 single doses of cytostatics per year for these centres.
The production departments produces approximately 2 million single
containers of large volume parenterals, 300.000 patient oriented single doses of
antibiotics, cytotoxics and TPN (total parenteral nutrition) per year together with 1.4
million ampules and 13 million tablets. The pharmacy is approved and inspected by the
Danish Medicines Agency according to the European GMP regulation(1).
The pharmacy main
products are not available from
the industry and production
logistics are based and updated
according to hospital´s
consumption data concerning
previous years. Nevertheless, for
some products, the pharmacy
competes with the industry
prices when selling drugs to
hospitals, as the case for some
IV solutions.
The pharmacy seeks to
deliver safe and rational
medication. Through combining
purchase and hospital
production, RAP tries to cover
all customer´s needs. RAP exerts
influence on the Capital Region
drug consumption through
formulary decision and
invitation of tenders by the Fig.5- Map of the Capital Region of Denmark and the hospitals of the region.

8
national organization Amgros A/S.
The drug information service is an independent platform accessible to health
care professionals (pharmacists, nurses and doctors). The main goal is to give quality
assured answers to questions from doctors and nurses and other healthcare
professionals. Functions involve participating in drug and therapeutic committee work,
drug consumption statistics, introducing new medication to the wards and pharmacy
staff and literature service.

9
3. About Heparin
3.1. Brief History
Heparin, one of the oldest biological drugs still in widespread clinical use, is a
naturally occurring glycosaminoglycan whose main function is to inhibit the
coagulation of blood. It was discovered a century ago, in 1916, isolated from canine
liver by Jay McLean, a graduate student of William H. Howell. However, there is some
evidence that Maurice Doyon isolated heparin from dogs´ liver in 1911(2).
The next table can give a brief idea of heparin history throughout the century
along with the important breakthroughs after the disputable discovery.
Table 1-Strutural history of heparin.
1918 Howel and Holt named the substance heparin.
1929 Best (who also discovered insulin) introduces heparin into clinical medicine at the university of Toronto.
1933-1936 Charles and Scott of Connaught laboratories working under Best finalized the method for large scale production of heparin from bovine lung.
1935 Murray conducted the first human trial of heparin for the prevention of post-operative thrombosis.
1935 Heparin was found in mast cells.
1950s Proteoglycans where described.
1960s-1970s Main structural features of heparin elucidated.
1978 Heparin proteoglycan finally identified.
1960s-1970s Main structural features of heparin elucidated.
1950s Proteoglycans where described.
1960s-1970s Main structural features of heparin elucidated.
1980 Heparan sulphate described in detail.
1990s Critical role of heparin sulphate in embryonic development and cell growth recognized.
(3)
3.2. Anticoagulant Action of Heparin
In vivo, free flowing of blood depends on the balance of pro-coagulant and
anticoagulant processes. A complex network of serine proteases, acting in an
amplification cascade, converts pro-enzymes to their active form. Factor IIa (fIIa),
known as thrombin, is the final serine protease that cleaves fibrinogen to form fibrin
which, together with a platelet plug, is the basis of a clot. This coagulation cascade is
activated when there is an injury to the vasculature, so that the serine proteases are
exposed to pro-coagulant stimuli such as tissue factor and collagen. Several natural or
endogenous anticoagulant proteins, which include antithrombin (AT), heparin co-
factor II (HCII), protein C inhibitor (PCI) and tissue factor pathway inhibitor (TFPI), are
also in place to regulate the formation of thrombin. These inhibitors are found at a
higher total concentration than the proteases and under normal physiological
condition act to keep the clot local to the wound by mopping up any proteases straying

10
Fig.6- Diagram representation of the interactions of heparin with the natural anticoagulant systems. Blue arrows represent the potentiating interactions of heparin with coagulation inhibitors; Red
arrows represent the inhibition of coagulation enzymes; Black arrows represent the conversion of proenzymes to their active forms, and purple arrows represent the effects of the enzymes. Dotted arrows indicate the formation of complexes.
into the rest of the vasculature. Antithrombin, HCII and PCI are members of the
structural class of proteins known as “serpins” (serine protease inhibitors). There are
two common features in the inhibitory mechanism of serpins: first, there is usually a
requirement for conformational change in both the protease and the protease
inhibitor and second the reaction is often greatly enhanced by the presence of
glycosaminoglycans such as heparin, heparan sulphate (HS) and dermatan sulphate
(DS). Unlike direct enzyme inhibitors, heparin has no anticoagulant activity on its own.
It acts in a catalytic fashion to activate the inhibitor and to stabilise the inhibitor–
enzyme complex; after the permanent, stoichiometric inactivation of the enzyme by
the serpin, heparin is released and can act again, as long as free serpin is available(4).
Heparin has anticoagulant action in several ways. The most significant of these
is through its potentiating action on the serpin antithrombin, best known as the major
heparin co-factor in the inhibition of the coagulation proteases, particularly factors Xa
and IIa. Although antithrombin alone is able to inactivate proteases, the reaction is
accelerated several thousand times in the presence of heparin. The interpretation of
this rate enhancement is controversial because of the difficulty in attributing it either
to protease-heparin or to an antithrombin-heparin interaction (4, 5).
3.3. Heparin Sodium
Heparin sodium is the sodium salt of sulfated glycosaminoglycans present as a
mixture of heterogeneous molecules varying in molecular weights.

11
Although others may be present, the main sugars occurring in heparin are: (1)
α-L-iduronic acid 2-sulfate, (2) 2-deoxy-2-sulfamino-α-D-glucose 6-sulfate, (3) β-D-
glucuronic acid, (4) 2-acetamido-2-deoxy-α-D-glucose, and (5) α-L-iduronic acid. These
sugars are present in decreasing amounts, usually in the order (2)> (1)> (4)> (3)> (5),
and are joined by glycosidic linkages, forming polymers of varying sizes. Heparin is
strongly acidic because of its content of covalently linked sulfate and carboxylic acid
groups. In heparin sodium, the acidic protons of the sulfate units are partially replaced
by sodium ions(6).
It is present in mammalian tissues and is usually obtained from the intestinal
mucosa or other suitable tissues of domestic animals used for food by man.
Unfractionated heparin as a pharmaceutical is heparin that has not been fractionated
to sequester the fraction of molecules with low molecular weight.
Two types of heparins are commonly used as anticoagulants – unfractionated
heparin (UFH) and low molecular weight heparins (LMWHs). UFH has been used for
the prevention and treatment of thrombosis for several decades. UFH has variable
anticoagulant effects and pharmacological properties and also has limited
bioavailability and highly variable anticoagulant response. LMWHs are derived from
UFH by depolymerization. Each LMWH product has a specific molecular weight
distribution that determines its anticoagulant activity and duration of action. LMWHs
are associated with a predictable dose–response and have fewer non-haemorrhagic
side-effects.
3.4. Production Scandal
In 2007-2008 there was a big problem regarding heparin production. Severe
side effects, some leading to death (149 deaths, according to the Food and Drug
Administration) were detected to batches of contaminated unfractionated heparin
imported from China. This crisis led to the recall of much of the heparin on the market
and could have been a much greater problem had there not been sufficient amounts
of non-contaminated product to meet the needs of dialysis and surgery patients. The
Fig.6- Structural formula (representative subunits of Heparin sodium.

12
contamination was traced to an adulteration of the crude heparin precursor with an
oversulphated chondroitin sulphate somewhere in the process between the
slaughterhouse where heparin was collected from pig intestines and the
pharmaceutical manufacturing site. While ULMWH was not contaminated, it could not
be relied on to alleviate this crisis because of its high cost, difficulty to produce in
sufficient quantities to meet worldwide needs, and limited utility for kidney dialysis.
The inspection of foreign suppliers and upgrading the pharmacopeial monographs has
reduced the likelihood of a similar crisis in the future but the increased demand on
heparin, as modern medicine is applied to more of the world, and the limited number
of pigs (1 pig provides about 3 doses of unfractionated heparin or 1 dose of LMWH)
pose constraints on the supply of this critical drug. Since the crisis, the cost of heparin
API has increased 10 times(6).
3.5. Biological Assays
Bioassays are methods employed to estimate the effect of a given substance in
living matter, and therefore they are frequently used in the pharmaceutical industry.
Biological assays are complicated experiments with several factors, there is not a
general formula to estimate how many experiments are needed in order to assure that
the confidence interval of the estimate has a certain size.
Biological methods are described for the assay of certain substances and
preparations whose potency cannot be adequately assured by chemical or physical
analysis. The principle applied wherever possible throughout these assays is that
comparison with a standard preparation so as to determine how much of the
substance to be examined produces the same biological effect as a given quantity, the
Unit, of the standard preparation and on the substance to be examined be carried out
at the same time and under identical conditions. Variability occurs in bioassay factors
(mice, analysts, other reagents, etc.) that can influence potency assessment
independent of the tested substance’s level of biological activity.
In order to mitigate these influences, a measure of potency of a test material
relative (compared) to a standard material can be obtained in one assay, in which
levels of the bioassay factors that contribute to biological response are common to the
assessments of test and standard materials. A frequently invoked perspective is that
relative potency is the degree to which the test preparation is diluted or concentrated
relative to the standard. The result from a relative potency assay quantitates the test
compound’s capacity for achieving the same specific response relative to the effect
observed for the Standard compound.

13
3.6. Heparin anti-factor IIa assay principle and summary.
Thrombin (Factor IIa) is the terminal enzyme in the classical coagulation
cascade, where it plays roles in both the fibrin deposition and platelet activation
processes of blood coagulation. UFH and LMW-H inhibit blood coagulation via initial
binding of these molecules to Antithrombin (AT), followed subsequently by the AT-
heparin complex inhibiting Factor IIa.
In buffer, this same “Anti-IIa” activity of Heparin can be followed enzymatically
by means of a chromogenic peptide substrate which, upon hydrolysis by residual factor
IIa, provides a chromophore (405nm) whose measure is inversely proportional to the
initial amount of heparin present in the test sample. An indication of the amount of
heparin present the sample is then obtained.
Schematically, the procedure is carried out as follows:
AT + heparin -> [AT-heparin]
[AT-heparin] +[Thrombin] IIa (know excess) -> IIa (residual) + IIa-AT-heparin
(inactive)
IIa (residual) + IIa Substrate (colorless) -> pNA chromophore (405nm) + peptide
The International Unit is the activity contained in a stated amount of the
International Standard for UFH. Heparin sodium Biological Reference Product (BRP),
calibrated in International Units by comparison with the International Standard, is used
as the reference preparation.
The basic procedure, according to the Pharm. Eur. Monograph, involves
preparing 4 standard dilutions and 4 sample dilutions, within a specified concentration
range, using a tris-EDTA buffer pH 8.4, R1. Then, the reagents are added to the heparin
dilutions, followed by a reaction time of 1 minute, incubated at 37oC. Each potency
determination is carried out on 16 standard dilutions and 16 dilutions of the sample,
adding 2 to 4 blanks. The dilutions treatment with the reagents is done in a specific
order as indicated in the monograph. As the previous scheme indicates, the potency is
determined though the thrombin excess, which is measured spectrophotometriclly.
This analysis was performed by automated testing equipment, the ACL TOP 300
hemostasis testing system, which was set-up accordingly, in order to save time and
eliminate errors in manual work.
For data treatment the monograph states the use of “the usual statistical
methods for parallel-line assays (5.3)” and so, the Combistat software version 5.0.0.,
delivered by the European Directorate for the Quality of Medicines (EDQM) was used.

14
4. Role and contribution for the Heparin anti-factor IIa assay
4.1. First steps
In order to train and get used to using automatic, I started by determining the
systematic error for each one of the auto-pipettes and checking if the deviation from
the nominal number was within the pipette official calibration.
The procedure went as follows: a fixed water volume, similar to the volumes
used in the assay, was auto-pipetted into a beaker and weighted using a precision
balance. The water density was calculated, as a function of temperature, in order to
obtain the real volume pipetted using the water mass weighted after pipetting. The
average volume was based on 15 measurements and the algorithm used for
determining water density was based on:
p = 1000(1 - (T+288.9414)/(508929.2*(T+68.12963))*(T-3.9863)^2) T – Co
P - kg/m3
Algorithm taken from McCutcheon, S.C., Martin, J.L, Barnwell, and T.O. Jr. 1993. Water
Quality in Maidment, D.R. (Editor). Handbook of Hydrology, McGraw-Hill, New York, NY (p.
11.3).
Table 2 - Results obtained for the pipette testing.
Vi – nominal volume set to be pipetted.
Vr. Av – Real volume average.
SD – Standard deviation.
RSD – Relative standard deviation. Yellow – acceptable; Red – unacceptable.
Ref. – reference value for the systematic error taken from the official calibration.
The main interpretation for the results can be the error associated with my
pipetting technique, which can contribute to the differences seem in the method when
different executed by another operator.
Test Pipette ID Range (ul) Vi(ml) Vr. Av. (ml) SD SD (%) RSD (%) Ref. RSD (%)
A1 D0842177E 500-5000 1.5 1.495 0.001841 0.12 -0.35 +-0.8
B1 D0842177E 500-5000 1 0.993 0.00153 0.15 -0.73 +-0.8
C1 D0842177E 500-5000 0.6 0.597 0.000655 0.11 -0.53 +-0.8
A2(a) K1200416U 100-1000 0.15 0.1489 0.000757 0.51 -0.76 +-0.8
A2 (b)
F0500215E 100-1000 0.15 0.1485 0.00032 0.22 -0.98 +-0.8
B2 7054413 5-120 0.1 0.099 0.00043 0.44 -1.42 +-1.33
C2(a) 14022207 5-120 0.06 0.059 0.00013 0.23 -1.95 +-1.33
C2(b) 11137961 5-120 0.06 0.059 0.00012 0.20 -1.36 +-1.33
C2(c 7054413 5-120 0.06 0.059 0.00026 0.44 -1.56 +-1.33

15
4.2. Materials
The EDQM Heparin sodium BRP for chromogenic assays was purchased. The
chromogenic assays for the determination of heparin were performed on an ACL TOP
300 coagulation analyzer from Instrumentation Laboratories. The heparin anti-IIa assay
was run using the Kinetichrome Anti-IIa Test kit from Provision Kinetics.
4.3. Developing and optimizing the method.
When I entered the project I was put up-to-date with the project status. My
main responsibilities were to do the analytical work and data treatment. The
instrument set-up, reagents and the first version of the procedure where already
prepared. The quality control department was about to start the analytical procedure
and gather the data, but improvements still had to be done. Some of problems we
faced, along with the solutions are listed below:
- The buffer volume used for preparing the diluted solutions from the first
preparation guide was too large, so it was reduced 10 times and tested for
linearity behavior.
- The diluted solutions concentrations were altered several times, as we tried to
find the best concentration range for linearity. During this period we
experienced difficulties with dispersed measurements from the robot and on a
few occasions we obtained strange results. This indicated possible dilution
problems and great of effort was inputted to resolve the problem and several
measures were adopted, such as making sure all the dilution factor were below
100; saturate the pipette tip by picking up and rejecting the volume 3 times;
working at the same concentration distance ratio at log-scale; developing
dilutions schemes for all heparin products.
- The report from the ACL TOP 300 was optimized in a way that we could treat the
data and have the potency determination immediately, avoiding printing or
manual work, thus diminishing errors and saving a considerable amount of time
after each run.
4.4. Results outcome
The results gathered were used to prove the accuracy, repeatability,
reproducibility and specificity of the method and also to develop the acceptance
criteria for the statistical model used. The data processing was done according to the
work framework delivered by Amgros A/s, the regulatory authority, in order for the
validation to be approved.
The necessary data was therefore organized and a validation report was written
down and set to the authorities for evaluation approval. In the beginning of June the
16
feedback was sent with a positive response, so RAP can perform the Heparin anti-IIa
assay.
5. Other projects
5.1. Cytotoxic contamination in the workplace of hospital pharmacies
Hospital staff can be exposed to the genotoxic effects of cytotoxic drugs.
Occupational exposure can occur when control measures are inadequate, meaning the
toxicity of cancer drugs can present significant risks to those who handle them.
Exposure may be through skin contact, skin absorption, inhalation of aerosols
and drug particles, ingestion and needle stick injuries resulting from drug preparation,
drug administration, handling patient waste, transport and waste disposal or spills. The
personnel more likely to be involved in these activities are nurses, responsible for drug
administration, hospital pharmacists and laboratory staff, responsible for drug
preparation, also including medical officers and cleaning, maintenance and waste
disposal staff.
With this in mind, since 2005, RAP is testing Danish hospital pharmacies and
taking measures to reduce the level of contamination and increase staff safety. Most
the changes are about staff behavior making sure everyone is aware of the
implications of working with cytotoxic drugs.
I took part in the project collecting samples from 2 hospitals pharmacies, Ålborg
and Herning, and I also had the chance to visit the analysis laboratory.
The process involves a swab test of all facilities to determine the surface
contamination, swabbing using an acrylic frame of 20x20cm. The testing was done for
Cyclophosphamide (CP) and Iphosphamide (IP). The analysis is done using LC-MS-MS in
the Division of Occupational and Environmental Medicine in the Department of
Laboratory Medicine in Lund University, Sweden. RAP decided not to perform the
analysis for safety reasons since the pharmacy doesn´t have, nor considers having, one
instrument dedicated only to perform these kind of testing.
The laminar air flow (LAF) is well establish and has a generalized use but
the efficiency of the LAF chamber has generated a discussion, particularly for
cyclophosphamide, which can vaporize at room temperature, originating particles
smaller than the porous of HEPA filter (High Efficiency Particulate Air). Also, gloves can
be permeable to cytostatics, with the permeation intensity being dependent of time
and glove thickness. For example, a study tested the permeability to 2 types of gloves
to cyclophosphamide and verified that the first sign of permeation occurred after 10
minutes for latex gloves and 20 minutes for PVC gloves(7).

17
Next, is showed the results from Ålborg, confronted previous testing (March
2012):
Mar-12 Apr-15
Area CP pg/cm2 IF pg/cm2 CP pg/cm2 IF pg/cm2
Blank <lod <lod < 0,25 < 0,25
Locker cabinet in the clean room 1,7 <lod < 0,25 < 0,25
Office desk 1,88 <lod < 0,25 < 0,25
Floor on the clean side of locker room 1,92 <lod < 0,25 < 0,25
Helping person desk 1 9,9 <lod < 0,25 < 0,25
Laminar air flow desk 1 <lod < 0,25 < 0,25
Floor between LAF and the helping person 2 8,68 1,61 0,48 0,85
Helping person desk 2 2,9 <lod - -
Laminar air flow desk 2 4,58 <lod - -
Floor between LAF and the helping person 2 13,75 0,21 3,75 0,4
Shelf in the store under CP <lod <lod < 0,25 < 0,25
Desk next to the welding machine 2,15 <lod < 0,25 < 0,25
Floor at the exit door 3,41 <lod 1,5 < 0,25
Baxter CP container exterior Not tested Not tested 14,8 37,7
Baxter CP container exterior Not tested Not tested 37,7 32,8
*lod – less than limit of detection 0,01.
The latest contamination are lower than the previous testing made 3 years ago
for both CP and IF. Improvements in the handling of cytostatics and better cleaning
could justify the contamination decrease. However, on the latest testing, by error, the
pharmacy cleaned the facilities before the swab.
During the latest test we searched for contamination on the cytostatic surface
container. Although the producer is expected to guarantee that no contamination
occurs during the packaging we found presence of both CP and IF in the CP container
exterior, which might indicate contamination in the packaging process.
Taken part in the project has raised my attention for the influence of materials,
especially plastic, used for handling cytostatics. Choosing the right material is crucial to
safety in the workplace. The important outcome is to change behaviors and raise
awareness to safely handle dangerous medicine, for the worker and patients benefit.
Simple changes can make big differences. For example, PVC is permeable to CF and the
releases after being absorbed is problematic. To minimize contamination at the desk
the PVC keyboard hand supports were removed from the desks in all hospital
pharmacies.
Table.3 – Results from Ålborg’s Hospital Pharmacy from March 2012 and April 2015.
18
6. Discussion
Looking back into my mobility program I feel a profound professional and
personal growth. Being responsible for executing the technical work for the heparin
testing improved my analytical skills and I also learned to cope better with failure, not
giving in and look for solutions when faced with unexpected problems.
The choice of doing the training at RAP enable me to contact and use state-of-
the art instruments and materials. From the QA and QC departments I got a clear
image on how to work in a team, the value of individual work and the positive
outcomes of collaboration between departments. In order to achieve maximum
productivity all staff opinions and suggestions can be relevant and are always taken in
consideration.
With several visits to different hospitals and hospital pharmacies, coupled with
long discussions about the pharmaceutical sector in Denmark, I have great knowledge
on how the Danish healthcare system works beyond hospital pharmacy.
Working in an English based environment was a valuable experience. The
adaptation was fast and there also room for improving the technical terms which
exceeds classrooms and are better learned on the job. Although Denmark is not an
English speaking country, the majority of people are fluent in English and
communication at RAP was never a problem.
My role in RAP was a small part of a larger, and still going, project. The
validation for anti-factor IIa assay is finished and now a technician must be trained to
carry out the testing of the production samples. The validation for anti-factor Xa is the
next step and afterwards, depending on the sample analysis from production, RAP will
determine if the production process is in need of improvements.

19
7. Bibliography
1. MACNUTTY, E. - Capital Region Pharmacy. Regions Hovedstadens Apotek (2012);
2. WARDROP, D; KEELING, D. - The story of the discovery of heparin and warfarin. Br J
Haematol, 141 (6) (2008) 757-63;
3. GRAY, E; MULLOY, B. Unfractioned and low molecular weight heparins – Brief history
of heparin, clinical indications and side effects. Stockholm. April 2013;
4. GRAY, E; HOGWOOD, J; MULLOY, B. The anticoagulant and antithrombotic
mechanisms of heparin. Handb Exp Pharmacol, 207 (2012) 43-61;
5. LIN, P; SINHA, U; BETZ, A. Antithrombin binding of low molecular weight heparins
and inhibition of factor Xa. Biochim Biophys Acta, 1526(1) (2001) 105-13;
6. LINHARDT, RJ; LIU, J. Synthetic heparin. Curr Opin Pharmacol, 12(2) (2012) 217–219;
7. SUSPIRO, A; PRISTA, J. Exposição ocupacional a citostáticos e efeitos sobre a saúde.
rev port saúde pública, 30(01) (2012) 76-88;

ANNEX
Validation Report

21
Validation of Ph. Eu. Monograph
2.7.5 Assays of Heparin,
used for the quantitative determination of heparin in the Danish Hospital Pharmacy (SAD) area
INDEX
0. Objective
1. Introduction
1.1. Background for planning of the assay (Anti-Factor IIa activity).
1.2. Briefing about the potency determination.
1.3. Equipment used for performing the analysis.
2. Parameters related to test results and how each parameter is defined in the
monograph 2.7.5, in conjunction on how we follow the monograph requirement´s.
2.1. Concentration range, linearity.
2.2. Temperature incubation, 37oC.
2.3. Incubation.
2.4. Determination of end-point (Abs min-1, Δ OD).
2.5. pH of buffer R1.
2.6. Reagents and stability.
2.7. Data processing.
2.7.1. Criteria for acceptance or rejection of analysis results.
2.8. Accuracy.
2.8.1. Method´s Accuracy.
2.9. Repeatability.
2.10. Reproducibility.
2.11. Requirements for blank amidolytical activity.
2.12. Specificity.
3. Conclusion.
4. Acknowledgements:

22
0. Objective
To verify if the implementation of the monograph 2.7.5, Assay of Heparin, from Pharm.
Eur. 8.3 is done correctly. The assay will be used for releasing heparin intravenous (IV)
solutions produced by the Capital´s Region Pharmacy, RAP (Region Hovedstadens Apotek), in
form of national hospital pharmacy registered products (SAD).
1. Introduction
The RAP manufactures unpreserved IV solutions of Heparin Sygehus Apotekerne I Danmark
(SAD) - The hospital Pharmacies in Denmark - in potencies of 100, 500, 1000 and 5000 IU/ml.
The IV solutions with the potency of 1000 and 5000 IU/ml are packed in glass ampoules, while
100 and 500 IU/ml are packed in both vials and ampoules. All products are unpreserved and
only contain Water for Injection, Pharm. Eur. and NaCl, Pharm. Eur., as excipients. Heparin
sodium is added in an amount corresponding to 5% excess to all products, when compared to
the specified strength.
The report describes the suitability/verification for Pharm. Eur. analytical method
2.7.5, Assay of Heparin, for determining anti-factor IIa activity in Heparin SAD IV solutions. The
analytical method is described in Heparin Sodium monograph, Pharm. Eur. 8.3, which contains
reference to the analysis description in chapter 2.7.5.
1.1. Background for the planning of the assay (Anti-Factor IIa activity).
In January 2015 Pharm. Eur. 8.3 came into force, updating the monograph 2.7.5, Assay
of Heparin, for the quantitative determination of heparin. The method is based on the reaction
between heparin and anti-thrombin and subsequent addition of thrombin and measurement
of a color reagent. The previous method used sheep blood and coagulation time was the main
component/principle of detection.
The work behind the report is not planned nor executed as a full validation, as
described in ICH guidelines. In fact, according to the ICH guidelines, which RAP follows, this is
not required because the pharmacopeia method has already been validated. This verification is
planned and carried out to prove the method is suitable for the assay of Heparin SAD IV
solutions, through determining method´s accuracy, repeatability and reproducibility. In
addition, considering the formulated products specificity containing NaCl as an excipient,
which is not considered in the monograph, which is based on the potency of the raw material
only.
Until now (June 2015) RAP has used an external laboratory, CiToxLAB, who determines
the potency of the raw material. This laboratory has, according to a contract, performed
analysis for the pharmacy until January 1 of 2015 using the official method.
The method of analysis in 2.7.5 describes two assays for determining heparin potency,
one based on anti-factor IIa activity and another based on anti-factor Xa activity. The Heparin
sodium Pharm. Eur. monograph, under “Definition”, states that potency is expressed as anti-
factor IIa activity, which is also the potency determined in the monograph assay. The potency
of Heparin SAD is therefore expressed as anti-factor IIa activity. Verification of RAP´s use of
23
anti-factor Xa determination will be described in a separate report. Anti-Factor Xa results are
included along with anti-factor IIa results in the identification of Heparin sodium, Pharm. Eur..
The method suitability verification for Heparin SAD assay is focused on testing the
product with the highest potency, 5000 IU/ml, and the one with the lowest potency, 100
IU/ml, as they are considered to be representative of the entire range, see section 1.2.
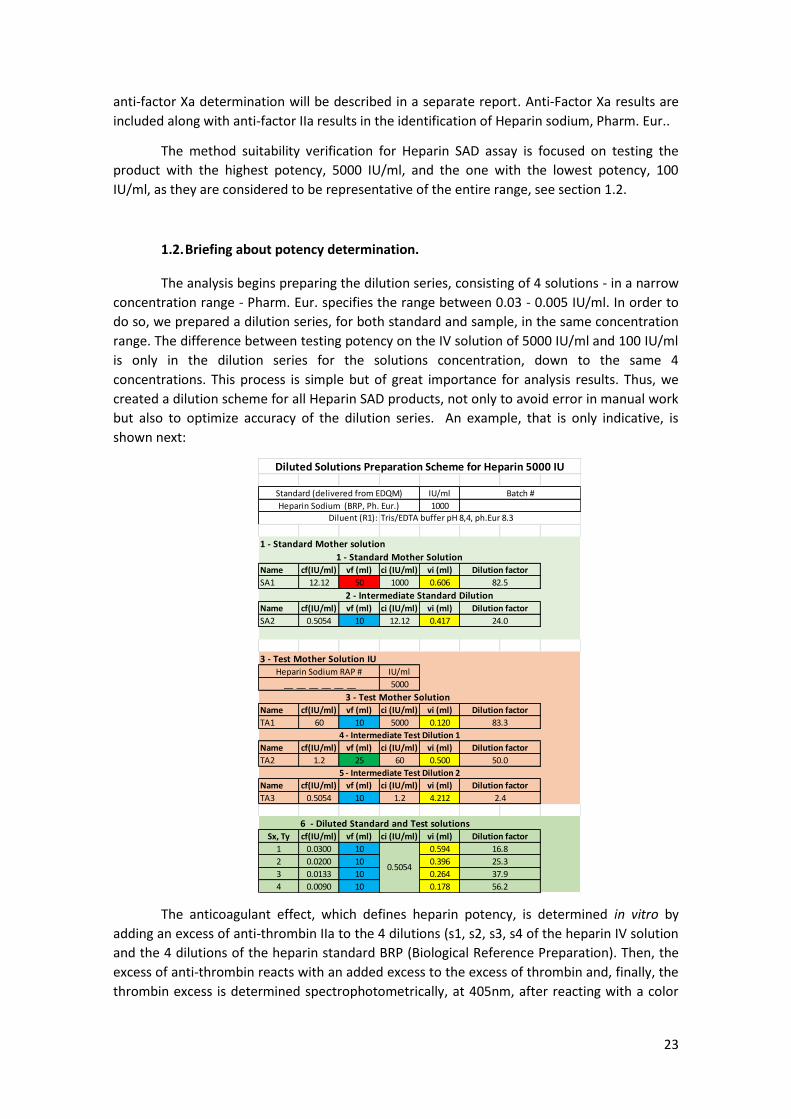
1.2. Briefing about potency determination.
The analysis begins preparing the dilution series, consisting of 4 solutions - in a narrow
concentration range - Pharm. Eur. specifies the range between 0.03 - 0.005 IU/ml. In order to
do so, we prepared a dilution series, for both standard and sample, in the same concentration
range. The difference between testing potency on the IV solution of 5000 IU/ml and 100 IU/ml
is only in the dilution series for the solutions concentration, down to the same 4
concentrations. This process is simple but of great importance for analysis results. Thus, we
created a dilution scheme for all Heparin SAD products, not only to avoid error in manual work
but also to optimize accuracy of the dilution series. An example, that is only indicative, is
shown next:
The anticoagulant effect, which defines heparin potency, is determined in vitro by
adding an excess of anti-thrombin IIa to the 4 dilutions (s1, s2, s3, s4 of the heparin IV solution
and the 4 dilutions of the heparin standard BRP (Biological Reference Preparation). Then, the
excess of anti-thrombin reacts with an added excess to the excess of thrombin and, finally, the
thrombin excess is determined spectrophotometrically, at 405nm, after reacting with a color
IU/ml
1000
Name cf(IU/ml) vf (ml) ci (IU/ml) vi (ml)
SA1 12.12 50 1000 0.606
Name cf(IU/ml) vf (ml) ci (IU/ml) vi (ml)
SA2 0.5054 10 12.12 0.417
IU/ml
5000
Name cf(IU/ml) vf (ml) ci (IU/ml) vi (ml)
TA1 60 10 5000 0.120
Name cf(IU/ml) vf (ml) ci (IU/ml) vi (ml)
TA2 1.2 25 60 0.500
Name cf(IU/ml) vf (ml) ci (IU/ml) vi (ml)
TA3 0.5054 10 1.2 4.212
6 - Diluted Standard and Test solutionsSx, Ty cf(IU/ml) vf (ml) ci (IU/ml) vi (ml)
1 0.0300 10 0.594
2 0.0200 10 0.396
3 0.0133 10 0.264
4 0.0090 10 0.178
3 - Test Mother Solution
Diluent (R1): Tris/EDTA buffer pH 8,4, ph.Eur 8.3
Diluted Solutions Preparation Scheme for Heparin 5000 IU
Standard (delivered from EDQM) Batch #
Heparin Sodium (BRP, Ph. Eur.)
Dilution factor
24.0
3 - Test Mother Solution IUHeparin Sodium RAP #
__ __ __ __ __ __
1 - Standard Mother solution
1 - Standard Mother SolutionDilution factor
82.5
2 - Intermediate Standard Dilution
83.3
4 - Intermediate Test Dilution 1
Dilution factor
50.0
Dilution factor
5 - Intermediate Test Dilution 2
Dilution factor
0.5054
16.8
25.3
37.9
56.2
2.4
Dilution factor

24
reagent (substrate). The measurement result is expressed in terms of change in optical density
potency per. min., ΔOD.
After adding the reagents to the heparin dilutions there´s a reaction time of 1 min.,
incubated at 37oC. Each analysis contains, approximately, 36 individual determinations
performed in one single run, as described in the pharmacopeia, containing sequences of both
samples and standards. Each potency determination is carried out on 16 standard dilutions
and 16 dilutions of the sample, adding 2 to 4 blanks.
1.3. Equipment used for performing the analysis.
After studying market products and taking on the advice of Elaine Gray, National
Institute for Biological Standards and Control, NIBSC (England), it was decided to purchase a
Mini Robot Systems ALC TOP 300 from Instrumentation Laboratories.
For statistical treatment of analytical data we worked with the CombiStats software,
version 4.0.0.0, delivered by EDQM. The software was used for the methods described in
Pharm. Eur., Section 5.3., the monograph referring the use of: “the usual statistical methods
for parallel-line assay (5.3)”.
This statistical tool was set up and used according to the monograph.
2. Parameters related to test results and how each parameter is defined in the
monograph 2.7.5, in conjunction on how we follow the monograph requirement´s.
The method must be ensured that´s performed under conditions where the major
analysis parameters are within monograph limits. The parameters affecting the analytical
results we evaluated or examined can be found below.
2.1. Concentration range, linearity.
The concentration range from 0.03 – 0.005 IU/ml is established by the monograph,
meaning that there are 4 dilutions from BRP standard prepared and used inside this
concentration range. The 4 test solutions concentrations must be located in the same area. As
an example, if the change in the sample ΔOD is significantly outside (>10%) from the standard
analytical result, you should repeat the analysis with the correct sample dilutions. Initially, it
seemed that the analytical answer (ΔOD), when plotted against the logarithmic concentration,
showed no linear relationship, although being inside the pharmacopeia specified
concentration range.
A study of linearity, as a function of concentration, showed the range 0.030 - 0.009
IU/ml was linear, therefore it´s used for the validation. The pharmacopeia mentions the range
should be within 0.030 to 0.005 IU/ml, which contain our selected range. Thus, the
concentrations used are 0.030; 0.020; 0.0133 and 0.009 IU/ml, so there is a linear increase in
concentration at the logarithmic scale. The statistical model for calculating the activity uses a
logarithmic data representation, see Figure 1.

25
Therefore, we assure the analysis is carried out in the pharmacopoeia concentration
range and with logarithmic growth the concentration.
2.2. Temperature incubation, 37oC
According to the monograph, incubation temperature for the sample is set to 37oC.
This means the incubation must be carried out in the temperature range of 36.5 – 37.4oC
(Pharm. Eur. General Notices 1.2: “Rules for rounding the Quantities”).
In the ACL TOP 300, temperature is set to 37,00oC and alarm limits are set at 36.70 and
37,30oC, lower and upper limits respectively. This way, in case the analysis temperature is
outside the upper and lower limits, an alarm is activated and the ongoing analysis interrupted.
2.3. Incubation
Incubation time for anti-thrombin and sample is set up to ”at least 1 min.”, and the
time for the second incubation with thrombin is indicated as exactly.
The practical meaning of those limits, in terms of time period, is not specified in the
pharmacopeia. The ACL TOP 300 is set to 60 sec. with the limits from 60.000 to 65.000
seconds. The machine uses clock time. It is estimated that this time period is sufficient to
satisfy the pharmacopeia requirements.
2.4. Determination of end-point (Abs min-1, Δ OD).
For quantitative determination of heparin in the sample we use the
spectrophotometric determination of light absorption, caused by thrombin/chromogenic
substrate complex, at 405nm.
Pharm. Eur. specifies two principles for the determination. Here, the “kinetic method”
was selected, where the sample absorption of light is recorded as a function of time, and the
slope of the linear portion of the absorption curve is the actual analysis result (Abs min-1 (Δ
OD)).
The ACL TOP 300 calculates the absorption curve slope against time measurements
from the first 5 seconds, are compared to measurements from the last 5 seconds. If the
difference is greater than 0.5%, then, the measurement is rejected and showed as “Failed” in
the result report.
The time course of the light absorption is recorded from 10 to 50 sec. is seen to be
linear within the given uncertainty. Before and after this period, the curve is not linear.
2.5. pH of buffer R1.
The supplier of the buffer set buffer pH to 8.4, with limits from 8.35 to 8.45, at 20oC.
There is no specified limit to the pH in the pharmacopoeia.
2.6. Reagents and stability.
The method´s reagent R5 (anti-thrombin III), R2 (human thrombin) and factor IIa
specific substrate are provided by the company Provision Kinetics®, Arlington Wisconsin, USA,
under the trademark Kinetichrome®. They are delivered as a dry set, containing the three
reagents, intended for reconstitution before use.

26
The reagents are specially designed for the methods described in Pharm. Eur. and USP.
Before reconstitution, the reagents have a self-life of more than one year, when stored at 2-
8oC. Reagents are stored in a monitored refrigerator. Reconstitution is performed under the
instructions from the supplier.
After reconstitution, reagents are stable during the next 48 hours at 15-19oC. After
inserting reagents into the ACL TOP 300 robot, they are kept at 15.00oC (upper limit - 15.50oC;
lower limit - 14,50oC). After the daily use of the instrument, we keep the reconstituted
reagents in the refrigerator at 2-8oC.
The reconstituted reagents are used within 48 hours after the reconstitution.
2.7. Data processing.
The monograph states that the sample potency is determined against Heparin Sodium
BRP and expressed in IU/ml. The calculations are performed “using the usual statistical
methods for parallel-line assays” according to Pharm. Eur., Chapter 5.3. This chapter contains
statistical models and description of calculations which can be used by users “whose primary
training and responsibilities are not in statistics, but who have responsibility for analysis or
interpretation of the result of these assays, often without the help and advice of a statistician”.
Precisely the situation RAP finds itself in.
The model described in Chapter 5.3, section 3.2, “The parallel-line assay” (PLA) is used
as described in section 3.2.1 and the related commentary in section 7.6.
For the data analysis we worked with the CombiStats software. The program has been
prepared by Pharm. Eur. and, as described above, is specially provided for non-statisticians
users. The user creates a relevant version of the model and builds a template for data entry,
calculus and results placement.
Fig. 1 shows, as an example, one graphic for analysis results values (ΔOD) versus
log concentrations and Table 1 demonstrates the completed CombiStats report for Heparin
SAD 100 IU/ml.
Our program set-up was verified by John Hogwood from the National Institute
for Biological Satandards and Control, NIBSC - England. The last table indicates the analysis
result showed as “Estimated Potency” in IU/ml, associated with the confidence interval named
“Upper limit” and “Lower limit”, which is part of the analysis result.

27
Figure 1. Graphic representation from analysis result values (ΔOD) versus log concentration for
test (blue) and standard (red), Heparin SAD 5000 IU/ml.

28
Table 1. Completed CombiStats sheet for Heparin 100 IU/ml SAD.
2.7.1. Criteria for acceptance or rejection of analysis results.
In the PLA, the statistical model used, there are three parameters, all of which
appears in the CombiStats report, to assess whether a given analysis is “statistically valid”
(section 3.2.4):
1. “The linear regression term” parameter is found as regression in the table. The
value is expressed as probability and must be <0.05;
2. “The term for the non-parallelism” must be >0.05;
3. “The term for the non-linearity” must be >0.05.
Compliance with conditions 1 and 2 can be correlated with a well conducted and
reported heparin assay, whereas condition 3 was never met. Also, in our results always we
found values for p<0.001 for well conducted assays.
Chapter 5.3 of the pharmacopeia was developed before the automated
equipment, as ACL TOP 300 was available on the market. The work methods were manual and
the number of individual samples included in a single heparin analysis was, and remains, high
(36) leading to great uncertainty in the analysis compared to what we obtain today using the
automated assay for anti-factor II. This is reflected in the value of probability of non-linearity
(p), increasing with greater uncertainty.
Figure 2 exemplifies one of our analyses with the treated PLA model (red plot).
The blue graph in the figure represents the same analysis results with added noise in the form
of spread values greater than the original ones. P for the initial measurement is <0.0001, and
0.07 for the blue graph. Observations of the same nature were published in conjunction with
USP´s introduction of anti-IIa method. The conclusion from these observations is that with
little uncertainty on the measurement results, which can be achieved using the automated
equipment of ACL TOP 300, the probability of non-linearity (p) value is small, although the
analysis is still valid. This is observed in the validation, where all analysis we have assessed as
valid have the probability for “non-linearity” parameter at 0.0001, below 0.05.
This situation is foreseen in the Pharm. Eur., Chapter 5.3, section 7.6, where “Non-
parallelism of dose response curves” is treated. It mentions: “underestimation of non-linearity
for valid analyses”, just what we see in our work. In these cases the Pharm. Eur. recommends a
solution “on a case by case basis with the help of statistical expertise”. On this note, we have
contacted a statistician at NNE Pharmaplan who advised to use the correlation quotient and
slope as parameters for acceptance criteria when validating the analysis. The statistician is
behind the calculations in Fig. 2.
Therefore, we have chosen to use the correlation quotient (R) and slope value (a)
from the linear representation obtained through the relationship between the ΔOD vs
logarithm concentration as the 3rd and 4th parameter for analysis acceptance/rejection. This is,
as mentioned, in accordance with our statistician’s recommendations and was also
recommend by John Hogwood (NIBSC).

29
Figure 2. The red curve is the view of the analytical results, ΔOD, against log concentration
of original data (s: standard; t: test). The Blue curve represents our "values added" noise. Blue
representation of "non-linearity" p = 0.07, red p <0.0001 (T. Zelikman, NNE Pharmaplan, May 2015).
To ensure proper use of the statistical model, we used a standard example from
the CombiStats manual and an in-house example Elaine Gray, the principal scientist for NIBSC,
had verified. Elaine Gray and her PhD student, John Hogwood, have kindly assisted RAP setting
up the program.
To verify the individual analyzes reliability, the following parameters specified in
the CombiStats report are used:
1. "The linear regression term" "regression in the table. This value is expressed as
the probability and must be <0.05;
2. "The term for the non-parallelism" probability must be >0.05;
3. "Correlation”, r, must be >0.98
In addition, the acceptance limits for "Common slope factor" parameter is yet to
be determined since there currently is sufficient statistics material to accurately determine the
limits. Limits will be given and justified by a later addendum to the report.
2.8. Accuracy.
To determine accuracy, all the analysis where done with a BRP heparin standard from
Pharm. Eur. For each assay, sample and standard dilutions were prepared from the BRP
standard, so that the analysis reflects the overall dilution uncertainty, all the determining the
ΔOD against log concentration. As standard, we used Heparin Sodium BRP batch 3.6, from
EDQM.
2.8.1. Accuracy of the method.
The method´s accuracy is calculated by determining the content of heparin in the Heparin
BRP standard (1000 IU/ml) from EDQM. Standard is used as both sample and standard. Each
analysis “run” covers all stages from the initial samples to the 4 dilutions of standard and

30
sample solutions loaded into the robot and analyzed so that all sources of error of dilution to
the final measurement of ΔOD are included in the uncertainty.
Table 2. Results obtained for accuracy.
Results are validated with the statistical values for “non-parallelism”,
“regression” and “correlation (r)” within the limits: >0.05; <0.05; >0.98,
respectively.
The Lower and Upper limit (983.2 to 1019.3 IU/ml) indicates the results
confidence interval (P=0.95), which must be within in the range of 800-1250
IU/ml.
The nominal value for the sample potency is 1000 IU/ml and the measured
value 1000.6 IU/ml, differing 0.1% from the nominal value.
Conclusion: The method is found to be sufficiently accurate.
In Table 2, the values for slope factor and correlation quotient (r) are included,
belonging to the linear correlation of assay response against log concentration, used for
acceptance/rejection of analysis results.
2.9. Repeatability.
Repeatability determination was performed through a repetition of analysis for Heparin
SAD unpreserved IV solutions, using the products with the potency of 100 and 5000 IU/ml.
Each analysis “run” covers all stages from the initial samples to the 4 dilutions of standard and
sample solutions loaded into the robot and analyzed so that all sources of error of dilution to
the final measurement of ΔOD are included in the uncertainty.
Operator Date Lower limit Estimate Upper limit Lower limit Estimate Upper limit
Vagn.H 13.05.15 1 SAmix1 SAmix1 991,5 1002,6 1013,7 99,1 100,3 101,4
David.M 13.05.15 2 SAmix2 SAmix2 983,0 997,6 1012,3 98,3 99,8 101,2
David.M 20.05.15 3 SAmix1 SAmix2 988,3 1010,9 1033,9 98,8 101,1 103,4
David.M 20.05.15 4 SAmix1 SAmix2 984,3 1001,2 1018,4 98,4 100,1 101,8
David.M 20.05.15 5 SAmix1 SAmix2 988,2 1006,1 1024,3 98,8 100,6 102,4
David.M 03.06.15 6 SAmix2 SAmix1 963,7 985,2 1007,2 96,4 98,5 100,7
Mean 983,2 1000,6 1018,3 98,3 100,1 101,8
SD 10,03 8,79 9,58 1,00 0,88 0,96
%RSD 1,02 0,88 0,94 1,02 0,88 0,94
Operator Date Lower limit Estimate Upper limit
Vagn.H 13.05.15 1 SAmix1 SAmix1 -104,095 -103,037 -101,979 0,99652 0,433 <0,000
David.M 13.05.15 2 SAmix2 SAmix2 -104,722 -103,300 -106,144 0,99586 0,14 <0,000
David.M 20.05.15 3 SAmix1 SAmix2 -104,318 -102,383 -100,248 0,99373 0,126 <0,000
David.M 20.05.15 4 SAmix1 SAmix2 -104,307 -102,687 -101,068 0,99528 0,135 <0,000
David.M 20.05.15 5 SAmix1 SAmix2 -103,752 -102,060 -100,368 0,99619 0,38 <0,000
David.M 28.05.15 6 SAmix1 SAmix1 -104,469 -102,374 -94,941 0,99649 0,669 <0,000
Mean -104,277 -102,640 -100,791 0,996
SD 0,33 0,46 3,60 0,00
%RSD 0,32 0,45 3,57 0,11
Results Overview for Heparin BRP 1000 IU
RUN Standard Batch # Sample Batch # Potency (IU/ml) Potency (% )relative to assay
Non-
paralellismRegressionRUN Standard Batch # Sample Batch #
Common Slope Factor|r|

31
Table 3. Results obtained for repeatability using Heparin SAD 100 IU/ml.
Results are validated with statistical values for “non-parallelism”, regression” and
“correlation (r)” within the limits: > 0.05; <0.05 and > 0.98, respectably.
The Lower and Upper limit (98.9 to 103 IU/ml) indicates the result confidence
interval (P=0.95), which must be within the range 80-125 IU/ml.
The nominal value of the sample potency is 100 IU/ml, the measured value is
103.3 IU/ml, differing 2.56% from the nominal value. The analysis RSD is 2.47%.
Operator Date Lower limit Estimate Upper limit Lower limit Estimate Upper limit
David.M 13.04.15 1 SA1 RAP 4382961 103,7 107,6 111,7 103,7 107,6 111,7
David.M 14.04.15 2 SA1 RAP 4382961 99,4 101,9 104,4 99,4 101,9 104,4
David.M 15.04.15 3 SA1 RAP 4382961 97,8 101,0 104,2 97,8 101,0 104,2
David.M 16.04.15 4 SA1 RAP 4382961 100,6 103,4 106,2 100,6 103,4 106,2
David.M 20.04.15 5 SA1 RAP 4382961 101,0 102,8 104,8 101,0 102,8 104,8
David.M 20.04.15 6 SA1 RAP 4382961 95,3 106,3 118,7 95,3 106,3 118,7
David.M 04.05.15 7 SA1 RAP 4382961 96,9 100,2 103,6 96,9 100,2 103,6
David.M 05.05.15 8 SA1 RAP 4382961 99,8 102,4 105,1 99,8 102,4 105,1
Mean 100,5 103,3 106,3 100,5 103,3 106,3
SD 2,16 2,56 3,14 2,16 2,56 3,14
%RSD 2,15 2,47 2,95 2,15 2,47 2,95
Operator Date Lower limit Estimate Upper limit
David.M 13.04.15 1 SA1 RAP 4382961 -78,8570 -77,8570 -75,3489 0,99892 0,680 <0,000
David.M 14.04.15 2 SA1 RAP 4382961 -81,1224 -79,9223 -78,7222 0,98837 0,811 <0,000
David.M 15.04.15 3 SA1 RAP 4382961 -81,9061 -80,3474 -78,7888 0,98641 0,856 <0,000
David.M 16.04.15 4 SA1 RAP 4382961 -80,7591 -79,4452 -78,1313 0,98568 0,640 <0,000
David.M 20.04.15 5 SA1 RAP 4382961 -77,8779 -77,0071 -76,1364 0,98696 0,669 <0,000
David.M 20.04.15 6 SA1 RAP 4382961 -82,5642 -77,5302 -72,4961 0,98722 0,203 <0,000
David.M 04.05.15 7 SA1 RAP 4382961 -82,3683 -80,6970 -79,0257 0,98610 0,274 <0,000
David.M 05.05.15 8 SA1 RAP 4382961 -82,8353 -81,5334 -80,2315 0,98424 0,201 <0,000
Mean -80,105 -78,916 -77,426 0,989
SD 1,68 1,42 1,58 0,01
%RSD 2,09 1,80 2,04 0,55
Results Overview for Heparin 100 IU
RUN Standard Batch # Sample Batch # Potency (IU/ml) Potency (% )relative to assay
Non
paralellismRegressionRUN Standard Batch # Sample Batch #
Common Slope Factor|r|

32
Table 4. Results obtained for repeatability using Heparin SAD 100 IU / ml.
Results are valid with the statistical values for “non-parallelism”, “regression” and
“correlation (r)” within the limits: > 0.05; <0.05 and > 0.98, respectively.
Lower and Upper limit (98.9 to 103.4 IU/ml) indicates the result confidence interval
(P=0.95), which must be within the range 80-125 IU/ml.
The nominal value of the sample potency is 100 IU /ml, the measured value is 101.1
IU/ml, differing 1.1% from the nominal value. The RSD of the analysis is 1.03%.
Table 5. Results obtained for repeatability using Heparin SAD 5.000 IU/ml.
Operator Date Lower limit Estimate Upper limit Lower limit Estimate Upper limit
Vagn H. 23.06.15 1 SA 02EOM1 RAP 4382061 97,0 99,8 102,8 97,0 99,8 102,8
Vagn H. 23.06.15 2 SA 02EOM1 RAP 4382061 97,5 100,2 102,9 97,5 100,2 102,9
Vagn H. 23.06.15 3 SA 02EOM1 RAP 4382061 99,8 101,5 103,2 99,8 101,5 103,2
Vagn H. 23.06.15 4 SA 02EOM1 RAP 4382061 100,8 102,2 103,6 100,8 102,2 103,6
Vagn H. 23.06.15 5 SA 02EOM1 RAP 4382061 99,4 101,8 104,3 99,4 101,8 104,3
Vagn H. 23.06.15 6 SA 02EOM1 RAP 4382061 102,7 104,4 106,1 102,7 104,4 106,1
Mean 98,9 101,1 103,4 98,9 101,1 103,4
SD 1,62 1,05 0,62 1,62 1,05 0,62
%RSD 1,63 1,03 0,60 1,63 1,03 0,60
Operator Date Lower limit Estimate Upper limit
Vagn H. 23.06.15 1 SA 02EOM1 RAP 4382061 -103,463 -100,778 -98,093 0,99393 0,889 <0,000
Vagn H. 23.06.15 2 SA 02EOM1 RAP 4382061 -103,965 -101,425 -98,884 0,99185 0,803 <0,000
Vagn H. 23.06.15 3 SA 02EOM1 RAP 4382061 -101,326 -99,809 -98,289 0,99525 0,321 <0,000
Vagn H. 23.06.15 4 SA 02EOM1 RAP 4382061 -100,913 -99,636 -98,359 0,99425 0,497 <0,000
Vagn H. 23.06.15 5 SA 02EOM1 RAP 4382061 -102,462 -100,236 -98,011 0,99195 0,897 <0,000
Vagn H. 23.06.15 6 SA 02EOM1 RAP 4382061 -100,357 -98,901 -97,445 0,99550 0,329 <0,000
Mean -102,081 -100,131 -98,180 0,994
SD 1,45 0,89 0,47 0,00
%RSD 1,42 0,89 0,48 0,16
Results Overview for Heparin 100 IU
RUN Standard Batch # Sample Batch # Potency (IU/ml) Potency (% )relative to assay
RUN Standard Batch # Sample Batch # Common Slope Factor
|r|Non
paralellismRegression
Operator Date Lower limit Estimate Upper limit Lower limit Estimate Upper limit
David.M 08.06.15 1 02DMG3 RAP 3452851 4847,4 4927,5 5008,9 96,9 98,6 100,2
David.M 08.06.15 2 02DMG3 RAP 3452851 5084,7 5244,2 5409,2 101,7 104,9 108,2
David.M 22.06.15 3 02DMG3 RAP 3452851 4953,01 5043,48 5135,63 99,10 100,90 102,70
David.M 22.06.15 4 02DMG3 RAP 3452851 4862,3 4950,8 5040,9 97,20 99,00 100,80
David.M 22.06.15 5 02DMG3 RAP 3452851 5015,0 5114,4 5215,9 100,30 102,30 104,30
David.M 22.06.15 6 02DMG3 RAP 3452851 4711,65 4827,78 4946,52 94,20 96,60 98,90
Mean 4912,3 5018,0 5126,2 98,2 100,4 102,5
SD 100,72 128,98 160,33 2,04 2,58 3,21
%RSD 2,05 2,57 3,13 2,08 2,57 3,13
Operator Date Lower limit Estimate Upper limit
David.M 08.06.15 1 02DMG3 RAP 3452851 -95,20 -93,80 -92,40 0,997 0,982 <0,000
David.M 08.06.15 2 02DMG3 RAP 3452851 -96,02 -93,37 -90,71 0,991 0,343 <0,000
David.M 22.06.15 3 02DMG3 RAP 3452851 -100,04 -98,38 -96,75 0,994 0,858 <0,000
David.M 22.06.15 4 02DMG3 RAP 3452851 -101,82 -100,15 -98,49 0,994 0,371 <0,000
David.M 22.06.15 5 02DMG3 RAP 3452851 -100,04 -98,27 -96,49 0,992 0,621 <0,000
David.M 22.06.15 6 02DMG3 RAP 3452851 -101,82 -99,59 -97,36 0,992 0,719 <0,000
Mean -99,15 -97,26 -95,37 0,994
SD 2,87 2,94 3,08 0,00
%RSD 2,90 3,02 3,23 0,21
Potency (% )relative to assaySample Batch #
Potency (IU/ml)
RUN Standard Batch # Sample Batch # Common Slope Factor Non
paralellismRegression
Results Overview for Heparin 5000 IU RAP 3452851
|r|
RUN Standard Batch #

33
Samples were prepared as indicated for the experiment, described in Table 3.
Results are valid with statistical values for “non-parallelism”, regression” and
“correlation (r)” within the limits: > 0.05; <0.05 and > 0.98, respectably.
The Lower and Upper limit (4912.3 to 5126.2 IU/ml) indicates the result confidence
interval (P = 0.95), which must be within the range of 4000-6250 IU/ml.
The nominal value of the sample potency is 5000 IU/ml, the measured value is 5018
IU/ml, differing 0.4% from the nominal value. The analysis RSD is 2.57%.
Table 6. Results obtained for determining repeatability using Heparin SAD 5.000 IU / ml.
Results are validated with statistical values for "non-parallelism," "regression" and
Correlation (r) within the limits > 0.05; <0.05 g> 0.98, respectively.
The Lower and Upper limit (4947.5- 5145.7 IU/ml) indicates the result confidence level
(P = 0.95), which must be within the range of 4000-6250 IU / ml.
The nominal value of the sample potency is 5000 IU/ml, the measured value is 5045 IU
/ ml, differing 0.9% from the nominal value. The analysis RSD is 1.19%.
Conclusion: The values in Table 3, 4, 5 and 6 show the method is repeatable as the relative
deviation of measurement results is less than 5%.
2.10. Reproducibility.
The reproducibility is determined by the accuracy, which is obtained when the analysis
is performed by two different people on different days.
Table 7 shows a summary overview for the relative standard deviations of the analysis
presented in tables 3, 4, 5 and 6.
Relative deviation RSD%
Operator Date Lower limit Estimate Upper limit Lower limit Estimate Upper limit
Vagn H. 12.06.15 1 02EOM1 RAP 3452851 4969,0 5105,9 5246,6 99,4 102,1 104,9
Vagn H. 12.06.15 2 02EOM1 RAP 3452851 4903,7 5009,5 5117,4 98,1 100,2 102,3
Vagn H. 12.06.15 3 02EOM1 RAP 3452851 5039,7 5118,1 5197,6 100,8 102,4 104,0
Vagn H. 15.06.15 4 02EOM1 RAP 3452851 4926,6 5024,5 5124,4 98,5 100,5 102,5
Vagn H. 15.06.15 5 02EOM1 RAP 3452851 4870,1 4960,6 5052,8 97,40 99,20 101,10
Vagn H. 15.06.15 6 02EOM1 RAP 3452851 4975,9 5055,2 5135,5 99,5 101,1 102,7
Mean 4947,5 5045,6 5145,7 99,0 100,9 102,9
SD 60,18 59,92 67,63 1,20 1,21 1,34
%RSD 1,22 1,19 1,31 1,22 1,19 1,30
Operator Date Lower limit Estimate Upper limit
Vagn H. 12.06.15 1 02EOM1 RAP 3452851 -96,056 -93,709 -91,363 0,99301 0,919 <0,001
Vagn H. 12.06.15 2 02EOM1 RAP 3452851 -98,952 -97,070 -95,188 0,99467 0,344 <0,001
Vagn H. 12.06.15 3 02EOM1 RAP 3452851 -98,193 -96,798 -95,402 0,99434 0,119 <0,001
Vagn H. 15.06.15 4 02EOM1 RAP 3452851 -93,005 -91,347 -89,690 0,99571 0,642 <0,001
Vagn H. 15.06.15 5 02EOM1 RAP 3452851 -94,125 -92,533 -90,941 0,99632 0,894 <0,001
Vagn H. 15.06.15 6 02EOM1 RAP 3452851 -94,664 -92,967 -91,270 0,99751 0,754 <0,001
Mean -95,832 -94,071 -92,309 0,995
SD 2,35 2,35 2,39 0,00
%RSD 2,45 2,50 2,59 0,16
RUN Standard Batch # Sample Batch # Common Slope Factor
|r|
Results Overview for Heparin 5000 IU RAP 3452851
Potency (IU/ml) Potency (% )relative to assay
Non paralellismRegression
RUN Standard Batch # Sample Batch #

34
Table 7. Reproducibility evaluation in the form of analysis results deviation, based on two preparations
analyzed by two operators.
The difference between results of the two operators and the two preparations is small.
At the same time, the relative deviation is low compared to the expected relative spread (<5%)
in the group of biological assay potency results, in which the heparin assay belongs.
Conclusion: The method is reproducible.
2.11. Requirements for blank amidolytical activity.
The blank amidolytical activity is listed in the pharmacopoeia as an analytical result of
a single sample measuring the ΔOD where, instead of test or standard, is added reagent R1.
During the period of analysis we performed 336 measurements, obtaining the following
results: Mean ΔOD = 344.6, SD = 5.80 and SD% = 1.7%.
The pharmacopoeia requirement reference is: “activity at the beginning and at the end
of the procedure…” “…do not differ significantly”. However, the deviation is not defined. USP
states a limit in terms of RSD <10% for the amidolytic activity measured before and after the
completion of an analysis of 32 samples. The values obtained are well within these limits.
Conclusion: The requirements for Blank Amidolytical activity are met.
2.12. Specificity.
Influence of added excipients on the test results:
The pharmacopeia method has been developed for determining heparin activity in the
raw material, and without added excipients used for formulating a finished product. Heparin
SAD is formulated as unpreserved injections, the only substance added is NaCl, 9 g/L (6.8 to 9.0
g/L) in order to reach an isotonic solution.
Since the pharmacopeia analysis is performed on highly diluted solutions, the
maximum concentration of NaCl in the final sample solutions is be 3 ppm derived from SAD
products. This should be seen in relation to the content of NaCl in the analysis main solvent tris
EDTA buffer with 1% NaCl. NaCl from the sample is, therefore, a negligible proportion of the
total quantity of NaCl in the sample solution.
Based on this, it is estimated that the heparin assay of ready formulated injection,
diluted with tris EDTA buffer, does not give different results when compared to a potency of
equipotent amount of heparin in tris EDTA buffer.
Therefore, the influence on the analytical result of sodium chloride in the IV solution is
not further investigated.
Batch # Data David M.
Heparin 100 IU 4382061
Heparin 5000 IU 3452851
2.47
2.57
1.03
1.19
Data Vagn H.
Relative dispersion

35
3. Conclusion.
The pharmacy´s heparin IV potency can be determined by the implemented method since
relevant analytical parameters, such as accuracy, repeatability, and reproducibility, are within
the demands of the method as:
The specific method is shown valid for a sample containing 1000 IU/ml;
The method is proved accurate (repeatable and reproducible) when used for
Heparin IV SAD products with the lowest and highest potency, 100 and 5000
IU/ml;
The test for “blank amidolytical activity” is fulfilled. Method is specific because the
SAD – products, beside heparin and water, is only added NaCl in minor amounts
compared to the NaCl in the assay reagents.
All the results gathered upon analysis comply with the pharmacopoeia
requirements for potency (containing 90-110% heparin; 80-125% Cl), as well
statistical parameters for assessing the analysis suitability.
4. Acknowledgements
The implementation of the analytical method was possible with the help of Dr. Elaine
Gray and scientist John Hogwood from the National Institute for Biological Standards and
Control (NIBSC), England, as we have been in contact with since the beginning of 2013.
Elaine Gray has worked with heparin testing for many years and has published her work in
the scientific literature. Elaine has been responsible for the development of, for example,
the WHO heparin standard, which is the Pharm. Eur. standard (BRP).
Assistance with the selection of equipment, reagents and analysis for Heparin SAD IV
and a product from LEO, in order to compare results was also provided by Elaine and John.
In addition, our use of Combistats program through the result analysis template was
verified by NIBSC.
On the statistics chapter, assistance was requested from the NNE Pharmaplan, Thomas
Zelikmann, for further understanding of the statistical model used for calculation of results
with CombiStats program.