training wayfinding: natural movement in mixed reality
TRANSCRIPT

University of Central Florida University of Central Florida
STARS STARS
Electronic Theses and Dissertations, 2004-2019
2006
Training Wayfinding: Natural Movement In Mixed Reality Training Wayfinding: Natural Movement In Mixed Reality
Ruthann Savage University of Central Florida
Part of the Psychology Commons
Find similar works at: https://stars.library.ucf.edu/etd
University of Central Florida Libraries http://library.ucf.edu
This Doctoral Dissertation (Open Access) is brought to you for free and open access by STARS. It has been accepted
for inclusion in Electronic Theses and Dissertations, 2004-2019 by an authorized administrator of STARS. For more
information, please contact [email protected].
STARS Citation STARS Citation Savage, Ruthann, "Training Wayfinding: Natural Movement In Mixed Reality" (2006). Electronic Theses and Dissertations, 2004-2019. 882. https://stars.library.ucf.edu/etd/882

TRAINING WAYFINDING: NATURAL MOVEMENT IN MIXED REALITY
by
RUTHANN SAVAGE B.A. California State University Northridge, 1987 M.A. California State University Northridge, 1994
A dissertation submitted in partial fulfillment of the requirements for the degree of Doctor of Philosophy
in the Department of Psychology in the College of Sciences
at the University of Central Florida Orlando, Florida
Summer Term 2006
Major Professor: Richard D. Gilson

© 2006 Ruthann Savage
ii

ABSTRACT
The Army needs a distributed training environment that can be accessed
whenever and wherever required for training and mission rehearsal. This paper describes
an exploratory experiment designed to investigate the effectiveness of a prototype of such
a system in training a navigation task. A wearable computer, acoustic tracking system,
and see-through head mounted display (HMD) were used to wirelessly track users’ head
position and orientation while presenting a graphic representation of their virtual
surroundings, through which the user walked using natural movement. As previous
studies have shown that virtual environments can be used to train navigation, the ability
to add natural movement to a type of virtual environment may enhance that training,
based on the proprioceptive feedback gained by walking through the environment.
Sixty participants were randomly assigned to one of three conditions: route
drawing on printed floor plan, rehearsal in the actual facility, and rehearsal in a mixed
reality (MR) environment. Participants, divided equally between male and female in
each group, studied verbal directions of route, then performed three rehearsals of the
route, with those in the map condition drawing it onto three separate printed floor plans,
those in the practice condition walking through the actual facility, and participants in the
MR condition walking through a three dimensional virtual environment, with landmarks,
waypoints and virtual footprints. A scaling factor was used, with each step in the MR
environment equal to three steps in the real environment, with the MR environment also
broken into “tiles”, like pages in an atlas, through which participant progressed, entering
each tile in succession until they completed the entire route.
iii

Transfer of training testing that consisted of a timed traversal of the route through
the actual facility showed a significant difference in route knowledge based on the total
time to complete the route, and the number of errors committed while doing so, with
“walkers” performing better than participants in the paper map or MR condition,
although the effect was weak. Survey knowledge showed little difference among the
three rehearsal conditions. Three standardized tests of spatial abilities did not correlate
with route traversal time, or errors, or with 3 of the 4 orientation localization tasks.
Within the MR rehearsal condition there was a clear performance improvement over the
three rehearsal trials as measured by the time required to complete the route in the MR
environment which was accepted as an indication that learning occurred. As measured
using the Simulator Sickness Questionnaire, there were no incidents of simulator sickness
in the MR environment.
Rehearsal in the actual facility was the most effective training condition; however,
it is often not an acceptable form of rehearsal given an inaccessible or hostile
environment. Performance between participants in the other two conditions were
indistinguishable, pointing toward continued experimentation that should include the
combined effect of paper map rehearsal with mixed reality, especially as it is likely to be
the more realistic case for mission rehearsal, since there is no indication that maps should
be eliminated. To walk through the environment beforehand can enhance the Soldiers’
understanding of their surroundings, as was evident through the comments from
participants as they moved from MR to the actual space: “This looks like I was just here”,
and “There’s that pole I kept having trouble with”. Such comments lead one to believe
that this is a tool to continue to explore and apply.
iv

While additional research on the scaling and tiling factors is likely warranted, to
determine if the effect can be applied to other environments or tasks, it should be pointed
out that this is not a new task for most adults who have interacted with maps, where a
scaling factor of 1 to 15,000 is common in orienteering maps, and 1 to 25,000 in military
maps. Rehearsal time spent in the MR condition varied widely, some of which could be
blamed on an issue referred to as “avatar excursions”, a system anomaly that should be
addressed in future research.
The proprioceptive feedback in MR was expected to positively impact
performance scores. It is very likely that proprioceptive feedback is what led to the lack
of simulator sickness among these participants. The design of the HMD may have aided
in the minimal reported symptoms as it allowed participants some peripheral vision that
provided orientation cues as to their body position and movement. Future research might
include a direct comparison between this MR, and a virtual environment system through
which users move by manipulating an input device such as a mouse or joystick, while
physically remaining stationary.
The exploration and confirmation of the training capabilities of MR as is an
important step in the development and application of the system to the U.S. Army
training mission. This experiment was designed to examine one potential training area in
a small controlled environment, which can be used as the foundation for experimentation
with more complex tasks such as wayfinding through an urban environment, and or in
direct comparison to more established virtual environments to determine strengths, as
well as areas for improvement, to make MR as an effective addition to the Army training
mission.
v

ACKNOWLEDGMENTS
This experiment could not have been accomplished without the involvement and
dedication of a number of people. Dr. Bruce Knerr and Dr. Bob Witmer, my mentors at
the Army Research Institute were directly responsible for giving me this project, with the
confidence that I would be able to accomplish a study that would be useful to the U.S.
Army training mission. Mr. Glenn Martin and Mr. Jason Daley produced the amazingly
realistic 3 dimensional computer model of the fourth floor of the Partnership II building,
and were patient with my requests for tweaks, and training on the computer systems. Dr.
Sherrie Jones, of USMC, PM TRASYS, made sure the secured space was accessible
anytime I needed it during the week, while Colonel Robert Parrish of USMC Reserves
was my escort on weekends. Mr. Kevin Oden assisted in running all 60 participants
through this experiment, and I am truly grateful for his upbeat, positive attitude. Dr.
Sally Stader was my sounding board; a critical listening ear that questioned and
challenged, as I progressed through this dissertation process, while always being positive
and supportive. I appreciate Sally more everyday.
The members of my committee deserve my special thanks for the time they spent
reviewing and providing advice on my work, to be sure I was communicating as clearly
as possible what I meant to communicate. Thank you, Dr. Valerie Gawron, Dr. Stephen
Goldberg, Dr. Mustafa Mouloua, and Dr. Valerie Sims.
Finally, not just this dissertation, but my success in completing this degree, is the
direct result of the personal and professional support of Dr. Richard Gilson. He believed
in me from the beginning, even when things were at their worst. I thank him for taking a
chance with me, and always believing in me, especially during those times when I didn’t.
vi

There are people who teach without concern for students’ progress. There are those who
teach because it’s part of having their research associated with a major university. Then
there are those rare people whose entire life is an amalgam of research, invention,
creativity, enthusiasm, teaching and leadership; whose mantra is “Let’s get you
graduated”, and means it. I’ve been blessed to have “Dr. G.” as my advisor and mentor,
am thankful to him for all he has done, and proud to join his photo line up of graduates.
vii

TABLE OF CONTENTS
ABSTRACT....................................................................................................................... iii
TABLE OF CONTENTS................................................................................................. viii
LIST OF FIGURES ............................................................................................................ x
LIST OF TABLES............................................................................................................. xi
LIST OF ACRONYMS .................................................................................................... xii
CHAPTER ONE: INTRODUCTION................................................................................. 1
CHAPTER TWO: LITERATURE REVIEW..................................................................... 3
CHAPTER THREE: METHODOLOGY ......................................................................... 11
Participants.................................................................................................................... 11
Equipment and Materials .............................................................................................. 12
Hardware................................................................................................................... 14
Software .................................................................................................................... 18
Model ........................................................................................................................ 20
Tests of Spatial Abilities............................................................................................... 21
Questionnaires........................................................................................................... 23
Experimental Design..................................................................................................... 26
Task and Procedure................................................................................................... 28
CHAPTER FOUR: DATA ANALYSIS........................................................................... 35
Description of Variables and Measures ........................................................................ 35
Effectiveness of MR on Performance Measures (Route and Survey Knowledge)... 39
Comparison of Spatial Abilities Tests to Performance Measures ........................... 41
Learning in Mixed Reality ........................................................................................ 45
viii
MR and Simulator Sickness...................................................................................... 48
CHAPTER FIVE: CONCLUSION................................................................................... 52
APPENDIX A: FLOOR PLAN: ROUTE, LANDMARKS AND LOCALIZATION ..... 59
APPENDIX B: ORIENTATION LOCALIZATION ....................................................... 61
APPENDIX C: FLOOR PLAN USED FOR PAPER MAP REHEARSAL..................... 63
APPENDIX D: ............................... 65EXPERIMETER SCRIPTS AND PROCEDURES
APPENDIX E : DEMOGRAPHICS QUESTIONNAIRE .............................................. 85
APPENDIX F: ROUTE DIRECTIONS FOR MEMORIZATION ................................. 87
APPENDIX G: IRB APPROVAL LETTER ................................................................... 91
REFERENCES ................................................................................................................. 93
ix

LIST OF FIGURES
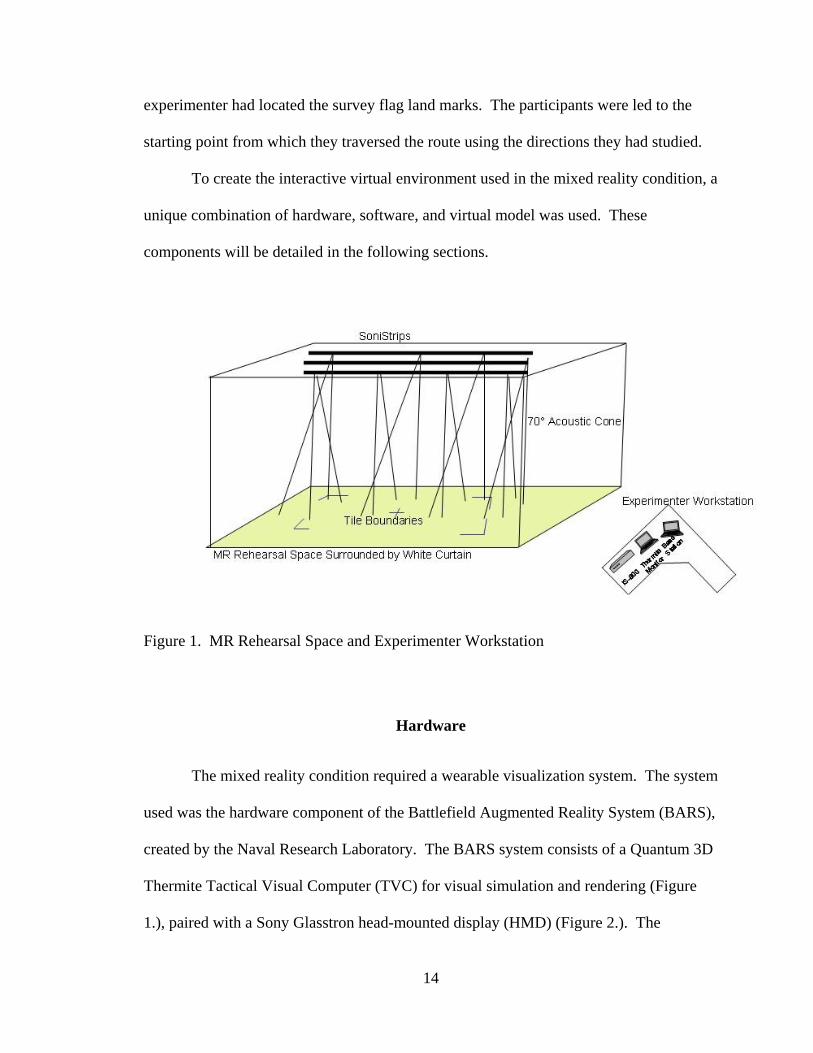
Figure 1. MR Rehearsal Space and Experimenter Workstation ...................................... 14
Figure 2. Quantum3D Thermite Tactical Visual Computer ............................................ 15
Figure 3. Sony Glasstron Head Mounted Display ........................................................... 16
Figure 4. InterSense IS-900 VET Base Station ............................................................... 16
Figure 5. InterSense Wireless Unit .................................................................................. 18
Figure 6. InterSense SoniStrip ......................................................................................... 18
Figure 7. Moving between two sections of the route....................................................... 31
Figure 8. Model Diagram Showing Tiles, Tile Coordinates and Route .......................... 46
Figure 9. Diagram of environment showing all information. .......................................... 60
Figure 10. Orientation Localization Page ........................................................................ 62
Figure 11. Floor Plan Used for Paper Map Rehearsal ..................................................... 64
x

LIST OF TABLES
Table 1. Situational data taken from question 15 of Motion History Questionnaire....... 24
Table 2. Simulator Sickness Questionnaire Data used in analysis of symptoms............. 26
Table 3. Analysis of Variance for Traversal Errors......................................................... 39
Table 4. Post Hoc with Scheffe adjustment for Traversal Errors .................................... 40
Table 5. Analysis of Variance for Time to Complete Route ........................................... 40
Table 6. Post Hoc with Scheffe adjustment for Time to Complete ................................. 40
Table 7. Analysis of Variance for Survey Knowledge .................................................... 41
Table 8. Descriptive Statistics of Spatial Abilities Tests................................................. 42
Table 9. Correlation of Spatial Abilities Tests and Route Knowledge............................ 42
Table 10. Correlation between Spatial Abilities and Survey Knowledge Performance .. 44
Table 11. ANOVA for Time spent in each Tile over 3 Trials ......................................... 47
Table 12. Means of Three Rehearsal Trial Times by Tile ............................................... 48
Table 13. ANOVA Post Test SSQ (W) Inventory........................................................... 50
Table 14. ANOVA Post Test SSQ (R) Inventory ............................................................ 51
xi

LIST OF ACRONYMS
AR Augmented Reality BARS Battlefield Augmented Reality System Eds Editors EISA Extended Industry Standard Architecture GPS Global Positioning System GLONASS Global Navigation Satellite System HMD Head Mounted Display IEEE Institute of Electrical and Electronics Engineers LCD Liquid Crystal Display MR Mixed Reality MOUT Military Operations in Urban Terrain NAVAIR Naval Air Station NRL Naval Research Laboratory PCI Peripheral Component Interconnect U.S. United States UAV Unmanned Aerial Vehicle UCF University of Central Florida USMC United States Marine Corps VE Virtual Environment
xii

CHAPTER ONE: INTRODUCTION
About thirty years ago, during training in basic map reading, a U.S. Army basic
trainee listened as a drill sergeant instructed the class on map folding and layout, with the
caution to keep oneself oriented by always knowing where north was in relationship to
the trainee’s position. If a trainees found themselves to be so misoriented that they were
unable to locate any of the cardinal directions, they were told to “shake a tree, and watch
it move on the map”. Since the entire class of trainees was very nervous, earnest, and
intent on learning map-reading skills, this joke experienced a very flat landing. Now,
however, the shake-a-tree method of orientation may have applicability while using
training systems with displays of virtual environments.
The U.S. Army has a continuing need for training that ranges from basic training
of new recruits through mission rehearsal, and after action reviews, that provide
opportunities for immediate feedback on specific skills, tactics and strategies. The use of
simulation technologies provides the opportunity to train in realistic environments
without the associated expense of creating physical replications of environments of
interest. Mixed reality (MR) technology, in this case providing a three dimensional
virtual environment through which the user may walk as if in the actual space, has the
potential to provide not only a simulated environment in which to train, but to do so
while being mobile. MR has an advantage over an immersive virtual environment (VE)
in that the Soldier trainee can physically move through the simulated environment using
natural movements with less computer equipment than that required to generate a VE.
The system used in this experiment to present the MR was the Battlefield
Augmented Reality Systems (BARS) which was developed by the Naval Research
1

Laboratory, with some collaborative work with Columbia University. The intended use
for BARS is to provide the wearer with information about their surroundings by
presenting data from a central command center to the head mounted display, through
which the wearer sees the real world with labels and or graphics. For example, a vehicle
driver might have a route laid onto an austere environment where there are little or no
landmarks to provide orientation or guidance. Dismounted infantry could be provided
information about the location of enemy combatants that has been gathered using
unoccupied aerial vehicles, and transmitted to them through a command center. BARS
has been demonstrated to be compatible with both indoor tracking systems and global
positioning system (GPS) technology, providing an opportunity for outdoor use.
The potential training applications of MR, as presented using BARS, or a similar
system, are numerous, once the system has been demonstrated to be an effective tool in a
specific training task. This experiment is an exploratory study, designed to consider the
utility of using MR technology in the training of wayfinding, a basic skill required of all
Soldiers, and one that has been used in previous experiments concerned with the
effectiveness of training systems.
2

CHAPTER TWO: LITERATURE REVIEW
The use of virtual environments (VE) in training has been explored through many
efforts, each of which was a step in determining if the result of training in VE was
equivalent to traditional training, while providing some additional benefit. Some of the
potential benefits of training for dismounted infantry using VE identified by Nemire
(1998) include the fact that regardless of whether the VE is presented using a computer
workstation wherein the user navigates using a keyboard and mouse, or are fully
immersive, they give the user the opportunity to interact with the environment in real
time. If given the capability of interacting with the environment using manual and or
speech commands the users benefit from multisensory experiences, with the potential to
conduct mission planning and rehearsal on simulated battlefields, providing spatial
awareness that is not available with other training media, and minimizing risk to
personnel, equipment or the environment.
The use of mixed reality (MR) in training should provide the same benefits as
those provided by the use of VE in training, while in addition providing the added benefit
of the mobility of the technology, its smaller footprint, and reduced programming
requirements. Specifically MR may be useful as a mission rehearsal tool in a theater of
operations by providing the opportunity to train dismounted soldiers to navigate through
a specific combat zone by providing a rehearsal space created based on information
acquired through multiple sources including (unoccupied aerial vehicle) UAV
reconnaissance, global positioning systems (GPS), topological maps, city plans, and
building plans.
3

In their discussion concerning the use of augmented reality (AR) in military
operations in urban terrain (MOUT), Livingston, Brown, Gabbard, Rosenblum, Yohan,
Julier, Swan and Hix (2002) saw BARS, an augmented reality system they were
developing at the Naval Research Laboratory, as a possible source for embedded training
for dismounted warriors. They were interested in how BARS might impact training at
three levels: “as a means to blend synthetic and live forces; as a means to provide
“training wheels” to show trainees critical information; and as a tool tot assist trainers in
constructing and operation a training scenario” (Livingston, et al., 2002, p. 7). Given the
typical size and barrenness of a current MOUT facility, BARS was suggested as a tool to
add detail to the buildings, as well as to expand the size of the facility virtually, by
showing the trainee additional streets and buildings through the BARS HMD. In addition
to building features BARS was considered a potential source for the insertion of synthetic
forces, or even live forces from a different MOUT site. The “training wheels” feature of
BARS was anticipated to be helpful in identifying situations that might ultimately be fatal
if a trainee did not approach the situation properly, and to provide a feedback, or re-play
feature, for after action reviews and analyses of what had occurred during the training
session. Finally trainers could use BARS to monitor the whereabouts of trainees that
were not physically visible, or could make training scenarios more compelling and
difficult.
Columbia University (2004) has performed several development demonstrations
and experiments with the system they call MARS, their mobile augmented reality system,
which has been in development since 1996. As technology has advanced this research
group has incorporated the latest technologies. They used differential GPS until real-time
4

kinematic global positioning system plus global navigation satellite system
(GPS+GLONASS) became available. Their wireless network was originally built on a
spread spectrum system developed internally, but now uses IEEE 802.11a/b. In a desire
to use commercial off the shelf materials, this group often found themselves using items
that where heavier and more bulk than they would have otherwise desired, but those were
the systems that would allow the greatest amount of flexibility. They have transitioned
from a FieldWorks laptop computer, with three Peripheral Component Interconnect,
(PCI) and three Extended Industry Standard Architecture (EISA) expansion slots that
were used to incorporate a 3D graphics adaptor and a serial port expansion card, to
laptops with built in 3D graphics processors as they became common in the marketplace
starting in 2001. As time has passed this program has been able to decrease the size and
weight of their system while increasing the capacity and speed of the human mounted
mobile computer.
BARS and MARS are closely related augmented reality systems, both of which
have been demonstrated to successfully augment real world scenes, both indoors under a
tracking system and outdoors using GPS systems for location data. The reduction in
required computer hardware to produce an AR environment in comparison to a VE
environment reduces the logistical load in shipping electronic equipment, increases
flexibility in operational space requirements, and reduces demands on consumable
resources such as locally generated electricity. The ability to use an AR system to create
MR provides additional training and mission rehearsal opportunities by using previously
developed technology in a different application, that is, providing a virtual environment
through which the user can move naturally.
5

If MR is as good as, or better than, traditional training, it is possible that further
development efforts for MR, as a training tool would be recommended. In comparison to
VE, the reduced programming requirements, the fact that the system can be human
mounted and that the human moves on solid ground using natural movement, what
Arthur and Hancock (2001) refer to as the added benefit of kinesthetic cues not available
in maps, may make it preferable for training and mission rehearsal. One step in
determining the feasibility of using MR as a mission rehearsal tool, as suggested above, is
to compare its effectiveness in training navigation skills.
Exploration of VE has been shown to be at least as effective (Arthur and Hancock
2001) as spatial learning through exploration of a real world environment. While
congruency between VE and the real world may be a concern given scaling issues, the
relative relationships of objects, and distances between them, should accurately transfer
from one environment to the other when evaluating transfer of training.
Banker (1997) in evaluating transfer of training from map study, VE combined
with map study, and study in the actual environment found that the participants
navigational ability had more of an effect on performance than the training condition,
however, within the treatment groups those with intermediate navigational skills
benefited the most from exposure to VE, while beginners appeared to be overloaded with
information and experienced navigators used the VE to pinpoint specific locations or
waypoints. The sample size for this study was small, but it still may point to VE as being
more effective in training a navigational task than study of a paper map alone.
The complexity of the environment and path to traverse may make a difference in
the effectiveness of VE as a training tool. Schlender, Peters, and Wienhofer, (2002)
6
while working with a desktop VE randomly assigned participants to one of five
conditions: having a map available during the entire test, only able to view the map prior
to the start of the test, having textual information available throughout the test, or only
prior to the start of the test and finally, no additional navigational cues. Overall, having
some information available during the test was more effective than having the
information available only before the start of the test.
Darken, and Sibert, (1993) used information about how both birds and humans
use real world information to aid in providing cues for navigational tasks. They also
considered map design, cognitive mapping principles and how cartographers and
planners may use those data to select tools to be used in navigating a simple VE. They
found they could make some general conclusions based on the small sample set that they
studied which included that people are predictable about the way they use environmental
cues. Cues are used in dividing up a space that is being searched, and to maintain
directional relationships, especially for cues that are static in an environment and can be
seen from anywhere within the environment. Multi-modal combinations of cues, e.g.
auditory and visual, can make targets easier to find. The ability to "fly" over an
environment in VE is a tool that allows the individual the opportunity to store a "bird’s
eye view" of the environment, which is likely to change how they explore or navigate
through that environment. Thus the tool an individual uses makes a difference in their
behavior and in task performance. In Darken and Sibert's (1993) work they concluded
that because their navigational tasks were 2D and performed on a 2D surface,
cartographers design guidelines could be used to extend characteristics of the real world
7

to the virtual world. This leads them to suppose that if they had included a 3D task in
their study that their 2D maps might have been less helpful.
There are generally three types of knowledge about an environment: landmark
knowledge which is based on information about noticeable objects in an area, route
knowledge, which is ego-referenced and acquired by personal travel through an area, and
survey knowledge, which is exocentric and acquired through map memorization and or
exploration of an area using different routes. Using route knowledge allows one to
successfully move from one known point to another known point along a specific route,
using landmarks and waypoints, but doesn't allow for deviations from the route. Route
knowledge allows one to know the approximate distance between landmarks along the
route they've traveled because learning is formed by sequential travel, which results in
better recall when provided in the direction the route was learned, as well as the ability to
give directions to guide some one else along the path (Allen and Kirasic, 1985). Route
knowledge does not allow for the creation of short cuts or alternate routes through an
environment.
Survey knowledge is typically acquired through multiple explorations of an
environment while using different routes, through map learning, or textual information
about the environment, and is characterized by the ability to take an exocentric viewpoint
which is then utilized in developing a mental representation of an area as seen from a
birds’ eye point of view. This mental representation of a physical map is often referred to
as a cognitive map (Goldin and Thorndyke, 1982). Survey knowledge built on personal
experience gained through exploration of an area is a primary experience (Presson and
Hazelrigg, 1984), while survey knowledge that is built through the study of maps or
8

pictures is considered a secondary experience (Goldin and Thorndyke, 1982; Thorndyke
and Hayes-Roth, 1982). Some studies indicate that learning survey data from paper maps
is inferior to that learned through exploring the area (Presson and Hazelrigg, 1984; Scholl
1993), which is based on the orientation and location of landmarks. Having both route
and survey knowledge results in complete navigational knowledge, where the distances
between, and location of, landmarks are known and routes can be inferred even though
they have not been traveled before.
This experiment compared the effectiveness of paper map based rehearsal,
physical route rehearsal, and route rehearsal in a mixed reality environment, to achieve an
acceptable level of proficiency. This was performed in a manner similar to Witmer et al
(1996), in which training based on rehearsal of the actual route was compared to training
based on rehearsal of the route in a virtual environment. Up to the point of this
experiment there had been a small number of studies conducted that examined training
accomplished in VE, with initial work investigating how performance improved with
practice, but not how the training affected performance in real world settings. Resolution
of detail and reduced fields of view were seen as having direct impact on the ability to
use VE in training because of the resulting distance discrimination and spatial distortion
issues inherent to the display devices available at that time. Locomotion was another
factor that Witmer et al. considered, identifying a lack of proprioceptive feedback as a
feature missing from what a user experiences when operating in the real world, a
situation that could cause difficulty in estimating distance traveled, as well as lead to
symptoms of simulator sickness such as nausea, dizziness or eyestrain.
9

Perceived personal abilities in navigation (Cevik, 1998; Banker, 1997) and/or
spatial orientation were thought to have an effect on participants’ motivation and effort in
learning the experimental task. Individual differences in feelings of presence or adverse
reactions to computer-generated environments, such as motion sickness, were also
considered as having a potential impact on participants’ acceptance of BARS as a
training tool (Bernatovich, 1999; Stanney, and Salvendy, 1997). An affinity for
computers and other technology used in MR systems may also be a factor if participants
participate in computer-based gaming; therefore data was captured on each of these items
in addition to participants’ objective performance scores.
10

CHAPTER THREE: METHODOLOGY
Participants
Participants for this study were 60 volunteers with 20 participants randomly
assigned to each practice condition, equally divided with 10 males and 10 females in each
group. The participants were recruited through various on campus communications
systems, and received compensation in the form of class credit, or cash in the amount of
$20.00. Most participants were undergraduates, 47% of whom were in their first year of
college, and ranged in age from 18-52. The average age was 24, while 50% of were 18
or 19 years old. All participants reported their visual acuity as 20/20, including those
using corrective lenses, and none reported visual color deficiency. Only one participant
reported being ill within the past week, but felt capable of participating as the illness was
a common cold that was not impairing any cognitive function.
The number of hours spent each week using a computer ranged from 2 to 60, with
a mean of 25, and a standard deviation of 13.36. In addition to time spent using a
computer, participants reported an average of 2.89 hours per week spent playing video
games, with a range of 0 to 35 hours reported. On a scale of one to ten, 1 being never
misoriented and 10 meaning they always have trouble finding their way around,
participants on average rated themselves as 5, with a range that covered the entire 10
point scale. Most participants indicated they used maps on a monthly basis (27 or 45%),
while 9 reported map usage at once a year, and 19 once a week. Five participants
reported never using maps. When using a map, 55% (33) reported orienting the map with
North always “up”, or toward the top of the page.
11

None of the participants were familiar with the office space used in the study as it
was a secured area of the building, accessible only by personnel assigned to that space.
Each participant completed three spatial abilities tests, a survey of motion sickness
history, a survey of simulator sickness history, and a simulator sickness inventory prior to
starting the experimental task, and additional simulator sickness inventories at critical
points, including the end of their practice sessions. Participants were informed that they
were permitted to decline to participate at any point in the study process without penalty.
Equipment and Materials
The route used for this experiment is in a restricted area of the fourth floor of a
large office building; Partnership II, in the Central Florida Research Park, Orlando, FL.
The building was five-stories, with 75,000-square-feet of space which housed the
University of Central Florida (UCF) Team Performance, Cognitive Science and
Simulation and Distributed Learning laboratories; the Institute for Simulation and
Training offices, and offices for U.S. Navy, NAVAIR Orlando; the U.S. Army's Program
Executive Office for Simulation, Training and Instrumentation; and the U.S. Marine
Corps Program Manager for Training Systems. The route designed for the experiment
wound through approximately 7,000 square feet of a secured area of the building made
up of cubicle office spaces, to which was added 15 survey flags as landmarks, 4 each
blue, white and pink, and 3 orange. The cubicle area was situated on the south side of the
building, with a wall of windows on the south side of the space, and a dividing walkway
on the north side that was located in the approximate center of the building. The north
side of the building, opposite the cubicle area was made up of hard walled offices. The
12
route was designed to be confined to the cubicle space, except for one segment of the
route that entered the walkway. The route included 19 decision points: 12 turns without
redundant coding, that is, only one cue given to identify the turn, and 7 intersections with
no direction change.
Clipboards were hung at two specific orientation localization assessment stations
along the route. Station one was located at the approximate center of the route, 145°
from the starting point and 209° from the end.. Station two was located in the aisle
furthest from the starting point, with an angle of 299° from the start of the route and 329°
from the end of the route. Participants were instructed to stand facing the clipboard,
which for station one placed them with their back to the start, while at station two they
were positioned with both the start and end points in front of them. At neither position,
however, were the participants able to see these points given the intervening office
cubicles walls. Please see Appendix A for a diagram of the office space that shows the
location of the landmarks, and the orientation localization stations. Appendix B is a copy
of the diagram that was posted at each orientation localization station.
The diagram in Appendix C is a copy of the floor plan that shows the starting
point and the locations of the survey flags that were used for the three practice trials by
the paper map condition participants. All route direction markings, orientation
localization points and accompanying directional measurement lines, the description of
the environment in the lower right corner, and the end of the route have been removed
from the diagram shown in Appendix A. Participants in the physical route practice
condition were moved to the fourth floor USMC cubicle space, within which the
13
experimenter had located the survey flag land marks. The participants were led to the
starting point from which they traversed the route using the directions they had studied.
To create the interactive virtual environment used in the mixed reality condition, a
unique combination of hardware, software, and virtual model was used. These
components will be detailed in the following sections.
Figure 1. MR Rehearsal Space and Experimenter Workstation
Hardware
The mixed reality condition required a wearable visualization system. The system
used was the hardware component of the Battlefield Augmented Reality System (BARS),
created by the Naval Research Laboratory. The BARS system consists of a Quantum 3D
Thermite Tactical Visual Computer (TVC) for visual simulation and rendering (Figure
1.), paired with a Sony Glasstron head-mounted display (HMD) (Figure 2.). The
14

Thermite computer was equipped with a 1GHz Transmeta Crusoe CPU, an NVIDIA
GeForce 5200 GPU, and 480 MB of RAM. While underpowered for the complexity of
the environment, this configuration was sufficient to render and visualize the virtual
environment at interactive frame rates of approximately 12 frames per second with
latency at 0.02 seconds or less, which satisfied the requirement for a wearable
visualization system. The Glasstron HMD provides a monoscopic binocular view of the
environment at 800x600 pixel resolution. While the Glasstron is capable of providing an
optical see-through display, this feature was not used in this work. A wireless keyboard
and mouse provided input control to the Thermite.
Figure 2. Quantum3D Thermite Tactical Visual Computer
15
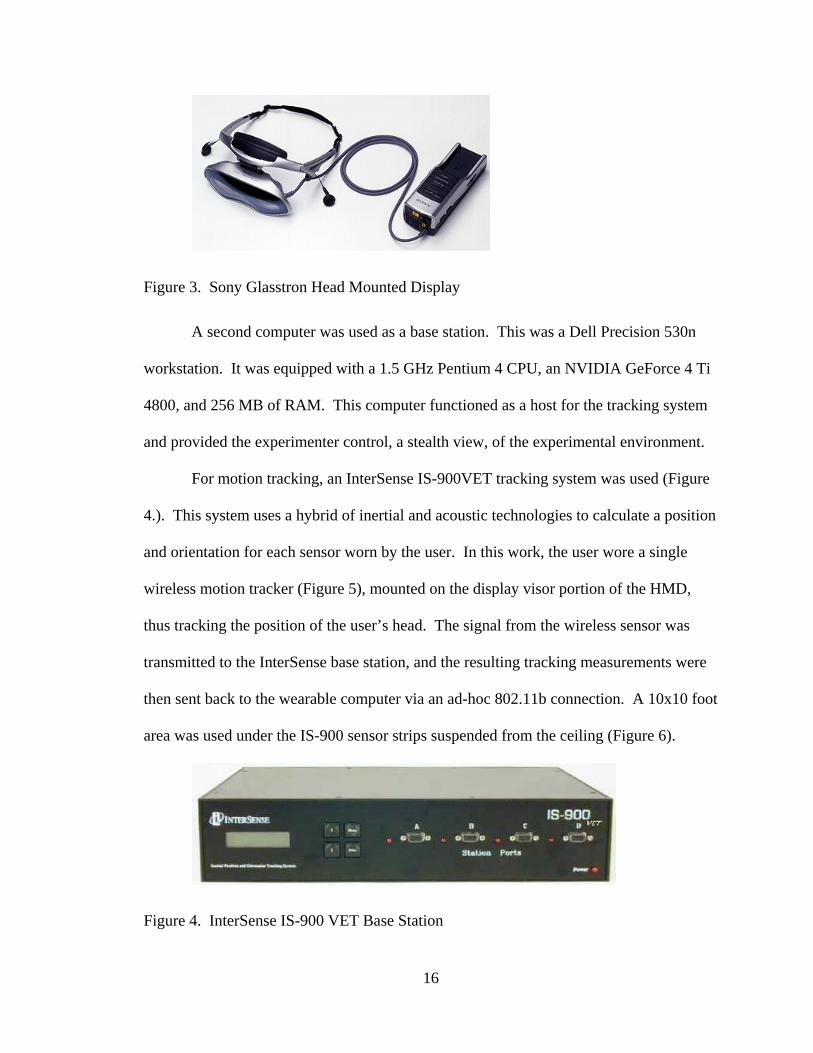
Figure 3. Sony Glasstron Head Mounted Display
A second computer was used as a base station. This was a Dell Precision 530n
workstation. It was equipped with a 1.5 GHz Pentium 4 CPU, an NVIDIA GeForce 4 Ti
4800, and 256 MB of RAM. This computer functioned as a host for the tracking system
and provided the experimenter control, a stealth view, of the experimental environment.
For motion tracking, an InterSense IS-900VET tracking system was used (Figure
4.). This system uses a hybrid of inertial and acoustic technologies to calculate a position
and orientation for each sensor worn by the user. In this work, the user wore a single
wireless motion tracker (Figure 5), mounted on the display visor portion of the HMD,
thus tracking the position of the user’s head. The signal from the wireless sensor was
transmitted to the InterSense base station, and the resulting tracking measurements were
then sent back to the wearable computer via an ad-hoc 802.11b connection. A 10x10 foot
area was used under the IS-900 sensor strips suspended from the ceiling (Figure 6).
Figure 4. InterSense IS-900 VET Base Station
16

The InterSense tracks the participant using six degrees of freedom which includes
X, Y, and Z position data, along with yaw, pitch and roll orientation data. The SoniStrips
have ultrasonic SoniDisc transponders that receive addressed signals from the Base
Processor Unit and transmit ultrasonic pulses in response. The acoustic transmission
beam width for each SoniDisc is adjusted for wide-angle coverage (approx. 70-degree
cone angle) to maximize the tracking area. The IS-900 uses an acoustic time-of-flight
(TOF) ranging system to prevent position and orientation drift. For maximum accuracy
and resolution, acoustic range measurements are made with unidirectional measurements
from the SoniStrip transmitters to the tracker.
The SoniDiscs’ acoustic pulses are detected by where a command from the
Processor first triggers a SoniDisc transmitter in the SoniStrips to send a 40 kHz
ultrasonic pulse, while at the same time, separate timer counters are started in the tracker
and then halted by the arrival of the unique acoustic pulse signature. Using the speed of
sound (which is calculated from the measured ambient temperature), range measurements
are obtained and used to compute position.
The tracker is a MiniTrax tracked station operated without cabling to the IS-900
processor by using the IS-900 Wireless Module. The Wireless Module has two
components: the receiver component shown below on the left, that plugs into the IS-900
Processor, and a rechargeable, battery operated transmitter that is connected to a small
body worn transmitter that is attached to the HMD using hook and pile tape, and plugs
directly in to the MiniTrax Station.
17

Figure 5. InterSense Wireless Unit
Figure 6. InterSense SoniStrip
Software
Although the BARS system hardware was used, the BARS software was not used
in this experiment. The simulation software was based on the Virtual Environment
Software Sandbox (VESS) written by the University of Central Florida Institute for
Simulation and Training. This particular VESS configuration made use of the Open
Scene Graph as an underlying graphics library. VESS adds the capability to drive the
InterSense tracking system and convert the tracking measurements into motion in the
virtual environment.
One challenge in this work was to devise a way to allow a 10x10 foot tracking
area to provide a realistic walking interface for a virtual environment that was much
18

larger. This challenge was addressed with two techniques. First, the user’s real-world
motion was scaled up by a factor of three in the virtual environment. This means that one
step by the user translated into the equivalent of three steps in the virtual environment.
However, the virtual environment was still larger than 30x30 feet. To address this, the
software included a tiling system that allowed the user to move about in a single 30x30
foot section of the environment at a time. When the user moved outside the 10x10 foot
tracking area, he or she implicitly left the current 30x30 foot tile in the virtual
environment. When this happened, the user’s display was blanked, and a spotter
physically walked the user to the opposite edge of the tracking area. Once repositioned,
the display was reactivated, and the user was free to move in the next tile of the virtual
environment.
As a visual aid, the user left “footprints” in the virtual environment, showing
where he or she had already walked. The footprints were shown as a texture resembling
black shoe impressions drawn on the floor wherever he or she had previously been.
In addition to the virtual environment visualization capabilities, the software also
included a module that collected the experimental data. The user’s position and
orientation were captured at 0.1 second intervals and the total route traversal time was
also captured. Data was collected directly on the Thermite wearable computer.
The same software in a different configuration was used to drive the
experimenter’s stealth display. Instead of the first-person viewpoint the user was given,
the stealth display showed the environment from above in a top-down view. An avatar
was positioned on the display, showing the user’s position and orientation, including the
19

use of the previously described footprints. The correct route was drawn as an easy
reference for the experimenter.
Due to the Thermite’s limited capabilities and the complexity of the virtual
environment model, the system was not capable of updating at interactive frame rates.
To address this, the programmer took advantage of the nature of the virtual environment
(a set of rows of cubicles), and a feature of the Open Scene Graph library, which made
the environment, was amenable to a culling technique known as occlusion culling. The
cubicle walls along each row as well as the walls at the ends of each row were identified
as occluders in the environment. These occluders were compared with the viewpoint at
each update cycle. Any geometry that was determined to be behind the occluder surfaces
was not drawn. Because of the nature of the environment, occlusion culling significantly
reduced the number of triangles drawn during each frame, thus helping to bring the
simulation’s frame rate up to interactive rates.
Model
The bulk of the virtual model was created using the original CAD designs for the
building as a basis. In addition to providing floor plans for the building and showing
where each row of cubicles was positioned, actual 3D cubicle furniture was provided in
the CAD drawings. The AutoCAD drawings were converted into the OpenFlight format
used by MultiGen Creator. After converting and assembling the various CAD models,
and creating the remaining building geometry, digital photos were taken of the actual
building environment and converted to texture maps. These were then applied to the
models.
20

Several of the CAD furniture models (those with curved surfaces) had a very high
triangle count. In an effort to improve the frame rate, these heavyweight models were
manually decimated (by selectively removing or combining triangles) without an
appreciable loss of detail. After this was done, some of them were further decimated to
create a lower level of detail that was used when the user’s viewpoint was relatively far
from the object.
After the basic environment was complete, it was noted that there were additional
pieces of furniture and appliances, such as armchairs, copiers, laser printers, and water
fountains, positioned at the ends of the cubicle rows. Since the participants could
conceivably use these objects as positional cues, the most noticeable objects were
modeled using measurements and digital photos as a reference. When complete, the
virtual environment resembled the actual test environment with a high degree of fidelity.
Tests of Spatial Abilities
Each participant completed three tests of spatial abilities. The first was the Cube
Comparison test from the Manual for Kit of Factor-Referenced Cognitive Tests,
(Ekstrom, et al., 1976) which is intended to measure the participants’ ability to see spatial
patterns or maintain their own orientation with relation to objects in space. This test,
which was based on L.L. Thurstone’s work (Ekstrom, et al., 1976) on intelligence testing
which used a cube comparison task, required the participant compare two cubes and
determine if they were the same cube in two orientations, or two different cubes. There
were two sets of 21 comparisons for which participants were allowed three minutes to
21

complete. Scoring for this test consisted of the number correct answers minus the
number of incorrect answers. Guessing on answers therefore was not advantageous.
The second test was also from the Manual for Kit of Factor-Referenced Cognitive
Tests, (Ekstrom, et al., 1976), and was intended to measure the participants’ ability to
mentally manipulate or transform a diagram into another arrangement, and is known as
the Surface Development Test. This test is also based on a similar test developed by L.L.
Thurstone, which was also called the Surface Development test (Ekstrom, et al., 1976).
For this test participants were presented with a drawing of a solid object that could be
created by folding paper, while next to it was a drawing of an unfolded piece of paper,
which might be folded to create the solid object. The unfolded diagram had one marking
that corresponded to a mark on the solid object, and several edges of the diagram were
numbered. The task was to show which of those numbered edges corresponded to the
lettered edges of the solid object. There were six drawings in each of two sections with
six minutes allotted for each section. The scoring method for this test stated “score on
this test will be the number of correct letters minus a fraction of then number of incorrect
letters” (Ekstrom, et al., 1976); however the correction factor was not identified in the
manual. A search among the literature concerning tests of spatial abilities found that in
their work in conducting an examination of the factor structure of the Armed Services
Vocational Aptitude Battery (ASVAB), Wothke, et al. (1991) used the surface
development test from the Manual by Ekstrom, et al. (1976). In a personal
communication with Dr. Ruth Ekstrom, Wothke et al. (1991) were instructed to use the
number of correct answers as the score for this test because the number of response
alternatives varied throughout the test (Wothke et al., 1991). Based on that
22

communication the surface development test for this experiment used the absolute
number of correct answers as the participants’ score.
The third spatial abilities test was the spatial orientation test from the Guilford-
Zimmerman Aptitude Survey (Guilford, 1948), which was based on work done with
aircrew members during World War II. The intent of this test is to measure participants’
awareness of spatial relationships, emphasizing direction of movement by using pictures
of boats and relationships with the surrounding environment and the visible horizon.
Two pictures are presented, the second of which shows the result of some change of
position, which the participant is to describe by choosing among the five options
presented. A total of 60 problems are presented for which the participant is given 10
minutes to complete as many as possible. The test score is determined by subtracting
from the total number of correct answers the total number of wrong answers divided by 4.
Questionnaires
Participants completed three questionnaires, the first of which captured
demographic information. The Motion History Questionnaire was used (Kennedy, et al.,
2001), RSKA Form MHQ-1, Rev. 5/01. This questionnaire captured participants’ past
experience with motion sickness, asked them to compare themselves to others by
estimating the likelihood of them becoming motion sick in a situation where various
percentages of other people might get motion sick, and if they would volunteer for an
experiment where various percentages of other people did get motion sick. On a separate
page a matrix was presented that listed 14 situations in which one would experience
motion, from aircraft through motorcycles, and asked the participants their preference for
23

these situations (Like, Neutral or Dislike), and to mark any symptoms they had
experienced in any of these situations. This questionnaire was scored as described by
Kennedy, et al. (2001) with each scale that was anchored with a “never” condition scored
as 0 points at the lower end and “always” or “Extremely” scored as 4 points at the higher
end. Questions with “yes” or “no” answers were scored 1 or 0 respectively. The
questions captured frequency of airsickness, seasickness, motion sickness under other
conditions, susceptibility to motion sickness, willingness to volunteer for an experiment
likely to cause motion sickness, and frequency of experiencing dizziness on an annual
basis. The situations from question 15 that were used in the data analyses were scored as
1 if marked by the participants, and 0 if not marked, and limited to the following, as
described by Kennedy et al. (2001):
Table 1. Situational data taken from question 15 of Motion History Questionnaire Situation Like Neutral Dislike Vomited Nausea No Symptoms Aircraft 1/0 1/0 1/0 1/0 1/0 1/0 Flight Simulator 1/0 1/0 1/0 1/0 1/0 1/0 Roller Coaster 1/0 1/0 1/0 1/0 1/0 1/0 Other Carnival Device 1/0 1/0 1/0 1/0 1/0 1/0 Long train or bus trip N/A N/A N/A N/A N/A 1/0 TOTAL 0-4 0-4 0-4 0-4 0-4 0-5
The Simulator Sickness Questionnaire (SSQ) developed by Robert S. Kennedy of
RSK Assessments, Inc. was used as a screening tool to be certain that participants
weren’t experiencing any symptoms of illness that might cause them to experience
simulator sickness while in the MR environment, and as a monitoring tool throughout the
rehearsal and transfer of training testing. The SSQ is based on a checklist of 26
symptoms, which are scored on the basis of the participants' experience of the degree of
24

severity of each symptom (none, slight, moderate, severe). The highest possible score is
300, however a pre-exposure score greater than 9 is commonly used as a screening tool,
at which point the participant is not exposed to a simulator or other virtual environment.
The scoring procedure is used to obtain the global score intended to reflect the overall
discomfort known as the Total Severity (TS) score, in addition to three subscales the
provide levels of discomfort in what are intended to be diagnostic identifiers representing
separable dimensions of simulator sickness (i.e., nausea, oculomotor disturbances, and
disorientation) The questions from the symptom checklist that are the basis for the four
measures of simulator sickness were used as discussed in Kennedy et al. (1992). The
table below captures the 18 items used from the Pre and Post Exposure Symptom
Checklist, with possible responses and corresponding scores for each item ranging from
None = 0, to Slight = 1, Moderate = 2, and Severe = 3. These scores were then used to
calculate the general simulator sickness factor of Total Severity of sickness, and the three
symptom clusters of Nausea, Oculomotor and Disorientation. These values were
calculated using both the original unit weighting procedure as described by Kennedy et
al. (1992), and an un-weighted procedure as used by personnel at the Army Research
Institute, Orlando, FL (Knerr, et al. 1998). The Post Exposure Symptom Checklist also
asked participants if they had experienced a sense of motion while in the virtual
environment (Yes, No, Somewhat), and to rate their own performance in the virtual
environment from 1 (Poor) to 10 (Excellent). Participants were asked if they experienced
any unusual events during their exposure to the virtual environment and for a description
of that experience. These latter questions were evaluated separately from the symptom
data.
25

Table 2. Simulator Sickness Questionnaire Data used in analysis of symptoms SSQ #
Rehearsal 1
Rehearsal 2
Rehearsal 3
Post TestExposure = Baseline Familiarization
1 G. discomfort X X X X X X 2 Fatigue X X X X X X 5 Headache X X X X X X 6 Eyestrain X X X X X X 7 Diff. Focus X X X X X X 8 Salivation Increase X X X X X X 9 Cold Sweating X X X X X X
10 Nausea X X X X X X 11 Diff. concentrating X X X X X X 13 "Full head" X X X X X X 14 Blurred vision X X X X X X
15a Dizzy eyes open X X X X X X 15b Dizzy eyes closed X X X X X X 16 Vertigo X X X X X X 20 Stomach awareness X X X X X X 25 Burping X X X X X X 27 Other X X X X X X
SSQ Scoring TS 0 0 0 0 0 0 N 0 0 0 0 0 0 O 0 0 0 0 0 0 D 0 0 0 0 0 0 ARI Symptom Scoring TS 0 0 0 0 0 0 N 0 0 0 0 0 0 O 0 0 0 0 0 0 D 0 0 0 0 0 0
Experimental Design
Research Questions
The consideration of a MR environment as a training system generated a series of
research questions, some of which have to do with the effectiveness of such a training
tool, as measured through transfer of training testing, while others are concerned with the
26

experience of the individuals interacting with the MR, including the possible occurrence
of simulator sickness. These questions led to the formation of the following hypotheses:
1. Rehearsing a wayfinding task using MR will result in effective route and or
survey knowledge, based on performance scores that are comparable to those achieved
through rehearsal that is based on drawing a route on a floor plan (a paper map), or
rehearsal in the actual test environment.
2. The spatial abilities tests Cube Comparison, and Surface Development from
the Manual for Kit of Factor-Referenced Cognitive Tests, (Ekstrom, et al., 1976), and the
Guilford-Zimmerman Aptitude Survey test of spatial orientation (Guilford, 1948) will
correlate with participants’ performance on the three performance measurement tasks of
time to traverse the learned route, number of errors committed in the timed trial of route
traversal, and the ability be oriented enough to locate the position of the beginning and
ending of the route from two separate locations along the route.
3. Rehearsal of route traversal in the mixed reality environment will be successful
as a training tool as evidenced by the improved performance, measured by decreased total
time for each successive trial in the mixed reality environment.
4. Participation in route rehearsal in the MR environment will not cause greater
symptomology of simulator sickness than in the non-MR environments, based on the
proprioceptive feedback provided by physically walking through the virtual environment,
reducing the vestibular conflict brought on by sensing motion visually, while remaining
physically stationary.
27

Task and Procedure
The experimental task was to train participants through the use of three different
rehearsal conditions to traverse a specific path through a complex area as quickly and
accurately as possible, while also demonstrating an exocentric, or survey knowledge of
the surrounding environment. A direct comparison between the three rehearsal
conditions (drawing the studied route on a floor plan, walking through the physical route
as rehearsal and MR rehearsal) was undertaken by capturing participants’ route traversal
time, and by counting errors in route traversal, (i.e. wrong turns). In addition, error data
was collected concerning participants’ localization orientation; that is their ability to
identify the location of the start and end of the route in reference to their current position.
Participants in each condition were greeted and randomly assigned to one of the
three rehearsal conditions. After reading and completing an informed consent form, each
participant was asked to complete each of the following items in turn: Demographics
Questionnaire, Motion History Questionnaire, and Simulator Sickness Questionnaire with
Baseline Exposure Symptom Checklist. Each participant then completed three tests of
spatial abilities, as follows: Cube Comparison, Surface Development, and the Guilford-
Zimmerman Spatial Orientation subtest. Upon completion of all of the above each
participant was presented with a short description of the experiment that varied according
to which of the three rehearsal conditions they had been assigned. Once the participant
indicated that they understood the rest of the experiment and that they were willing to
proceed, they were presented with written directions that described the route they were to
learn. Each participant was allotted 15 minutes to study these directions, after which the
directions were removed. Participants were not permitted any aids for memorization and
28

were not to write out the directions or draw what they believed the route to be based on
their reading the directions.
Paper Map Condition: Participants in the paper map practice condition rehearsed
the route by drawing the route they had learned through memorizing the directions, on a
printed floor plan of the office space environment that showed walkways, landmarks and
waypoints. The participants were allotted three practice trails under the supervision of
the experimenter who identified errors as they were committed by saying, "Stop". Errors
were identified as soon as it was clear that the participant was committed to a particular
movement. For example if the participant were to turn right at an intersection instead of
left, the experimenter would wait until the participant had started to draw the line that
would connect them to what they thought the next landmark was before stopping the
participant. The participant would return their pencil to the last known correct point and
attempt a different strategy, without being told what the next move should be by the
experimenter. This procedure was repeated as necessary to move the participant through
the rehearsal phase, after which, the participant was moved to the actual office space on
the fourth floor of the Partnership II building, from the laboratory space on the third floor
of the same building, to perform a single timed and scored traversal of the actual physical
route.
Walking condition: Participants in the rehearsal condition known as “walkers,”
would execute three practice traversals of the route in the actual facility. During this
rehearsal phase any errors committed by the participant were identified to the participant
by the experimenter saying, “Stop,” after it was clear that the participant was committed
to a particular erroneous movement. For example if the participant were to turn right at
29

an intersection instead of left, the experimenter would wait until the participant had taken
two steps in the wrong direction before stopping them. At that point the participant was
moved back to their last correct position and instructed to proceed from there, repeating
this procedure as necessary to move the participant through the three practice traversals
of the route. After the third rehearsal of the route with corrections, the participant would
perform a single timed and scored traversal of the route.
MR condition: Participants in the MR condition also executed three practice
traversals of the identified route as it was presented in the third floor laboratory space.
The training area was an empty indoor space, approximately 15 feet by 15 feet, with
beige carpet, and surrounded by a white curtain, with InterSense IS-900 SoniStrips
installed overhead. Because the MR space was approximately 10 feet by 10 feet, it was
much smaller than what would have been required to encompass the entire route used in
this experiment. Two techniques were used to present the virtual version of the actual
environment in the smaller space. A scaling factor was introduced, such that each step in
the MR environment was equal to three steps in the actual environment. After the
application of the scaling factor, the actual space was divided into six chunks, or tiles,
that resembled the pages of an atlas. For example, as shown in Figure 6, the route
through the first tile might start at the top of the right quadrant and end in the bottom left
quadrant.
30

Start Start
Route Tile 1
Route Tile 2
Figure 7. Moving between two sections of the route
To move to the beginning of the next portion of the route, that shown by the blue
dotted line, the participant was assisted by a spotter who led them to the next starting
point, which was directly opposite from where they had left the first tile, and from where
they would reestablish themselves on the route. If the participant looked behind them an
any point in the route, they would see their own “footprints”, including at the beginning
of the next tile, which assisted in orienting participants as they progressed along the
route. This procedure was repeated until the participant had progressed through the six
tiles that made up the entire route.
The Sony Glasstron provided the participant a three dimensional recreation of the
office space showing cubicle walls, office furniture, landmarks, waypoints and virtual
footprints. Virtual footprints are a “you were there” display that leaves a visible trail of
31

footprints that the participant can see through the display showing their own movement to
assist in orientation. (Grammenos, Filou, Papadakos, and Stephanidis, 2002)
Participants’ location in the training area was tracked using IS-900 tracking
system, to provide data to the Thermite computer, which presented the appropriate
display to the participant while also providing data to the Dell computer which provided a
display for the experimenter to monitor the participants’ movement. The stealth view is
the floor plan shown on a 17-inch computer monitor with the tiles indicated with black
lines and the route shown with a white line. An avatar in the stealth view shows the
participant's location and the virtual footprints show where they have walked.
To familiarize participants with the MR environment, a familiarization session
was conducted prior to their memorization period so as to avoid any MR environment
specific learning impact on participants’ rehearsal time. Two tiles that had been modeled
but were beyond the periphery of the tiles through which the test route passed were used
in this familiarization session. Each participant donned and was fitted with the BARS
ensemble, then led to a starting point in the training area that did not correspond to the
starting point of the test route. While standing on the edge of the space that defined each
tile, the participant was oriented to the boundaries of the tiles by identifying the 4 corners
of the tile shown with blue tape on the beige colored carpet. They were instructed on the
specifics of the scaling factor, that each step they took in the rehearsal space was worth 3
steps in the actual space, and that the actual space would be represented by 6 tiles that
worked like pages in an atlas. It was pointed out that while it was possible to walk
through walls and furniture in this environment, there was no advantage to doing so.
Finally they were told that to successfully complete the route they were about to learn,
32

they would have to walk outside the bounds of the tile, past the blue lines, and within 3
seconds of doing so, the Glasstron display would turn black. They were to stop moving
until instructed as to where they should move to pick up the continuation of the route.
For this familiarization however, they were free to roam through the space to become
familiar with the look and feel of the environment. Once the participant walked outside
the boundary of the tile they were re-positioned at the opposite side of the tile to show
them how they would pick up where they had left the tile, which included asking the
participant to look behind them to see their own footprints as an orientation aid. When
they indicated that they understood the concept and felt familiar with it, a process
accomplished in a span of 15 minutes on average, the MR participant was removed from
the rehearsal area, completed a simulator sickness inventory, and doffed the BARS
ensemble, after which they were given 15 minutes to study the route as in the other 2
conditions.
At the end of the 15 minute study period the participant donned the BARS
ensemble and moved into the rehearsal space with the spotter. During this rehearsal
phase, participants’ errors were corrected after it was clear that they were committed to a
particular movement. For example if the participant were to turn right at an intersection
instead of left, the experimenter would wait until it was clear that the participant had
moved in the wrong direction before the experimenter would say "Stop". The participant
determined their next correct move by making as many trial moves as necessary until the
experimenter no longer said, "Stop". The virtual footprints could be used by the
participant to review where they had been, to assist in making their corrections. After
each rehearsal trial, the participant was asked to complete a simulator sickness inventory,
33

thand after the third rehearsal also doffed the BARS ensemble and moved to the actual 4
floor office space where they performed a single scored traversal of the route.
The effectiveness of the training was assessed using data gathered during the
traversal of the actual route without using the paper map, correction from the
experimenter or the BARS ensemble. Participants were instructed that speed and
accuracy in traversal of the path were of equal importance. At two points along the route,
from which participants could not see either the beginning or end of the route, the
participants were stopped in front of a clipboard hanging from a cubicle wall, on which
was posted an 81/2 x 11 piece of paper showing a circle with an X in the center, and the
numbers 12, 3, 6, and 9 around the edge for orientation points (See Appendix B). They
were asked to imagine themselves standing on the X facing the 12, and to mark where
they believed the starting point of the route was in relation to where they were standing,
by writing an S on the circle, and to mark where they believed the end of the route was by
writing an E on the circle.
34

CHAPTER FOUR: DATA ANALYSIS
This chapter describes the data analysis for the study. The first section outlines the
experimental variables, self-report measures, and demographics collected in the study. In
the second section, the preliminary data for the three experimental conditions on the
performance measures are examined.
Description of Variables and Measures
Each of the 60 participants was assigned a participant number for use in tracking
data while maintaining participants' anonymity. Demographic information that was
gathered for use in data analysis included gender, age, own belief of spatial orientation
and time spent using computers and maps. A sample of this questionnaire can be found
in Appendix E.
In addition to the demographic data listed above, participants’ pre-experiment
scores were gathered from three spatial abilities tests: the Cube Comparison and Surface
Development tests from the Manual for Kit of Factor-Referenced Cognitive Tests, 1976,
and the spatial orientation subtest of the Guilford-Zimmerman Aptitude Test. Scores on
these tests are positively related to spatial abilities, that is, the higher the score earned, the
better the participants’ ability in the spatial skill measured by each test.
Two other pre-experiment questionnaires were used to evaluate participants’
possible susceptibility to sickness in virtual environments, as well as to monitor
symptoms that might appear during MR exposure. The Motion History Questionnaire
was used (Kennedy, et al., 2001), RSKA Form MHQ-1, Rev. 5/01. This questionnaire
35

captured participants’ past experience with motion sickness, asked them to compare
themselves to others by estimating the likelihood of becoming motion sick in a situation
where various percentages of other people might get motion sick, and if they would
volunteer for an experiment where various percentages of other people did get motion
sick. On a separate page a matrix was presented that listed 14 situations in which one
would experience motion, from aircraft through motorcycles, and asked the participants
their preference for these situations (Like, Neutral or Dislike), and to mark any symptoms
they had experienced in any of these situations. This questionnaire was scored as
described by Kennedy, et al. (2001) with each scale that was anchored with a “never”
condition scored as 0 points at the lower end and “always” or “Extremely” scored as 4
points at the higher end. Questions with “yes” or “no” answers were scored 1 or 0
respectively. The questions captured frequency of airsickness, seasickness, motion
sickness under other conditions, susceptibility to motion sickness, willingness to
volunteer for an experiment likely to cause motion sickness, and frequency of
experiencing dizziness on an annual basis. The situations from question 15 that were
used in the data analyses were scored as 1 if marked by the participants and 0 if not
marked, and limited to aircraft, flight simulator, roller coaster, other carnival device, and
long train or bus trip, as described by Kennedy et al. (2001) and illustrated in Table 1.
The Simulator Sickness Questionnaire (SSQ) developed by Robert S. Kennedy of
RSK Assessments, Inc. was used as a screening tool to be certain that participants
weren’t experiencing any symptoms of illness that might cause them to experience
simulator sickness while in the MR environment, and as a monitoring tool throughout the
rehearsal and transfer of training testing. The questions from the symptom checklist that
36

are the basis for the four measures of simulator sickness were used as discussed in
Kennedy et al. (1992), and listed in Table 2, capturing 18 items from the Pre and Post
Exposure Symptom Checklist, with possible responses and corresponding scores for each
item ranging from None = 0, to Slight = 1, Moderate = 2, and Severe = 3. These scores
were then used to calculate the general simulator sickness factor of Total Severity of
sickness, and the three symptom clusters of Nausea, Oculomotor and Disorientation.
These values were calculated using both the original unit weighting procedure as
described by Kennedy et al. (1992), and an un-weighted procedure as used by personnel
at the Army Research Institute, Orlando, FL (Knerr, et al., 1998). While the SSQ is a
valuable tool, it was based on data gathered from Navy pilots, which according to Knerr
et al. caused data gathered from college students to show standard deviations of 34.4,
25.6 and 21.1 instead of the consistent standard deviation of 15 for each of the three
subscales of disorientation, nausea, and Oculomotor effects found in Kennedy et al.’s
data (1998). By not applying the weights Knerr et al. found that not only did their
standard deviations not change the relative order of the means as the weightings had
done, but it also allows for rapid interpretation where a score of 3 is one severe symptom
(or 3 mild ones) and a score of 1 is one mild symptom.
Participants’ responses to the Simulator Sickness Questionnaire Exposure
Checklist were captured at various times throughout the course of the experiment,
dependent upon the assigned experimental condition. Those participants who drew the
route on a floor plan as rehearsal, and those who walked through the actual office space,
each completed the checklist at the end of their rehearsal period, before performing the
transfer of training tests of route traversal and orientation localization. MR condition
37

participants completed the checklist after the familiarization exposure to the MR
environment, after each of the three rehearsal trials in the environment, and after
performing the transfer of training tests, which was typically 10 minutes after their
exposure to the MR environment.
Four performance variable data sets were gathered, with the first two variable sets
used to measure route knowledge which included total time to traverse the route, and
number of traversal errors (wrong turns). The second two variable sets, used to measure
survey knowledge, included data from the participants’ input on each of the orientation
localization tasks located at two reporting stations along the route. This survey
knowledge was based on the absolute error between the actual location of the start and
end points of the route from each of the two reporting stations, and the participants’ input
as to where they believed the start and end points of the route to be located. The location
of the two orientation localization stations and the start and end points of the route are
illustrated in Appendix A.
Prior to analysis, descriptive statistics were examined for each experimental
variable, and all variables were screened for normality, outliers and missing values, and
appropriate transformations applied. Each of the performance variables, that is Number
of traversal errors, Total time to complete route, and the variables that captured the delta
value in degrees of error from each orientation localization station (Error to Start Station
1, Error to End Station 1, Error to Start Station 2 and Error to End Station 2) were
transformed by using the mean to replace any missing data, along with the top five
univariate outliers as identified by SPSS Explore. Throughout the following statistical
analyses SPSS version 11.5 was used, with alpha set to .05 unless otherwise specified.
38

Throughout the following statistical analyses SPSS version 11.5 was used, with alpha set
to .05 unless otherwise specified.
Effectiveness of MR on Performance Measures (Route and Survey Knowledge)
Route knowledge: A between subjects analysis of variance was conducted, in
which the independent variable was rehearsal condition (paper map, walker, mixed
reality). All variables were screened for normality, outliers and missing values, and
appropriate transformations applied as described previously to ensure the data met the
analysis requirements. As can be seen in Table 3, the analysis of variance was significant
for Total Number of Errors in Route Traversal, with F (2, 57) = 6.24, p < .001, with a
partial η2 of 0.18. Participants in the walker condition averaged 0.85 errors, the MR
participants 3.47 errors, and the paper map participants committed an average of 4.39
errors. Post hoc tests using a Scheffe adjustment for multiple comparisons, shows that
participants in the walker condition, that is those that rehearsed the route in the actual
office space, consistently performed better than those in either the paper or mixed reality
conditions.
Table 3. Analysis of Variance for Traversal Errors
Source df 2 p F ηTotal Traversal Errors 2 6.24** .18 .000 Error 57
**p < .01
Post hoc tests using a Scheffe adjustment for multiple comparisons, shows that
participants in the walker condition, that is those that rehearsed the route in the actual
office space, consistently performed better than those in either the paper or mixed reality
conditions.
39

Table 4. Post Hoc with Scheffe adjustment for Traversal Errors
Condition Condition Mean Difference p Paper Map Walker 3.545** .005 Mixed Reality .927 .675 Walker Paper Map -3.545** .005 Mixed Reality -2.6186* .050 Mixed Reality Paper Map -.9271 .675 Walker 2.618* .05
**mean differences significant at the .01 level *mean differences significant at the .05 level
A between subjects ANOVA was conducted using the IV condition and the DV
Total Time to Complete the Route. The Total Time was significant at F (2, 57) = 9.42, p
< .000, and a partial η2 of .25. Participants in the walker condition averaged 1.99 minutes
to complete the route, MR participants averaged 3.25 minutes, and paper map
participants 3.77 minutes.
Table 5. Analysis of Variance for Time to Complete Route Source df 2F p ηTotal Time to Complete 2 9.416** .18 .000 Error 57
**p < .01
Post hoc tests using a Scheffe adjustment for multiple comparisons, shows that
participants in the walker condition, that is those that rehearsed the route in the actual
office space, consistently performed better than those in either the paper or mixed reality
conditions.
Table 6. Post Hoc with Scheffe adjustment for Time to Complete Condition Condition Mean Difference p
Paper Map Walker 1.786** .000 Mixed Reality .523 .222 Walker Paper Map -1.786** .000 Mixed Reality -1.264** .004 Mixed Reality Paper Map -.9271 .675 Walker 1.264** .004
**mean differences significant at the .01 level
40

Survey knowledge: A between subjects analysis of variance was conducted using
rehearsal condition as the independent variable rehearsal condition (paper map, walker,
mixed reality). All variables were screened for normality, outliers and missing values,
and appropriate transformations applied as described previously to ensure the data meets
the analysis requirements. As can be seen in Table 7, the analysis of variance was not
significant for the any of these measures.
Table 7. Analysis of Variance for Survey Knowledge Source df F p Error to Start Station 1 2 2.366 .103 Error 57 Error to End Station 1 2 1.390 .257 Error 57 Error to Start Station 2 2 1.407 .253 Error 57 Error to End Station 2 2 .032 .969 Error 57
Comparison of Spatial Abilities Tests to Performance Measures on Survey and Route Knowledge
While data was gathered for each participant’s performance on three tests of
spatial abilities, and on both route and survey knowledge, as measured during transfer of
training testing for what were considered to be spatial tasks, there was no indication that
performance on one might be related to the other. To examine the relationship between
tests of spatial abilities and route knowledge test performance measures, a correlation
analysis was conducted using SPSS. Specifically the variables were: Cube Comparison
Test, Surface Folding Test, Guilford-Zimmerman Spatial Orientation Test, Total Time to
Complete Route, and the Number of Traversal Errors with adjustment for outliers as
described above. Table 8 shows the descriptive statistics that describe the performance of
41

participants on the spatial abilities tests, while Table 9 displays the correlations among
the variables.
Table 8. Descriptive Statistics of Spatial Abilities Tests Cube Comparison Surface Development Guilford-Zimmerman Mean 17.78 36.15 11.81Standard Error M 1.45 1.89 1.19Median 18.50 35.50 11.25Standard Deviation 11.23 14.65 9.21Minimum -1.00 9.00 -5.50Maximum 43.00 64.00 39.75
The specific hypothesis that the three tests of spatial abilities would be related is
only supported for the relationship between Surface Development and Cube Comparison,
with a correlation of 0.381 significant at the 0.01 level, and between Surface
Development and the Guilford-Zimmerman task where the correlation was 0.451, which
was also significant at the 0.01 level. A relationship between the Cube Comparison and
the Guilford-Zimmerman tests was not established in this study.
Route knowledge: Neither of the performance variables correlated with the tests
of spatial abilities, however, the Total Number of Errors made during route traversal was
positively correlated with the time to complete the route, with 0.639, significant at the
0.01 level. Logically, this indicates that as the number of errors increased, so did the
amount of time required to complete the route.
Table 9. Correlation of Spatial Abilities Tests and Route Knowledge Variables Cube Surface G-Z Time Errors Cube Comparison 1.00 Surface Development 0.381** 1.00 Guilford-Zimmerman 0.214 0.451** 1.00 Total Time to Complete -0.105 -0.031 -0.174 1.00 Traversal Error 0.044 -0.201 -0.146 0.639** 1.00 **Correlation is significant at the 0.01 level (2 tailed)
42

Survey knowledge: To examine the relationship between the tests of spatial
abilities and survey knowledge performance measures, a separate correlation analysis
was conducted using SPSS. Specifically the variables were: Cube Comparison Test,
Surface Folding Test, Guilford-Zimmerman Spatial Orientation Test, Error Start 1, Error
End 1, Error Start 2 with outliers and missing data transformed as described above.
Table 10 displays the correlations between the variables, where the correlations among
the three spatial abilities tests are again apparent. Correlational relationships are apparent
among the measures of survey knowledge and the three spatial abilities tests. The Cube
Comparison test is negatively correlated with the Error to End from Station 2, with a
correlation of -.259, while the Guilford-Zimmerman Test is negatively correlated with the
Error to Start from Station 2, with a correlation of -.260, both significant at the 0.05
level. The Surface Development Test is negatively correlated with Error to Start from
Station 1, at -.275, and Error to End from Station 1, with -.294 at the 0.05 level, and Error
to Start from Station 2, with -.364 at the 0.01 level. The Error to the End of the Route
from Station 1 is positively related to the Error value for identifying the location of the
End of the Route from Station 2, with a correlation of .255, which is significant at the
0.05 level.
It would appear that as scores on the Surface Development test increase, so do the
scores on the Cube Comparison, and Guilford-Zimmerman tests, so that higher scores on
Surface Development, which indicates greater ability in this type of spatial task is related
to greater ability in comparison of cubes and in spatial orientation as measured by the
Guilford-Zimmerman test. As these scores on standardized tests of Spatial Abilities
increase, however, participants' localization scores decrease significantly. This would be
43

interpreted as the ability in spatial tasks improves, so does the ability to localize the
beginning and end of the route, since these values are difference error values, between the
actual location of the point of interest and the location the participant expected the point
to be, thus the lower score is more desirable. As the amount of Error to the End of the
Route from Station 1 increases, so does the amount of Error to the End of the Route from
station 2 increase, showing some consistency in the participants' perceptions of the route
and the layout of the environment through which it passed.
An additional analysis of the relationship between the three tests of spatial
abilities and the performance scores for this experiment was conducted. This analysis
was suggested by the work of Diaz and Sims (2003), in which participant’s scores on the
Guilford Zimmerman were used to split the group in two: high spatial ability and low
spatial ability based on the median value obtained from their sample. Analysis of
variance was conducted for each of the performance scores using the dichotomized
spatial abilities technique for all three tests; however, none of the results were significant
or assisted in further explanation of the relationship between performance on
standardized tests, and performance on experimental task.
Table 10. Correlation between Spatial Abilities and Survey Knowledge Performance Variables Cube Surface G-Z Start 1 End 1 Start 2 End 2Cube Comparison 1.00 Surface Development .381** 1.00 Guilford-Zimmerman .214 .451** 1.00 Error Start Station 1 -.054 -.275* -.208 1.00 Error End Station 1 -.194 -.294* -.181 .437** 1.00 Error Start Station 2 -.248 -.364** -.260* .077 .195 1.00 Error End Station 2 -.259* -.165 -.081 -.061 .255* .122 1.00
* correlation is significant at the 0.05 level (2 tailed) **correlation is significant at the 0.01 level (2 tailed)
44
Learning in Mixed Reality
As has been described previously, the model of the office space was broken into
tiles, and the tiles were explained to participants as being similar to the pages of an atlas,
so that when they ended a route segment at the edge of one tile they would start the route
again from that same point at the edge of the next tile. While the participants were never
shown a drawing of the environment or the tiles, the experimenter, to monitor the
participants' current position and progress through the environment, used the diagram of
the environment presented on the second computer. With a sampling rate of
approximately once per each second, data was captured that was saved to a file with a
time stamp, an X coordinate, which was the participant’s head pitch, a Y coordinate,
which was the head roll, and a Z coordinate, that was the head yaw, and the tile
coordinate number. That position data was also used to generate an avatar, which
showed the experimenter where the participant was in the environment. The graphic
below shows the environment with black lines that indicate the boundaries of the tiles, a
white line that describes the route, and the coordinate names for each of the tiles.
45

Figure 8. Model Diagram Showing Tiles, Tile Coordinates and Route
To show that learning occurred over the three rehearsal trials, an analysis of
variance was performed using SPSS, with an alpha level of .05, unless otherwise stated.
Because of an unequal number of participants in gender, which occurred when the data
for the first male subject was inadvertently over-written on the Thermite computer, the
data for the first female participant was removed from further analysis, chosen on the
basis of matching the first male participant. The grouping variable was rehearsal trial (1,
2 and 3) and all variables were screened for normality, outliers and missing values.
There were 18 subjects 50% of which were female, each of which performed three
rehearsal trials. As can be seen in Table11 the analysis of variance was significant for
rehearsal trial number and the total time spent on each trial for each tile, except Tile 1,1:
46

Tile 0,1 with an overall mean of 65.29 is significant at F (2, 51) = 9.161, p< .01. Tile 0,0
with an overall mean of 94.18 is significant at F (2, 51) = 23.64, p< .01, while Tile 1,0,
with an overall mean of 30.90 is significant at F (2, 51) = 3.58, p< .05. Tile 1,1 does not
show significance over the three rehearsal trials, however, that may be because the
traversal requirement for that tile included continuing on the straight path the participant
had been following and making a single right turn, as can be seen in Figure 10. Tile 2,1
with an overall mean of 106.76 is significant at F (2, 51) = 5.97, p< .01, and Tile 2,0
shows an overall mean of 47.11, with significance at F (2, 51) = 7.19, p< .01.
Table 11. ANOVA for Time spent in each Tile over 3 Trials F p Source df
Tile 0,1 2 9.161** .000 Error 51 Tile 0,0 2 23.64** .000 Error 51 Tile 1,0 2 3.58* .035 Error 51 Tile 1,1 2 .893 .416 Error 51 Tile 2,1 2 5.970** .005 Error 51 Tile 2,0 2 7.187** .000 Error 51
* p<.05 ** p<.01
Post hoc comparisons, with a Scheffe adjustment compared the three trials to find
if there was a significant difference between the first, second and third trials in each tile.
In tile 0,1 there was a significant decrease in the time required to traverse the tile, with
Trial 1 showing a mean of 101.14 seconds, Trial 2 a mean of 58.03 seconds and Trial 3
36.71 seconds on average. Tile 0,0 also showed a significant decrease over all three trials
with Trial 1 showing a mean of 170.37 seconds, Trial 2 65.34 seconds, and Trial 3 at
46.84 seconds. In Tile 1,0 there was a significant decrease between Trial 1 with a mean
47

of 37.00 seconds and Trial 3 with a mean of 26.57 seconds, but there was no significant
difference between either Trial 1 or Trial 3 with Trial 2 showing an average of 29.12
seconds to traverse the tile. There were no significant differences among the three trials
in Tile 1,1. In both Tile 2,1 and 2,0, there was a significant difference between the first
and third trials but not the first and second or second and third. Tile 2,1 has a mean
traversal time for Trial 1 of 158.44 seconds and for Trial 3 of 66.91 seconds. Tile 2,0 has
a mean time of 61,19 for Trail 1 and 34.43 for Trial 3.
Table 12. Means of Three Rehearsal Trial Times by Tile Trial # Tile 0,1 Tile 0,0 Tile 1, 0 Tile 1, 1 Tile 2, 1 Tile 2, 0 1.00 Mean 101.1367 170.3706 37.0022 39.9667 158.4422 61.1922 Std. Deviation 68.48461 94.09564 17.39638 20.19743 117.05832 32.082402.00 Mean 58.0300 65.3400 29.1222 36.8728 94.9239 45.7161 Std. Deviation 37.96886 32.19971 10.81415 22.37378 66.01114 13.808513.00 Mean 36.7111 46.8439 26.5756 31.3233 66.9100 34.4339 Std. Deviation 14.75236 15.77776 5.10074 15.85823 42.84484 11.66436Total Mean 65.2926 94.1848 30.9000 36.0543 106.7587 47.1141 Std. Deviation 52.61464 79.16664 12.76709 19.62408 88.74530 23.61206
MR and Simulator Sickness
To assess the possibilities of simulator sickness occurring in this MR environment
an analysis was conducted of participants' past experience with motion and motion
sickness, as well as their perception of the likelihood of experiencing motion sickness,
and the occurrence of simulator sickness symptoms during or after exposure to the MR.
A multivariate analysis of variance was conducted using SPSS and there were no
multivariate or univariate within cell outliers at p < .01. Results of evaluation of
assumptions of normality, homogeneity of variance-covariance matrices, linearity, and
multicollinearity were satisfactory, with rehearsal condition, (paper map, walker, MR) as
48

the independent variable, and the questions of interest from the Motion History
Questionnaire as the dependent variables. Specifically, questions examined included
frequency of airsickness, seasickness, experience of motion sickness under any other
conditions, susceptibility to motion sickness (self rating), willingness to volunteer for a
study in which 85% of participants became motion sick, comparison of self to stated
frequency of dizziness in the general population, the total number of motion situations the
participant liked, felt neutral toward, and disliked, along with the total number of
situations in which participants vomited, experienced nausea, or experienced no
symptoms of motion sickness.
With the use of Wilks' criterion, the combined DVs were not significantly
effected by membership in rehearsal condition, with F (20, 86) = .641, p> .05, and a
partial η2 of .13. This lack of significance was taken as an indication that there was no
difference among the participants of the three rehearsal conditions with respect to the
prediction or expectation of motion sickness, and therefore simulator sickness while in
the MR rehearsal condition.
Participants' perceptions of their own susceptibility to motion sickness was then
compared to weighted and un-weighted simulator sickness scores calculated from
participants' responses to the simulator sickness inventories completed throughout their
experimental trial. A multivariate analysis of variance was conducted using SPSS
version 11.5, with an alpha level of .05 unless otherwise stated. There were no
multivariate or univariate within cell outliers at p<.01. Results of evaluation of
assumptions of normality, homogeneity of variance-covariance matrices, linearity, and
multicollinearity were satisfactory.
49

With the use of Wilks’ criterion, the combined DVs were not significantly
effected by participants' beliefs concerning their susceptibility of motion sickness, with F
(16, 100) = .559, p> .05, and a partial η2 of .08. This lack of significance was taken as an
indication that there was no connection between participants' expectations about motion
sickness and actual ratings of simulator sickness throughout the three conditions of the
experiment.
The tendency for participants to experience symptoms of simulator sickness with
exposure to the MR was examined through analysis of variance using SPSS version 11.5,
and an alpha level of .05. All participants had completed pre and post test SSQ
inventories, however, this procedure resulted in a maximum of two reports from the
walkers and the paper map rehearsal participants, and a maximum of six from the MR
participants. Therefore, for this analysis to examine simulator sickness while comparing
MR to the non-MR conditions, only the single post test inventory from the walkers and
paper map participants were used, while the post third rehearsal inventories from the MR
participants were used. Given the cumulative properties of simulator sickness, this was
considered to be the worse case for the MR participants. There were no outliers, and the
results of the evaluation of assumptions of normality were satisfactory.
Table 13. ANOVA Post Test SSQ (W) Inventory Source df F p SSQ TS W 2 .136 .873 Error 57 SSQ N W 2 .019 .982 Error 57 SSQ O W 2 .626 .538 Error 57 SSQ D W 2 1.702 .191 Error 57
50

Table 14. ANOVA Post Test SSQ (R) Inventory Source df F p SSQ TS R 2 .128 .880 Error 57 SSQ N R 2 .019 .982 Error 57 SSQ O R 2 .626 .538 Error 57 SSQ D R 2 1.702 .191 Error 57
With the use of weighted Simulator Sickness Questionnaire values, there was no
difference among the three rehearsal conditions. Total Severity of sickness was not
significant with F (2, 57) = .136, p> .05, nor was Nausea with F (2, 57) = .019, p> .05,
or Oculomotor with F (2, 57) = .626, p> .05, or Disorientation with F (2, 57) = 1.702, p>
.05.
A separate analysis was conducted using the un-weighted SSQ values, and there
were no differences among the three rehearsal conditions in symptomology. Total
Severity of sickness was not significant with F (2, 57) = .128, p> .05, nor was Nausea
with F (2, 57) = .019, p> .05, or Oculomotor with F (2, 57) =.626, p> .05, or
Disorientation with F (2, 57) = .191, p> .05. The results of these analyses would indicate
that rehearsal conducted in this type of MR does not produce significant symptoms of
simulator sickness.
51

CHAPTER FIVE: CONCLUSION
From inception, the basis for this research was exploratory in nature, to determine
if training in a mixed environment, as provided by the Battlefield Augmented Reality
System (BARS), was effective. If it is effective, there are multiple training situations
with needs that are either partially, or not at all, met by current technologies, for which
BARS may be an answer. An effective mission rehearsal tool for dismounted infantry to
use as they learn their way through an unknown environment has the potential to enhance
Soldiers’ capabilities and improve survivability rates. Given current technology in
information acquisition in the form of cartography, and imagery from multiple sources,
there are multiple methods for gathering the data to input to this potential mission
rehearsal tool, as well as the software and hardware to construct it. This experiment has
addressed the following hypotheses:
1. Rehearsing a wayfinding task using MR will result in effective route and or
survey knowledge, based on performance scores that are comparable to those achieved
through rehearsal that is based on drawing a route on a floor plan (a paper map), or
rehearsal in the actual test environment.
Rehearsal of the wayfinding task in this experiment was most effective in
decreasing the time and errors of the participants who walked through the actual office
space. This result should not be surprising, but should also be observed to not be an
acceptable form of mission rehearsal, given a remote and or hostile environment, where
the area may be under threat. Participants who rehearsed the route by drawing it on a
floor plan performed at a level that was indistinguishable from those who rehearsed in the
mixed reality environment. While it was expected that the kinematic learning inherent to
52

walking through the route, whether it was in the actual space or the MR, this experiment
was not designed to determine if maps could be done away with, only to see if another
type of rehearsal might be as good as or better than drawing on maps. The experimental
conditions that were not addressed include map study, and the combined effect of paper
map rehearsal, and or map study, with mixed reality, is likely to be the more realistic case
for mission rehearsal. Soldiers will likely have maps available, but to have walked
through the environment beforehand can only enhance the Soldiers’ understanding of
their surroundings. The repeated comments gathered from participants in the mixed
reality condition such as “This looks like I was just here” and “There’s that pole I kept
having trouble with”, lead one to believe that this is a tool to continue to explore and
apply.
The minimal difference among the survey knowledge measurements shows that
mixed reality was as good as walking through the actual facility or drawing the route on a
map. The mean difference between mixed reality and walking in locating the end of the
route from the orientation localization station number one was about 29 degrees. This
type of knowledge might have been enhanced in either of these conditions if participants
had been given the opportunity to divert from the learned route to develop a better
cognitive map of their surroundings, creating short cuts that might later turn to escape
routes. With the addition of a map of the environment Soldiers would likely learn the ins
and outs of an environment thoroughly before arriving at the actual location.
A point to keep in mind in this discussion of performance based on rehearsal in
the mixed reality environment, is that this environment was not only a virtual
environment, it was one that scaled down the size of the environment such that each step
53

a participant took in the MR was equal to 3 steps in the real space, and the MR condition
required participants to learn the route in chunks as they moved through the 6 tiles, with a
minimum of 7 tile changes (2 tiles were used twice). During the design stages of this
project, there were two concerns that prompted the use of the spotter within the MR
space. One was the chance that a participant might become disoriented, and or have
difficulty with balance, as they walked through the MR environment. The other concern
was that participants would have difficulty with the tiling concept, and need active
assistance in moving from one tile to the next. In both cases, however, the concern was
not supported by these participants. After having experienced the familiarization trail,
participants appeared quite comfortable in the environment, walking through the space
without self-protective actions, such as searching the area with their hands as they
walked. In addition, participants overall were quick to pick up on the tiling procedure,
automatically moving to the start of the next tile without specific instruction within the
first two to three tile changes.
While additional research on the scaling and tiling factors is likely warranted, to
determine that the effect may be carried over to other environments or tasks, it may also
be related to how people interact with maps, where a scaling factor of 1 to 15,000 is
common in orienteering maps, and 1 to 25,000 in military maps.
2. The spatial abilities tests Cube Comparison, and Surface Development from
the Manual for Kit of Factor-Referenced Cognitive Tests, (Ekstrom, et al., 1976), and the
Guilford-Zimmerman Aptitude Survey test of spatial orientation (Guilford, 1948) will
correlate with participants’ performance on the three performance measurement tasks of
time to traverse the learned route, number of errors committed in the timed trial of route
54

traversal, and the ability to be oriented enough to locate the position of the beginning and
ending of the route from two separate locations..
This hypothesis was partially supported by the data. In correlation analyses the
Surface Development test was found to correlate with the Cube Comparisons test and the
Guilford-Zimmerman spatial orientation test, but there was no relationship between the
Guilford-Zimmerman and the Cube Comparison test, or between any of these three tests
of spatial abilities, and the participants’ performance on total time to complete the route,
or the number of errors made while traversing the route. There was a positive
relationship between the time required to complete the route and the number of errors
made. The correlation of localization performance scores with the spatial abilities tests
were negative, showing that the higher one scored on the standardized tests, the lower
their error scores, that is the better they were at locating the beginning and end of the
route at locations from which they could not see either the beginning or the end. There
was a positive correlation between the ability to locate the end of the route at the first
station from the second station, showing consistency in performance.
3. Rehearsal of route traversal in the mixed reality environment will be successful
as a training tool as evidenced by improved performance, measured by decreased total
time for each successive trial in the mixed reality environment.
This hypothesis was generally supported by the data, with the time to complete
each MR rehearsal decreasing significantly over time. In addition 5 of 6 tiles showed a
significant decrease in the amount of time required to traverse that tile between the first
and third trials. Time spent in learning the route in this condition varied widely from a
maximum first trail of 25 minutes to a minimum first trial of 3.2 minutes, and a
55

maximum third trial of 8.5 minutes to 2.2 minutes. Some of this variability might be
explained by the improvement in efficiency on the part of the experimenter and the
spotter in moving participants through the condition, while some of it could be blamed on
an issue referred to as “avatar excursions”.
There were two sets of SoniStrips installed end to end above the MR
environment, and passing through the locations directly below the gap between the two
sets often caused an anomaly in the environment such that the participant was suddenly
faced with a tumbling effect in the visual display of the MR, while on the base computer
the experimenter could watch the avatar that was supposed to be indicating the location
of the participant in the MR environment, instead fly rapidly away from that location in
any possible direction. These events occurred without warning or identifiable pattern.
By the end of the program, however, the experimenter became adept at “catching” the
avatar as it started to “fly” by clicking on it using the mouse, which would stop both the
avatar’s flight, and the tumbling of the environment in the participants’ display.
Evidence for this possibility is that early participants in the program show longer
rehearsal times and increased numbers of avatar excursions, than those who were
involved later in the program.
One recommendation for future research would be to attempt to utilize a different
tracking system. One of the goals of the BARS program is that it be a wireless system,
whether it receives input from GPS when outdoors or from a tracking system indoors,
which in this case was the InterSense IS-900. Another indoor system that might be more
stable with regard to avatar excursions might be a wireless Flock of Birds System.
56
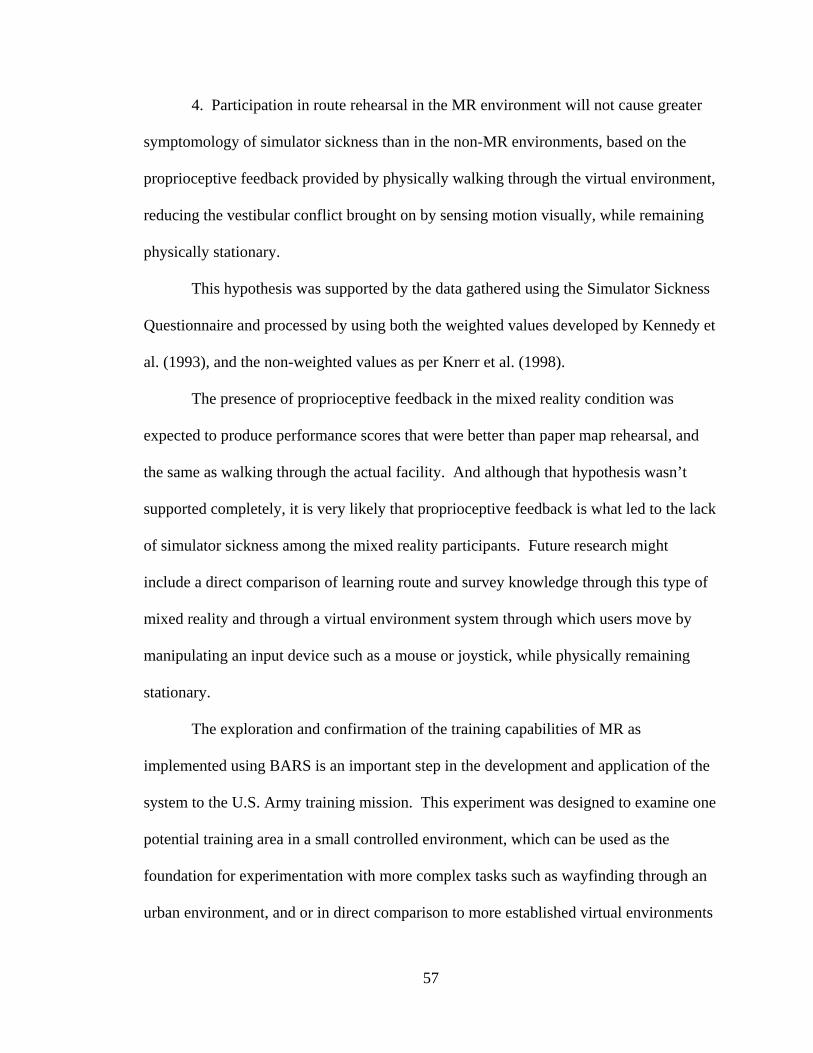
4. Participation in route rehearsal in the MR environment will not cause greater
symptomology of simulator sickness than in the non-MR environments, based on the
proprioceptive feedback provided by physically walking through the virtual environment,
reducing the vestibular conflict brought on by sensing motion visually, while remaining
physically stationary.
This hypothesis was supported by the data gathered using the Simulator Sickness
Questionnaire and processed by using both the weighted values developed by Kennedy et
al. (1993), and the non-weighted values as per Knerr et al. (1998).
The presence of proprioceptive feedback in the mixed reality condition was
expected to produce performance scores that were better than paper map rehearsal, and
the same as walking through the actual facility. And although that hypothesis wasn’t
supported completely, it is very likely that proprioceptive feedback is what led to the lack
of simulator sickness among the mixed reality participants. Future research might
include a direct comparison of learning route and survey knowledge through this type of
mixed reality and through a virtual environment system through which users move by
manipulating an input device such as a mouse or joystick, while physically remaining
stationary.
The exploration and confirmation of the training capabilities of MR as
implemented using BARS is an important step in the development and application of the
system to the U.S. Army training mission. This experiment was designed to examine one
potential training area in a small controlled environment, which can be used as the
foundation for experimentation with more complex tasks such as wayfinding through an
urban environment, and or in direct comparison to more established virtual environments
57

to determine strengths and areas for improvement as BARS is considered as an addition
to the training mission.
As the power of electronics increases with reductions in cost over time, the utility
and affordability of augmented, virtual and mixed reality environments will also increase.
The possibility of having small, easy-to-configure mobile units would expand the ability
of the Army to enhance its training efforts in the future. To continue this line of research
has the potential to expand training opportunities into scenarios not previously thought
possible, improve Soldier performance and ultimately their safety and survivability.
58

APPENDIX A FLOOR PLAN: ROUTE, LANDMARKS AND LOCALIZATION
59

299º 145º 329º 209º
Figure 9. Diagram of environment showing all information.
60

APPENDIX B
ORIENTATION LOCALIZATION
61

12
6
39
1. Stand facing the wall where the clipboard is hanging.
2. Imagine yourself standing at the X facing the 12.
3. Use the pen to place an S on the circle where the start of the route is located in reference to the X.
4. Use the pen to place an E on the circle where the end of the
route is located in reference to the X.
X
Orientation Localization
Location 1
Figure 10. Orientation Localization Page
62

APPENDIX C FLOOR PLAN USED FOR PAPER MAP REHEARSAL
63

Figure 11. Floor Plan Used for Paper Map Rehearsal
64

APPENDIX D EXPERIMETER SCRIPTS AND PROCEDURES
65

Experimental Procedures
(Read this to each MR condition participant)
The Experimenter: “Thank you for participating in this experiment. This experiment is
part of an Augmented Reality research project sponsored by the Army Research Institute.
In general, augmented reality systems add information to the real world using a
computer. You will be wearing a vest with a mobile augmented reality system that
weighs about 5 pounds. There is a display that is attached to an adjustable headband.
The display is designed to adjust to fit over most eyeglasses. The display’s position is
adjustable and we will help you in adjusting it to a comfortable position. The entire test
should take less than three hours.
Your task involves learning to navigate a specific route through an office area.
Before putting on the equipment, learning the route and performing the task, you will be
asked to fill out an informed consent form, a demographics sheet and take two surveys
concerning the way you experience motion. You will then be asked to complete three
tests that are used to evaluate your spatial abilities. Do your best on the tests, go in
sequence through the questions, and do not go back and redo questions unless you have
finished before time is called.
Throughout the training portion of the experiment using the augmented reality
equipment, you will be asked to fill out one page surveys concerning your experience in
using the system.
If at any time you feel uncomfortable with the situation and want to stop the
experiment, please verbalize your intent and we will stop the experiment. Otherwise, we
will not respond to questions or comments during your completion of surveys, training in
the MR environment, testing the actual office space, or any other tasks.
Do you have any questions so far?”
ACTION: Give the participant the Informed Consent Form and the demographics sheet.
Experimenter: “Please fill out the Informed Consent Form and the demographics
sheet”.
66

ACTION: After the participant is done with filling out the consent form and the
demographics sheet, administer Motion History Questionnaire.
Experimenter: “Please complete the Motion History Questionnaire.”
ACTION: After the participant is done with the motion history questionnaire, administer
the Simulator Sickness Questionnaire.
Experimenter: “Please complete the Simulator Sickness Questionnaire.”
ACTION: After the participant is done with the Simulator Sickness Questionnaire,
administer the Spatial Orientation Test.
Experimenter: “Please complete the following Cube Comparison Test. Read over the
instructions on the first page carefully and complete the practice session. You should
mark your answers on the test page. Do not turn the page until you are told to do so.
Please indicate when you have finished with the first page.”
ACTION: When participant has indicated they are prepared to continue…
Experimenter: “You will have 3 minutes to complete one page of cube comparisons.
Work as quickly and accurately as possible. Are you ready?”
ACTION: When the participant indicates they’re ready, start the stopwatch as you say:
Experimenter: “Go”
ACTION: When 3 minutes have passed say:
Experimenter: “Stop” “You will have 3 minutes to complete one more page of cube
comparisons. Work as quickly and accurately as possible. Are you ready?”
ACTION: When the participant indicates they’re ready, start the stopwatch as you say:
Experimenter: “Go”
ACTION: When 3 minutes have passed say:
Experimenter: “Stop”
67

ACTION: After the participant is done with the Cube Comparison test, administer the
Visualization test.
Experimenter: “Please complete the following Visualization Test. Read over the
instructions on the first page carefully and complete the practice session. You should
mark your answers on the test page. Do not turn the page until you are told to do so.
Please indicate when you have finished with the first page.”
ACTION: When participant has indicated they are prepared to continue…
Experimenter: “You will have 6 minutes to complete 2 pages of the visualization test.
Work as quickly and accurately as possible. Are you ready?”
ACTION: When the participant indicates they’re ready, start the stopwatch as you say:
Experimenter: “Go”
ACTION: When 6 minutes have passed say:
Experimenter: “Stop. You will have 6 minutes to complete 2 more pages of the
visualization test. Work as quickly and accurately as possible. Are you ready?”
ACTION: When the participant indicates they’re ready, start the stopwatch as you say:
Experimenter: “Go”
ACTION: When 6 minutes have passed say:
Experimenter: “Stop
ACTION: Remove the visualization test, and present the participant the Spatial
Orientation test book. BE SURE TO GIVE THEM A SCANTRON
Experimenter: “Please complete the following exercise. Read over the instruction page
carefully and complete the practice session on pages 1, 2, and 3. Please do NOT record
your responses to the practice items. When you have finished the practice session and are
ready to begin, please let me know. Please do NOT begin working on the remainder of
the exercise until instructed to do so”.
ACTION: Make sure that you tell them NOT TO WRITE IN THE BOOKLET and
record their answers ONLY on the scantron provided! After they let you know that they
68

are done going over the sample items give them a scantron and ask them again to record
their answers on the scantron ONLY! Hand them the scantron.
Experimenter: “Please record your answers on the scantron only. Be sure to mark your
answer to Test question #8 on the scantron as #1 and continue from there. You have 10
minutes to work on the test. Do not spend too much on one item. If you are finished
before the time is called, you may go back and check your work. If you are not sure
about the answer to any item, you may guess, but avoid wild guessing. Your score will
be the number of correct answers minus a fraction of the number wrong. Are you ready?
ACTION: When the participant indicates they’re ready, start the stopwatch as you say:
Experimenter: “Go”
ACTION: At the end of 10 minutes:
Experimenter: “Stop.”
ACTION: Collect the scantron and test booklet.
Experimenter: “Please listen carefully to the following instructions. Your task is to
study a set of directions, then practice traversing the route that those directions describe.
You will have 15 minutes to study those directions. Do you have any questions?”
ACTION: If the participant has no questions, hand them their booklet with the proper
Pre-brief statement and directions.
Experimenter: “Please read the Pre-brief statement. When you are finished please let
me know.”
ACTION: When the participant has read the pre-brief statement, have them don the
BARS system and conduct the familiarization task. (See separate instruction.) When the
familiarization is complete have the participant return to the testing area, and when they
are ready, start the stopwatch as you say:
Experimenter: “You have 15 minutes to study these directions, starting now.”
ACTION: When 15 minutes are up, stop the watch, and retrieve the notebook.
69

Experimenter: “Your practice session will be conducted using an augmented reality
system to project a virtual model of the office space through which you will walk using
the directions you've studied. Remember each step you take in the model is equal to 3
steps in the real office space. You will have 3 opportunities to walk through the entire
route. Remember that when you get to the edge of an area the screen will turn gray or
black. When that happens please let us know so we can move you to the next proper
position. In addition to the intersections and aisles of office space, you will see the
survey flags to use as cues and you will be able to monitor your own movement through
the model by the footprints you leave behind you.
If you make a mistake you will be asked to stop, and will have to discover the
correct move without instruction and try again. This will be repeated until you make the
proper move and have progressed completely through the model.
Please put on the augmented reality system and get comfortable with it”.
ACTION: Assist the participant to put on the equipment and adjust the display. When
comfortable, move them to the starting point of the first chunk of the route.
Experimenter: “You are about to begin. Do you have any questions?”
ACTION: Perform 3 practice runs through the model. At the end of each practice trial
present the POST TEST Symptom Checklist. When finished –
Experimenter: “This completes the practice portion of the experiment. Please remove
the augmented reality system.”
ACTION: When the equipment has all been removed and stowed give an additional
POST TEST Symptom Checklist to complete. Retrieve the form when finished then -
Experimenter: “We will now move to the test environment on the 4th floor of this
building.”
ACTION: Move to the 4th floor and to the starting point. Be sure the survey flags and
clipboards are in place prior to the participant’s arrival to the area. Lead the participant
to the starting point by the most direct route.
70

Experimenter: “You will now perform 1 timed trial of the route you practiced
previously. At 2 points along the route you will find a clipboard hanging from the wall.
You must stop at each, and without removing the clipboard from the wall; imagine
yourself standing at the center of the circle on the X, with your nose pointed toward the
12. Without looking around the room, write an S on the circle where you think the start
of the route is in relation to your current position, and an E on the circle where you think
the end of the route is in relation to your current position. Do you have any questions?”
ACTION: When there are no further questions
Experimenter: “You may begin.” START THE STOP WATCH
ACTION: Follow the participant and count the number of errors the make. Be sure they
stop and perform the localization task properly. When they reach the end STOP THE
STOP WATCH
Experimenter: “This completes the test portion of the experiment. We will now return
to the practice area.”
ACTION: When you have returned to the training area, be sure to pay them if they are
participating for cash payment, then give them a copy of the Debrief Statement along
with the Psychology Research Experience Evaluation Form for Participants, and thank
them for their participation.
71

Instructions for Experimenter to Read for BARS Familiarization
First we will help you don the BARS system. Please let the technicians assist you
in donning the vest, and the head mounted display. The vest is adjustable using the three
straps across the front. Please feel free to request help in adjusting the straps. The head
mounted display is also adjustable, but the band must be snug around your head to keep
the display from moving while in use.
Please be careful not to catch any of the cables with your hands or pull on them.
Anytime the display presents an empty gray field please tell the technicians.
You will be able to see the floor by looking under the bottom edge of the display.
The image you will see is a model of an office environment made up of cubicles.
You should be able to see walls, ceiling, floor, and office furniture along with survey
flags, small colored squares hanging from thin sticks that protrude from the walls of the
cubicle aisles. If you want to see where you’ve been, look at the floor through the
display directly behind you and you will see your own footprints.
Your movement through this environment will be 3 times faster than in the real
world. Each step you take in the model is worth 3 steps in the real world.
The model is broken into sections. When you reach the end of a section the
display will turn a solid gray and you should stop walking. You will then be directed to
move to one of the yellow spots on the floor identified with a black letter.
When the display appears and you can see it clearly, look straight ahead, take 2
steps straight forward and stop. Turn your head slowly to the left. (Pause) Now turn
slowly to the right. (Pause). Return slowly to looking forward.
72

Now, turn your head quickly to the left, quickly to the right, and return quickly to
center. Note the difference in the appearance of the model depending on the speed with
which you move your head. Look at the floor through the display and turn around to see
your own footprints directly behind you.
Please take a few minutes to walk through this space. Be careful to stay in the
aisles because there is nothing to stop you from walking through a wall, which is likely to
be disorienting. Be sure to turn left and right to walk into cubicles and see the furniture
in them. Note the presence of survey flags.
When you have reached the edge of the section the display will look gray. Please
let the technician know when that happens so you can be directed to your next starting
point.
When you have been repositioned and the office model appears in the display you
will be in the same position as you were before the display turned gray. Please use this
section to explore the area, as you like. When you feel familiar with moving through the
model please let us know so we may continue with the next part of the experiment.
Do you have any questions?
73

MR Rehearsal Instructions
You will be positioned at the starting point of the route, with your back to the windows.
Please walk the route that you have learned.
If you make an error, you will be told to stop, and must determine how to correct your
movement without input from the technician.
When the display shows a solid gray please stop and allow the technician to re-position
you at the starting point of the next tile.
You will perform 3 practice trials of the entire route through the model.
Do you have any questions?
74

(Read this to each WALKING condition participant)
The Experimenter: “Thank you for participating in this experiment. This experiment is
part of an Augmented Reality research project sponsored by the Army Research Institute.
In general, augmented reality systems add information to the real world using a
computer. The entire test should take less than two hours.
Your task involves learning to navigate a specific route through an office area.
Before learning the route and performing the task, you will be asked to fill out an
informed consent form, a demographics sheet and take two surveys concerning the way
you experience motion. You will then be asked to complete three tests that are used to
evaluate your spatial abilities. Do your best on the tests, go in sequence through the
questions, and do not go back and redo questions unless you have finished before time is
called.
If at any time you feel uncomfortable with the situation and want to stop the
experiment, please verbalize your intent and we will stop the experiment. Otherwise, we
will not respond to questions or comments during your completion of surveys, training,
or testing.
Do you have any questions so far?”
ACTION: Give the participant the Informed Consent Form and the demographics sheet.
Experimenter: “Please fill out the Informed Consent Form and the demographics
sheet”.
ACTION: After the participant is done with filling out the consent form and the
demographics sheet, administer Motion History Questionnaire.
Experimenter: “Please complete the Motion History Questionnaire.”
ACTION: After the participant is done with the motion history questionnaire, administer
the Simulator Sickness Questionnaire.
Experimenter: “Please complete the Simulator Sickness Questionnaire.”
75

ACTION: After the participant is done with the Simulator Sickness Questionnaire,
administer the Spatial Orientation Test.
Experimenter: “Please complete the following Cube Comparison Test. Read over the
instructions on the first page carefully and complete the practice session. You should
mark your answers on the test page. Do not turn the page until you are told to do so.
Please indicate when you have finished with the first page.”
ACTION: When participant has indicated they are prepared to continue…
Experimenter: “You will have 3 minutes to complete one page of cube comparisons.
Work as quickly and accurately as possible. Are you ready?”
ACTION: When the participant indicates they’re ready, start the stopwatch as you say:
Experimenter: “Go”
ACTION: When 3 minutes have passed say:
Experimenter: “Stop” “You will have 3 minutes to complete one more page of cube
comparisons. Work as quickly and accurately as possible. Are you ready?”
ACTION: When the participant indicates they’re ready, start the stopwatch as you say:
Experimenter: “Go”
ACTION: When 3 minutes have passed say:
Experimenter: “Stop”
ACTION: After the participant is done with the Cube Comparison test, administer the
Visualization test.
Experimenter: “Please complete the following Visualization Test. Read over the
instructions on the first page carefully and complete the practice session. You should
mark your answers on the test page. Do not turn the page until you are told to do so.
Please indicate when you have finished with the first page.”
ACTION: When participant has indicated they are prepared to continue…
Experimenter: “You will have 6 minutes to complete 2 pages of the visualization test.
Work as quickly and accurately as possible. Are you ready?”
76

ACTION: When the participant indicates they’re ready, start the stopwatch as you say:
Experimenter: “Go”
ACTION: When 6 minutes have passed say:
Experimenter: “Stop. You will have 6 minutes to complete 2 more pages of the
visualization test. Work as quickly and accurately as possible. Are you ready?”
ACTION: When the participant indicates they’re ready, start the stopwatch as you say:
Experimenter: “Go”
ACTION: When 6 minutes have passed say:
Experimenter: “Stop
ACTION: Remove the visualization test, and present the participant the Spatial
Orientation test book. BE SURE TO GIVE THEM A SCANTRON
Experimenter: “Please complete the following exercise. Read over the instruction page
carefully and complete the practice session on pages 1, 2, and 3. Please do NOT record
your responses to the practice items. When you have finished the practice session and are
ready to begin, please let me know. Please do NOT begin working on the remainder of
the exercise until instructed to do so”.
ACTION: Make sure that you tell them NOT TO WRITE IN THE BOOKLET and
record their answers ONLY on the scantron provided! After they let you know that they
are done going over the sample items give them a scantron and ask them again to record
their answers on the scantron ONLY! Hand them the scantron.
Experimenter: “Please record your answers on the scantron only. Be sure to mark your
answer to Test question #8 on the scantron as #1 and continue from there. You have 10
minutes to work on the test. Do not spend too much on one item. If you are finished
before the time is called, you may go back and check your work. If you are not sure
about the answer to any item, you may guess, but avoid wild guessing. Your score will
be the number of correct answers minus a fraction of the number wrong. Are you ready?
ACTION: When the participant indicates they’re ready, start the stopwatch as you say:
77

Experimenter: “Go”
ACTION: At the end of 10 minutes:
Experimenter: “Stop.”
ACTION: Collect the scantron and test booklet.
Experimenter: “Please listen carefully to the following instructions. Your task is to
study a set of directions, then practice traversing the route that those directions describe.
You will have 15 minutes to study those directions. Do you have any questions?”
ACTION: If the participant has no questions, hand them their booklet with the proper
Pre-brief statement and directions.
Experimenter: “Please read the Pre-brief statement. When you are finished please let
me know.”
ACTION: When the participant has read the pre-brief statement, and when they are
ready, start the stopwatch as you say:
Experimenter: “You have 15 minutes to study these directions, starting now.”
ACTION: When 15 minutes are up, stop the watch, and retrieve the notebook.
Experimenter: “Your practice session will be conducted by walking through the actual
office space. You will have 3 opportunities to walk through the entire route. In addition
to the intersections and aisles of office space, you will see the survey flags to use as cues.
If you make a mistake you will be asked to stop, and will have to discover the
correct move without instruction and try again. This will be repeated until you make the
proper move and progressed completely through the route. We will now move to the test
environment on the 4th floor of this building.”
ACTION: Move to the 4th floor and to the starting point. Be sure the survey flags and
clipboards are in place prior to the participant’s arrival to the area. Lead the participant
to the starting point by the most direct route.
Experimenter: “You will now perform 3 practice trials of the route you have studied as
previously described.”
78

ACTION: Perform 3 practice runs through the space. At the end of the practice session
present the POST TEST Symptom Checklist. When finished –
Experimenter: “This completes the practice portion of the experiment.
You will now perform 1 timed trial of the route you practiced previously. At 2 points
along the route you will find a clipboard hanging from the wall. You must stop at each,
and without removing the clipboard from the wall; imagine yourself standing at the
center of the circle on the X, with your nose pointed toward the 12. Without looking
around the room, write an S on the circle where you think the start of the route is in
relation to your current position, and an E on the circle where you think the end of the
route is in relation to your current position. Do you have any questions?”
ACTION: When there are no further questions
Experimenter: “You may begin.” START THE STOP WATCH
ACTION: Follow the participant and count the number of errors the make. Be sure they
stop and perform the localization task properly. When they reach the end STOP THE
STOP WATCH
Experimenter: “This completes the test portion of the experiment. We will now return
to the practice area.”
ACTION: When you have returned to the training area, be sure to pay them if they are
participating for cash payment, then give them a copy of the Debrief Statement along
with the Psychology Research Experience Evaluation Form for Participants, and thank
them for their participation.
(Read this to each MAP condition participant)
The Experimenter: “Thank you for participating in this experiment. This experiment is
part of an Augmented Reality research project sponsored by the Army Research Institute.
In general, augmented reality systems add information to the real world using a
computer. The entire test should take less than two hours.
79

Your task involves learning to navigate a specific route through an office area.
Before learning the route and performing the task, you will be asked to fill out an
informed consent form, a demographics sheet and take two surveys concerning the way
you experience motion. You will then be asked to complete three tests that are used to
evaluate your spatial abilities. Do your best on the tests, go in sequence through the
questions, and do not go back and redo questions unless you have finished before time is
called.
If at any time you feel uncomfortable with the situation and want to stop the
experiment, please verbalize your intent and we will stop the experiment. Otherwise, we
will not respond to questions or comments during your completion of surveys, training,
or testing.
Do you have any questions so far?”
ACTION: Give the participant the Informed Consent Form and the demographics sheet.
Experimenter: “Please fill out the Informed Consent Form and the demographics
sheet”.
ACTION: After the participant is done with filling out the consent form and the
demographics sheet, administer Motion History Questionnaire.
Experimenter: “Please complete the Motion History Questionnaire.”
ACTION: After the participant is done with the motion history questionnaire, administer
the Simulator Sickness Questionnaire.
Experimenter: “Please complete the Simulator Sickness Questionnaire.”
ACTION: After the participant is done with the Simulator Sickness Questionnaire,
administer the Spatial Orientation Test.
Experimenter: “Please complete the following Cube Comparison Test. Read over the
instructions on the first page carefully and complete the practice session. You should
mark your answers on the test page. Do not turn the page until you are told to do so.
Please indicate when you have finished with the first page.”
80

ACTION: When participant has indicated they are prepared to continue…
Experimenter: “You will have 3 minutes to complete one page of cube comparisons.
Work as quickly and accurately as possible. Are you ready?”
ACTION: When the participant indicates they’re ready, start the stopwatch as you say:
Experimenter: “Go”
ACTION: When 3 minutes have passed say:
Experimenter: “Stop” “You will have 3 minutes to complete one more page of cube
comparisons. Work as quickly and accurately as possible. Are you ready?”
ACTION: When the participant indicates they’re ready, start the stopwatch as you say:
Experimenter: “Go”
ACTION: When 3 minutes have passed say:
Experimenter: “Stop”
ACTION: After the participant is done with the Cube Comparison test, administer the
Visualization test.
Experimenter: “Please complete the following Visualization Test. Read over the
instructions on the first page carefully and complete the practice session. You should
mark your answers on the test page. Do not turn the page until you are told to do so.
Please indicate when you have finished with the first page.”
ACTION: When participant has indicated they are prepared to continue…
Experimenter: “You will have 6 minutes to complete 2 pages of the visualization test.
Work as quickly and accurately as possible. Are you ready?”
ACTION: When the participant indicates they’re ready, start the stopwatch as you say:
Experimenter: “Go”
ACTION: When 6 minutes have passed say:
Experimenter: “Stop. You will have 6 minutes to complete 2 more pages of the
visualization test. Work as quickly and accurately as possible. Are you ready?”
81

ACTION: When the participant indicates they’re ready, start the stopwatch as you say:
Experimenter: “Go”
ACTION: When 6 minutes have passed say:
Experimenter: “Stop
ACTION: Remove the visualization test, and present the participant the Spatial
Orientation test book. BE SURE TO GIVE THEM A SCANTRON
Experimenter: “Please complete the following exercise. Read over the instruction page
carefully and complete the practice session on pages 1, 2, and 3. Please do NOT record
your responses to the practice items. When you have finished the practice session and are
ready to begin, please let me know. Please do NOT begin working on the remainder of
the exercise until instructed to do so”.
ACTION: Make sure that you tell them NOT TO WRITE IN THE BOOKLET and
record their answers ONLY on the scantron provided! After they let you know that they
are done going over the sample items give them a scantron and ask them again to record
their answers on the scantron ONLY! Hand them the scantron.
Experimenter: “Please record your answers on the scantron only. Be sure to mark your
answer to Test question #8 on the scantron as #1 and continue from there. You have 10
minutes to work on the test. Do not spend too much on one item. If you are finished
before the time is called, you may go back and check your work. If you are not sure
about the answer to any item, you may guess, but avoid wild guessing. Your score will
be the number of correct answers minus a fraction of the number wrong. Are you ready?
ACTION: When the participant indicates they’re ready, start the stopwatch as you say:
Experimenter: “Go”
ACTION: At the end of 10 minutes:
Experimenter: “Stop.”
ACTION: Collect the scantron and test booklet.
82

Experimenter: “Please listen carefully to the following instructions. Your task is to
study a set of directions, then practice the route that those directions describe. You will
have 15 minutes to study those directions. Do you have any questions?”
ACTION: If the participant has no questions, hand them their booklet with the proper
Pre-brief statement and directions.
Experimenter: “Please read the Pre-brief statement. When you are finished please let
me know.”
ACTION: When the participant has read the pre-brief statement, and when they are
ready, start the stopwatch as you say:
Experimenter: “You have 15 minutes to study these directions, starting now.”
ACTION: When 15 minutes are up, stop the watch, and retrieve the notebook.
Experimenter: “Your practice session will be conducted by drawing the route on a floor
plan of the actual office space. You will have 3 opportunities to draw the entire route. In
addition to the intersections and aisles of office space, you will see the survey flags to use
as cues.
If you make a mistake you will be asked to stop, and will have to discover the
correct move without instruction and try again. This will be repeated until you make the
proper move and have progressed completely through the route.”
ACTION: Perform 3 practice drawings through the space. At the end of the practice
session present the POST TEST Symptom Checklist. When finished –
Experimenter: “This completes the practice portion of the experiment. We will now
move to the test area on the 4th floor of this building.
ACTION: Move to the 4th floor and to the starting point. Be sure the survey flags and
clipboards are in place prior to the participant’s arrival to the area. Lead the participant
to the starting point by the most direct route.
Experimenter: “You will now perform 1 timed trial of the route you practiced
previously. At 2 points along the route you will find a clipboard hanging from the wall.
83

You must stop at each, and without removing the clipboard from the wall; imagine
yourself standing at the center of the circle on the X, with your nose pointed toward the
12. Without looking around the room, write an S on the circle where you think the start
of the route is in relation to your current position, and an E on the circle where you think
the end of the route is in relation to your current position. Do you have any questions?”
ACTION: When there are no further questions
Experimenter: “You may begin.” START THE STOP WATCH
ACTION: Follow the participant and count the number of errors the make. Be sure they
stop and perform the localization task properly. When they reach the end STOP THE
STOP WATCH
Experimenter: “This completes the test portion of the experiment. We will now return
to the practice area.”
ACTION: When you have returned to the training area, be sure to pay them if they are
participating for cash payment, then give them a copy of the Debrief Statement along
with the Psychology Research Experience Evaluation Form for Participants, and thank
them for their participation.
84

APPENDIX E DEMOGRAPHICS QUESTIONNAIRE
85

Demographics Questionnaire
Participant number: ___________ Date: __________
Male _____ Female _____ Age: _____
Year in School: _______________________ Major:
_________________________
Is your vision corrected to 20/20? YES NO
Do you have any color vision deficiency? YES NO
If yes, please describe:
How many hours a week do you spend using a computer? _____
How many hours a week do you spend playing video games? _____
On a scale of 1 to 10, with one meaning you are never misoriented and 10 meaning you always have trouble finding your way around, how would you rate your sense of direction? _____ How often do you use a map?
Never _____ Once a week _____ Once a month _____ Once a year _____
When you use a map do you always orient the map with north up, or do you rotate the map based on your direction of travel?
86

APPENDIX F ROUTE DIRECTIONS FOR MEMORIZATION
87

Route Directions
Please study the following directions to walk from one point to another along this specific
route.
Stand with your back to the windows
Walk forward past the pink flag
Turn right and walk to the next intersection
Turn left and walk past the white flag
88

Turn left and walk to the intersection
Turn left and walk toward the blue flag
Turn right and walk to the next intersection
Turn left and walk past 2 blue flags
Turn right and walk to the next intersection
Turn right and walk past the white flag
89

Turn left and walk to the next intersection
Turn left and walk past the blue flag to the next intersection
Turn left and walk to the next intersection
Turn right and end facing the window
90

APPENDIX G IRB APPROVAL LETTER
91

92

REFERENCES
Allen, G.L., & Kirasic, K.C. (1985). Effects of the Cognitive Organization of Route Knowledge on Judgments of Macrospatial Distances. Memory & Cognition, (3) 218-227
Arthur, E.J., & Hancock, P.A., (2001). Navigation training in virtual environments,
International Journal of Cognitive Ergonomics, Lawrence Erlbaum, 5(4), 387-400.
Bailey, J.H. (1994). Spatial Knowledge Acquisition in a Virtual Environment. Unpublished doctoral dissertation, University of Central Florida, Orlando.
Banker, W.P., (1997). Virtual Environments and Wayfinding in the Natural
Environment, Naval Postgraduate School, Monterey, CA. Bernatovich, D., (1999). The Effect of Presence on the Ability to Acquire Spatial
Knowledge in Virtual Environments, Naval Postgraduate School, Monterey, CA. Cevik, H., (1998). Map Usage in Virtual Environments. Naval Postgraduate School,
Monterey, CA. Columbia University, (2004) http://www1.cs.columbia.edu/graphics/ New York, NY.
Retrieved from the Internet, July 21, 2004. Conroy, R., (2001). Spatial Navigation in Immersive Virtual Environments. Doctoral
Dissertation, University College London, London, England. Darken, R.P., & Sibert, J.L., (1993). A toolset for navigation in virtual environments.
Proceedings of the 6th Annual ACM symposium on User interface software and technology, Atlanta, GA., 157-165.
Diaz, D.D., & Sims, V.K., (2003). Augmenting virtual environments: the influence of
spatial ability on learning from integrated displays. High Ability Studies, 14 (2), 191-212
Ekstrom, R.B., French, J.W., Harman, H.H., & Dermen, D. (1976). Manual for Kit of
Factor-Referenced Cognitive Tests 1976. Education Testing Service, Princeton, NJ. Guilford, J.P., (1948). The Guilford-Zimmerman aptitude survey. Journal of Applied
Psychology, 32(1) 24-34. Goldin, S.E., & Thorndyke, P.W. (1982). Simulating Navigation for Spatial Knowledge
Acquisition. Human Factors, 24(4), 457-471.
93

Grammenos, D. Filou, M., Papadakos, P., & Stephanidis, C., (2002). Virtual Prints: Leaving trails in virtual environments. Eighth Eurographics Workshop on Virtual Environments, the Eurographics Association, Aire-la-Ville, Switzerland. 131-138.
InterSense IS-900 VET, VWT & SimTracker Manual Doc. No. 072-00060-0F00 Revision
2.1, InterSense, Inc., Burlington, MA. Kennedy, R.S., Lane, N.E., Berbaum, K.S., & Lilienthal, M.G. (1993). Simulator
sickness questionnaire: An enhanced method for quantifying simulator sickness. The International Journal of Aviation Psychology, 3(3), 203-220.
Kennedy, R.S., Stanney, K.M., Lane, N.E., Lanham, S., & Kingdon, K. (2001). Use of a
motion experience questionnaire to predict simulator sickness. Proceedings of HCI International 2001, New Orleans, LA.
Knerr, B.W., Lampton, D.R., Singer, M.J., Witmer, B.G., Goldberg, S.L., Parson, K.A. &
Parsons, J. (1998). Virtual environments for dismounted soldier training and performance: Results, recommendations and issues (ARI Technical Report 1089). Alexandria, VA: Army Research Institute.
Livingston, M.A., Brown, D., Gabbard, J.L., Rosenblum, L.J., Yohan, B., Julier, S.J.,
Swan II, J.E., & Hix, D., (2002). An Augmented Reality System for Military Operations in Urban Terrain. Proceedings of the I/ITSEC Conference, 2002, Orlando, FL.
Milgram, P., Takemura, H., Utsumi, A., & Kishino, F., (1994). Augmented reality: a
class of displays on the reality-virtuality continuum. SPIE Vol. 2352, Telemanipulator and Telepresence Technologies, 1994.
Moeser, S.D., (1988). Cognitive Mapping in a Complex Building. Environment and
Behavior, 20, 21-49. Nemire, K., (1998). Immersive virtual environment for dismounted infantry tactics
training and mission rehearsal. Proceedings of the I/ITSEC Conference, 1998, Orlando, FL.
Presson, C.C., & Hazelrigg, M.D., (1984). Building Spatial Representations through
Primary and Secondary Learning. Journal of Experimental Psychology: Learning, Memory and Cognition, 10, 716-222.
Schlender, D., Peters, O.H., & Wienhofer, M., (2002). The effects of maps and textual
information on navigation in a desktop virtual environment. Spatial Cognition and Computation 2: 421-433.
Scholl, M.J., (1993). Cognitive Maps as Orienting Schemata. Cognition, 4, 615-628.
94

Stanney, K., & Salvendy, G., (1997). Aftereffects and Sense of Presence in Virtual Environments: Formulation of a Research and Development Agenda. HCI International ’97, Seventh International Conference on Human Computer Interaction, San Francisco, CA.
Swan II, J.E., Gabbard, J.L., Hix, D., Schulman, R.S., & Kim, K., (2003). A comparative
study of user performance in a map-based virtual environment. Proceedings of IEEE Virtual Reality 2003, IEEE Computer Society. 259-266.
Thorndyke, P.W., & Hayes-Roth, B., (1982). Differences in Spatial Knowledge from
Maps and Navigation. Cognitive Psychology, 14, 560-589. Unguder, E., (2001). The Effects of Natural Locomotion on Maneuvering Task
Performance in Virtual and Real Environments, Naval Postgraduate School, Monterey, CA.
Vinson, N.G., (1999). Design Guidelines for Landmarks to Support Navigation in
Virtual Environments, National Research Council Canada, Institute for Information Technology, Proceedings of CHI ’99, Pittsburgh, PA.
Witmer, B.G., Bailey, J.H. & Knerr, B.W., (1996). Virtual spaces and real world places:
transfer of route knowledge, International Journal of Human-Computer Studies Wothke, W., Bock, R.D., Curran, L.T., Fairbank, B.A., Augustin, J.W., Gillet, A.H., &
Guerrero, C. (1991). Factor Analytic Examination of the Armed Services Vocational Aptitude Battery (ASVAB) and the Kit of Factor-Referenced Tests. Air Force Human Resources Laboratory Technical Report 90-67, Brooks Air Force Base, Texas.
95