trans-european transport networks and regional economic
TRANSCRIPT

Carsten Schürmann, Klaus Spiekermann, Michael Wegener
Trans-European Transport Networks and Regional Economic Development
Paper presented at the 42nd Congress of the European Regional Science Association (ERSA),
Dortmund, 27-31 August 2002
Carsten Schürmann, Michael Wegener Institute of Spatial Planning (IRPUD)
University of Dortmund D-44221 Dortmund
Phone: +49 (0) 231 755 2475 Fax: +49 (0) 231 755 4788
Email: cs/[email protected]
Klaus Spiekermann Spiekermann & Wegener Stadt- und Regionalforschung (S&W)
Lindemannstrasse 10 D-44137 Dortmund
Phone: + 49 (0) 231 1899 439 Fax: +49 (0) 231 1899 443
Email: [email protected] Abstract: The important role of transport infrastructure for regional development is one of the fundamental principles of regional economics. In its most simplified form it implies that regions with better access to locations of input materials and markets will, ceteris pari-bus, be more productive, more competitive and hence more successful than more remote and isolated regions. However, this hypothesis is not undisputed, and its consistent and rational verification remains an important political issue. This paper presents the struc-ture and simulation results of a recursive simulation model of regional socio-economic development subject to exogenous assumptions about the economic and demographic development of the EU as a whole and about transport infrastructure investments and improvements. It concludes with an outlook on further improvements of the model with respect to model theory, model database and model techniques.

Trans-European Transport Networks and Regional Economic Development
2
1 Introduction The relationship between transport infrastructure and economic development has be-come more complex than ever. There are successful regions in the European core con-firming the theoretical expectation that location matters. However, there are also cen-trally located regions suffering from industrial decline and high unemployment. On the other side of the spectrum the poorest regions, as theory would predict, are at the pe-riphery, but there are also prosperous peripheral regions such as the Nordic countries. To make things even more difficult, some of the economically fastest growing regions are among the most peripheral ones. In this situation, the European Union expects to contribute to reducing the socio-economic disparities between its regions by the development of the trans-European transport networks (TEN-T). The TEN-T are one of the most ambitious initiatives of the European Community since its foundation. The masterplans for rail, road, waterways, ports and airports together require public and private investment between 400 and 500 billion ECU until the year 2010. However, the programme is not undisputed. Critics argue that many of the new connections do not link peripheral countries to the core but strengthen the ties between central countries and so reinforce their accessibility advan-tage. It is argued that regional development policies based on the creation of infrastruc-ture in lagging regions have not succeeded in reducing regional disparities, whereas others point out that it has yet to be ascertained that the reduction of barriers between regions has disadvantaged peripheral regions. From a theoretical point of view, both effects can occur. A new motorway or high-speed rail connection between a peripheral and a central region, for instance, makes it easier for producers in the peripheral region to market their products in large cities, however, it may also expose the region to the competition of more advanced products from the centre and so endanger formerly se-cure regional monopolies. In the face of this uncertainty, the consistent prediction and rational and transparent evaluation of likely socio-economic impacts of major transport infrastructure invest-ments has become of great political importance. A comprehensive and transferable model for forecasting socio-economic and spatial impacts of large transport investments in Europe, in particular of different scenarios of TEN-T development, was developed in the project "Socio-Economic and Spatial Impacts of Transport Infrastructure Invest-ments and Transport System Improvements" (SASI) for DG VII (Transport) of the European Commission (Wegener and Bökemann, 1998; Fürst et al., 1999; 2000) and will be further developed in the project "Integrated Assessment of Spatial Economic and Network Effects of Transport Investments and Policies" (IASON) for DG TREN. The main goals of the SASI project were to design an interactive and transparent model-ling system for forecasting the impacts of transport infrastructure investments and transport system improvements on socio-economic developments in Europe, including spatial and temporal distribution and uncertainty of impacts, and to demonstrate the usability of the modelling system by applying it to a number of relevant case studies in the framework of various scenarios of political, social and economic developments. The SASI model developed to meet these objectives is a recursive simulation model of socio-economic development in Europe subject to exogenous assumptions about the economic and demographic development of the EU as a whole and transport infrastruc-

Trans-European Transport Networks and Regional Economic Development
3
ture investments and transport system improvements. For each region it forecasts the development of accessibility, GDP per capita and unemployment in one-year incre-ments until the forecasting horizon 2016. In addition cohesion indicators expressing the impact of infrastructure investments and system improvements on the convergence or divergence of socio-economic development in the EU regions are calculated. The model differs from other approaches to model impacts of transport on regional de-velopment by modelling not only production (the demand side of regional labour mar-kets) but also population (the supply side of regional labour markets), which makes it possible to model regional unemployment. The impacts of transport infrastructure in-vestments on regional production is modelled by regional production functions in which, besides non-transport regional endowment factors, sophisticated spatially disag-gregate accessibility indicators are included. With respect to the cohesion objective of the EU, the model is to answer the question whether the TEN-T will lead to a reduction of regional disparities and which regions are likely to benefit from the TEN-T and which regions are likely to be disadvantaged. The paper summarises the theoretical foundation and internal structure of the model and presents results of the demonstration scenario simulations. 2 Model Overview The SASI model is innovative in that it is based on measurable indicators derived from advanced location theory to explain and predict the locational behaviour of investment capital, manufacturing and services and population. It is designed to facilitate political discussion and negotiation by being transparent and open for new indicators and issues that may become relevant in the future. 2.1 Submodels The SASI model consists of six forecasting submodels: European Developments, Re-gional Accessibility, Regional GDP, Regional Employment, Regional Population and Regional Labour Force. A seventh submodel calculates Socio-Economic Indicators with respect to efficiency and equity (Figure 1). European Developments The European Developments submodel prepares the exogenous assumptions about the wider economic and policy framework of the simulation. European developments in-clude assumptions about the future performance of the European economy as a whole and the level of immigration and outmigration across Europe's borders. They serve as constraints to ensure that the regional forecasts of economic development and popula-tion are consistent with external developments not modelled. Given the expected rapid population growth and lack of economic opportunity in many origin countries, total European immigration will be largely a function of immigration policies by national governments of the EU countries. Another relevant policy field are transfer payments by the European Union or by national governments, which are responsible for a sizeable part of their economic growth in some regions. The last group of assumptions concern policy decisions on the trans-European networks. As these are of focal interest, they are

Trans-European Transport Networks and Regional Economic Development
4
modelled with considerable detail. Besides a 'baseline' scenario several TEN-T scenarios reflecting different possible investment programmes for the road, rail or air networks were specified.
Figure 1. The SASI model. Regional Accessibility This submodel calculates regional accessibility indicators expressing the locational advantage of each region with respect to relevant destinations as a function of travel time to reach these destinations by the road, rail and air networks. Sophisticated spatially disaggregate accessibility indicators are used, which take into account that accessibility within a region is not homogenous but rapidly decreases with increasing distance from the nodes of the networks. From a variety of accessibility indicators, potential accessibility expressed as logsum of road, rail and air networks were selected as most relevant for explaining the locational behaviour of firms (see Fürst et al., 1999; Schürmann et al., 1997; Spiekermann and Wegener, 1996; 1999). Regional GDP This is the core submodel. It forecasts GDP by industrial sector (agriculture, manufac-turing, services) generated in each region as a function of economic structure, labour force, endowment indicators and accessibility. Endowment indicators measure the suit-ability or capacity of a region for economic activity. They include traditional location factors such as availability of business services, capital stock and intraregional transport infrastructure as well as 'soft' location factors, such as cultural facilities, housing and a pleasant climate and environment. Accessibility indicators are derived from the Re-

Trans-European Transport Networks and Regional Economic Development
5
gional Accessibility submodel. In addition, monetary transfers by the European Union or by national governments are considered, as they account for a sizeable portion of the economic development of peripheral regions. Regional Employment Regional employment is calculated by combining the results of the GDP submodel with exogenous forecasts of regional labour productivity by industrial sector (GDP per worker), which in addition may be changed by effects of changes in regional accessibil-ity. It is assumed that labour productivity grows by a national sector-specific growth rate and is co-determined by historical conditions in the region, i.e. by its composition of industries and products, technologies and education and skill of labour. Regional Population Population forecasts are needed to represent the demand side of regional labour mar-kets. The Regional Population submodel predicts regional population change due to natural change and migration. Births and deaths are modelled by a cohort-survival model subject to exogenous forecasts of regional fertility and mortality rates. Migration is modelled in a simplified migration model as annual net migration as a function of regional unemployment and other indicators expressing the attractiveness of the region as a place of employment and a place to live. The migration forecasts are adjusted to comply with total European immigration and outmigration forecast in the European Developments submodel and the limits on immigration set by individual countries. In addition, regional educational attainment is forecast based on external assumptions on national developments of educational attainment. Regional Labour Force Regional labour force is derived from regional population and exogenous forecasts of regional labour force participation rates modified by effects of regional unemployment. It is assumed that labour force participation grows by an average country-specific rate and is co-determined by historical conditions in the region, i.e. by cultural and religious traditions and education, and that it is positively affected by availability of jobs. Socio-economic Indicators Total GDP and employment are related to population and labour force by calculating total regional GDP per capita and regional unemployment. Accessibility, besides being a factor determining regional production, is also considered a policy-relevant output of the model. In addition, equity or cohesion indicators describing the distribution of ac-cessibility, GDP per capita and unemployment across regions are calculated. 2.2 Space and Time The SASI model forecasts socio-economic development for 201 regions at the NUTS-2 level for the fifteen EU countries ('internal' regions). 27 regions defined for the rest of Europe ('external' regions) are used as additional destinations for accessibility calcula-tions. The spatial dimension of the model is established by the connection of the regions via networks. Road, rail and air networks are considered. These networks contain all TEN-T links laid down in Decision No. 1692/96/CE of the European Parliament and the Council (European Communities, 1996) and the east European road and rail corridors

Trans-European Transport Networks and Regional Economic Development
6
identified by the Pan-European Transport Conference in Crete (European Communities, 1995) as well as additional links selected for connectivity reasons. The temporal dimension of the model is established by dividing time into discrete time intervals of one year duration, so that both short- and long-term lagged impacts can be taken into account. The base year of the simulations is 1981 in order to reproduce the main trends of spatial development in Europe over a significant time period of the past with satisfactory accuracy. The forecasting horizon is 2016. In each simulation year the seven submodels of the SASI model are processed in a recursive way, i.e. sequentially one after another (Figure 2).
Figure 2. The recursive organisation of the SASI model.

Trans-European Transport Networks and Regional Economic Development
7
This implies that within one simulation period no equilibrium between model variables is established; in other words, all endogenous effects in the model are lagged by one or more years. 2.3 Network Scenarios As the purpose of the SASI model is to forecast impacts of TEN-T policy decision, sev-eral policy scenarios were defined to demonstrate the application of the model. The 'backbone' of these scenarios is the network evolution over time from 1981 to 2016. All scenarios are based on assumptions about the development of trans-European transport networks. The implementation of these assumptions starts from a 'backcast' of the evo-lution of the road, rail and air networks between 1981 and 1996. This backcast is similar for all transport infrastructure scenarios. The scenarios differ in their assumptions on the future development of the networks between 1996 and 2016. An infrastructure scenario is a time-sequenced investment programme for addition, up-grading or closure of links of the trans-European road or rail networks. Because of the inherent characteristics of aviation networks, which depend mainly on the distribution of slots among airlines, it is impossible to define reasonable future air networks; there-fore the 1996 air network remains unchanged for future years. The assumptions of the road and rail network scenarios are implemented in five-year increments. Four scenarios were examined (Table 1):
Table 1. Scenarios.
Number Name Description
Scenario 00 Do-nothing No network changes beyond 1996
Scenario 10 TEN Evolution of road and rail networks according to the TEN-T programme
Scenario 20 Rail TEN Evolution of rail network according to the TEN-T pro-gramme, no change for road beyond 1996
Scenario 09 Øresund Ferry Scenario 10 in which the Øresund bridge is replaced by current ferry services
In the Do-nothing Scenario (00) no development of the trans-European transport infra-structure is foreseen, i.e. the networks remain constant in future years as in 1996. Even new links currently under construction are not part of this scenario. Its purpose is to serve as a benchmark for the other scenarios. The TEN Scenario (10) assumes that all TEN road and rail links will be implemented until 2016. In the Rail TEN Scenario (20) it is assumed that only the rail links are implemented and that nothing happens with respect to road. The purpose of the Øresund Ferry Scenario (09) is to demonstrate the ability of the SASI model to isolate impacts of single transport infrastructure projects. All TEN-T projects are applied to the scenarios with respect to their estimated comple-tion times as laid down in the TEN Implementation Report (European Commission, 1998).
Trans-European Transport Networks and Regional Economic Development
8
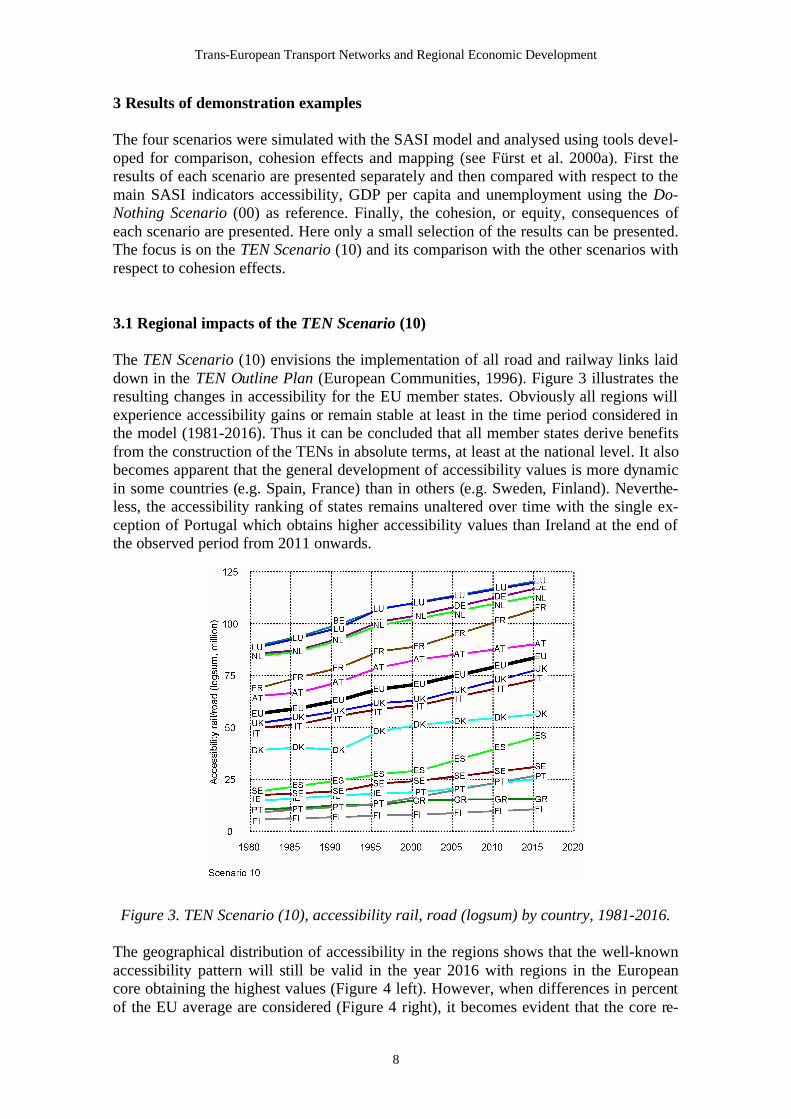
3 Results of demonstration examples The four scenarios were simulated with the SASI model and analysed using tools devel-oped for comparison, cohesion effects and mapping (see Fürst et al. 2000a). First the results of each scenario are presented separately and then compared with respect to the main SASI indicators accessibility, GDP per capita and unemployment using the Do-Nothing Scenario (00) as reference. Finally, the cohesion, or equity, consequences of each scenario are presented. Here only a small selection of the results can be presented. The focus is on the TEN Scenario (10) and its comparison with the other scenarios with respect to cohesion effects. 3.1 Regional impacts of the TEN Scenario (10) The TEN Scenario (10) envisions the implementation of all road and railway links laid down in the TEN Outline Plan (European Communities, 1996). Figure 3 illustrates the resulting changes in accessibility for the EU member states. Obviously all regions will experience accessibility gains or remain stable at least in the time period considered in the model (1981-2016). Thus it can be concluded that all member states derive benefits from the construction of the TENs in absolute terms, at least at the national level. It also becomes apparent that the general development of accessibility values is more dynamic in some countries (e.g. Spain, France) than in others (e.g. Sweden, Finland). Neverthe-less, the accessibility ranking of states remains unaltered over time with the single ex-ception of Portugal which obtains higher accessibility values than Ireland at the end of the observed period from 2011 onwards.
Figure 3. TEN Scenario (10), accessibility rail, road (logsum) by country, 1981-2016. The geographical distribution of accessibility in the regions shows that the well-known accessibility pattern will still be valid in the year 2016 with regions in the European core obtaining the highest values (Figure 4 left). However, when differences in percent of the EU average are considered (Figure 4 right), it becomes evident that the core re-

Trans-European Transport Networks and Regional Economic Development
9
gions will be worse off in 2016 than in 1996. Conversely, regions at the geographical periphery of Europe, particularly on the Iberian peninsula, experience the highest growth rates compared with the European average. The distribution of GDP in 2016 will still be familiar to contemporary observers (Figure 5 left) with the remarkable exception of the new Länder in Germany which attain GDP levels above the European average. Similarly, the new Länder exhibit the highest gains between 1996 and 2016 compared to the European average (Figure 5 right). Due to the extraordinary political and socio-economic development of these regions, the model results for these regions have to be considered with caution. The overall picture in the EU is that most peripheral regions are more dynamic than the European average with the exception of Ireland and the northern regions of Great Britain which are expected to experience relative losses. 3.2 Comparison of the TEN Scenario (10) and the Do-Nothing Scenario (00) For determining the socio-economic impact of TEN-T construction over time it is useful to compare the TEN Scenario (10) with the Do-Nothing Scenario (00). This comparison allows to isolate potential effects of TEN-T investment from other political, economic and demographic factors contributing to regional development. Figure 6 (left) shows a comparison of changes in accessibility in percent for the TEN Scenario (10) and the Do-Nothing Scenario (00). The greatest positive differences appear in the periphery, nota-bly on the Iberian Peninsula where they exceed 80 percent in some regions and amount to 150 percent in Lisbon. The differences are relatively small in the core regions of the EU. It is obvious that all regions benefit from TEN-T investment through increased ac-cessibility. Figure 6 (right) shows how TEN-T investments translate into changes in regional eco-nomic performance by considering regional differences in GDP per capita between both scenarios. Most regions in the European core and the northern European regions en-counter relative losses in GDP per capita compared with the Do-Nothing Scenario (00), while most peripheral regions are characterised by considerable relative gains. This pat-tern hints at a convergence in GDP of TEN-T investments since most regions in the cohesion countries experience relative gains (with the exception of Ireland and a small number of regions in Spain and Greece), while the richer regions experience relative losses. However, this picture is not unequivocal and differences between both scenarios are only marginal in most regions when compared to the order of magnitude of changes over time. The distribution of equivalent changes standardised to the European average is identical in this case, because of the fact that the overall development of European GDP is exogenously assumed and does not allow for differences in the aggregate eco-nomic performance of the EU in different scenarios. Also, considering absolute differ-ences in Euro per capita leads to a pattern very similar to the one described above.

Trans-European Transport Networks and Regional Economic Development
10
Figure 4. TEN Scenario (10), accessibility road, rail (logsum) by region, 2016 (left), change 1996-2016 (right).

Trans-European Transport Networks and Regional Economic Development
11
Figure 5. TEN Scenario (10), GDP per capita by region, 2016 (left), change 1996-2016 (right).

Trans-European Transport Networks and Regional Economic Development
12
Figure 6. TEN Scenario (10) v. Do-Nothing Scenario (00), accessibility (left) and GDP per capita (right), relative difference, 2016.

Trans-European Transport Networks and Regional Economic Development
13
If absolute changes in accessibility and GDP are compared, it is remarkable that espe-cially in the British, Irish and Nordic regions positive changes in accessibility do not generate positive effects in GDP. This phenomenon is explained by the fact that the very high accessibility gains of a number of other European regions give these success-ful regions a comparative advantage that negatively affects regional economic develop-ment in less successful regions in this zero-sum game. 3.3 Scenario Implications for Cohesion One fundamental aim of establishing and developing TEN-T projects is "to contribute to important objectives of the Community such as the good functioning of the internal market and the strengthening of the economic and social cohesion" (European Commu-nities, 1996). Assessing the actual contribution of the TEN-T projects to this aim is not a straightforward task in the presence of a variety of possible aspects, indicators and methodologies. Figure 7 (left) shows coefficients of variation for accessibility from 1981 to 2016. The coefficient of variation indicates the dispersion of a set of data as a proportion of their average in percent. In this diagram the axis covers the range from 48 to 58 percent. There is a significant reduction of the coefficient of variation of about four percent in 2016 for the TEN scenarios, with the full TEN Scenario (10) showing slightly less variation than the Rail TEN Scenario (20). It is clearly visible that reductions in the co-efficient of variation increase steadily over time until the end of the forecast period. This pattern further indicates a mild convergence effect of the TEN-T.
Figure 7. Scenarios 00, 10 and 20, coefficient of variation for 1981-2016, for accessi-bility (left) and GDP/capita (right). Figure 7 (right) shows coefficients of variation for GDP per capita from 1981 to 2016. The scale of the vertical axis is not identical to the previous one. In this diagram the axis covers the range from 20 to 45 percent. A slight reduction of the coefficient of variation until 2016 for the TEN Scenario (10) and the Rail TEN Scenario (20) can be observed. The previously reported moderate convergence effect of the TEN scenarios compared to the Do-Nothing Scenario (00) is also visible here albeit somewhat smaller than with accessibility. However, the TEN scenarios cannot reverse the trend of polarised devel-opment as indicated by the coefficient of variation curve for the Do-Nothing Scenario

Trans-European Transport Networks and Regional Economic Development
14
(00): the convergence effect of the TEN scenarios is much smaller than the polarisation trend of all three scenarios over time. 4. Conclusions The SASI model differs from other approaches to modelling the impacts of transport on regional development by modelling not only regional production (the demand side of regional labour markets), but also regional population (the supply side of regional la-bour markets). This makes the model capable of predicting regional unemployment. As full employment is one of the major policy objectives of the EU, this is an important advantage. A second advantage of the model is its comprehensive geographical coverage, as it cov-ers all regions of the fifteen EU member states at the NUTS-2 level. This makes the model especially suited to model spatial redistribution effects of the TEN-T within the EU. Accordingly, this distribution effects are major focus of the model. Although in principle it would be possible to model aggregate macroeconomic multiplier effects of transport investments, this is not presently done because of the many factors and uncer-tainties of global economic developments that would have to be considered. Therefore all model results are constrained by exogenous forecasts of economic development, immigration and outmigration of the European Union as a whole. A third distinct feature is its dynamic network database. The model is associated with one of the most sophisticated transport network representations available in Europe. These networks have been given a dynamic dimension by backcasting major historical network changes as far back as 1981 and forecasting expected network changes accord-ing to the most recent EU documents on the future evolution of the trans-European transport networks. A fourth unique feature of the model is the way impacts of transport infrastructure in-vestments and transport system improvements on regional production are modelled. The model uses regional production functions in which transport infrastructure is repre-sented by accessibility measured by sophisticated spatially disaggregate accessibility indicators. A fifth significant feature is its flexibility in incorporating 'soft' non-transport factors of regional economic development beyond the economic factors traditionally included in regional production functions. These indicators describe the spatial organisation of the region, i.e. its settlement structure and internal transport system, institutions of higher education, cultural facilities, good housing and a pleasant climate and environment. A sixth important characteristic of the model is its dynamic character. Regional socio-economic development is determined by interacting processes with a vast range of dif-ferent dynamics. Whereas changes of accessibility due to transport infrastructure in-vestments and transport system improvements become effective immediately, their im-pacts on regional production are felt only two or three years later as newly located in-dustries start operation. Regional productivity and labour force participation are affected even more slowly. The sectoral composition of the economy and the age structure of the population change only in the course of many years. A model that is to capture these

Trans-European Transport Networks and Regional Economic Development
15
dynamics cannot be an equilibrium model but has to proceed in time increments shorter than the time lags of interest. Important for the policy relevance of the model are the cohesion indicators calculated. As the model predicts accessibility, GDP per capita and unemployment of each region for each year of the simulation, it can also calculate cohesion indicators measuring the convergence (or divergence) of these indicators in the regions over time. These meas-ures indicate whether transport infrastructure investments or transport system improve-ments contribute to the achievement of the cohesion goals of the Union or whether they tend to reinforce the existing disparities between rich and poor regions. A final property of the model are its relatively moderate data requirements. The model does not require a highly disaggregate classification of industries nor an input-output table. The population and migration model works with minimum input data such as five-year age groups and net migration. The data requirements for calibrating the model are also moderate because many model equations are validated against a long period of the past. Compared with these significant advantages of the modelling approach, the model has only few limitations. As total economic development and immigration and outmigration across the European Union's outer borders are exogenous, it does not predict the macro-economic multiplier effects of transport infrastructure investments and transport system improvements, such as elasticity of demand. Direct effects of transport infrastructure investment during the construction period are not considered. Labour productivity is linked to changes of accessibility but not to other factors in the production function, so no substitution between factors is modelled. The migration model based on net migra-tion is simplistic as is the labour force participation model, which may affect the valid-ity of the unemployment forecasts. Finally, as the model does not contain a full trans-port submodel, it cannot take account of network congestion or intermodality. In the follow-up project IASON (Integrated Appraisal of Spatial Economic and Net-work Effects of Transport Investments and Policies) some of these limitations will be overcome. The IASON project, which is part of the 5th Research and Technology De-velopment Framework Programme of the European Union, will extend and update the SASI model in several dimensions. Model theory - New ideas from growth theory as well as new evidence on firm location will be re-
viewed and transformed into operational indicators of locational advantage and incor-porated into the econometric approach.
- Rates v. levels. Traditional production function approaches relate the level of output to the level of infrastructure. New growth theory suggests that a link might also exist be-tween the level of infrastructure and the rate of growth, because good accessibility means good access to diversity making research and development more productive.
- Productivity. The feasibility of forecasting regional sectoral labour productivity endogenously as a function of accessibility and other variables instead of using exoge-nous productivity forecasts will be explored.

Trans-European Transport Networks and Regional Economic Development
16
- Accessibility. In the accessibility calculations, not only travel time but also transport costs will be considered. The possibility to explicitly consider wage levels and produc-tion costs of potential suppliers in other regions will be examined.
- Migration. It is planned to forecast migration flows as a function of regional unem-ployment and other indicators expressing the attractiveness of a region as a place of employment and a place to live instead of the present net migration.
Model data - Disaggregation. The existing SASI model database is presently being disaggregated
from 201 NUTS-2 regions to 1,083 NUTS-3 regions in the present 15 EU states.
- Economic sectors: The model is being extended to include six economic sectors in-stead of the previous three (manufactured products; market services; agriculture, for-estry and fishery products; fuel and power products; building and construction; non-market services).
- Candidate countries. A similar model database for the 162 regions in the 12 countries in Eastern Europe considered as candidates for an expansion of the European Union will be established.
In addition, the results of the extended SASI model will be compared with those of an-other regional economic model, the CGEurope model developed by Bröcker at the Uni-versity of Kiel (Bröcker, 1995; 1996; 1998). The CGEurope model is a state-of-the-art spatial computable general equilibrium model taking into account production cost dif-ferences between regions and interregional trade flows. The two models will be devel-oped in parallel using a common spatial database and the same road, rail, inland water-way and air networks to ensure the greatest possible degree of comparability.
REFERENCES Bröcker, J. (1995): Chamberlinian spatial CGEmodelling: a theoretical framework. Eco-
nomic Systems Research 7, 137-149.
Bröcker, J. (1996): Measuring accessibility in a general equilibrium framework. Paper presented at the 5th World Congress of the RSAI, 2-6 May 1996.
Bröcker, J. (1998): Operational spatial computable general equilibrium modelling. Annals of Regional Science 32, 367-387.
European Commission (1998): Tran European Transportation Network. Report on the Implementation of the Guidelines. Basic Data on the Networks. Report to the Euro-pean Parliament, the Council, the Economic and Social Committee and the Committee of the Regions on the implementation of the guidelines for the development of the trans-European transport network (Decision 1692/96/EC).
European Communities (1995): Trans-European Transport Network Outline Plan. Lux-embourg: Office for Official Publications of the European Communities.
European Communities (1996): Decision No. 1692/96/CE of the European Parliament and of the Council of 23 July 1996 on the Community guidelines for the development of the

Trans-European Transport Networks and Regional Economic Development
17
trans-European transport networks. Official Journal of the European Communities 39, September 1996, 1-104.
Fürst, F., Hackl, R., Holl, A., Kramar, H., Schürmann, C., Spiekermann, K., Wegener, M. (1999): The SASI Model: Model Implementation. SASI Deliverable D11. Report to the European Commission. Berichte aus dem Institut für Raumplanung 49. Dortmund: Institute of Spatial Planning.
Fürst, F., Schürmann, C., Spiekermann, K., Wegener, M. (2000a): The SASI Model: Demonstration Examples. SASI Deliverable D15. Report to the European Commission. Berichte aus dem Institut für Raumplanung 51. Dortmund: Institute of Spatial Planning.
Schürmann, C., Spiekermann, K., Wegener, M. (1997): Accessibility Indicators. SASI Deliverable D5. Report to the European Commission. Berichte aus dem Institut für Raumplanung 39. Dortmund: Institute of Spatial Planning.
Spiekermann, K., Wegener, M. (1996): Trans-European Networks and Unequal Acces-sibility in Europe. EUREG - European Journal of Regional Development 4, 35-42.
Spiekermann, K., Wegener, M. (1999): Socio-economic and spatial impacts of trans-European transport networks: the SASI project. In: Meersman, H., Van de Voorde, E., Winkelmans, W. (Ed.): World Transport Research. Vol. 4. Amsterdam: Elsevier.
Wegener, M., Bökemann, D. (1998): The SASI Model: Model Structure. SASI Delive-rable D8. Report to the European Commission. Berichte aus dem Institut für Raumpla-nung 40. Dortmund: Institute of Spatial Planning.