transaction costs, trade throughs, and riskless...
TRANSCRIPT
Transaction Costs, Trade Throughs, and Riskless Principal Trading in Corporate Bond Markets
Larry Harris Fred V. Keenan Chair in Finance USC Marshall School of Business
SECTION TITLE | 2
Disclaimer
• I only speak for me.
– Not Interactive Brokers or USC
But I hope that lots of people are listening!

The Issues
SECTION TITLE | 4
What Do Broker-Dealers Do?
• Most broker-dealers trade net.
– They profit on markups.
– Few broker-dealers act as pure agency brokers who profit from commissions.
• The markup on riskless principal trades (RPTs) is identical to adding on a commission.
• Broker-dealers who arrange RPTs while filling customer orders effectively act as brokers.
Pre-trade Transparency Issues
• Unlike commissions, customers do not see dealer markups before they trade.
– They can see them after the fact by examining TRACE data, but doing so is time-intensive.
• Customers generally do not see best bid and best offer prices before they trade.
– They must query multiple dealers which is prohibitive for small traders.
5
Market Structure Issues
• Most investors cannot effectively offer liquidity in these dealer markets.
– Even through electronic new order-driven venues.
– No trade-through rules protect standing orders.
– Few brokers let customers use these venues.
• Payments for order flow effectively prevent most retail customers from benefiting from innovative trading technologies.
6
The Net Result
• Small traders and many institutional traders trade at a disadvantage because they do not know market prices as well as dealers do.
• Transaction costs are high in bond markets in comparison to transaction costs in equities.
– Risk considerations suggest the opposite.
• Greater pre-trade transparency makes trading bonds in Europe cheaper than in the US.
7
My Study
What I Did
I compared 3 million TRACE trades to about 464 million contemporaneous quotes from electronic venues to
• Measure transaction costs,
• Identify trade throughs, and
• Determine which trade throughs are RPTs.
9
Quote Data from Interactive Brokers
• Interactive Brokers provided me with a record of the best bids and offers that it saw in 17,000+ corporate bonds between December 15, 2014 and April 15, 2015.
• IB consolidated the best bids and offers reported by several electronic market centers including BondPoint.
• Similar data have never been analyzed before.
10
Main Empirical Results
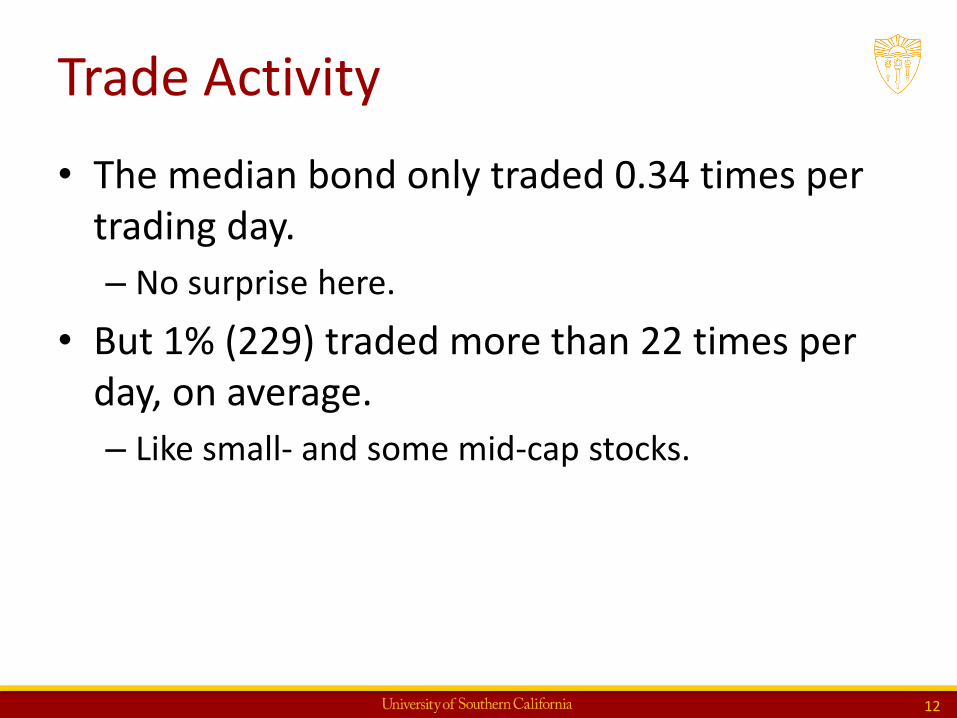
Trade Activity
• The median bond only traded 0.34 times per trading day.
– No surprise here.
• But 1% (229) traded more than 22 times per day, on average.
– Like small- and some mid-cap stocks.
12
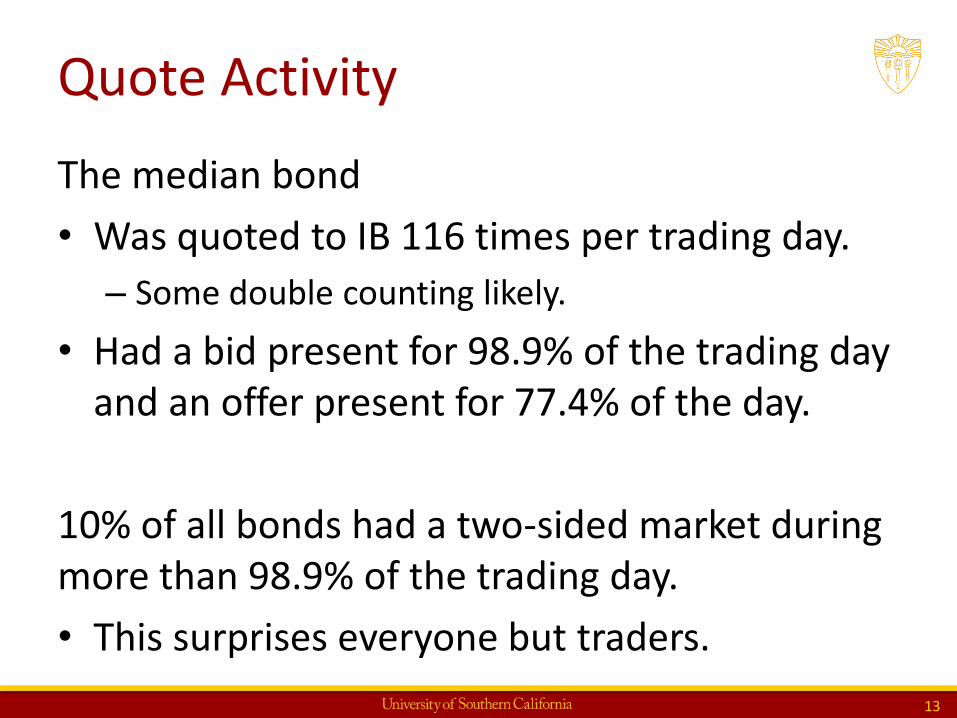
Quote Activity
The median bond
• Was quoted to IB 116 times per trading day.
– Some double counting likely.
• Had a bid present for 98.9% of the trading day and an offer present for 77.4% of the day.
10% of all bonds had a two-sided market during more than 98.9% of the trading day.
• This surprises everyone but traders.
13
Transaction Costs
• The average customer roundtrip transaction cost was 125 bp, or about 4 months interest for a 4% bond.
– Equivalent to 50¢/share for a $40 stock!
• Costs are smaller for bigger trades.
• Recent results from the NY Fed using cruder (but reliable) methods show that these costs have been declining.
– See its Liberty Street Blog.
14
Trade Through Frequencies
• 47% of all trades trade through a standing quote when a two-sided quote was standing 2 seconds or more.
– The 2-second restriction ensures that the quote was available to the trader.
– It does not affect the results much.
• Many trade-throughs are due to net pricing.
– But the price dis-improvement is much greater than normal commissions.
– 77 bp for the 30.5% with dis-improvement > 10 bp
15
RPT Identification Method
• Using TRACE data only, I found all adjacent trade reports with the same size.
• A potential RPT is an adjacent pair involving
– A customer trade and an interdealer trade, or
– Two customer trades on opposite sides.
• I do not double count trades.
16
Riskless Principal Trades
• 42% of all trades are potential RPT pairs for which the time between trades is less than 1 minute.
• Less than 2 seconds separate the trades in 73% of the potential RPT pairs.
17
RPTs Markups
• 46% of all RPT pairs have no markup.
– Agency trades by Interactive Brokers and others.
• The average markup for non-zero RPTs is 54 bp.
• Markups are greatest for retail trades, which are most common.
• The total markup value is $667M for the year ended March 31, 2015.
18
Trade Throughs by RPT status
• 32% of all trade throughs are also non-zero-markup RPTs.
• For these trades, the median difference between the markup and the price (dis-)improvement is zero.
• The correlation between the markup and the price (dis-)improvement is -86%!
19
Full Year Projections
For the year ended March 31, 2015,
• Total customer bond transaction costs were $26B.
– Investors paid these costs (plus some exchange fees) for bond liquidity.
• Total trade-through value is about $700M based on reported quotation sizes.
20
Policy Recommendations
Greater Pre-Trade Transparency
• At a minimum, the FINRA should require that brokers disclose their RPT markup rates on a pre-trade basis, and certainly always post-trade.
– FINRA and MSRB currently propose post-trade disclosure.
• Bond markets would benefit greatly from having a NBBO (National Best Bid or Offer) facility.
22
Better Market Structure
• The SEC should consider enacting a trade through rule for bonds.
– Before class action attorneys create a Manning Rule for bonds.
• Requiring brokers to post limit orders of willing customers to order display facilities (ODFs) that widely disseminate these prices also would prevent many trade throughs.
23
More about ODFs
• Competition improves prices.
– Any investor could effectively offer liquidity in an ODF.
– National exposure of customer orders would allow any dealer or buy-side trader to fill these orders.
• Similar order handling rules in the equity markets vastly improved those markets.
– Consider the evolution of NASDAQ.
24
The Dealer Response to ODFs
Western Civilization as we know it will end!
25
The Dealer Argument
• Dealer profits will fall.
• Dealers will withdraw.
• Liquidity and markets will dry up.
• Issuer funding costs will skyrocket.
26
The Truth About ODFs
• The existence of one or more ODFs whose prices constrain trades will indeed decrease dealer profits, and they will withdraw.
• But only because buy-side traders will be able to effectively offer liquidity to each other.
• Cutting out the middleman saves costs.
• Volumes will increase as liquidity increases.
• Funding costs will decline.
27
Can We Live with Fewer Dealers?
• Yes, if they are displaced because other traders provide their services at lower costs.
• What about during market crises?
– Markets always exist at some price.
– In extremis, most dealers disappear anyway.
• Electronic dealers who provide better service at lower cost will replace traditional dealers.
– The large number of issues ensures that dealers always will be important in bond markets.
28

Poster in Dinosaur Dealer’s Office
29
Larry Harris
Conclusion
30
The Long-View Perspective
• Bond markets are increasingly electronic.
– Spreads are narrowing
– But markups remain high.
• Small changes by FINRA, MSRB, and SEC can push bond markets into the 21st Century.
31
What If We Don’t Regulate?
• Sophisticated institutions will demand more and better access to ATSs like BondPoint.
• Interactive Brokers will continue to vacuum up sophisticated retail and institutional clients.
• Someone will publish a private NBBO, but most brokers will not make it available to most of their clients.
• Most retail clients will continue to trade as they do.
32
Why Regulate?
• Dealers won’t support pre-trade transparency.
– They make more money in opaque markets.
• Brokers won’t support ODFs unless required.
– They get too much payment for order flow.
• But investors will benefit, and they will pay more for their bonds when first issued.
• Class action attorneys may step in.
33
A Telling Observation
• Exchange-listed bond trading was quite liquid in corporate bonds before the mid 1940s and in municipal bonds before the late 1920s.
• Transaction costs then were substantially lower than they are now.
– See Biais and Green (2007).
34
Another Telling Observation
• Practitioners recognize that bonds represent interest risk plus some credit risk.
• Pure interest risk trades in highly liquid and transparent Treasury and futures markets.
• Pure corporate credit risk trades in highly liquid and transparent stock markets.
• Why should the combination trade in opaque markets?
35
A Final Observation
• Greater pre-trade transparency makes trading bonds in Europe cheaper than in the US.
– International Index Company disseminates indicative quote indices from many dealers on an intraday basis every minute for every bond in the iBoxx universe.
– See Biais and Declerck (2013).
• But they also have long way to go.
36
Q and A
37