transactional memory (tm) has become increasingly popular
TRANSCRIPT

Abstract of “Debugging and Profiling of Transactional Programs” by Yossi Lev, Ph.D., Brown Uni-
versity, May 2010.
Transactional memory (TM) has become increasingly popular in recent years as a
promising programming paradigm for writing correct and scalable concurrent pro-
grams. Despite its popularity, there has been very little work on how to debug and
profile transactional programs. This dissertation addresses this situation by exploring
the debugging and profiling needs of transactional programs, explaining how the tools
should change to support these needs, and describing a preliminary implementation
of infrastructure to support this change.
Debugging and Profiling of Transactional Programs
by
Yossi Lev
B. Sc., Tel Aviv University, Israel, 1999
M. Sc., Tel Aviv University, Israel, 2004
M. S., Brown University, Providence, RI, USA, 2004
A dissertation submitted in partial fulfillment of the
requirements for the Degree of Doctor of Philosophy
in the Department of Computer Science at Brown University
Providence, Rhode Island
May 2010
c© Copyright 2010 by Yossi Lev

This dissertation by Yossi Lev is accepted in its present form by
the Department of Computer Science as satisfying the dissertation requirement
for the degree of Doctor of Philosophy.
DateMaurice Herlihy, Director
Recommended to the Graduate Council
DateMark Moir, Reader
DateJohn Jannotti, Reader
Approved by the Graduate Council
Date
Dean of the Graduate School
iii

Vitae
Contact information
Yossi Lev
736 W 187th st
New York, NY 10033
(617) 276-5617
http://www.cs.brown.edu/people/levyossi/
Research Interests
Concurrent Programming
Parallel Algorithms
Transactional Memory
Concurrent Datastructures
Architectural Support
Place of Birth
Israel.
iv

Education:
2004 - 2010 Brown University, Providence, RI, USA
PhD in Computer Science
Advisor: Prof. Maurice Herlihy
Thesis: Debugging and Profiling of Transactional Programs
2001 - 2004 Tel-Aviv University, Tel-Aviv, Israel
MSc in Computer Science, magna cum laude
Advisor: Prof. Nir Shavit
Thesis: A Dynamic-Sized Non-Blocking Work-Stealing Deque
1995 - 1999 Tel-Aviv University, Tel-Aviv, Israel
BSc in Mathematics & Computer Science
Awards and Honors
• Best Paper Award, PPoPP 2008
Publications: Refereed Conferences and Workshops
(Authors ordered alphabetically)
1. Maurice Herlihy and Yossi Lev,
“tm db: A Generic Debugging Library for Transactional Programs”
PACT 2009
2. Yossi Lev, Victor Luchangco and Marek Olszewski,
“Scalable Reader-Writer Locks”
SPAA 2009
3. Yossi Lev, Victor Luchangco, Virendra Marathe, Mark Moir, Dan Nussbaum and Marek
v
Olszewski,
“Anatomy of a Scalable Software Transactional Memory”
TRANSACT 2009
4. Dave Dice, Yossi Lev, Mark Moir and Dan Nussbaum,
“Early Experience with a Commercial Hardware Transactional Memory Implementation”
ASPLOS 2009
5. Yossi Lev and Jan-Willem Maessen,
“Split Hardware Transactions: True Nesting of Transactions Using Best-Effort Hardware
Transactional Memory”
Best paper award in PPoPP 2008
6. Dave Dice, Maurice Herlihy, Doug Lea, Yossi Lev, Victor Luchangco, Wayne Mesard, Mark
Moir, Kevin Moore and Dan Nussbaum,
“Applications of the Adaptive Transactional Memory Test Platform”
TRANSACT 2008
7. Faith Ellen, Yossi Lev, Victor Luchangco, and Mark Moir,
“SNZI: Scalable Non-Zero Indicators”
PODC 2007
8. Lawrence Crowl, Yossi Lev, Victor Luchangco, Mark Moir, and Dan Nussbaum,
“Integrating Transactional Memory into C++”
TRANSACT 2007
9. Yossi Lev, Mark Moir, and Dan Nussbaum,
“PhTM: Phased Transactional Memory”
TRANSACT 2007
vi

10. Maurice Herlihy, Yossi Lev, Victor Luchangco, Nir Shavit,
“A Simple Optimistic Skip-List Algorithm”
SIROCCO 2007 (also a brief announcement in OPODIS 2006)
11. Peter Damron, Alexandra Fedorova, Yossi Lev, Victor Luchangco, Mark Moir, and Dan
Nussbaum,
“Hybrid Transactional Memory”
ASPLOS 2006
12. Yossi Lev and Mark Moir,
“Debugging with Transactional Memory”
TRANSACT 2006
13. Yossi Lev and Jan-Willem Maessen,
“Towards a Safer Interaction with Transactional Memory”
SCOOL 2005
14. David Chase and Yossi Lev,
“Dynamic Circular Work-Stealing Deque”
SPAA 2005
15. Danny Hendler, Yossi Lev and Nir Shavit,
“Dynamic Memory ABP Work-Stealing”
DISC 2004
Invitation to contribute to a special issue
Publications: Journals
1. Danny Hendler, Yossi Lev, Mark Moir and Nir Shavit,
Special Issue of DISC 2004: “A Dynamic-Sized Nonblocking Workstealing Deque”
vii

Distributed Computing 2006
Publications: Technical Reports
1. David Dice, Yossi Lev, Mark Moir, Daniel Nussbaum and Marek Olszewski,
“Early Experience with a Commercial Hardware Transactional Memory Implementation”
TR-2009-180, Sun Microsystems, October 2009
2. Danny Hendler, Yossi Lev, Mark Moir and Nir Shavit,
“A Dynamic-Sized Nonblocking Work Stealing Deque”
TR-2005-144, Sun Microsystems, November 2005
Publications: Posters
1. Yossi Lev and Mark Moir,
“Fast Read Sharing Mechanism For Software Transactional Memory”
PODC 2005
Professional Service
External Reviewer for:
• ACM Transactions on Computer Systems (TOCS)
• ACM Symposium on Parallelism in Algorithms and Architectures (SPAA)
• ACM SIGPLAN Workshop on Transactional Computing (Transact)
• ACM SIGACT-SIGOPS Symposium on Principles of Distributed Computing (PODC)
• (Sub-review) International Conference on Compiler Construction (ETAPS CC)
• ACM Transactions on Computer Systems (TOCS)
viii

Research Experience
• Research Assistant,
Brown University,
Fall 2004 - present
• Intern,
Scalable Synchronization Research Group, Sun Microsystems Laboratories,
Jan 2004 - present
Research areas include: concurrent datastructures, design and development of software and hybrid
transactional memory runtimes, integration of transactional memory in programming languages,
debugging and profiling of transactional programs.
Teaching Experience
Teaching Assistant, Department of Computer Science, Brown University
• CS176: Introduction to Multiprocessor Synchronization (Fall 2005)
• CS176: Introduction to Multiprocessor Synchronization (Fall 2006)
Other Employment
• Software Engineer
Seabridge
Israel, September 1999 - April 2003
Work areas include: design and implementation of embedded code for communication switches,
multithreaded programming, embedded operating systems.
ix

Acknowledgements
Many people have contributed to making my PhD studies such a great journey, and I am thankful to
all of them. First and foremost I would like to thank my advisor, Maruice Herlihy, for his tremendous
help throughout my PhD. Maurice, the “voice of reason” — thank you for always finding the time to
meet and contribute from your great wisdom and broad knowledge, for your infinite patience when
teaching me to identify and focus on the main ideas, and for showing me what great writing is!
I would also like to thank Mark Moir, the Principal Investigator in the “Scalable Synchronization
Research Group” (SSRG) in Sun Labs, and also a member in my committee. Mark — you helped
in so many ways that I cannot even imagine how these years would have been without you. We
conceived together the core ideas of “transactional debugging”, which then became the basis of my
dissertation; you taught me how to reason about the correctness of concurrent algorithms, and how
to put this reasoning into correctness proofs; you were constantly fighting to bring my stress level
down, serving as a role model for “take it easy and do the right thing”; and you brought me into the
SSRG group, that played a great role influencing my research experience. Thank you for everything;
I will always be indebted.
My six years long internship in the SSRG group during my PhD was an infinite source of inspira-
tion and support. Frequent discussions with this incredible group of individuals — Dan Nussbaum,
Dave Dice, Nir Shavit, Victor Luchangco, Virendra Marathe — provided great guidance, and ex-
panded my research in directions that I wouldn’t be visiting otherwise. I am especially thankful to
x

Dan Nussbaum for his constant help when working with the SkySTM library, and for making open
sourcing of my work possible, and to Nir Shavit, for introducing me to the group in the first place.
There are many other people at Sun Microsystems that I am thankful to. Co-authoring papers
with Jan Maessen and David Chase, from the Programming Languages Research Group, was a
fantastic experience, which exposed me to new aspects of the work on concurrent algorithms. I am
also thankful to Steve Heller, my manager, for his tireless efforts to make my life as an intern easier
and more enjoyable. I would like to thank Chris Quenelle, Ivan Soleimanipour, and Isaac Chen, who
provided valuable advice on how to make my work useful for real commercial debuggers, and put
great effort into integrating it with the Sun Studio debugger, making it available to the public. And
finally, I am thankful to the many people that gave constant advice on using various Sun’s tools,
like DTrace and Chime — via emails, Internet blogs, on the phone, and even in person.
I would like to thank the faculty and staff from Brown University, for everything that they
taught me, and for their flexibility working with a student living remotely. I am especially thankful
to Shriram Krishnamurthi for all that he taught me about compilers and programming languages,
and to his great advice at my PhD proposal; to John Jannotti for joining my PhD committee and
supporting my work; and to Dawn Reed, Ayanna Torrey, and Lauren Clarke, for the infinite support
that saved me so many trips to Providence.
My friends and rock climbing partners — Dooly, Sharona, Moshe, Ran, Edya, Shay, Dana, Zachi,
Bill, Michelle, Maya, Laura, Sophie and Lori — you have always been a great fun, and a boundless
source of help and support.
My family, while geographically far, have supported me immeasurably along the way. From long
trans-Atlantic phone calls to joint trips to the Caribbean islands, my mother Etti, my father Shaul
and my three sisters Maya, Shani and Adi, were a constant reminder for the love and support that
I am so fortunate to have. I greatly appreciate the support of my family-in-law — Zippi, Micha,
Galia and Idit — and the home-away-from-home that family members living in Boston gave us.
I know it may sound a bit strange to thank a city, but I cannot do an honest job in writing
xi

this acknowledgements section without thanking the city of Cambridge. With its unique academic
atmosphere, diverse and open-minded population, and the coffee shops full of studious people with
laptops, it was simply the perfect environment for me to enter the world of scientific research. Special
thanks go to Darwin’s LTD cafe and its lovely staff, where so much of my research was conducted!
Last but definitely not least, I wish to thank my wife, Einat(ush), without whom I wouldn’t
have even started this PhD, let alone finished it. Einat, my love, there is no way I could have done
this without you. Thank you so much for being there for me, and for putting up with me in all the
difficult times!
xii
Contents
List of Figures xvi
1 Introduction 1
1.1 Background . . . . . . . . . . . . . . . . . . . . . . . . . . . . . . . . . . . . . . . . . 1
1.2 Debugging and Profiling Transactional Programs . . . . . . . . . . . . . . . . . . . . 4
1.3 Outline . . . . . . . . . . . . . . . . . . . . . . . . . . . . . . . . . . . . . . . . . . . 7
1.4 Related Work . . . . . . . . . . . . . . . . . . . . . . . . . . . . . . . . . . . . . . . . 9
2 Debugging Transactional Programs 11
2.1 Introduction . . . . . . . . . . . . . . . . . . . . . . . . . . . . . . . . . . . . . . . . . 12
2.2 A Word-Based HyTM Scheme . . . . . . . . . . . . . . . . . . . . . . . . . . . . . . . 13
2.2.1 Overview . . . . . . . . . . . . . . . . . . . . . . . . . . . . . . . . . . . . . . 13
2.2.2 Transactional Execution . . . . . . . . . . . . . . . . . . . . . . . . . . . . . . 15
2.2.3 Ownership . . . . . . . . . . . . . . . . . . . . . . . . . . . . . . . . . . . . . 15
2.2.4 Atomicity . . . . . . . . . . . . . . . . . . . . . . . . . . . . . . . . . . . . . . 16
2.3 Debug Modes and Terminology . . . . . . . . . . . . . . . . . . . . . . . . . . . . . . 17
2.4 Debugging Techniques . . . . . . . . . . . . . . . . . . . . . . . . . . . . . . . . . . . 18
2.4.1 Breakpoints in Atomic Blocks . . . . . . . . . . . . . . . . . . . . . . . . . . . 18
2.4.2 Viewing and Modifying Variables . . . . . . . . . . . . . . . . . . . . . . . . . 23
xiii
2.4.3 Atomic Snapshots . . . . . . . . . . . . . . . . . . . . . . . . . . . . . . . . . 27
2.4.4 Watchpoints . . . . . . . . . . . . . . . . . . . . . . . . . . . . . . . . . . . . 28
2.4.5 Delayed Breakpoints . . . . . . . . . . . . . . . . . . . . . . . . . . . . . . . . 33
2.4.6 Replay Debugging for Atomic Blocks . . . . . . . . . . . . . . . . . . . . . . . 35
2.5 Summary . . . . . . . . . . . . . . . . . . . . . . . . . . . . . . . . . . . . . . . . . . 38
3 Practical Transactional Debugging Support: The TMDB library 39
3.1 Introduction . . . . . . . . . . . . . . . . . . . . . . . . . . . . . . . . . . . . . . . . . 40
3.2 Debugging Transactional Programs . . . . . . . . . . . . . . . . . . . . . . . . . . . . 41
3.2.1 Logical Values . . . . . . . . . . . . . . . . . . . . . . . . . . . . . . . . . . . 41
3.2.2 Transaction Identity . . . . . . . . . . . . . . . . . . . . . . . . . . . . . . . . 42
3.2.3 Transaction Status . . . . . . . . . . . . . . . . . . . . . . . . . . . . . . . . . 43
3.2.4 Read, Writes, Conflicts, and Coverage . . . . . . . . . . . . . . . . . . . . . . 45
3.2.5 Usage Example: Viewing Data . . . . . . . . . . . . . . . . . . . . . . . . . . 49
3.2.6 Transactional Events . . . . . . . . . . . . . . . . . . . . . . . . . . . . . . . . 51
3.2.7 Scopes . . . . . . . . . . . . . . . . . . . . . . . . . . . . . . . . . . . . . . . . 52
3.3 Debugging Infrastructure Design . . . . . . . . . . . . . . . . . . . . . . . . . . . . . 54
3.3.1 Overview . . . . . . . . . . . . . . . . . . . . . . . . . . . . . . . . . . . . . . 54
3.3.2 Design . . . . . . . . . . . . . . . . . . . . . . . . . . . . . . . . . . . . . . . . 54
3.3.3 Supporting Partial Functionality . . . . . . . . . . . . . . . . . . . . . . . . . 57
3.3.4 The Import Interface . . . . . . . . . . . . . . . . . . . . . . . . . . . . . . . . 58
3.4 Debugging support for an STM runtime . . . . . . . . . . . . . . . . . . . . . . . . . 59
3.4.1 Overview . . . . . . . . . . . . . . . . . . . . . . . . . . . . . . . . . . . . . . 59
3.4.2 Computing Logical Values . . . . . . . . . . . . . . . . . . . . . . . . . . . . 60
3.4.3 Monitoring Events . . . . . . . . . . . . . . . . . . . . . . . . . . . . . . . . . 61
3.5 Concluding Remarks . . . . . . . . . . . . . . . . . . . . . . . . . . . . . . . . . . . . 61
xiv

4 T-PASS: A Profiler for Transactional Programs 65
4.1 Introduction . . . . . . . . . . . . . . . . . . . . . . . . . . . . . . . . . . . . . . . . . 66
4.2 Basic Concepts and Terminology . . . . . . . . . . . . . . . . . . . . . . . . . . . . . 69
4.3 What to Profile . . . . . . . . . . . . . . . . . . . . . . . . . . . . . . . . . . . . . . . 71
4.3.1 Basic Characteristics . . . . . . . . . . . . . . . . . . . . . . . . . . . . . . . . 71
4.3.2 Contention Profiling . . . . . . . . . . . . . . . . . . . . . . . . . . . . . . . . 75
4.3.3 Conflicts Analysis . . . . . . . . . . . . . . . . . . . . . . . . . . . . . . . . . 78
4.3.4 Identifying Special Accesses . . . . . . . . . . . . . . . . . . . . . . . . . . . . 83
4.3.5 Discussion . . . . . . . . . . . . . . . . . . . . . . . . . . . . . . . . . . . . . . 87
4.4 The T-PASS System Design . . . . . . . . . . . . . . . . . . . . . . . . . . . . . . . . 88
4.4.1 Reducing Overhead . . . . . . . . . . . . . . . . . . . . . . . . . . . . . . . . 90
4.4.2 Extendability . . . . . . . . . . . . . . . . . . . . . . . . . . . . . . . . . . . . 91
4.5 Debugger Integration . . . . . . . . . . . . . . . . . . . . . . . . . . . . . . . . . . . . 92
4.5.1 Replay Debugging . . . . . . . . . . . . . . . . . . . . . . . . . . . . . . . . . 93
4.6 Discussion . . . . . . . . . . . . . . . . . . . . . . . . . . . . . . . . . . . . . . . . . . 95
5 Conclusions 97
5.1 Open Source . . . . . . . . . . . . . . . . . . . . . . . . . . . . . . . . . . . . . . . . 99
Bibliography 101
xv
List of Figures
2.1 An example of an atomic block and its STM-based implementation. . . . . . . . . . 19
3.1 Transactions Ids, Statuses, and Atomic blocks. . . . . . . . . . . . . . . . . . . . . . 43
3.2 Coverage for a given variable . . . . . . . . . . . . . . . . . . . . . . . . . . . . . . . 46
3.3 Full conflicts report . . . . . . . . . . . . . . . . . . . . . . . . . . . . . . . . . . . . . 47
3.4 Transactional Events . . . . . . . . . . . . . . . . . . . . . . . . . . . . . . . . . . . . 51
3.5 Debugging with tm db . . . . . . . . . . . . . . . . . . . . . . . . . . . . . . . . . . . 55
4.1 Number of executions and total time for atomic blocks . . . . . . . . . . . . . . . . . 71
4.2 Distribution of transaction sizes . . . . . . . . . . . . . . . . . . . . . . . . . . . . . . 72
4.3 Distribution of transaction sizes filtered for an individual atomic block . . . . . . . . 73
4.4 Distribution of transactions’ execution times . . . . . . . . . . . . . . . . . . . . . . . 74
4.5 Contention Profiling . . . . . . . . . . . . . . . . . . . . . . . . . . . . . . . . . . . . 76
4.6 Overhead distribution filtered for transactions with two trials . . . . . . . . . . . . . 77
4.7 Number of conflicts and their costs for each conflict set. . . . . . . . . . . . . . . . . 79
4.8 Instruction conflict losses and wins (left), and conflict costs by instruction (right). . 79
4.9 Contention management information. . . . . . . . . . . . . . . . . . . . . . . . . . . . 82
4.10 Output of write-upgrades analysis . . . . . . . . . . . . . . . . . . . . . . . . . . . . 85
4.11 The T-PASS system design . . . . . . . . . . . . . . . . . . . . . . . . . . . . . . . . 89
xvi

Chapter 1
Introduction
This dissertation discusses the topic of debugging and profiling of transactional programs: that
is, programs that use transactional memory (TM) for concurrency control. Transactional memory
has become increasingly popular in recent years as a promising programming paradigm for writing
correct and scalable concurrent programs. Despite its popularity, and the availability of several STM
runtimes and compilers for transactional programs that use them, there has been very little work on
how transactional programs can be debugged and profiled. This dissertation addresses this situation
by exploring the debugging and performance profiling needs of transactional programs, explaining
how the tools can change to support these needs, and implementing preliminary infrastructure to
support this change.
1.1 Background
In concurrent software it is often important to guarantee that one thread cannot observe partial
results of an operation being executed by another thread. These guarantees are necessary for prac-
tical and productive software development because, without them, it is extremely difficult to reason
about the interactions of concurrent threads. In today’s software practice, these guarantees are
1

2
almost always provided by using locks to prevent other threads from accessing the data affected by
an ongoing operation. Such use of locks gives rise to a number of well known problems, both in
terms of software engineering and in terms of performance.
When using locks, it is the programmer’s responsibility to follow the locking convention, making
sure that the right set of locks are held when accessing a data item, while avoiding problems such
as deadlocks and livelocks. Doing so by using a single lock to protect all shared data may not be
difficult, but the resulting program will often not scale well, because accesses to all shared data
will be serialized by that lock. On the other hand, using a more fine grained locking scheme may
improve the program’s scalability, but will often result in more complex, error-prone code that is
more difficult to maintain.
Another problem with code that uses locks is that it does not compose well. When methods
use locks to protect the data that they access, it is often impossible to build a new method using
an existing one without understanding how the existing method is implemented. As an example,
consider having a deposit and withdraw methods, that update the balance of a bank account. The
update to the account’s balance by these methods is done atomically, as if it is executed with no
interference from other threads. In other words, each method guarantees, for example by holding a
lock, that no other thread is updating balance between the time it reads balance, and the time it
writes it with the new value; without this guarantee, updates to balance by the other threads might
be lost.
Suppose now that we would now like to implement a new transfer method that atomically moves
money from one account to another. If deposit and withdraw protect the accounts they operate
on using locks, and the new transfer method simply calls withdraw and then deposit to make
the transfer, then another thread executing in between these calls may notice, for example, that the
total amount in the two accounts has changed, which may lead to an erroneous behavior. Instead,
to guarantee the atomicity of the transfer operation, the new method has to know which locks
are used to protect the accounts, and acquire them prior to executing the deposit and withdraw

3
operations. Moreover, the locks must be acquired in a particular order to avoid deadlocks that may
occur, for example, if a transfer from account A to account B is executed concurrently with a transfer
from account B to account A. The need of the caller method to know how each of the methods that
it calls is implemented is a severe problem in terms of software engineering, as it often leads to code
that is very difficult to design and maintain.
Transactional memory (TM) tries to address these problems by allowing the programmer to
specify what should be executed atomicity, without specifying how the atomicity should be achieved.
In particular, TM allows the programmer to specify code regions in atomic blocks, and the TM
runtime guarantees that each execution of such a code region seems to be atomic, as if multiple
memory locations can be accessed and/or modified in a single atomic step. Thus, TM relieves the
programmer from the burden of following a locking convention to protect the shared data these
code regions access: it is the TM runtime’s responsibility to guarantee the atomicity, and to avoid
deadlocks, livelocks and other problems that may arise in the process. Transferring the responsibility
for atomicity to the TM runtime also addresses the lack of composability of lock-based programs,
as the programmer no longer needs to understand how the atomicity of an existing method is
implemented when using it to build a new atomic operation.
To guarantee atomicity, the TM runtime executes all the memory accesses of an atomic block
in a transaction. A transaction may commit successfully, in which case all of its memory accesses
take effect atomically together at a commit point ; otherwise the transaction aborts, and none of its
accesses become visible to other threads. When a transaction aborts, the TM runtime can retry
executing the atomic block using additional transactions, until one commits successfully.
Transactions execute atomically and in isolation, implying that a transaction never sees a partial
execution of another, and that it always operates on a consistent view of the memory. Thus, a
transaction is typically aborted if a location that it read is modified before it tries to commit. The
ability to abort transactions allows the TM runtime to use an optimistic approach when running
them: two transactions can be run in parallel, and if the two conflict on a shared resource then one

4
can be aborted.
TM runtimes can be implemented in hardware (HTM) [13], with the hardware directly ensur-
ing that a transaction is atomic, or in software (STM) [33] that provides the “illusion” that the
transaction is atomic, even though it is in fact executed in smaller atomic steps by the underlying
hardware. HTM runtimes are expected to run transactions with significantly less overhead than
STM runtimes; on the other hand, most practical HTM proposals impose various limitations on the
code that a hardware transaction can execute (and still commit successfully). For this reason, some
TM runtimes use a hybrid approach [5, 24, 19], where a transaction is first tried using an HTM (if
available), and if that fails, it is executed using an STM. Such TM runtimes can take advantage of
best-effort HTM solutions [5, 25], when available, to boost the performance of an otherwise software
only solution.
1.2 Debugging and Profiling Transactional Programs
While TM promises to substantially simplify the development of correct concurrent programs, pro-
grammers will still need to debug code while it is under development, and therefore it is crucial that
we develop robust TM-compatible debugging mechanisms. In this dissertation we focus on provid-
ing debugging support for programs that use an STM runtime, but also explore how the debugging
functionality could be made to work in a hybrid environment where some transactions may execute
using HTM.
Providing debugging support for transactional programs is challenging. One of the most impor-
tant features that debuggers provide when stopping a program is the ability to view the program’s
memory and variables from the point of view of the debugged program, or more precisely, of a par-
ticular thread. This simple functionality does not follow automatically to transactional programs.
In particular, recall that an STM runtime only provides the “illusion” of atomicity, while in fact

5
the transaction’s memory accesses are executed by a series of smaller atomic steps. If we were us-
ing a regular debugger to inspect variables of a program that uses an STM runtime, the debugger
would break the illusion, confusing the user with runtime artifacts unrelated to the program being
debugged. Thus, for the debugger to provide the user with the values as seen by the transactional
program, it must interoperate with the STM runtime to provide the necessary isolation and atomicity
guarantees with respect to inspected data.
Another issue the debugger must be aware of is the different control flow of transactional pro-
grams. Recall that a transaction executing an atomic block may be aborted, in which case the
TM runtime may retry the execution using another transaction. If the debugger is used to step an
execution of an atomic block, and the transaction being stepped is aborted, retrying would result in
unexpected control flow that is unexplained by the user code. In particular, control will be trans-
ferred to the beginning of the atomic block, which may be in another function or another file than
the code in which the user was stepping. Debuggers should therefore try to prevent such scenarios
(for example by telling the TM runtime that a transaction is being stepped), or at least provide the
user with an appropriate explanation when they occur.
In addition to debugging support for transactional programs, there is also a need for profiling
tools that will help programmers understand and improve the performance of their programs. While
having TM be responsible for synchronizing accesses to shared data significantly simplifies the task
of writing correct, concurrent programs, it also hides information from the programmer that may be
crucial for performance profiling. In particular, because programmers are no longer aware of which
synchronization mechanism protects what data, it is challenging for them to detect performance
bottlenecks involving these mechanisms. The profiler should thus work with the TM runtime to
detect such bottlenecks, and present them to the programmer in a meaningful way.
Despite the need to adjust debugging and profiling tools for transactional programs, we claim
that with specialized tools, debugging and profiling of transactional programs would be easier than
debugging concurrent programs today. There are several reasons for that.

6
First, one of the main reasons that debugging concurrent programs is difficult is that the user
can no longer describe data structures using simple, sequential invariants, and methods using pre
and post conditions. Consider the problem of debugging a complex data structure, such as a red-
black tree. In a quiescent state, where no method is executing, the tree satisfies various invariants
governing how it is balanced. To debug a sequential tree implementation, one should check that
the tree satisfies its invariant when each method is called, and again when the method returns.
Naturally, a method in progress may temporarily violate the tree’s invariants.
When debugging a concurrent lock-based programs, these principles evaporate. A method call
rotating a subtree may cause keys temporarily to disappear, or to be duplicated, or the tree to
become temporarily unbalanced. In programs based on fine-grained locking, some critical section
may always be in progress, and the tree may never be entirely consistent. Halting the program while
some threads are in a critical section could reveal such anomalies, making it difficult to understand
whether the tree implementation is correct. There are too many interleavings to distinguish good
states from bad.
When debugging concurrent transactional programs, we can reclaim the sequential invariants.
Recall that transactions execute in isolation, implying that no transaction can observe another’s
partial effects. As long as the debugger preserves the isolation properties of the TM runtime, the
user should never see the partial effects of any transaction other than the one being debugged. Each
transaction “sees” a quiescent tree when it starts, and the user can check that observed departures
from the tree invariant are due to the partial effects of the transaction being debugged.
Transactional debugging has other, perhaps less-obvious advantages. Today, when a user stops a
thread at a breakpoint and steps over a function call, the Sun Studio dbx debugger [36] lets all other
threads run while the debugged thread is executing this step. Clearly, this policy makes reasoning
about program behavior more difficult, but it was found necessary to avoid deadlocks that could arise
if the function were to wait on a condition variable signaled by a concurrent thread. By contrast,
when debugging transactional code, there is no need for such a policy. If the underlying TM is

7
obstruction-free (for example, DSTM [16]), then a single-stepped transaction will always succeed
when run in isolation. Otherwise, the debugger can sometimes take advantage of the underlying TM
system to find out which transaction is blocking the debugged thread, and allow the user to either
abort it or step it to completion. Finally, if there is no way for the stepped transaction to win the
conflict, it can always be aborted. These choices are not available when the programmer is the one
responsible for the synchronization between the threads (for example by using locks).
Another advantage of the transactional model is that TM runtimes inherently track a lot of
information useful for debugging, such as transaction read and write sets, tentative versus committed
values, data conflicts, and who is waiting for whom. The debugger can present this data to the user,
or even use it internally, for example to notify the user with the reason of why a stepped transaction
was aborted.
Finally, transactional programming provides a great opportunity for profiling. Because of the
optimistic nature of transactions, the TM runtime keeps track of conflicts in a much finer granularity
than that of the atomic blocks in the program. Thus, the programmer can begin with a simple and
correct program that uses coarse grained atomicity, and successively refine it based on information
about individual conflicts in the atomic blocks of the program, and the cost that they incur. A good
profiling tool can help the programmer identify the atomic blocks that are most likely to benefit
from refinement. Furthermore, as we show, the information collected by the TM runtime can be
used to replay an execution of any individual transaction, so the profiler can present the user with
the step-by-step execution of costly transactions.
1.3 Outline
In this work we explore the debugging and profiling needs of transactional programs, describe how
debuggers and TM runtimes could be changed to provide them, and develop initial infrastructure
to support this change. Our work focuses on providing debugging and profiling support with STM

8
runtimes, but also describes how some of the features may be supported in a hybrid TM environment.
The document is organized as follows.
In Chapter 2, we explore the high level ideas behind debugging of transactional programs. We
describe the debugging features that we believe will be useful when debugging transactional pro-
grams, and explain how the debugger and the TM runtime can work together to support them. We
show that the TM infrastructure can be exploited to support all “standard” debugging capabilities
that are supported today for regular programs, as well as some new, powerful debugging features.
In Chapter 3, we focus on how transactional debugging features can be implemented in a real,
commercial debugger, which may need to support programs that use different TM runtimes, with
different STM algorithms. We describe the development of the tm db library, an external library
that helps debuggers provide some of the debugging features discussed in Chapter 2. The tm db
library provides the debugger with an interface for transactional debugging that fits well with most
STM algorithms that are in use today, thereby abstracting away the implementation details of
the particular TM runtime used by the debugged program. The library was recently integrated
with a preliminary transactional debugging extension of the Sun Studio dbx debugger. The chapter
describes the library’s functionality and the rationale for its design; in addition, it provides guidelines
for how to design TM runtimes to improve the debugability of the code that uses them.
In Chapter 4 we change the focus to profiling of transactional programs. We present T-PASS, a
prototype profiling system that we developed for this purpose. We describe the information T-PASS
provides, how it is presented to the user, and provide examples of how this information may be useful
when optimizing transactional programs both in a software only and in a hybrid TM environments.
In addition, we show how the debugger and the profiler can be combined to provide additional
information on performance bottlenecks, for example by replaying transactions that were executed
for longer than a certain period of time.
Finally, Chapter 5 includes concluding remarks, and directions for future work.

9
1.4 Related Work
Lev and Moir [23] were the first to address the topic of debugging transactional programs. In
their work, on which Chapter 2 is based, they explore what debugging capabilities are required for
transactional programs, and how debuggers can be changed to support them. Herlihy and Lev [15]
then built on top of this work and developed the tm db library, to provide commercial debuggers with
the infrastructure to support transactional debugging with various STM algorithms. This work is
presented in Chapter 3. To support profiling of transactional programs, Herlihy and Lev introduced
T-PASS [14], a prototype profiling system that we present in Chapter 4.
Despite the popularity TM has recently gained, we are aware of only very little other work on
debugging and profiling of transactional programs. Harmanci et al. [11] presented TMUnit, a system
to debug and optimize TM runtimes. Similar to tm db, TMUnit can be used with different STM
algorithms, but its focus is on debugging and testing the TM runtimes and not the transactional
programs that use them. More recently, Zyulkyarov et al. [37] presented a debugging extension for
the WinDbg debugger, developed simultaneously with tm db, to support debugging of transactional
programs that use the Bartok-STM runtime [12]. Their solution supports many of the debugging
features tm db supports, as well as the ability to detect conflicting accesses in the program. Despite
the similarities in the supported functionality, the design principles of the two solutions are quite
different because tm db is designed to work with a variety of debuggers and STM runtimes, and
hence makes less assumptions about the debugging environment in which it is used (e.g. tm db
does not assume that the debugger process can call functions in the debugged process space, or
automatically step threads out of an atomic block to avoid conflicts with the debugged thread).
Finally, debugging and profiling support for the TCC HTM system [10] and its ATLAS simulator [27]
was proposed [28, 3]. While these tools provide a wide range of debugging and profiling support, they
are specialized for one particular HTM implementation, and require additional hardware. Moreover,
because the TCC solution never runs transactions in software, much of the profiling information

10
that is relevant when using an STM or an HyTM runtime is not provided.

Chapter 2
Debugging Transactional Programs
In this chapter we take a first look at the question of how transactional programs can be debugged.
We show how basic debugging features, like placing breakpoints, stepping through the program
code, and viewing and modifying data, could be adjusted for transactional programs. In addition, we
believe that the different nature of transactional programs will give rise to new debugging techniques,
requiring additional debugging mechanisms. We present several such mechanisms, and describe how
we can use the transactional memory infrastructure to support them. Our description focuses on
how to enable debugging in software and hyrbid software-hardware transactional memory systems.
11

12
2.1 Introduction
In this chapter we explore the question of which debugging capabilities transactional programs may
require, and how debuggers can provide them.
We begin by addressing the question of how basic debugging features that are supported for
regular programs should be adjusted for transactional programs. Like with regular programs, users
will need to place breakpoints and step a transactional program. But how do we stop and step an
execution of an atomic block? If the execution consists of a series of transactions, only the last of
which is successful, do we stop in each of these transactions, or only in these that may still commit
successfully? If we step a transaction and it is then aborted due to a conflict, how do we expose
this special flow control to the user? Can we avoid these aborts by giving the stepped transaction
a higher priority over its rivals when resolving conflicts?
Similarly, the user may want to stop when a particular variable is written (or read), by placing a
watchpoint on that variable. In this case, should the debugger stop whenever a transaction accesses
the variable for writing, or only when one successfully commits a change to it?
Another fundamental debugging feature is the ability to view and modify data. As described in
Chapter 1, transactional memory only provides the programmer with the illusion of atomicity, while
in practice variables may be updated one at a time. For debuggers to interact with a transactional
program in a meaningful way, they will have to maintain this illusion, displaying the data as seen
by the debugged program (or more precisely, by the thread to which the debugger is attached). We
explore how debuggers can work alone with the TM runtime to provide users with a meaningful
view of the data.
In addition to adjusting the basic debugging features for transactional programs, the different
nature of transactional programs may encourage different kinds of debugging, which will give rise
to additional, more powerful debugging features. One of the key advantages of using transactions
is that they seem to be executed in isolation, with no interference from other transactions. This

13
property allows the user to reason about atomic blocks in terms of pre and post conditions, thinking
about the effect of an atomic block as a whole, and verifying that none breaks any of the system’s
invariants.
For this reason, a user may want to begin debugging in an inter atomic-block level, and only step
an execution of an atomic block that violates a system invariant. We present two new debugging
features to support this. The first allows the user to place a breakpoint on a statement inside an
atomic block, but to stop only if and when a transaction that executes this statement commits; the
second allows the user to replay the execution of such a transaction.
One of the key observations of this work is that the debugger can take advantage of the TM
runtime infrastructure to provide many of the debugging features with much lower overhead than
would be required for regular programs. We focus on the algorithms to provide the debugging
features with an STM runtime, but also explore how and which of these features can be provided in
a hybrid transactional memory (HyTM) system, where an execution of an atomic block may be tried
first using hardware transactions, and only if failed will be executed using software transactions. For
concreteness we describe the debugging techniques in the context of the word-based HyTM system
of Damron et. al. [5].
The rest of this chapter is organized as follows. In Section 2.2 we provide a brief overview of
the HyTM system of Damron et. at. [5]. In Section 2.3, we introduce some basic debugging modes
and terminology that will be used throughout this chapter. In Section 2.4 we describe the various
debugging techniques, and we summarize in Section 2.5.
2.2 A Word-Based HyTM Scheme
2.2.1 Overview
The HyTM system of Damron et. al. [5] comprises a compiler, a library for supporting transactions
in software, and (optionally) HTM support. Programmers express blocks of code that should (appear
14
to) be executed atomically in some language-specific notation [17]. The specific syntax that is used
is not the point of this thesis; for concreteness, we assume the following simple notation:
atomic {
...
code to be executed atomically
...
}
For each such atomic block, the compiler produces code to execute the code block atomically
using transactional support. In particular, the produced code attempts to execute the block one or
more times using HTM, and if that does not succeed, it repeatedly attempt to do so using the STM
library.
The compiler also produces “glue” code that hides this retrying from the programmer, and
invokes “contention management” mechanisms [16, 32] when necessary to facilitate progress. Such
contention management mechanisms may be implemented, for example, using special methods in
the HyTM software library. These methods may make decisions such as whether a transaction that
encounters a potential conflict with a concurrent transaction should a) abort itself, b) abort the other
transaction, or c) wait for a short time to give the other transaction an opportunity to complete.
As we will see, debuggers may need to interact with contention control mechanisms to provide a
meaningful experience for users.
Because the above-described approach may result in the concurrent execution of transactions
in hardware and in software, we must ensure correct interaction of these transactions. The HyTM
approach is to have the compiler emit additional code in the hardware transaction that looks up
structures maintained by software transactions in order to detect any potential conflict. In case
such a conflict is detected, the hardware transaction is aborted, and is subsequently retried, either
in hardware or in software. Below we explain how software transactions provide the illusion of

15
atomicity, and how hardware transactions are augmented to detect potential conflicts with software
ones.
2.2.2 Transactional Execution
As a software transaction executes, it acquires “ownership” of each memory location that it accesses:
exclusive ownership in the case of locations modified, and possibly shared ownership in the case of
locations read but not modified. This ownership cannot be revoked while the owning transaction is
in the active state: A second transaction that wishes to acquire exclusive ownership of a location
already owned by the first transaction must first cause the owner transaction to abort. This can
be done by the second transaction changing the status of the owner transaction to aborted, or by
stealing ownership from the current owner, and requiring it to later validate its accesses and find
out that it is no longer the owner of some of the locations it accessed, thus causing it to abort.
Furthermore, a location can be modified only by a transaction that owns it. However, rather than
modifying locations directly while executing, the transaction “buffers” its modifications in a “write
set”. If a transaction reaches its end without being aborted, it atomically switches its status from
active to committed, thereby logically applying the changes in its write set to the respective memory
locations it accessed.1 Before releasing ownership of the modified locations, the transaction copies
back the values from its write set to the respective memory locations so that subsequent transactions
acquiring ownership of these locations see the new values.
2.2.3 Ownership
In the word-based HyTM scheme described here, there is an ownership record (henceforth orec)
associated with each transactional location (i.e., each memory location that can be accessed by a
transaction). To avoid the excessive space overhead that would result from dedicating one orec to
1If the STM algorithm allows a transaction’s ownership to be stolen, then the transaction atomically verifies thatit still has ownership of all locations it has accessed together with changing its status from active to committed.

16
each transactional location, we instead use a special orec table. Each transactional location maps to
one orec in the orec table, but multiple locations can map to the same orec. To acquire ownership
of a transactional location, a transaction acquires the corresponding orec in the orec table. The
details of how ownership is represented and maintained are mostly irrelevant here. We do note,
however, that the orec contains an indication of whether it is owned, and if so whether in “read”
or “write” mode. These indications are the key to how hardware transactions are augmented to
detect conflicts with software ones. For each memory access in an atomic block to be executed by a
hardware transaction, the compiler emits additional code for the hardware transaction to lookup the
corresponding orec and determine whether there is (potentially) a conflicting software transaction.
If so, the hardware transaction simply aborts itself. By storing an indication of whether the orec
is owned in read or write mode, we allow a hardware transaction to succeed even if it accesses one
or more memory locations in common with one or more concurrent software transactions, provided
none of the transactions modifies these locations.
2.2.4 Atomicity
As described above, the illusion of atomicity is provided by considering the reads and writes made
by a transaction T to “logically” take effect atomically together at some point during its commit
operation. In particular, it is guaranteed that at that commit point, all locations read by the
transaction T have the values observed by T, and that any other transaction that takes effect after
this point will see the effect of all T’s writes, as if they were all executed together in one atomic
step. By preventing transactions from observing the values of transactional locations that they do
not own, we hide the reality that the changes to these locations are in fact made one by one after
the transaction’s commit point. (Note that the transaction’s commit point may not necessarily be
the point its status is changed from active to committed, because with some implementations, at
that point the locations the transaction has read may no longer contain the read values.)
If we use such an STM or HyTM package with a standard debugger, the debugger will not

17
respect these ownership rules. Therefore, for example, it might display a pre-transaction value in
one memory location and a post-transaction value in another location that is updated by the same
transaction. This would “break” the illusion of atomicity, which would severely undermine the user’s
ability to reason about the program. Therefore, we need to modify debuggers so they provide the
user with the same atomicity illusion that TM provides the programmer with.
2.3 Debug Modes and Terminology
We distinguish between three basic debug modes:
• Unsynchronized Debugging: In this mode, when a thread stops (when hitting a breakpoint, for
example), the rest of the threads keep running.
• Synchronized Debugging: if a thread stops the rest of the threads also stop with it. There are
two synchronized debugging modes:
– Concurrent Stepping: In this mode, when the user asks the debugger to run one step of a
thread, the rest of the threads also run while this step is executed (and stop again when
the step is completed, as this is a synchronized debugging mode).
– Isolated Stepping: In this mode, when the user asks the debugger to run one step of a
thread, only that thread’s step is executed.
For simplicity, we assume that the debugger is attached to only one thread at a time, which we
denote as the debugged thread. If the debugged thread is in the middle of executing a transaction,
we denote this transaction as the debugged transaction. When a thread stops at a breakpoint, it
automatically becomes the debugged thread. Note that with the synchronized debugging modes,
after hitting a breakpoint the user can choose to change the debugged thread, by switching to debug
another thread.

18
2.4 Debugging Techniques
2.4.1 Breakpoints in Atomic Blocks
The ability to stop the execution of a program on a breakpoint and to run a thread step by step
is a fundamental feature of any debugger. In a transactional program, a breakpoint will sometimes
reside in an atomic block. In this section we describe a technique that enables the debugger to stop
and step through such a block in the HyTM system, wherein an atomic block may have at least two
implementations, for example, one that uses HTM and another that uses STM.
In keeping with the HyTM philosophy, we do not assume that any special debugging capability
is provided by the HTM support. Therefore, if the user sets a breakpoint inside an atomic block,
in order to debug that atomic block, we must disable the code path that attempts to execute this
particular atomic block using HTM,2 thereby forcing it to be executed using STM. If we cannot
determine whether a given atomic block contains a breakpoint (for example, in the presence of
indirect function calls), we can simply abort the executing hardware transaction when it reaches the
breakpoint, eventually causing the atomic block to be executed by a software transaction.
One way to disable the HTM code path is to modify the code for the transaction so that it
branches unconditionally to the software path, rather than attempting the hardware transaction. In
HyTM schemes in which the decision about whether to try to execute a transaction in hardware or
in software is made by a method in the software library, the code can be modified to omit this call
and branch directly to the software path. An alternative approach is to provide the debugger with
an interface to the software library so that it can instruct the software method to always choose the
software path for a given atomic block.
In addition to disabling the hardware path, we must also enable the breakpoint in the software
path. This is achieved mostly in the same way that breakpoints are achieved in standard debuggers.
However, there are some issues to note.2We do not want to disable all use of HTM in the program, because we wish to minimize the impact on programtiming in order to avoid masking bugs.

19
atomic {v = node->next->value;
}
=⇒
while(true) {tid = STM-begin-tran();tmp = STM-read(tid, &node);if (STM-Validate(tid)) {
tmp = STM-read(tid, &(tmp->next));if (STM-Validate(tid)) {
tmp2 = STM-read(tid, &(tmp->value));STM-write(tid, &v, tmp2);
}}if (STM-commit-tran(tid)) break;
}
Figure 2.1: An example of an atomic block and its STM-based implementation.
First, the correspondence between the source code and the STM-based implementation of an
atomic block differs from the usual correspondence between source and assembly code: the STM-
based implementation uses the STM library functions for read and write operations in the block, and
may also use other function calls to correctly manage the atomic block execution. For example, it
is sometimes necessary to invoke the STM library method STM-Validate in order to verify that the
transaction still holds ownership of all locations it has accessed, to ensure that all values read by the
transaction so far represent a consistent state of the memory. Figure 2.1 illustrates the translation
of a simple atomic block to its STM-based implementation (for brevity we present the generated
code in C, although in practice the compiler directly generates assembly code).
The debug information generated by the compiler should reflect this special correspondence to
support a meaningful debugging view to users. When the user is stepping in source-level mode, all
of these details should be hidden, just as assembly-level instructions are hidden from the user when
debugging in source-level mode with a standard debugger. However, when the user is stepping in
assembly-level mode, all STM function calls are visible to the user, but should be regarded as atomic
assembly operations: stepping into these functions should not be allowed.
20
Another issue is that control may return to the beginning of an atomic block if the transaction
implementing it is aborted. Without special care, this may be confusing for the user: it will look like
“a step backward”. In particular, in response to the user asking to execute a single step in the middle
of an atomic block, control may be transferred to the beginning of the atomic block (which might
reside in a different function or file). In such cases the debugger may prompt the user with a message
indicating that the atomic block execution has been restarted due to an aborted transaction.
Finally, it might be desirable for the debugger to call STM-Validate right after it hits a break-
point, to verify that the transaction can still commit successfully. This is because, with some HyTM
implementations, a transaction might continue executing even after it has encountered a conflict
that will prevent it from committing successfully. While the HyTM must prevent incorrect behavior
(such as dereferencing a null pointer or dividing by zero) in such cases, it does not necessarily prevent
a code path from being taken that would not have been taken if the transaction were still “viable”.
In such cases, it is probably not useful for the user to believe that such a code path was taken, as
the transaction will fail and be retried anyway. The debugger can avoid such “false positives” by
calling STM-Validate after hitting the breakpoint, and ignore the breakpoint if the transaction is
no longer viable.
The debugger may also provide a feature that allows the user to abort the debugged transaction,
with the option to either retry it from the beginning, or perhaps to skip it altogether and resume
execution after the atomic block. Such functionality is straightforward to provide because the
compiler already includes code for transferring control for retry or commit, and because most TM
implementations provide means for a transaction to explicitly abort itself.
Contention Manager Support
When stepping through an atomic block, it might be useful to change the way in which conflicts are
resolved between transactions, for example by making the debugged transaction win any conflict it
might have with other transactions. We call such a transaction a super-transaction. This feature is
21
crucial for the isolated stepping synchronized debugging mode because the debugged thread takes
steps while the rest of the threads are not executing, and therefore there is no point in waiting in case
of a conflict with another thread, nor in aborting the debugged transaction. It may also be useful
in other debugging modes, because it will avoid the debugged transaction being aborted, causing
the “backward-step” phenomenon previously described. This is especially important because the
debugged transaction will probably run much slower than other transactions, and therefore is more
likely to be aborted.
In some STM and HyTM implementations, particularly those supporting read sharing, orecs
indicate only that they are owned in read mode, and do not indicate which transactions own them
in that mode (with these implementations, transactions record which locations they have read,
and recheck the orecs of all such locations before committing to ensure that none has changed).
Supporting the super-transactions with these implementations might seem problematic, since when
a transaction would like to get write ownership on an orec currently owned in read mode, it needs to
know whether one of the readers owning this orec is a super-transaction. One simple solution is to
have the super transaction acquire write ownership of all locations it has read so far, thus allowing
any conflicting transaction to identify the owner and check whether it is a super transaction. While
this solution will work, it may also cause all other transactions that read these locations to be
aborted unnecessarily. A better solution would be to specially mark the orecs a super transaction
owns for reading. The STM library (or its contention manager component) would then ensure
that a transaction never acquires write ownership of an orec that is currently owned by the super-
transaction.
Switching between Debugged Threads
When stopping at a breakpoint, the thread that hit that breakpoint automatically becomes the
debugged thread. In some cases though, the user would like to switch to debug another thread after
the debugger has stopped at the breakpoint. This is particularly useful when using the isolated steps

22
synchronized debugging mode, because in this case the user has total control over all the threads,
and can therefore simulate complicated scenarios of interaction between the threads by taking a few
steps with each thread separately.
There are a few issues to consider when switching between debugged threads. The first has to do
with hardware transactions when using HyTM: it might be that the new debugged thread is in the
middle of executing the HTM-based implementation of an atomic block. Depending on the HTM
implementation, attaching the debugger to such a thread may cause the hardware transaction to
abort. (In a synchronized debugging mode, it might have already been aborted when the debugger
stopped all the threads.) Moreover, because HTM is not assumed to provide any specific support
for debugging, we will often want to abort the hardware transaction anyway, and restart the atomic
block’s execution using the STM-based implementation.
Again, depending on the HTM support available, various alternatives may be available, for
example:
1. Switch to the new thread aborting its transaction
2. Switch to the new thread but only after it has completed (successfully or otherwise) the
transaction (this might be implemented for example by appropropriate placement of additional
breakpoints).
3. Cancel and stay with the old debugged thread.
Another issue to consider is the combination of the super-transaction feature and the ability
to switch the debugged thread. Generally it makes sense to have only one super-transaction at
a time. If the user switches between threads, it is probably desirable to change the previously
debugged transaction back to be a regular transaction, and make the new debugged transaction a
super-transaction. As described above, this may require unmarking all orecs owned in read mode
by the old debugged transaction, and marking those of the new one.

23
2.4.2 Viewing and Modifying Variables
Another fundamental feature supported by all debuggers is the ability to view and modify variables
when the debugger stops execution of the program. The user provides a variable name or a memory
address, and the debugger displays the value stored there and may also allow the user to change
this value. As explained earlier, in various TM implementations, particularly those based on STM
or HyTM approaches, the current logical value of the address or variable may differ from the value
stored in it. In such cases, the debugger cannot determine a variable’s value by simply reading the
value of the variable from memory. The situation is even worse with value modifications: in this
case, simply writing a new value to the specified variable may violate the atomicity of transactions
currently accessing it. In this section we explain how the debugger can view and modify data in a
TM-based system despite these challenges.
The key idea is to access variables that may be accessed by transactions using the TM imple-
mentation, rather than directly, in order to avoid the above-described problems. However, there are
several important issues to consider in deciding whether to access a variable using a transaction,
and if so, with which transaction.
First, the debugged program may contain transactional variables that should be accessed using
TM and nontransactional variables that can be accessed directly using conventional techniques. A
variety of techniques for distinguishing these variables exist, including type-based rules enforced by
the compiler, as well as dynamic techniques that determine and possibly change the status of a
variable (transactional or nontransactional) at runtime (for example, [21]). Whichever technique is
used in a particular system, the debugger must be designed to take the technique into account and
access variables using the appropropriate method. In particular, the debugger should always use
transactions to access transactional variables, and nontransactional variables can be accessed as in
a standard debugger.3
3In some TM systems, accessing a nontransactional variable using a transaction will not result in incorrect behavior,in which case we can choose to access all variables with transactions.

24
For transactional variables, one option is for the debugger to get or set the variable value by
executing a “mini-transaction”—that is, a transaction that consists of the single variable access.
The mini-transaction might be executed as a hardware transaction or as a software transaction,
or it may follow the HyTM approach of attempting to execute it in hardware, but retrying as a
software transaction if the hardware transaction fails to commit or detects a conflict with a software
transaction.
Note, however, that the goal of the debugger is to show the value of the variable from the point of
view of the debugged program, or more precisely, of the debugged thread. Therefore, if the debugger
has stopped in the middle of an atomic block execution, and the variable to be accessed has already
been accessed by the debugged transaction, then it is often desirable to access the specified variable
from the debugged transaction’s point of view. This is important because the debugged transaction
may have written a value to the variable, that the user may desire to see even though the transaction
has not yet committed, and therefore this value is not (yet) the logical value of the variable being
examined. Similarly, if the user requests to modify the value of a variable that has been accessed
by the debugged transaction, then it may be desirable for this modification to be part of the effect
of the transaction when it commits. To support this behavior, the variable can be accessed in the
context of the debugged transaction simply by calling the appropriate library function to read the
variable as part of the transaction. (We note that it is straightforward to extend existing HyTM
and STM implementations to support functionality that determines whether a particular variable
has been modified by a particular transaction.)
Note that it is still often better to access variables that were not accessed by the debugged trans-
action using mini-transactions and not the debugged transaction itself. This is because accessing
such variables using the debugged transaction increases the set of locations that the transaction is
accessing, thereby making it more likely to abort due to a conflict with another transaction.
In general, it is preferable that actions of the debugger have minimal impact on normal program
execution. For example, we would prefer to avoid aborting transactions of the debugged program in

25
order to display values of variables to the user. However, we must preserve the atomicity of program
transactions. In some cases, it may be necessary to abort a program transaction in order to service
the user’s request. For example, if the user requests to modify a value that has been accessed by an
existing program transaction, then the mini-transaction used to effect this modification may conflict
with that program transaction. In some cases the conflict can occur even if the variable was not
accessed by any of the program transactions, due to false conflicts, where two transactions conflict
even though they do not access any variables in common. In other cases, it may not be possible to
determine whether a particular program transaction has already committed, in which case it would
not be possible to determine the logical value of a variable that it has modified.
In case the mini-transaction used to implement a user request does conflict with a program trans-
action, several alternatives are possible. We might choose either to abort the program transaction,
or to wait for it to complete (in appropriate debugging modes), or to abandon the attempted modifi-
cation. These choices may be controlled by preferences configured by the user, or by prompting the
user to decide between them when the situation arises. In the latter case, various information may
be provided to the user, such as which program transaction is involved, what variable is causing the
conflict (or an indication that it is a false conflict), etc.
In some cases, the STM may provide special-purpose methods for supporting mini-transactions
for debugging. For example, if all threads are stopped, then the debugger can modify a variable
that is not being accessed by any transaction without acquiring ownership of its associated orec.
Therefore in this case, if the STM implementation can tell the debugger whether a given variable
is being accessed by a transaction, then the debugger can avoid acquiring ownership and aborting
another transaction due to a false conflict.
Adding and Removing a Variable from the Transaction’s Access Set
As described in the previous section, it is often preferable to access variables that do not conflict
with the debugged transaction using independent mini-transactions. In some cases, however, it
26
may be useful to allow the user to access a variable as part of the debugged transaction even if
the transaction did not previously access that variable. This way, the transaction would commit
only if the variable viewed does not change before the transaction attempts to commit, and any
modifications requested by the user would commit only if the debugged transaction commits. This
approach provides the user with the ability to “augment” the transaction with additional memory
locations.
Moreover, some TM implementations support early-release functionality [16]: with early-release,
the user can decide to discard any previous accesses done to a variable by the transaction, thereby
avoiding subsequent conflicts with other transactions that modify the released variable. If early-
release is supported by the TM implementation, the debugger can also support removing a variable
from the debugged-transaction’s access set.
Displaying the pre-transaction value of the debugged transaction
Although when debugging an atomic block the user would usually prefer to see variables as they
would be seen by the debugged transaction, in some cases it might be useful to see the value as
it was before the transaction began (note that since the debugged transaction has not committed
yet, this pre-transaction value is the current logical value of the variable, as seen by other threads).
Most STM implementation can provide such functionality because they have to keep track of the
pre-transaction value in case that the transaction will be aborted, in which case all locations it tried
modifying will have to be restored to their pre-transaction values. Thus, some STM implementations
record the value of all variables accessed by a transaction the first time they are accessed. In other
STM implementations, the pre-transaction value is kept in the variable itself until the transaction
commits, and can thus be read directly from the variable. In such systems, the debugger can display
the pre-transaction value of a variable (as well as the regular value seen by the debugged transaction).

27
Getting values from conflicting transactions
In some cases, it is possible to determine the logical value of a variable even if it is currently being
modified by another transaction. As described above, it may be possible for the debugger to get
the pre-transaction value of a variable accessed by a transaction. If the debugger can determine
that the conflicting transaction’s linearization point has not passed, then it can display the pre-
transaction value to the user. How such a determination can be made depends on the particular
STM implementation, but in many cases this is not difficult.
Another potentially useful piece of information we can get from the transaction that owns the
variable the user is trying to view is the tentative value of that variable—that is, the value as seen
by the transaction that owns the variable. Specifically, the debugger can inform the user that the
variable is currently accessed by a software transaction, and give the user both the current logical
value of the variable (that is, its pre-transaction value), and its tentative value (which would become
the logical value if the transaction were to commit successfully at that point).
2.4.3 Atomic Snapshots
The debugger can allow the user to define an atomic group of variables to be read and/or modi-
fied atomically. Such a feature provides a powerful debugging capability that is not available for
conventional programs: the ability to get a consistent view of multiple variables even in unsynchro-
nized debug mode, when threads are running and potentially modifying these variables. (It can
also be used with synchronized debugging when combined with the delayed breakpoint feature; see
Section 2.4.5.)
Implementing atomic groups using TM is simply done by accessing all variables in the group using
one transaction. The variables in the group are read using a single transaction. As for modifications,
when the user modifies a variable in an atomic group, the modification does not take effect until the
user asks to commit all modifications to the group, at which point the debugger begins a transaction

28
that executes these modifications atomically. The transactions can be managed by HTM, STM or
HyTM.
Note, however, that it is not guaranteed that the group’s variables still have the displayed values
at the point the user is asking to commit the modifications to the group. This may result in
unexpected behavior if, for example, the user’s intention is to assign the value of one variable in the
group to another. We can thus extend this feature with a compare-and-swap option, which modifies
the values of the group’s variables only if they contain the previously displayed values. This can be
done by beginning a transaction that first rereads all the group’s variables and compares them to
the previously presented values (saved by the debugger), and only if these values all match, applies
the modifications using the same transaction. If some of the values did change, the new values can
be displayed.
Finally, the debugger may use a similar approach when displaying a compound structure in
an unsynchronized debug mode, to guarantee that it displays a consistent view of that structure.
Suppose, for example, that the user views a linked list, starting at the head node and expanding
it node-by-node. Because in unsynchronized debugging mode the list might change while being
viewed, reading it node-by-node might display an inconsistent view of the list. The debugger can
use a transaction to re-read the nodes leading to the node the user has just expanded, thereby
avoiding such inconsistency.
2.4.4 Watchpoints
Many debuggers support watchpoint functionality, allowing a user to instruct the debugger to stop
when a particular memory location or variable is modified. More sophisticated watchpoints, called
conditional watchpoints, can also specify that the debugger should stop only when a certain predicate
holds (for example, that the variable’s value is bigger than some number).
Watchpoints are sometimes implemented using specific hardware support, called hw-breakpoints.
If no hw-breakpoint support is available, some debuggers implement watchpoints in software, by

29
executing the program step-by-step and checking the value of the watched variable(s) after each
step, which results in executing the program hundreds of times slower than normal.
We describe here how to exploit TM infrastructure to stop on any modification or even a read
access to a transactional variable. The idea is simple: because the TM implementation needs to
keep track of which transactions access which memory locations, we can use this tracking mechanism
to detect accesses to specific locations. Particularly, with the HyTM implementation described in
Section 2.2, we can mark the orec that corresponds to the memory location we would like to watch,
and invoke the debugger whenever a transaction gets ownership of such an orec. In the hardware code
path, when checking an orec for a possible conflict with a software transaction, we can also check for
a watchpoint indication on that orec. Depending on the particular hardware TM support available,
it may or may not be possible to transfer control to the debugger while keeping the transaction
viable. If not, it may be necessary to abort the hardware transaction and retry the transaction in
software.
The debugger can mark an orec with either a stop-on-read or stop-on-write marking. With
the first marking, the debugger is invoked whenever a transaction gets read ownership of that orec
(note that some TM implementations allow multiple transactions to concurrently own an orec in
read mode), and with the latter, it is invoked only when a transaction gets write ownership of that
orec. When invoked, the debugger should first check whether the accessed variable is one of the
watchpoint’s variables (multiple memory locations may be mapped to the same orec). If so, then
the debugger should stop, or, in the case of a conditional watchpoint, evaluate a predicate to decide
whether to stop. Note that the predicate may be dependent on additional variables; we discuss how
the debugger handles these cases later.
Stopping the program upon access to a watchpoint variable can be done in one of two ways:
1. Immediate-Stop: The debugger can be invoked immediately when the variable is accessed.
While this gives the user control at the first time the variable is accessed, it has the disadvantage
that the first value written by the transaction to the variable may not be the actual value finally
30
written by the transaction: the transaction may later change the value written to this variable,
or abort without modifying the variable at all. Since the transaction seems to be executed in
isolation, these intermediate values are not visible to anyone except for the thread executing the
transaction. Thus, in many cases, the user would not care about these intermediate values of
the variable, or about accesses done by transactions that do not eventually commit, especially
with conditional watchpoints when the user asks to only stop when the written values satisfies
some predicate.
2. Stop-on-Commit: This option overcomes the problems of the immediate-stop approach, by
delaying the stopping to the point when the transaction commits. That is, instead of invoking
the debugger whenever a marked orec is acquired by a transaction, we invoke it when a
transaction that owns the orec commits; this can be achieved for example by recording an
indication that the transaction has acquired a marked orec when it does so, or simply by
checking for marked owned orecs when committing successfully. With this method, the user
sees the value actually written to the variable, since at that point no other transaction can
abort the triggering transaction anymore. While this approach has many advantages over
the immediate-stop approach, it also has the disadvantage that the debugger will never stop
on an aborted transaction that tried to modify the variable, which in some cases might be
desirable. Therefore, we believe that it is desirable to support both options, allowing the user
to choose between them. Also, when using the stop-on-commit approach, the user cannot see
how exactly the written value was calculated by the transaction, although this problem can
be mitigated by the replay debugging technique described in Section 2.4.6.
While the above description assumes a TM implementation that uses orecs, the tecniques we
propose are also applicable to other TM approaches. For example, in object-based TM implemen-
tations like the one by Herlihy et. al. [16], we can stop on any access to an object since any such
access requires opening the object first, so we can change the method used for opening an object

31
to check whether a watchpoint was set on that object. This might be optimized by recording an
indication in an object header or handle that a watchpoint has been set on that object.
Dynamic Watchpoints
In some cases, the user may want to put a watchpoint on a field whose location may dynamically
change. Suppose, for example, that the user is debugging a linked list implementation, and wishes
to stop whenever some transaction accesses the value in the first node of the list, or when some
predicate involving this value is satisfied. The challenge is that the address of the field storing the
value in the first node of the list is indicated by head->value, and this address changes when head
is changed, for example when inserting or removing the first node in the list. In this case, the
address of the variable being watched changes. We denote this type of a watchpoint as a dynamic
watchpoint. (We note that this debugging technique is not specific for transactional programs; it
will be as useful for regular programs.)
We can implement a dynamic watchpoint on head->value as follows: when the user asks to put
a watchpoint on head->value, the debugger puts a regular watchpoint on the current address of
head->value, and a special debugger-watchpoint on the address of head. The debugger-watchpoint
on head is special in the sense that it does not give the control to the user when head is accessed:
instead, the debugger cancels the previous watchpoint on head->value at that point, and puts a
new watchpoint on the new location of head->value. That is, the debugger uses the debugger-
watchpoint on head to detect when the address of the field the user asked to watch is changed, and
changes the watchpoint on that field accordingly.
Multi-Variable Conditional Watchpoints
There are two kind of conditional watchpoints that may be conditioned on multiple variables. In
the first kind, the watchpoint is put on only one variable, but the condition may include other
variables as well. For example, stop when variable x changes only if the new value of x equals

32
another variable y. In the other kind of a watchpoint, the user asks to stop whenever some predicate
that is dependent on multiple variables is satisfied. For example, the user asks to stop only if the
sum of two variables is greater than some value. Here, the user asks the debugger to stop on the
first memory modification that satisfies the predicate. We denote such watchpoints as multi-variable
conditional-watchpoints, and the variables that should be watched as the watched variables. Note
that in the second type of a watchpoint all variables of the predicate should be watched.
To implement a multi-variable conditional watchpoint, the debugger can place a watchpoint on
each of the watched variables, and evaluate the predicate whenever one of these variables is modified.
We denote by the triggering transaction the transaction that caused the predicate evaluation to be
invoked. One issue to be considered is that evaluating the predicate requires accessing the other
variables (which may or may not be watched). This can be done as follows:
• The debugger uses the stop-on-commit approach, so that when a transaction that modifies any
watched variables commits, we stop execution either before or after the transaction commits.
In either case, we ensure that the transaction still has ownership of all of the orecs it accessed,
and we ensure that these ownerships are not revoked by any other threads that continue to
run, for example by making the triggering transaction a super-transaction.
• When evaluating the predicate, the debugger distinguishes between two kinds of variables:
ones that were accessed by the triggering transaction, which we denote as triggering variables,
and the rest which we denote as external variables. External variables might be accessed by
using the stopped transaction, or by using another transaction initiated by the debugger. In
the latter case, because the triggering transaction is stopped and retains ownership of the
orecs it accessed while the new transaction that evaluates the external variables executes, the
specified condition can be evaluated atomically.
• While reading the external variables, conflicts with other transactions that access these vari-
ables may occur. One option is to simply abort the other transaction. However, this may be

33
undesirable, because we may prefer that the debugger has minimal impact on program execu-
tion. As discussed in Section 2.4.2, it is possible in some cases to determine the pre-transaction
value for the watched variable without aborting the transaction that is accessing it.
2.4.5 Delayed Breakpoints
Stopping at a breakpoint and running the program step-by-step affects the behavior of the program,
and particularly the timing of interactions between the threads. Placing a breakpoint inside an
atomic block may result in even more severe side-effects, because the behavior of atomic blocks
may be very sensitive to timing modifications since they may be aborted by concurrent conflicting
transactions. These effects may make it difficult to reproduce a bug scenario.
To exploit the benefits of breakpoint debugging while attempting to minimize such effects, we
suggest the delayed breakpoint mechanism. A delayed breakpoint is a breakpoint in an atomic block
that does not stop the execution of the program until the transaction implementing the atomic
block commits. Besides the advantage of a smaller impact on execution timing, this technique also
avoids stopping execution in the case that a transaction executes the breakpoint instruction, but
then aborts. In many cases, it will be preferable to only stop at a breakpoint in a transaction that
subsequently commits.
Delayed breakpoints encourage debugging methodology where the user reasons about the whole
effect of an atomic block, and places assertions inside the atomic block to verify that it doesn’t
violate an invariant of the system. Note that the assertions are evaluated atomically as part of the
atomic block’s execution. The user can place delayed breakpoints on these assertions, stopping when
an atomic block execution commits and violates the system invariant.
To support delayed breakpoints, rather than stopping the program execution when an instruction
marked as a delayed breakpoint is executed, we merely set a flag that indicates that the transaction
has hit a delayed breakpoint, and resume execution. Later, upon committing, we stop the program
execution if this indication is set.

34
One simple type of a delayed breakpoint stops on the instruction following the atomic block if
the transaction implementing the atomic block hit the breakpoint instruction in the atomic block.
This kind of delayed breakpoint can be implemented even when the transaction executing an atomic
block is run using HTM. The debugger simply replaces the breakpoint-instruction in the HTM-
based implementation to branch to a piece of code that executes that instruction, and raises a flag
indicating that the execution should stop on the instruction following the atomic block. This simple
approach has the disadvantage that the values written by the atomic block may have already been
changed by other threads when execution stops, so the user may see a state of the world that differs
from the state when the breakpoint instruction was hit. Moreover, if the transaction is executed in
hardware, then unless there is specific hardware support for this purpose, the user would not be able
to get any information about the transaction execution (like which values were read/written, etc.).
On the other hand, if the atomic block is executed by a software transaction (or if special
hardware support is available), we can have a more powerful type of a delayed breakpoint, which
stops at the commit point of the executing transaction. More precisely, the debugger tries to stop
at a point during the commit operation of that transaction at which the transaction is guaranteed
to commit successfully, but no other transaction has seen its effects on memory. This can be done
by having the commit operation check the flag that indicates if a delayed-breakpoint placed in the
atomic block was hit by the transaction, and if so do the following:
1. Make the transaction a super-transaction. (This step is only necessary in unsynchronized
debugging mode, when the transaction can still be aborted by other threads.)
2. Validate the transaction. That is, make sure that the transaction can commit. If validation
fails, abort the transaction, fail the commit operation, and resume execution.
3. Give control to the user.
4. When the user asks to continue execution, commit the transaction. Note that, depending on
how super-transactions are supported, a lightweight commit may be applicable here if we can

35
be sure that the transaction cannot be aborted after becoming a super-transaction.
The idea behind the above procedure is simple: guarantee that all future conflicts will be resolved
in favor of the transaction that hit the breakpoint, check that the transaction can still commit, and
then give control to the user, who can subsequently decide to commit the transaction.
At Step 3 the debugger stops the execution of the commit operation and gives control to the user.
This is the point at which the user gets to know that a committed execution of the atomic block
has hit the delayed breakpoint. At that point, the user can view various variables, including those
accessed by the transaction, to try to understand the effect of that execution. In Section 2.4.6, we
describe other techniques that can give the user more information about the committed transaction’s
execution at that point.
Combining with Atomic Groups
One disadvantage of using a delayed breakpoint is that if the user views variables not accessed by
the transaction, the values seen are at the time the debugger stops rather than the time of the
breakpoint-instruction execution. Therefore, it may be useful to combine the delayed breakpoint
mechanism with the atomic group feature (Section 2.4.3): with this combination, the user can
associate with the delayed breakpoint an atomic group of variables whose values should be recorded
when the delayed breakpoint instruction is executed. When the delayed breakpoint instruction is
hit, besides triggering a breakpoint at the end of the transaction, the debugger gets the atomic
group’s value (as described in Section 2.4.3), and presents it to the user when it later stops in the
transaction’s commit phase.
2.4.6 Replay Debugging for Atomic Blocks
It is useful to be able to determine how the program reached a breakpoint. Replay debugging
has been suggested in a variety of contexts to support such functionality, and support ranging
from special hardware to user libraries have been proposed (see [26, 31] for two recent examples).

36
Replay debugging for multithreaded concurrent applications generally requires logging that can add
significant overhead. In this section, we explain how STM infrastructure can be exploited to support
replaying atomic blocks, without the need for additional logging. We also explain how the user can
even modify data, observe how execution would have proceeded had it read different values, and
even choose to commit that execution instead of the original one. To our knowledge, previous replay
debugging proposals do not support such functionality.
The idea behind our replay debugging technique is to exploit the fact that the behavior of most
atomic blocks is uniquely determined by the values it reads from memory4. Some STM implemen-
tations record values read by the transaction in a readset. Others preserve these values in memory
until the transaction commits, at which point the values may be overwritten by new values written
by the transaction. In either case, as long as the transaction is valid and can still commit successfully,
it should be possible to provide the debugger access to the values of the variables as seen by the
transaction. We denote these values as the pre-transactional values of the variables. Doing so will
allow the debugger to reconstruct execution of the transaction, as explained in more detail below:
• The debugger maintains its own write-set for the transaction. This is necessary to allow the
debugger to determine the values returned by reads from locations that the transaction has
previously written. The replay begins with an empty write set.
• The replay procedure starts from the beginning of the debugged atomic block, and executes
all instructions that are not STM-library function calls as usual.
• The replay procedure ignores all STM library function calls except the ones that implement
the transactional read/write operations.
• When the replay procedure reaches a transactional write operation, it writes the value in the
write set maintained by the debugger.4We call such atomic blocks transactionally deterministic. While the techniques described in this section may beuseful even for blocks that the compiler cannot prove are transactionally deterministic, in this case the user shouldbe informed that the displayed execution might not be identical to the one that triggered the breakpoint.
37
• When the replay procedure reaches a transactional read operation, it first searches the value
for the read variable in the write set maintained by the debugger. If the value is there, this
is the returned value of that transactional read operation. Otherwise, the pre-transactional
value of the variable is returned.
As long as the debugged transaction retains ownership of orecs it acquired during the original
execution,5 the transaction stays valid, and all variables it has read retain their pre-transactional
values. Therefore the replayed execution is faithful to the original.
Replay debugging functionality can be combined with various other features we have described.
For example, by combining replay debugging with the delayed breakpoint feature described in Sec-
tion 2.4.5, we can create the illusion that control has stopped inside an atomic block, although it
has actually already run to its commit point. Then, the replay functionality allows the user to
step through the remainder of the atomic block before committing it. It is even possible to allow
experimentation with alternative executions of a debugged atomic block, for example by changing
values it reads or writes. In some cases, we may wish to do so without affecting the actual program
execution. In other cases, we may prefer to change the actual execution, and subsequently resume
normal debugging. One way to handle the latter case is to abort the current transaction without
releasing orecs, and replay it up to the point at which the user wishes to change something. This
way, we guarantee that the transaction will reexecute up to this point identically to how it did in
the first place.
Combining replay debugging with other debugger features we have proposed can support a rather
powerful debugging environment for transactional programs.5 In our description we assumed that no other thread is running while the transaction is being replayed, so thetransaction trivially retains ownership of all orecs it acquired. If halting all other threads during the replay is notpossible, the debugger can make the transaction a super transaction, and verify that no ownerships were revokedduring the replay.

38
2.5 Summary
This chapter explored how to provide debugging support for transactional programs. It discussed
how to adjust basic debugging features to work with transactional programs, as well as how to provide
new, more advanced features that we believe to be useful with the different nature of transactional
programs. In the next chapter we describe the tm db library, which we developed to support some
of these debugging features for various STM algorithms.

Chapter 3
Practical Transactional Debugging
Support: The TMDB library
In this chapter we present more technical details on how to support debugging of transactional
programs in real, commercial debuggers. The chapter introduces tm db, a library that provides
debuggers with a general debugging support for transactional programs. The library supports various
STM algorithms, and helps debuggers provide users with transactional debugging features that
are independent of the particular TM runtime internals. Furthermore, while the library currently
supports only the STM algorithms provided by the SkySTM library, it is designed so that it can be
extended to work with additional TM runtimes, without needing to change the debuggers using it.
The chapter presents the various debugging features the library supports, its design, and how a
debugger can use it to provide debugging support for transactional programs.
39

40
3.1 Introduction
In this chapter we focus on how some of the debugging features described in Chapter 2 can be
implemented in a real, commercial debugger. In particular, we describe tm db, a library that we
built to aid debuggers with providing debugging support for transactional programs.
One of the first observations that we had when switching from describing transactional debugging
techniques to actually implementing them is that many debuggers do not really run as part of
the debugged program process space; they only provide the illusion that they do. Therefore, the
implementation techniques described in Chapter 2, in which debugging features use the STM runtime
to run transactions could not be used in practice. Instead, as described in Section 3.3, we had to
simulate the execution of such transactions with code that runs in a remote process, while the
debugged process is stopped.
Another challenge in designing the tm db library was in defining its interface with the debugger so
that it can support debugging with different transactional memory algorithms and runtimes. Today,
the research literature encompasses many different STM algorithms: some update objects in place,
some log undo operations in case a transaction is aborted; some detect conflicts when objects are
accessed, some only when a transaction attempts to commit; some support implicit privatization,
some do not. Despite these differences, we believe that the basic debugging needs for transactional
programs are similar with all these algorithms, and we strove to define an interface to the debugger
that is independent of the particular TM runtime in use.
To this point, the tm db library works with the SkySTM runtime [20], which supports a wide
range of transactional memory algorithms and contention management strategies. As we explain in
Section 3.3, we designed the tm db library so that it can be easily extended to support additional
TM runtime libraries and algorithms, without needing to change the debuggers that are using it.
Recently, the Sun Studio product group in Sun Microsystems used the tm db library for preliminary
debugging support for transactional programs in the Sun Studio dbx debugger, which was extended

41
with additional debugging functionality for this purpose.
The rest of the chapter is organized as follows. In Section 3.2 we describe the debugging fea-
tures supported by tm db, explain how they address debugging with different STM algorithms, and
provide examples of how the debugger can use these features when providing debugging support. In
Section 3.3 we describe the design of the library and how it can be integrated in a real debugging
environment. In Section 3.4 we describe our experience implementing the solution for the SkySTM
runtime, and we conclude in Section 3.5.
3.2 Debugging Transactional Programs
This section describes basic debugging features we believe are esssential for transactional debugging,
and how they are provided by tm db.
3.2.1 Logical Values
STM runtimes often deploy complex schemes to preserve the valuable illusion of simplicity provided
by the transactional model — schemes may be exposed and confuse the user if a transactional pro-
gram is debugged using a standard debugger. For example, consider a simple phase-based program,
where the phase is governed by a shared counter. Suppose the user halts the program at a break-
point, examines the counter, and sees that the program is at Phase 3. Can the user assume that
the effects of all Phase 2 transactions are reflected in memory? In STM runtimes that use deferred
updates, some Phase 2 transactions may have committed, but their effects may not have been writ-
ten to memory. Examining memory may confuse the user, as it may be seen as if the program is at
Phase 3 before some Phase 2 operations are completed. Similarly, the atomicity property may be
violated with STM runtimes that use undo logs (e.g., [30]), where some Phase 2 transactions may
have aborted, but their effects may not yet have been undone.
Therefore, as described in Chapter 2, to maintain the atomicity illusion, a debugger must not

42
naıvely fetch a variable value from memory, but rather interoperate with the STM runtime and
return the value as it would be seen by an independent mini-transaction reading the variable. The
tm db library supports this functionality by providing the logical values of memory locations, which
expose the effects of a transaction atomically (all at once), and exactly at the transaction’s commit
point.1
In more detail, we define the logical value of a memory location L to be the latest value written
to L by either a committed transaction (whether or not that value actually appears in L), or a non-
transactional write.2 When examining logical values, a transaction’s effect is exposed atomically
when it commits. By providing logical values, the tm db library abstracts away details of the STM
runtime, like whether it uses the deferred writes or the in-place writes approach.
Note that the logical value does not reflect tentative writes that were done by transactions that
have not yet committed; thus, it may not be the best candidate for presenting values of variables that
were modified by the debugged transaction, when seeing these tentative values may be important
(see Section 2.4.2 for details). We later describe how tm db helps the debugger to provide information
about such tentative writes when presenting data to the user.
3.2.2 Transaction Identity
To communicate information about transactions between the user and the debugger (and between
the debugger and tm db), transactions need to be uniquely identified (similar to the way threads are
uniquely identified by thread ids).
We distinguish between three notions of interest when identifying a transaction. An atomic block
is a lexical scope, corresponding to the lines of code executed by a transaction. A logical transaction
occurs at run time when a thread executes an atomic block. The same atomic block can produce
multiple logical transactions, one for each of its successful executions.3 Finally, a logical transaction1 By “commit point” we refer to the point at which the transaction logically takes effect.
2 When the underlying TM does not provide strong atomicity, this definition assumes that there are no concurrenttransactional and non-transactional writes to the same location.
3 A successful execution does not necessarily mean that the transaction has successfully committed – it might have

43
Thread Latest TxId Status Atomic Block
t@1 <None> <None>t@2 2.1907.0 Committed PushHead+0x0008t@3 3.2217.1 Active PushTail+0x0008
> t@4 4.2082.0 Aborting PushHead+0x0008t@5 5.2107.0 Committing PushHead+0x0008t@6 6.2210.0 Invalid PushTail+0x0008
Figure 3.1: Transactions Ids, Statuses, and Atomic blocks.
can produce a sequence of physical transactions, because an execution of a logical transaction may
be rolled back and retried, possibly several times.
To capture the distinction between logical and physical transactions, the library represents a
transaction as a triple T.L.P, where T is the thread executing the transaction, L is the total number
of logical transactions completed by thread T, and P is the number of physical transactions that
failed executing the current logical transaction. For example, Transaction 3.4.1 indicates the 2nd
try of the 5th logical transaction of thread 3. Thus, when stopping at two different points, the user
can tell what progress each thread has made: for example whether it is still executing the same
physical transaction, the same logical transaction, and so on. An atomic block is identified by the
address of its first instruction, which is easily translated to a specific function name and offset, or
to a file and line number (when the program is compiled with debugging information).
The library provides the transaction and atomic block id for the latest transaction begun by each
thread (even if the transaction has already completed). Figure 3.1 shows a usage example,4 in which
a debugger uses the library to present the transaction and atomic block ids of the latest transactions
for all running threads, as well as their statuses, which we describe next.
3.2.3 Transaction Status
The library represents a transaction’s status using three fields:
been self-aborted.
4 All usage examples are from a prototype integrated with dbx.

44
• The IsRunning flag indicates whether the transaction is still running, or has completed.
We say that a transaction is not completed as long as there are still some operations to be
done on its behalf by the STM runtime (this includes any cleanup operations that have to be
done after a transaction is aborted or committed). Thus, a transaction may be still running
even after it has logically committed (taken effect), or after it is determined that it must be
aborted. While we are aware that the value of the IsRunning flag is not well defined for any
possible STM algorithm, we believe that it is well defined for all STM algorithms we are aware
of and decided to include this information in the transaction’s status.
• The transaction’s State can be one of the following values: Active, Committed, Aborted, and
Invalid .
– An Active transaction is still capable of committing successfully (meaningful only for
running transactions).
– An Invalid Transaction can no longer commit successfully (for example, it may have read
something modified by another transaction), but is not yet aware of it, and not yet in
the process of aborting. Such transactions may still be executing user code, and are
sometimes referred to as “zombie” or “doomed” transactions.
– A Committed transaction has already committed successfully. If IsRunning is true, the
transaction may not have completed post-commit cleanup operations, such as executing
deferred writes. Still, the logical values of all locations it has written already reflect the
new written values.
– An Aborted transaction has failed to commit successfully. If IsRunning is true, the trans-
action may not have completed some post-abort cleanup operations, such as undoing
in-place writes.5
5 The library is unaware whether the underlying TM uses deferred or in-place writes. It simply reports the stateand whether the transaction is running; the user can decide whether a particular state is interesting based on specificknowledge of the TM runtime.

45
• The IsWaiting flag reports whether the transaction is blocked by the underlying TM, waiting
for another transaction. If so, the address for which it is waiting can sometimes be provided.6
Different TM implementations may have blocked transactions in any one of the above states.
For example, a transaction may be Active while waiting for a location X, and then become
Invalid because another location that it has accessed is modified. The IsWaiting flag for the
transaction may continue to be true for a while, until the transaction finds out that it can no
longer commit successfully, and abort. The IsRunning value for a blocked transaction must be
true, though.
Note that even though the library conveys transaction status via these three fields, a debugger
may display it differently. For example, in Figure 3.1, the debugger does not display the IsRunning
value; instead, it uses Commited and Committing to distinguish a completed transaction that commit-
ted (thread t@2) from a running transaction that is logically committed but has not yet completed
(thread t@5). As an another example, some debuggers may not allow users to stop and examine
aborted or invalid transactions, in which case the user may only need to see whether the thread is
currently executing a transaction, and which transaction. (The debugger may still need to examine
the State field to determine whether a transaction is aborted or invalid, and avoid stopping in this
case.)
3.2.4 Read, Writes, Conflicts, and Coverage
A transaction T covers a location L if a write access to L by another transaction7 would cause a
conflict with T. A transaction covers all locations it has read or written. A false conflict occurs
when the conflict is on a location that the transaction covers but has not explicitly accessed. This
typically happens when the underlying TM maps the locations to the same “protection unit” (such
6 Whether or not tm db can provide this additional information depends on the particular STM runtime in use.The library interface allows a particular TM runtime not to support this feature, as we later describe in Section 3.3.3.
7 We only consider write accesses by transactions because tm db does not assume that strong atomicity is supported,and thus that conflicts between transactional and non-transactional memory accesses can be detected.

46
> tx coverage & g list .Head−>next−>key
Tid TxID & Status Coverage Type Written Read
t@2 2595.0 Active Read & Write Yes Yest@6 1.0 Active Read & Write Yes Not@4 2023.0 Active Read & Write No No
Figure 3.2: Coverage for a given variable
as the ownership records described in Chapter 2) as that of accessed locations.
Coverage can be refined to read or read & write coverage, where we say that a transaction T has
a read & write coverage of a location if even a read access to the location by another transaction
would cause a conflict with T. In addition, because some TM runtimes allow multiple transactions
that wrote to the same location to commit as long as neither read it, we also provide a write-only
coverage type.
For a location L and transaction T, the library supports checking whether T accessed L, whether
T covers L, and if, so, for reading, writing, or both. Distinguishing coverage from access is helpful
for distinguishing true and false data conflicts. Access and coverage information is recorded when
the access occurs in the user’s code, and not when the transaction physically writes the location, or
acquires ownership of it. The latter events might occur long after the actual access if the underlying
TM uses deferred updates (when written locations are modified only after the transaction has log-
ically committed) or lazy acquisition (when write ownership is granted only when the transaction
tries to commit). Reporting accesses as they happen in the user’s code is easier for the user to
understand, and is independent of the underlying TM.
Figure 3.2 shows how the debugger can use this information to provide full access and coverage
information for the key field in a linked list node. In this example, thread t@2 has read and written
the key field, while thread t@6 has only written it, but still covers it for both reading and writing,
meaning that it read another location that maps to the same “protection unit” by the underlying TM
(a false conflict). On the other hand, thread t@4 did not access key at all, but covers it anyway for
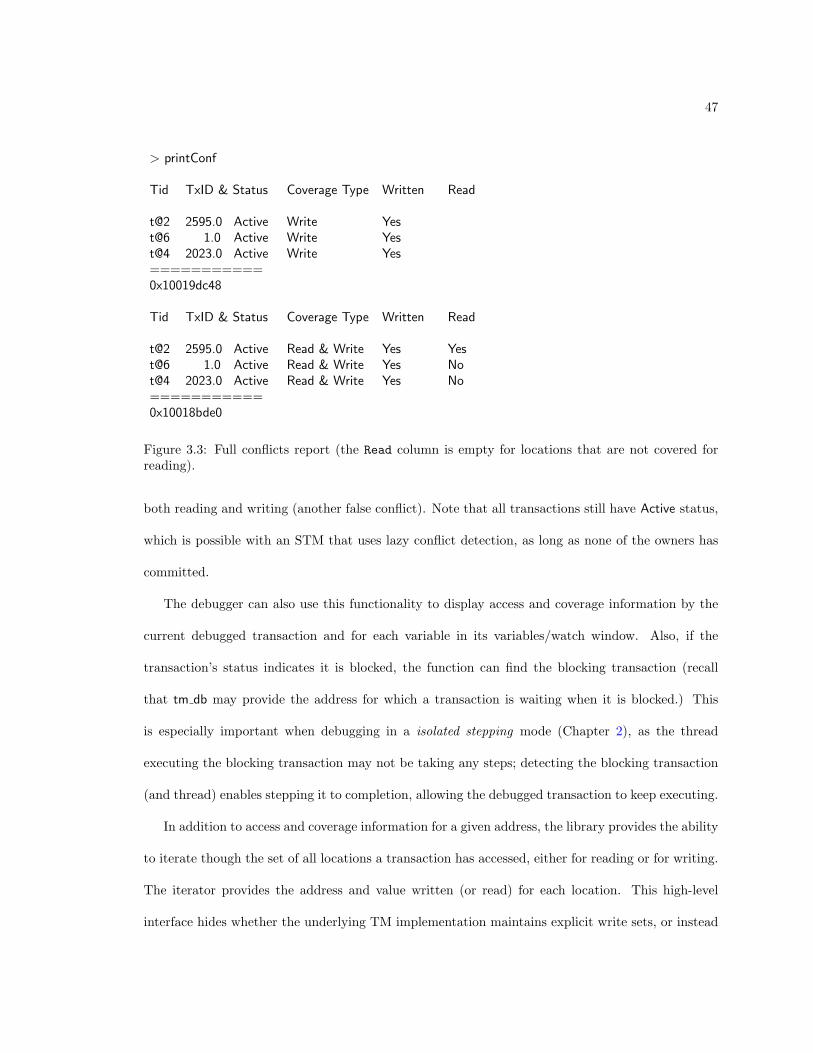
47
> printConf
Tid TxID & Status Coverage Type Written Read
t@2 2595.0 Active Write Yest@6 1.0 Active Write Yest@4 2023.0 Active Write Yes===========0x10019dc48
Tid TxID & Status Coverage Type Written Read
t@2 2595.0 Active Read & Write Yes Yest@6 1.0 Active Read & Write Yes Not@4 2023.0 Active Read & Write Yes No===========0x10018bde0
Figure 3.3: Full conflicts report (the Read column is empty for locations that are not covered forreading).
both reading and writing (another false conflict). Note that all transactions still have Active status,
which is possible with an STM that uses lazy conflict detection, as long as none of the owners has
committed.
The debugger can also use this functionality to display access and coverage information by the
current debugged transaction and for each variable in its variables/watch window. Also, if the
transaction’s status indicates it is blocked, the function can find the blocking transaction (recall
that tm db may provide the address for which a transaction is waiting when it is blocked.) This
is especially important when debugging in a isolated stepping mode (Chapter 2), as the thread
executing the blocking transaction may not be taking any steps; detecting the blocking transaction
(and thread) enables stepping it to completion, allowing the debugged transaction to keep executing.
In addition to access and coverage information for a given address, the library provides the ability
to iterate though the set of all locations a transaction has accessed, either for reading or for writing.
The iterator provides the address and value written (or read) for each location. This high-level
interface hides whether the underlying TM implementation maintains explicit write sets, or instead

48
uses an undo log.
One interesting use of the write set iterator is for providing information on all locations currently
involved in conflicts, as illustrated in Figure 3.3. Since each address involved in a conflict must be
written by some transaction, the debugger can build a list of potentially conflicted addresses by
iterating through the write sets of all running transactions, and then checking (using the coverage
query functionality) which of these addresses is covered by more than one running transaction. Also,
as we later describe, the debugger may use the write set iterator when displaying variables that were
written by the debugged transaction.
Finally, the access and coverage information is provided for the latest transaction of each thread
regardless of its status, even if the transaction has already completed. The debugger can choose, for
each of its commands, whether to take into account already completed transactions. (For example,
the user may be interested in seeing the set of writes done by the previous, completed transaction,
but may not be interested in seeing conflicts with these writes.)
Sub-word Accesses
An interesting question is the granularity the runtime TM provides with respect to non-transactional
accesses. Almost all STM runtimes disallow concurrent transactional and non-transactional access
to the same location, but the notion of a “location” varies from one STM to another. In many STMs,
a location is a single or double word. Thus, if a local variable that is accessed non-transactionally
happens to lie in the same physical word with a transactional variable, the system may function
incorrectly. Some other STM runtimes, like SkySTM [20], provide sub-word granularity: if a trans-
action writes a certain byte in a word, neighboring bytes can be safely written non-transactionally
at the same time. To handle such differences in granularity, the write set iterator also provides a
mask showing which bytes are affected. (For word-granularity TM runtimes, this mask will always
be all ones.)
The mask information allows a debugger to precisely determine whether a particular variable

49
was accessed by a transaction. This way, in the above example where a variable v that is accessed
non-transactionally is in the same physical word with a variable that is accessed by some transaction,
the debugger will show that v is accessed transactionally (thus indicating a bug) if the underlying
TM does not provide sub-word granularity with respect to non-transactional writes.
3.2.5 Usage Example: Viewing Data
As noted, logical values do not always represent the data from the point of view of the debugged
program, as they hide any tentative values that might have been written by the debugged transaction
to the examined variables. In terms of the functionality provided by tm db, the debugger can easily
present the data from the point of view of the debugged transaction by providing the user with the
logical value if the debugged transaction has not written the examined location, or with the value
returned by the write set iterator otherwise. We denote this as the transactional view of the data.
Note that when the underlying TM provides sub-word granularity with respect to non-transactional
writes, it is possible that only some of the bytes of an examined location were written by the debugged
transaction, in which case the debugger may need to combine some bytes of the value returned by
the write set iterator with bytes of the logical value. The following is an interesting example where
it may occur. Suppose that we have an array of Booleans:
bool flag [#threads]
Let Tx1 be a transaction that writes flag [1] transactionally, Tx2 a transaction that writes flag [2]
transactionally and T3 be a thread that writes flag [3] non-transactionally. Suppose the user asks to
see the value of the double word containing flags 0-7, at a time when Tx1 is the debugged transaction
and has not yet committed, Tx2 is committed but has not yet completed a deferred update to
flag [2] , and T3 has already executed the non-transactional write to flag [2] . The presented value
is assembled from the write sets of Tx1 and Tx2, as well as the memory updated in place by T3; it
is the library’s responsibility to build the logical value from the combination of flag [2] ’s value in
50
Tx2’s write set and the in-memory value of flag [3] , and the debugger’s responsibility to combine
the result with the tentative value of flag [1] returned by the write set iterator of Tx1.
Local variables present a slightly different challenge. Some TMs provide methods for a transaction
to write local variables without paying the overhead of synchronizion, but nevertheless guaranteeing
that changes will be undone if the transaction aborts. Isolation for these local writes is usually not
enforced because it is assumed that the written variables are not accessed by other threads. At
this point, the library provides no special support for local writes beyond the isolation guarantees
provided by the underlying TM. A user who examines a local variable accessed by another transaction
may observe the other transaction’s ongoing modifications to the variable. In practice, we do not
expect it to be a problem because the local, non-isolated write functionality is usually only used for
stack variables, which are only examined for the debugged transaction.
Finally, while it usually makes sense to present the transactional view of examined variables, it
is sometimes useful to override this functionality and examine the actual physical values in memory.
Privatization [35] is one such example, when a thread uses a transaction to isolate a region of memory,
rendering it inaccessible to other threads, and then accesses it non-transactionally. If, when accessed
non-transactionally, the logical values in the memory region differ from those in memory, perhaps
because some transaction is still in the process of writing committed values to the region, then
this non-transactional access is unsafe.8 Comparing the transactional and the physical views of the
memory region will reveal such an unsafe access. Indeed, the debugging functionality added for
transactional programs in dbx presents the transactional view of the data by default, but also allows
turning off this functionality and displaying the in-memory value like with a regular program.8 Such an unsafe access may happen either because the underlying TM does not provide appropriate implicitprivatization support, or because the program’s logic to isolate the memory region is flawed.

51
Event name Trigger Reporting Monitoring Report timeTxBegin Tx begins Reporting thread Reporting thread immediate
Tx Type: first, retryTxCommit Tx committed Reporting thread Reporting thread immediateTxAbort Tx aborted Reporting thread, Reporting thread, immediate
Abort reason: Abort reason- reads-invalid,- writes-invalid,- timeout,- self-abort
TxAbortOther Tx aborts another Reporting thread, Reporting thread, immediate orAborted thread, Aborted thread, deferredConflict type: Conflict type- read-write,- write-read,- write-write
Figure 3.4: Transactional Events. For each event type the table describes the triggering condition (inthe Trigger column), the reporting parameters (in the Reporting column), the monitoring parameters(in the Monitoring column), and whether the reporting is immediate or deferred to commit time (inthe Report time column).
3.2.6 Transactional Events
One of the important features of a debugger is to allow the user to track and stop when various
events occur. A breakpoint allows stopping when the “executing a given instruction” event is about
to occur; a watchpoint corresponds to the “accessing a given location” event, and so on.
Transactional programs introduce new event types that the user may want to track or to trigger
breakpoints on. Figure 3.4 shows the four basic event types that can be monitored by tm db. When
an event is triggered, information is reported to the user in the form of reporting parameters. For
example, all events report which thread triggered the event. TxAbort reports why the transaction
aborted: whether a conflict was triggered with earlier reads or with earlier writes; whether the abort
is due to a timeout waiting to access an address (which address?), or did the transaction explicitly
abort itself. TxAbortOther reports which other thread was aborted, and why (type of conflict).
One of the goals of tm db is to introduce minimal intervention until an event of interest occurs.
This is especially important when debugging multithreaded programs, where any intervention may
cause a bug to disappear. One way to achieve this goal is to filter events in the TM runtime using

52
monitoring parameters. With such filtering functionality the debugged thread is not stopped until
the event happens with the specified value of the monitoring parameters. For example, stop only
when a transaction of a given thread is aborted, or aborted for a specific reason. This runtime
filtering mechanism helps users narrow down the specification of the event they would like to track,
and avoid interrupting the program until it occurs. Figure 3.4 shows the supported monitoring
parameters for each event type.
Finally, sometimes it makes sense not to halt a triggering transaction immediately, but rather
to wait until the transaction is committed or aborted. For example, we noticed that when one
transaction aborts another, stopping immediately often causes the aborting transaction itself to be
aborted, presumably because there is a long delay between when the triggering thread is stopped
and the time that the other threads are stopped. Also, like with delayed breakpoints (Section 2.4.5),
deferring the breakpoint may reveal a more complete picture of the transaction that triggered the
event. On the other hand, some data not accessed by the transaction may be out of date. For these
reasons, TxAbortOther reporting can be either immediate or deferred.
3.2.7 Scopes
A monitoring scope is another runtime filtering tool provided to reduce the number of times a
debugged program needs to be halted. With scopes, a particular event can be monitored for a
specific duration. In particular, a thread T can monitor an event E in one of three scopes: in
the default scope, occurrences of E by any of T’s transactions are reported; in the until-success
scope, only occurrences of E by T’s current logical transaction are reported; and, in the transaction
scope, only occurrences of E by T’s current physical transaction are reported. Monitoring of E is
automatically canceled when a thread exits the monitoring scope, without stopping the debugged
process.
Here are some usage examples. Once the debugger has stopped inside a transaction, we can
resume execution and stop again if and when the debugged transaction aborts (monitoring TxAbort
53
in transactional scope). Or, by using both monitoring parameters and scopes, we can stop if the
logical transaction aborts involuntarily (monitoring TxAbort for any reason but self-abort in the
until-success scope). Scopes are useful also within the debugger itself. For example by monitoring
TxAbort in transactional scope, the debugger can notify the user if the debugged transaction is
aborted when leaving the lexical scope by “stepping up” from a function to its caller.
In the future, scopes could be combined with additional support to allow placing monitoring
commands in the user program to provide powerful debugging capabilities. For example, if we want
to stop only if an execution of a given atomic block aborts, we can add a command to monitor TxAbort
in the current thread, until-success scope, at the beginning of that atomic block. We can further
narrow the monitoring by restricting the reason for the abort (which is a monitoring parameter of
the TxAbort event). We can provide delayed breakpoints (Section 2.4.5): stopping when and if a
transaction that executed a given instruction commits, instead of when the instruction is executed.
This is done by adding a command to monitor TxCommit for the current thread in transactional
scope right after the instruction in the program code. (We use the transactional scope rather than the
until-success scope because if the transaction is aborted the instruction may not be executed again
when the transaction is retried.) We can also support assertions, tests that an atomic block does
not violate an invariant, by asserting the invariant inside the atomic block, and if violated, execute
a command to monitor TxCommit for the current thread in transactional scope. The invariant is
evaluated as part of the transaction, and is thus consistent with the committed transaction’s view
of the data.
While the functionality of changing the user code to include such monitoring commands may
not be available in most commercial debuggers today, we hope that by supporting scopes we will
allow quick development of advanced debugging features (like delayed breakpoints) when and if this
functionality becomes available, and maybe encourage its development.

54
3.3 Debugging Infrastructure Design
In this section, we describe how we designed the tm db library to provide debuggers with a TM-
independent interface for transactional debugging, and TM runtime designers with a simple, well-
defined interface for transactional debugging support. Here we only focus on the high level design
guidelines of tm db; A full description of the library’s API is available at: http://www.cs.brown.
edu/people/levyossi/Debugging/libtmdb.pdf.
3.3.1 Overview
Two processes are involved in debugging a program: the debugger process, which runs the debugger
code, and the target process, which runs the executable being debugged. These processes run in
different spaces: the debugger cannot simply access variables and addresses in the target space
through pointers, but must rather use some kind of inter-process communication.
Many debuggers export the ability to access the target process space via the proc service inter-
face, defined as part of OpenSolarisTM [34]. This interface provides basic accessibility to a process’s
space, including the ability to look up symbols (e.g. finding the address of a global variable), and
to read and write memory and registers.
The proc service (or a similar) interface is implemented by debuggers such as dbx, TotalView R©,
and gdb to provide external libraries, like libthread db and librtld db , the ability to access the
target process. In this way, the debugger can out-source the implementation of some debugging
functionality to external helper libraries.
3.3.2 Design
Figure 3.5 shows the structure of our solution.
We implemented tm db as an external helper library that lives in the debugger process space, and
provides the debugger with the functionality described earlier. It uses the proc service interface for

55
Debugger (e.g. dbx)
SkySTMRDM
tm_db
Debugger process spaceTarget process space
SkyS
TM
Run
time
RTDB SupportLayer
UserProgram
proc
_ser
vice
prov
ider
Figure 3.5: Debugging with tm db
access to the target process, similarly to other external debugger helper libraries, such as libthread db
for functionality related to threads, and librtld db for functionality related to the run-time linker.
Our library can thus be used by any debugger that implements a proc service provider.
A Remote Debugging Module (RDM) is the part of the debugging solution that depends on the
particular TM runtime. Each TM runtime that supports debugging provides its own RDM that
lives in the debugger process space, and accesses the target space through the proc service interface
to provide debugging support for that particular TM runtime. When the debugger starts debugging
a program, tm db accesses the debugged process to determine whether the program is using a TM
runtime that supports debugging, and if so, to dynamically load the appropriate RDM. The RDM
provides TM designers a well-defined interface for providing debugging support for their TM.
So far, we have implemented eight RDMs, to support debugging of transactional programs that
use one of eight variants of the SkySTM runtime: easy versus lazy conflict detection, visible versus
invisible reads, and privatization enabled or disabled. These RDMs are open-source to help other

56
TM runtime designers provide their own RDMs.9
Finally, in the target process space, the TM runtime is augmented with a runtime debugging
(RTDB) support layer. This layer has two purposes. First, when a program is loaded, it indicates to
tm db which RDM to load. Second, once an RDM is loaded, it provides the information and func-
tionality required to implement the various debugging features. For example, the RDM configures
the RTDB support layer with which transactional events to track, and the RTDB support layer is
responsible for the runtime filtering and event reporting, and so on.
Discussion
The tm db library is really a proxy between the debugger and the RDMs. This additional layer allows
us to simplify the RDM implementation by moving common functionality to tm db. For example, as
we describe in Section 3.4, SkySTM’s RDMs are stateless: they do not store any information about
the TM runtime, debugging session, and so on. In addition, we can move functionality between
the debugger and tm db without affecting all the RDMs. Having the debugger interface to a single
module instead of many RDMs should make it easer to deliver and maintain the RDMs as part of
the TM runtimes they support.
Note that the main reason for having a TM dependent component in the debugger process space
is that the proc service provider only allows basic access functionality to the debugged process. If,
for example, it was easy for tm db to call functions of modules in the debugged process space, then
we could have united the RDM and the RTDB functionality into a new united component (living
in the debugged process space), and have tm db communicate with this new component using a
TM independent API. But since proc service only provides low-level communication functionality
(mostly reading and writing memory and registers of the debugged process), our design splits the
TM specific functionality between two modules — one that lives in the debugged process space (the
RTDB layer), and one that lives in the debugger process space. The RDM is thus simply an agent
9 See http://www.cs.brown.edu/~levyossi/Thesis/ and Chapter 5 for details.

57
of the TM runtime that lives in the debugger process space, allowing tm db to use a simple, function
based API when querying the TM runtime for debugging information. Therefore, while our design
defines the interface between the debugger and tm db, and between tm db and the RDM, it does not
constrain the interface between the RDM and the RTDB, nor does it dictate how the functionality
should be split between the two modules. The TM designer is in the best position to pick the right
balance between overhead to the runtime and complexity of the RDM.
3.3.3 Supporting Partial Functionality
Not all TM runtimes can support all the debugging features described in Section 3.2. For example,
many STMs, including SkySTM [20], do not keep track of the exact addresses read by a transaction.
With these runtimes, we cannot check whether an address was accessed by a transaction, but we
may still be able to check whether that address is covered. As another example, the TL2 STM
provides an optimization with which read-only transactions do not keep any information about
their transactional reads. For these transactions, even read coverage information is not available.
A more interesting example is that of STM runtimes that may not be able to determine whether
some transactions have already committed. These STM runtimes typically do not lock their read
set and thus cannot guarantee that the locations they have read are not modified while attempting
to commit. Instead, when trying to commit, a transaction must read-validate its read set, checking
that the locations it read have not changed since the start of the transaction. With such an STM, a
transaction takes effect at the beginning of the read validation only if the read validation completes
successfully. Thus, if a transaction is stopped during the read validation, it is undetermined whether
it has already committed or not. While this may not matter when stopping at normal breakpoints,
which are placed in user code and will thus never stop a thread during its read validation, this
problem may arise when switching to another thread, that might be at an arbitrary point of a
transaction execution.
To help dealing with such missing functionality, the RDM interface provides various error codes

58
to allow an RDM implementation to indicate that a feature is not supported, either temporarily
(for example, it cannot determine this transaction’s status at this point), or permanently (it cannot
report read values for transactions). Different debuggers may handle these error codes in different
ways; for example, when stopping at a point when it is (temporarily) unknown whether a transaction
has committed, some debuggers may choose not to expose this fact and instead step the thread to
a safepoint where the status is known again. In addition, having error codes to support partial
functionality allows TM designers to initially provide an RDM that only supports a particular
subset of the debugging features, and add support for more features over time as found necessary.
3.3.4 The Import Interface
Our solution will be useful only if debuggers can use the library to provide appropriate commands
for debugging transactional programs. As noted, preliminary transactional debugging support is
already implemented in Sun Studio dbx using tm db, and we expect it will be available to the public
soon. Note, however, that the code interfacing tm db inside dbx is not likely to be open source, and
thus it will not be possible for researchers to change existing and add new debugging commands.
To address this issue, and to ease gradual integration of transactional debugging support, we
provide some functionality using a special dbx interface, called the Import Interface. The Import
Interface enables one to add new commands to dbx without changing and recompiling the dbx code.
This is done by letting an external shared library register new commands and functions to implement
them, and then importing the library into dbx using the dbx import command. Such an external
library cannot access the dbx internals, but it can use other external libraries like tm db, already
loaded in dbx. Thus, using the Import interface, we can provide an additional module with tm db
that will be imported into dbx and provide some additional, experimental debugging features. Such a
module can be open source, and thus allow researchers to experiment with modifications or addition
of new debugging commands, and provide an example for the designers of other debuggers of how
to use the tm db library.

59
3.4 Debugging support for an STM runtime
This section describes our experiences implementing RDM and RTDB support layer for the SkySTM
runtime. While these issues are interesting in and of themselves, they also shed light on what it
might take to adapt other STMs.
3.4.1 Overview
In principle, writing an RDM is a simple matter of writing remote accessor functions for data stored
by the TM runtime and the RTDB support layer. In particular, the RDM uses the proc service
interface to access the target process’s memory. It can locate the (remote) addresses of global
variables, read from these addresses, and thus trace pointers in the target process until it reaches
its goal.
We designed the interface between the RDM and tm db so that the RDM can be stateless. In
particular, the RDM provides tm db with the set of threads that can run transactions, and for each
such a thread, it provides a TM-specific key, opaque to tm db, that is passed back to the RDM
when tm db queries it for thread-specific information. For SkySTM, we set the key to be a pointer
to (remote) thread-private metadata. This way, the RDM does not need to keep track of debugging
sessions, because all such state resides in tm db.
Overall, SkySTM supports all of the debugging features described in Section 3.2, except for the
ability to iterate through a transaction’s read set, or to test whether a particular address was read
by it. (The read coverage test is still supported for all transactions.) This support is provided with
minimal overhead to the TM runtime: even with a microbenchmark that consists of only very small
transactions, the runtime overhead (when the debugger is not attached) is less than 5%.

60
3.4.2 Computing Logical Values
SkySTM, like many other STM runtimes [8], uses deferred updates, meaning that transactional
updates to shared memory are buffered in a thread-local buffer, which is written back after the
transaction commits. There is thus a window of time in which the physical values (in memory) of
locations written by the transaction do no reflect their logical values. During this time, however,
the transaction holds exclusive write ownership of these locations.
Therefore, to compute the logical value of a location L, the SkySTM RDM can use the following
simple algorithm:
• If no committed transaction holds exclusive write ownership of L, return the contents of L.
• Otherwise, if T is the committed transaction holding write ownership, search T’s write set for
L. If found, return the value from the write set, possibly combined with the actual contents of
L if T did not write all of L’s bytes. If not found, T covers L but has not written it, so return
the contents of L.
Finally, as noted in Section 3.3.3, it may not always be possible to determine whether the transaction
that holds write ownership of L, has already committed. In that rare case, we simply return a not
currently available error code.
In future releases, we may instead support some kind of safe-point mechanism, where the RDM
advises the debugger when the transaction is in an “unstable state”, and allows the debugger to step
it through to a point where the transaction status is unambiguous. Furthermore, if the RDM can
assume that the debugger will always step a thread to a safe point, many parts of its implementation
would be significantly simplified. For the current version of the library, however, we did not make
such assumptions, and wrote the RDM assuming that the debugged process may be stopped at any
point.

61
3.4.3 Monitoring Events
Event monitoring and filtering in SkySTM is safe and efficient. Monitoring is done on a per-thread
basis. Each thread keeps a bit-mask, called the monitoring command, indicating which events should
be reported. Each combination of an event plus monitoring parameter value (such as “aborted due
to invalid reads”) has its own bit in the monitoring command.
When an event occurs, a fast-path check tests whether the monitoring command is all-zeros (true
whenever monitoring is off, such as when no debugger is attached). Otherwise, the specific bit for
the event is checked, and if on, the event is reported. An event is reported by calling an appropriate
stub for the event – an empty function in the runtime that the debugger places a breakpoint on.
The values for the reporting parameters are passed as arguments to the stub.
To support scopes, the runtime must turn off event monitoring on scope exit. To do that, we
keep two additional bit-masks, one which indicates the bits of the monitoring command that should
be cleared when the physical transaction ends, and one for those to be cleared when the logical
transaction ends. Updating the monitoring command when a transaction ends is thus a simple
matter of applying the appropriate bit-mask to the monitoring command, and is only done when
some event is monitored in a non-default scope (i.e. one of the masks is non-zero).
3.5 Concluding Remarks
The tm db library takes a first step toward providing systematic support for debugging transactional
programs. It provides only the basic, essential features. We expect that experience debugging real
transactional programs will lead to development of additional debugging features, built on top of
the basic library.
For example, adding the watchpoints functionality described in Chapter 2 can assist in detect-
ing an incorrect interaction between transactional and non-transactional access to a variable. With
transactional watchpoints, the user can place a watchpoint on a variable that is supposed to only

62
be accessed non-transactionally, asking the debugger to stop if and when a transaction accesses it.
Moreover, in some cases the allowed access to a memory location may change at runtime from trans-
actional to non-transactional when the program uses a privatization technique to make a particular
memory chunk private, and then access it non-transactionally. In these cases, the user may want to
dynamically enable a watchpoint on a location when it becomes private, in order to detect a faulty
program logic that results in a transactional access to a private location (which may be accessed
non-transactionally at the same time). The ability to dynamically enable and disable watchpoints
can be provided, for example, by a debugging API that the user, or maybe even the debugger, can
use in an atomic block to set a watchpoint on the privatized location.
Lessons Learned
To this point, we have had only preliminary debugging experience with tm db, but we have already
learned a few lessons about the properties STM runtimes should have to improve the debugging
experience for their users.
First, we learned that supporting a read iterator that provides information about the locations
read by a transaction would be extremely useful. Suppose, for example, that the user stops at the end
of an atomic block that traversed a tree data structure. If the addresses read by the transaction are
known, users will be able to examine the tree in the debugger, while the debugger is showing which
nodes of the tree were accessed. In other words, users will be able to reconstruct the traversal done
by the transaction even though they only stopped at the end of it. Moreover, with the combination
of logical and tentative values, the user will be able to see exactly what changes the transaction has
done to the tree.
A second lesson that we learned is that when the user stops inside the atomic block, unless the
transaction is in Invalid state and can no longer commit successfully, the logical value of all locations
the transaction has read should match the value observed by the transaction. This property will
make it much easier for users to reason about the state of the program that relates to the execution

63
of the atomic block, as they would be able to examine any variables accessed by the atomic block
and see the values that were read. If the transaction is in Invalid state, the values of the variables
is less important because the transaction will have no effect, and the user can step through the
re-execution of the atomic block that will follow.
Note that some STM algorithms do not guarantee this property of having the logical values match
the values observed by the transaction as long as it can commit successfully. For example, some
STM runtimes support an optimization that makes read only transactions seem to take effect at
the time of their first read operation [8], before some of the atomic block’s statements are executed.
With this optimization the user may stop at a point in which the values observed by the transaction
are no longer consistent with the current memory state (as reflected by the logical values), but the
transaction may still commit successfully as long as the observed values are consistent with the state
of the memory at the point of the transaction’s first read. Moreover, this optimization makes it
impossible to determine whether the transaction has already committed at the time of its first read
until the atomic block execution is over. Therefore, users may not know whether the transaction
has already committed when stopping inside an atomic block, or be able to rely on the values of
variables they examine being consistent with those seen by the transaction.
We hope that these and future lessons learned when using the tm db library will help TM runtime
designers to keep the debugability of their system in mind when considering various STM algorithms
and optimizations.
Higher Level Debugging Support
It is important to note that even though the tm db library exposes many details on the transactions
in the system, in some cases this information may only be used by the debugger and not exposed to
the user.
For example, the debugger can easily step over the execution of an atomic block by tracing
the TxCommit and TxAbort transactional events. Because tm db provides information about the

64
latest transaction of each thread even after it is completed, users may still be able to see various
information about the atomic block’s execution, such as its read and write sets.
As another example, some users may not care about physical vs. logical transactions; after
all, from the user’s point of view, there is only one transaction that matters in each execution
of an atomic block: the one that commits it successfully. The debugger can avoid stopping at a
breakpoint if it finds out that the physical transaction is Invalid or Aborted, or even keep stepping
the thread in isolation throughout the retrying transaction, and stop at the breakpoint if and when
it is hit again by the retrying transaction. The debugger can avoid retrying the transaction forever
by examining the IsWaiting information to verify that the debugged transaction is not blocked
by another transaction. If it is blocked, and the address for which it is waiting is available, the
debugger can use the coverage information to find out the set of threads that cover the address,
and step them to completion. With such a debugging functionality, users may not care to see the
physical transaction index in the transaction ID, as any transaction they will ever stop at could be
uniquely identified by the thread id and the logical transaction index.
We believe that the relatively low level interface of tm db will provide debuggers the flexibility
of supporting both high and low level debugging experience.

Chapter 4
T-PASS: A Profiler for
Transactional Programs
T-PASS (Transactional Program Analysis System) is a profiling system for transactional programs.
It is intended to help improving and better designing transactional programs, as well as the trans-
actional memory runtimes that support them. We describe the profiling system’s functionality, and
the rationale for its design. T-PASS is designed to work with the SkySTM runtime, which can be
configured to run a range of conflict detection and contention management strategies. T-PASS can
also be integrated with a transaction-aware debugger. We describe a novel technique for exploiting
the TM runtime to replay profiled transactions, including aborted transactions. We believe that
T-PASS demonstrates that transactional programs can be profiled more easily and more effectively
than programs based on locks and conditions.
65

66
4.1 Introduction
In this chapter we shift the focus from debugging to profiling of transactional programs. Unlike
debugging, which focuses on fixing problems in the program that may result in incorrect behavior,
the purpose of profiling is to understand and improve the performance of the program. While
Transactional memory (TM) promises to make writing scalable multithreaded programs easier, it is
clear that even with TM it is still a challenge to design and implement scalable concurrent algorithms.
Making algorithms scalable often requires a detailed understanding of how the program is structured,
and how different parts of the program interact.
Indeed, there has been significant interest recently in good profiling tools for transactional pro-
grams, even more than for a debugging tool. The reason for this is that many transactional programs
were converted from lock-based programs by simply replacing critical sections with atomic blocks.
In such cases, assuming that the original lock-based program is correct, there is usually no need
for intensive debugging to get a correct transactional program. However, because the critical sec-
tions were never designed to run concurrently, they often share data unnecessarily, resulting in a
non-scalable transactional program that performs poorly.
We claim that the structured nature of TM makes performance profiling easier than with con-
ventional synchronization. Because the TM runtime manages synchronization, it is possible to track
runtime conflicts and dependencies in a much finer granularity than that of the atomic blocks in
the program. A good profiling tool encourages a methodology in which the programmer starts with
a simple and correct coarse-grained solution, and successively refines it in response to performance
bottlenecks revealed by profiling. Profiling makes it possible to focus efforts on those parts of the
program that would benefit from refinement, without wasting resources on those that would not.
Here are some simple ways in which a profiler can help tune performance for transactional
programs:
• To reduce conflicts, the programmer might consider breaking large atomic blocks into smaller

67
blocks. Profiling can help decide when it is worthwhile to do so.
• To reduce synchronization overhead, the program may privatize data by rendering it inac-
cessible to other threads [35], and then process the data without synchronization. When
processing is complete, it could make that data accessible again. Profiling can help distinguish
when privatization would enhance performance and when it would not.
• Many TM systems are subject to false conflicts: data items that are logically distinct may be
treated by the TM runtime as a single synchronization unit. Profiling can detect which false
conflicts affect performance, and help fixing them.
• Some TM runtimes can be configured in different ways [20], by detecting conflicts eagerly or
lazily, or choosing different contention management policies. Profiling tools can help to choose
the best way to configure a TM runtime for a given application.
In addition, because TM is still an open research area, profiling information can help improving
not only particular transactional programs, but also the TM runtimes and compilers that support
them. As noted, there are many different STM algorithms, and it is not clear that there is a single
algorithm that will fit best the needs of all transactional programs. Profiling information can address
questions such as when it makes sense to detect conflicts eagerly and when lazily, and help build
TM runtimes and compilers that better adjust to the transactional program that they are running.
The T-PASS Prototype
We present T-PASS (Transactional Program Analysis System), a prototype system for profiling
transactional programs. We describe the system’s functionality, and the rationale for its design.
T-PASS is developed to work with the SkySTM runtime [20], a software transactional memory
system that can run a range of conflict detection and contention management policies. T-PASS
uses the Dynamic Tracing framework provided by DTrace [1] to collect and aggregate the profiled
data, together with a sampling mechanism to reduce profiling overhead. Preliminary experiments

68
suggest that in the worst case, for programs that consist entirely of transactions, T-PASS imposes
a low overhead: about 3-4% when the profiler is not attached, and about 10% when the profiler is
attached and profiling data is collected.
T-PASS collects data in four categories. First, it captures basic information from single-threaded
runs, such as: How many transactions were executed for each atomic block? How much time was
spent in each atomic block? How large was each transaction’s data footprint?
Second, it captures the cost of contention in multi-threaded runs, such as: How much time was
spent doing useful work in committed transactions, and how much was contention overhead, such as
time executing aborted transactions, or waiting for other transactions? How long did each atomic
block take in the presence of contention? How many times did it retry?
Third, it provides data to analyze conflicts, such as: Which accesses (instructions) caused con-
tention by forcing transactions either to abort or to wait? Which sets of locations conflicted with
each other? Which instructions accessed these locations? Identifying contending instructions and
locations helps distinguish true conflicts from false ones.
Finally, because of the different nature of transactional programs, some memory accesses may
induce unnecessary high overhead, and even impede scalability (for example, a transactional write
that does not change the value of the written object). T-PASS helps to identify these memory
accesses and provide guidance for how (and whether) to avoid their high overhead.
T-PASS encompasses a JavaTM front-end for displaying and navigating the collected data. We
support many queries, such as which atomic blocks formed the longest transactions, or which accessed
the largest data set. Is the total time spent executing a particular atomic block dominated by a few
long transactions? There are many other possible queries.
Another interesting direction that we explore is how debugging and profiling can be combined
to provide further information to the programmer. For example, one could use the profiler to
identify the longest-running transactions, and examine them with the debugger. T-PASS supports
this feature, allowing the programmer to specify conditions on the profiled data under which the
69
program should be stopped and examined with a debugger. Furthermore, we present a new technique
that allows the debugger to replay the profiled transaction to examine its step-by-step execution.
The rest of the chapter is organized as follows. Section 4.2 introduces basic concepts and termi-
nology. Section 4.3 describes the profiling information that T-PASS provides, demonstrates how it is
presented to the user, and provides examples for how it may be used when optimizing a transactional
program. In Section 4.4 we describe the system’s design, and In Section 4.5 we explain how T-PASS
can be used with a debugger, and how to provide the replay functionality for profiled transactions.
4.2 Basic Concepts and Terminology
Data and Metadata
As noted, TM runtime systems typically control access to user-level data items with metadata,
which we call ownership records [5]. Multiple data items are often controlled by the same ownership
record. In general, the coarser the mapping between data and ownership records, the less overhead
to manage the transaction’s access information, but the higher the likelihood there will be false
conflicts, which may hurt scalability.
The mapping between data and ownership records is internal to the TM runtime implementation,
and typically not part of the programming model. Nevertheless, because of the aforementioned trade-
off between the TM mechanism overhead and the scalability that it provides, and because of the
need to identify false conflicts, effective profiling requires basic information about this mapping, such
as whether two data items are controlled by the same metadata, or the ratio between the number
of data and metadata items accessed.
Atomic Blocks, Logical and Physical Transactions
As described in Section 3.2, we identify transactions in three levels: the atomic block level, the
logical transaction level, and the physical transaction level.

70
All three levels are useful for profiling. At the atomic block level, it is useful to know how many
times each one was executed, how much time was spent in each atomic block, and how big was the
data set accessed by transactions of each block. For each logical transaction, it is useful to know how
many physical transactions it took to execute it, how long the execution was, and how that length
compares to that of the last physical transaction that completed it. For each physical transaction,
it is useful to know how many physical transactions have failed due to a conflict on a particular
set of addresses, and how much time was lost by these conflicts (the duration of the failed physical
transactions and the time spent waiting for other transactions). T-PASS provides information in all
three levels, and a wide range of queries to correlate between them.
Sampling and Filtering
To keep the profiling overhead down, and to perturb the transaction interleaving as little as pos-
sible, we profile only a small fraction of the transactions, chosen uniformly at random from either
the physical or the logical transactions. We note that a uniform sample of the logical transactions
can be obtained from a uniform sample of the physical transactions by dropping the failed physical
transactions from the sample (as each logical transaction has exactly one successful physical trans-
action). When using this method, however, we only see the information reported by the last physical
transaction of each logical transaction in the obtained sample.
To make sense out of the data collected, T-PASS provides a front-end with the ability to further
narrow the sampled data, and to run sophisticated queries against it. For example, the front-end can
be configured to show only the distribution of logical transaction sizes for a particular atomic block.
The results can be further filtered to show only the data for logical transactions whose execution
time is longer than a particular value, or for logical transactions that exceeded a certain number of
retries. In the next section we describe in detail what data T-PASS presents to the user, and the
filtering functionality that can be applied to it.

71
Figure 4.1: Number of executions and total time for atomic blocks
4.3 What to Profile
T-PASS organizes the displayed data into four categories. Here we describe each category, and the
queries and filtering features that they support. All graphs presented here are snapshots from the
profiling front-end. Due to the dynamic nature of our prototype, we were limited to showing only a
few examples. More detailed examples are available in demo videos at:
http://www.cs.brown.edu/people/levyossi/profiling.
4.3.1 Basic Characteristics
The first category encompassing information not directly related to concurrency, and is usually
collected for an execution where transactions are not interfering with each other, for example like
in a single threaded execution. The profiler collects basic information about each atomic block as
it is executed, helping to identify performance bottlenecks such as long transactions that dominate
the execution time, as well as transactions with a small data footprint that may be candidates for
hardware acceleration on platforms that support hardware transactions of limited size [7].
The first two charts in the report for this category describe how many times each atomic block

72
was executed, and how much time was spent in each. Figure 4.1 shows these charts for a single-
thread execution of a small hash table program. Each atomic block corresponds to one of the table
operations: Insert (), Remove(), or Member(), and has a section in the pie charts. We identify an
atomic block by its first instruction, just like the tm db library does. From this report we can deduce
that on average, Insert () and Remove() operations take longer than Member() operations because
the latter represents a smaller slice of the time distribution pie than in the transaction count pie.
The report also displays the distribution of transaction sizes. There are two metrics of interest:
the number of unique locations accessed, and number of ownership records (metadata) acquired by
the transaction for reading1 and writing.
Figure 4.2: Distribution of transaction sizes
Figure 4.2 shows the transaction size distributions according to these two metrics. In both bar
charts, each bar corresponds to a different size category. In the first chart, the categories are labeled
with a pair of values [W,R], denoting the number of ownership records that were acquired for writing
and for reading. In the second chart, the categories are labeled with a triplet [W,R,RAW ] denoting
the number of unique locations that were written (W ), read (R), and read-after-written (RAW ).
We separate reads-after-writes from regular reads because many STM runtimes implement them
differently, for example because of the need to look up the value in a write buffer when the deferred
updates method is used.1The SkySTM run-time [20] acquires ownership records for reads as well as for writes. While not all TM run-timesdo this, almost all pay an overhead proportional to the number of metadata items associated with a transaction’sread set.

73
Figure 4.3: Distribution of transaction sizes filtered for an individual atomic block
The bar height shows how many transactions of each size were monitored. In addition, the graph
also displays a curve showing the total time spent executing transactions of each size category. The
Y values for this curve are presented on the right Y axis, while the values for the bars are presented
on the left Y axis.
With the combination of the bar chart and the curve, the user to tell whether the bulk of the
execution time was spent on a few large transactions, or on many small ones. This information is
especially valuable for evaluating the potential benefit of running some of the program’s transaction
using HTM, which may only be capable of running transactions up to a certain size. In this example
we can see that even though approximately 60% of the transactions were read-only (the first two
bars in the chart), they only stand for less than 45% of the execution time: most of the execution
time was spent on the larger, non read-only transactions.
To correlate the transaction size information to the user code, it is often necessary to see the
distribution of transaction sizes for an individual atomic block. This information is accessible by

74
Figure 4.4: Distribution of transactions’ execution times
filtering the data by an atomic block. For example, Figure 4.3 shows the transaction size distri-
bution for the Remove() atomic block. The figure presents the same chart as in the right hand
side of Figure 4.2, but with bars broken by color to show what fraction of each was contributed by
transactions executing the Remove() atomic block (denoted as the “Filtered Tx” data series in the
labels). In this example, we can see that about half of the Remove() transactions were read-only
(reading two unique locations). This is because the hash table was initialized to contain half of the
keys in the range, so removing a random key in that range has a 50% chance of not finding the key
and leaving the table unmodified. The rest of the Remove() transactions wrote one location, and
read three.
The last chart in this report, shown by Figure 4.4, presents the distribution of transactions’
execution times. The figure shows that the vast majority of the transactions took less than 15µs, but
a few took longer than 50µs. Once again, this information may be valuable to evaluate the potential
benefit of using an HTM mechanism, as in some cases hardware transactions cannot survive a timer
interrupt and are thus limited to a certain execution length. Like the transaction size graphs, the

75
time graph can be filtered to focus on a particular atomic block.
While the most basic form of filtering is by atomic block, T-PASS supports many other kinds
of queries. For example, one can ask to see only transactions of a particular size or execution time,
by filtering by the corresponding bar in one of the bar charts; then one can see, for example, how
transactions of this size or length are distributed between the different atomic blocks. Similarly,
one can explore the relationship between the number of unique locations accessed and the number
of ownership records acquired by filtering for a particular number of ownership records, and so on.
The flexible filtering functionality can help the programmer pin down performance bottlenecks, and
find out the reason for the high overhead paid for them.
We believe that the reports in this category are useful for understanding basic characteristics
of the transactional program, and how it may be optimized. For example, if the execution time is
dominated by very long and large transactions, the programmer may consider privatizing some of the
data and accessing it non-transactionally; if an execution of a particular atomic block is dominated
by transactions of a small size, then it may be worth using techniques like HyTM [5], PhTM [24] or
TLE [6], which use best effort HTM when possible and resort to a software solution otherwise.
4.3.2 Contention Profiling
The second category concerns contention-related performance issues that arise when multiple con-
current threads access shared data. The report for this category represents data collected during a
multithreaded run, and is presented in terms of logical transactions. As in the previous report, a
pie chart shows how many logical transactions were profiled for each atomic block (not shown).
To see how much execution time was wasted on contention, the logical transaction’s time is
divided into three categories. Failure time is the duration between when the logical transaction
began, and when its last (successful) physical transaction began. It shows the time spent on failed
physical transactions, as well as any back-off time between them. Wait time is the time spent
by the last physical transaction on contention management, that is, on waiting for other conflicting
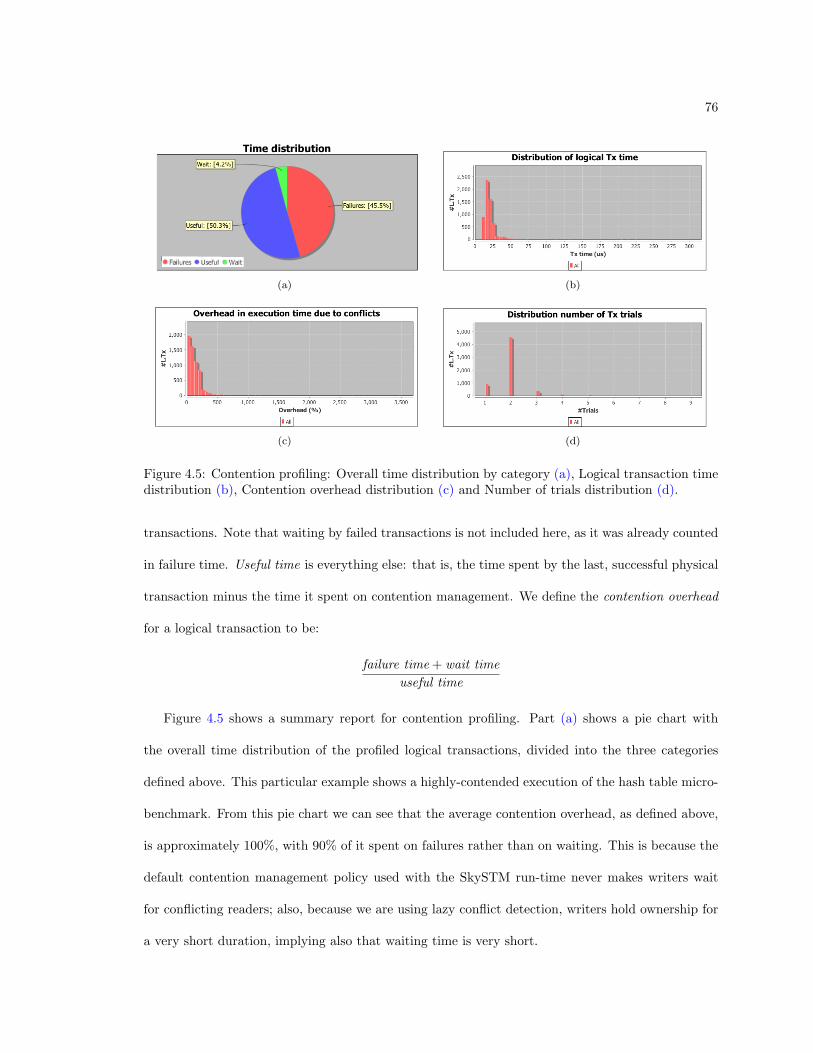
76
(a) (b)
(c) (d)
Figure 4.5: Contention profiling: Overall time distribution by category (a), Logical transaction timedistribution (b), Contention overhead distribution (c) and Number of trials distribution (d).
transactions. Note that waiting by failed transactions is not included here, as it was already counted
in failure time. Useful time is everything else: that is, the time spent by the last, successful physical
transaction minus the time it spent on contention management. We define the contention overhead
for a logical transaction to be:
failure time + wait timeuseful time
Figure 4.5 shows a summary report for contention profiling. Part (a) shows a pie chart with
the overall time distribution of the profiled logical transactions, divided into the three categories
defined above. This particular example shows a highly-contended execution of the hash table micro-
benchmark. From this pie chart we can see that the average contention overhead, as defined above,
is approximately 100%, with 90% of it spent on failures rather than on waiting. This is because the
default contention management policy used with the SkySTM run-time never makes writers wait
for conflicting readers; also, because we are using lazy conflict detection, writers hold ownership for
a very short duration, implying also that waiting time is very short.

77
Figure 4.6: Overhead distribution filtered for transactions with two trials
Parts (b), (c), and (d) show three distributions, each giving a different view of the profiled logical
transactions. Part (b) shows the distribution by execution time, Part (c) by contention overhead,
and Part (d) by the number of physical transactions (trials) behind each logical transaction.
These three distributions are quite correlated, but each can be useful in a different way. For this
reason, we support filtering by any one of the bars in these bar charts, answering queries such as
the distribution of overheads for a given logical transaction length, or how much of a given overhead
value is attributed to waiting and how much to failures. This allows identifying interesting outliers,
like the one in Figure 4.6, which shows the overhead distribution for transactions with two trials:
the overhead of the vast majority of the filtered logical transactions is indeed centered around 100%
(as expected for a transaction that had 2 trials), but there were also a very few transactions that
experienced an overhead of more than 1900%. In Section 4.5 we further investigate this observation
using the debugger.
Filtering can also be useful to correlate the contention overhead with the actual time wasted
on contention: a low contention overhead value for a long transaction may incur more cost than a
higher contention overhead for a short transaction. Finally, as for the previous category, we can also

78
filter for a particular atomic block, or apply multiple filters to further narrow the data being shown.
4.3.3 Conflicts Analysis
While the second category focused on the program behavior under contention, the third conflicts
analysis category focuses on the conflicts causing the contention.
Two accesses conflict when the TM run-time maps them to the same ownership record, and at
least one access is a write. A false conflict occurs when the conflicting accesses actually address
distinct variables that conflict only because they have been assigned to the same ownership record.
Each reported conflict has an associated set of read and write accesses executed by the reporting
transaction, which maps to the ownership record on which the conflict occurred. We group all
conflicting accesses by ownership record, each identifying a conflict set. Each individual access is
identified by the instruction that executed it, showing the user, for each conflict set, which user-level
instructions executed the conflicting accesses. The user can distinguish false from true conflicts by
checking whether these accesses are for the same variable.
Next we define the cost of a conflict. We say that a transaction won a conflict if that conflict
did not force it to abort (either because it aborted its rival transaction, or because it waited for
the rival to finish), and that the transaction lost the conflict if the conflict caused it to abort. If
the transaction loses a conflict, then the conflict cost is the physical transaction time, because the
transaction must be retried and that time is lost. If the transaction won, then the cost is the time
it waited for its rival (which may be zero).
Note, however, that it is not always possible to assign blame to a specific conflict when a trans-
action aborts. For example, a transaction may read from several data items, and later discover that
some of them have been modified. When this occurs, we divide the cost (that is, the physical trans-
action time) equally among all conflicted ownership records. Dividing the cost (instead of charging
the full cost to each) makes sense for two reasons. First, we want the cost to be additive: the
cost over all conflicts should sum to the total amount of time spent on conflicts by all the profiled

79
Figure 4.7: Number of conflicts and their costs for each conflict set.
Figure 4.8: Instruction conflict losses and wins (left), and conflict costs by instruction (right).
transactions. Second, we want to assign a greater weight to conflicts that were the only reason
for a transaction to abort, because resolving these conflicts is more likely to lead to performance
improvements.
To evaluate a conflict set, we look at two factors: the number of conflicts that occurred in each
conflict set, and the total cost of these conflicts. This is shown by the pie charts in Figure 4.7. The
pie chart sections, each corresponding to a different conflict set, are sorted by size to help the user
see whether a particular conflict set encompasses most of the conflicts, or dominates the contention
cost.2
To relate the conflicts to the accesses causing them, T-PASS provides the two additional charts
in Figure 4.8, with information on the actual accesses in the various conflict sets. In both charts,
each bar corresponds to a particular user-code read or write operation. For brevity, the X axis shows
only sequence numbers for these operations, and whether they are reads or writes; A separate table2 The conflict sets’ labels are unique IDs that internally identify the orec on which the conflict occurred; they maybe used in future debugging support.
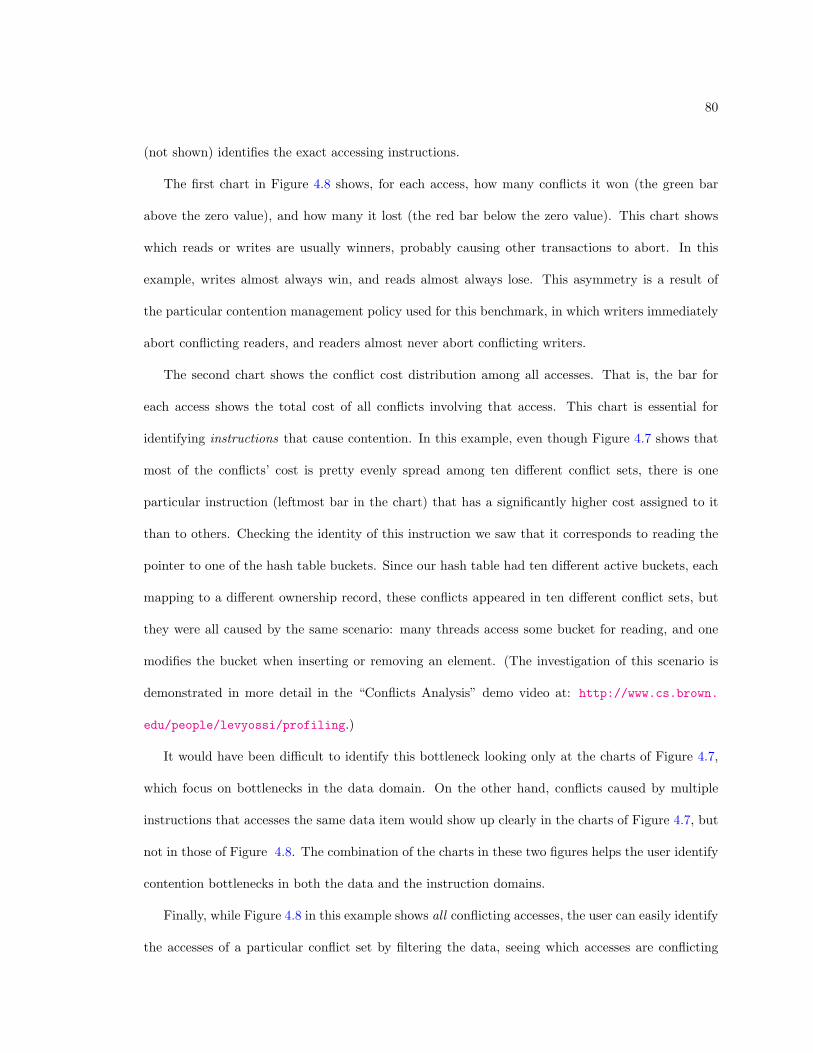
80
(not shown) identifies the exact accessing instructions.
The first chart in Figure 4.8 shows, for each access, how many conflicts it won (the green bar
above the zero value), and how many it lost (the red bar below the zero value). This chart shows
which reads or writes are usually winners, probably causing other transactions to abort. In this
example, writes almost always win, and reads almost always lose. This asymmetry is a result of
the particular contention management policy used for this benchmark, in which writers immediately
abort conflicting readers, and readers almost never abort conflicting writers.
The second chart shows the conflict cost distribution among all accesses. That is, the bar for
each access shows the total cost of all conflicts involving that access. This chart is essential for
identifying instructions that cause contention. In this example, even though Figure 4.7 shows that
most of the conflicts’ cost is pretty evenly spread among ten different conflict sets, there is one
particular instruction (leftmost bar in the chart) that has a significantly higher cost assigned to it
than to others. Checking the identity of this instruction we saw that it corresponds to reading the
pointer to one of the hash table buckets. Since our hash table had ten different active buckets, each
mapping to a different ownership record, these conflicts appeared in ten different conflict sets, but
they were all caused by the same scenario: many threads access some bucket for reading, and one
modifies the bucket when inserting or removing an element. (The investigation of this scenario is
demonstrated in more detail in the “Conflicts Analysis” demo video at: http://www.cs.brown.
edu/people/levyossi/profiling.)
It would have been difficult to identify this bottleneck looking only at the charts of Figure 4.7,
which focus on bottlenecks in the data domain. On the other hand, conflicts caused by multiple
instructions that accesses the same data item would show up clearly in the charts of Figure 4.7, but
not in those of Figure 4.8. The combination of the charts in these two figures helps the user identify
contention bottlenecks in both the data and the instruction domains.
Finally, while Figure 4.8 in this example shows all conflicting accesses, the user can easily identify
the accesses of a particular conflict set by filtering the data, seeing which accesses are conflicting
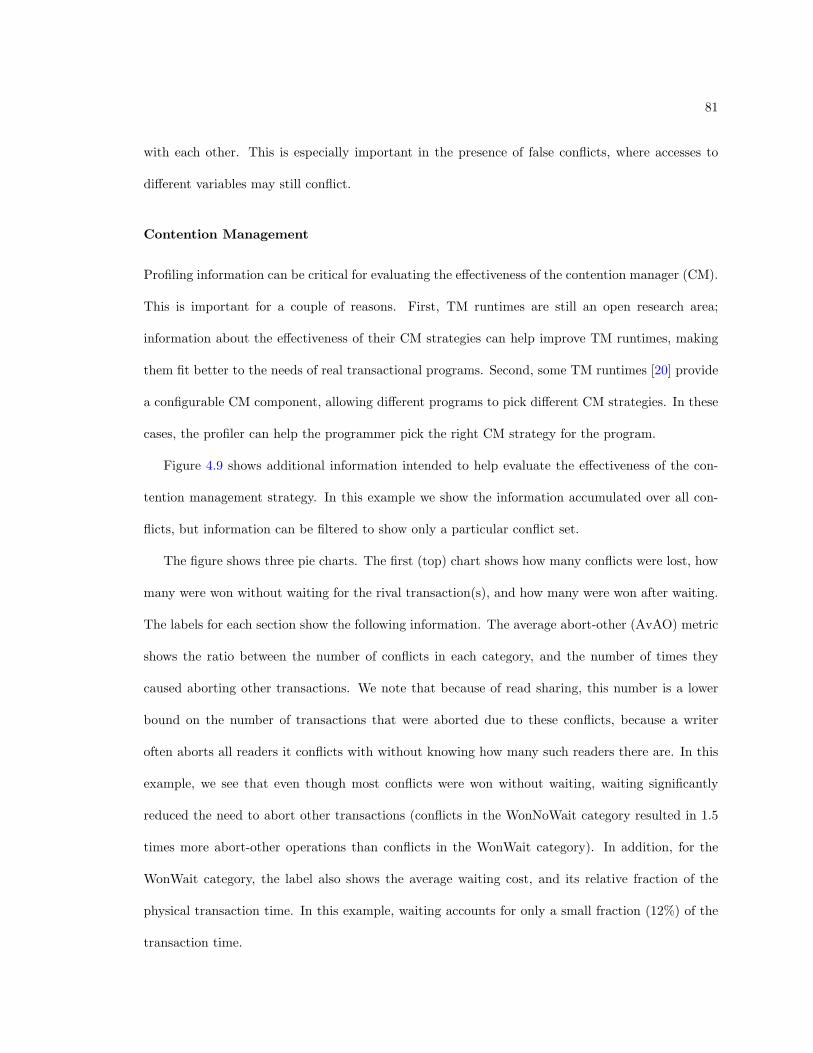
81
with each other. This is especially important in the presence of false conflicts, where accesses to
different variables may still conflict.
Contention Management
Profiling information can be critical for evaluating the effectiveness of the contention manager (CM).
This is important for a couple of reasons. First, TM runtimes are still an open research area;
information about the effectiveness of their CM strategies can help improve TM runtimes, making
them fit better to the needs of real transactional programs. Second, some TM runtimes [20] provide
a configurable CM component, allowing different programs to pick different CM strategies. In these
cases, the profiler can help the programmer pick the right CM strategy for the program.
Figure 4.9 shows additional information intended to help evaluate the effectiveness of the con-
tention management strategy. In this example we show the information accumulated over all con-
flicts, but information can be filtered to show only a particular conflict set.
The figure shows three pie charts. The first (top) chart shows how many conflicts were lost, how
many were won without waiting for the rival transaction(s), and how many were won after waiting.
The labels for each section show the following information. The average abort-other (AvAO) metric
shows the ratio between the number of conflicts in each category, and the number of times they
caused aborting other transactions. We note that because of read sharing, this number is a lower
bound on the number of transactions that were aborted due to these conflicts, because a writer
often aborts all readers it conflicts with without knowing how many such readers there are. In this
example, we see that even though most conflicts were won without waiting, waiting significantly
reduced the need to abort other transactions (conflicts in the WonNoWait category resulted in 1.5
times more abort-other operations than conflicts in the WonWait category). In addition, for the
WonWait category, the label also shows the average waiting cost, and its relative fraction of the
physical transaction time. In this example, waiting accounts for only a small fraction (12%) of the
transaction time.

82
Figure 4.9: Contention management information.

83
The second pie chart shows how cost is distributed between won and lost conflicts. (Conflicts
that win without waiting have zero cost, and do not appear.) The figure shows that the cost is
mostly due to lost conflicts, not to waiting. In particular, the average conflict cost for lost conflicts
is significantly higher than that for won conflicts. This makes sense because the previous chart
suggests that waiting accounts for only a small fraction of the transaction time, while losing a
conflict requires rerunning the entire transaction. The combination of these two charts suggests that
waiting more often before aborting the rival transaction(s) may help reducing the overall contention
cost, as it is likely to reduce the number of aborted transactions with a relatively low waiting cost.
The last (bottom) pie chart shows how many of the conflicts that were won were then followed
by a successful commit, and how many of them were followed by an abort. A conflict that was won
by a transaction that eventually aborts may have caused other transactions to abort unnecessarily.
In this example, almost all conflicts that were won were followed by a successful commit. This
observation is not surprising because transactions in our example are short and have few writes;
Because readers rarely win a conflict, and because the TM run-time uses lazy conflict detection and
acquires write ownership only when the transaction tries to commit, the window of vulnerability
between winning a conflict and finishing the transaction is very short.
4.3.4 Identifying Special Accesses
Not all data accesses are created equal. The profiler can flag several kinds of accesses that might
indicate unnecessary synchronization.
Write Upgrades
The first kind of flagged access is an upgrade, where a transaction acquires write ownership for a
data item for which it already has read ownership. Recall the scenario we previously described where
many threads read a pointer to a hash table bucket and then some tries to write it, aborting all other
readers (Section 4.3.3). This scenario is a common source of contention in transactional programs.

84
Sometimes, when it is known that the read acquisition is always (or even usually) followed by a
write acquisition, it makes sense to avoid this scenario by promoting the initial read acquisition to a
write acquisition, preventing other transactions from sharing read ownership of data that will soon
be written. Promoting the read to a write could also reduce synchronization overhead, as it replaces
two acquisition operations with one. Some STM runtimes [20] already provides the API to support
such a promotion, as they separate the functionality of asking for a read or read&write permission
from the functionality of executing the actual transactional access. Thus, the programmer can ask
for a read&write permission before executing the first read of the location. When a compiler is used
to generate the code interfacing the TM runtime, the user may be able to ask for a write promotion
by using a special syntax, or by directly calling a function in the TM runtime API.
In Figure 4.10, the profiler shows the user how many times each read access was executed, and
how many times the associated read ownership was upgraded, suggesting which read accesses may
be good candidates for promotion. It can then be useful to check which upgrades were responsible
for conflicts. In this example, there are two accesses, one in Insert (), and one in Remove(), which
are upgraded 40% of the time. These accesses are indeed the reads of a hash table bucket pointer
that we previously described. (Recall that about 50% of the Insert () and Remove() operations fail
and do not modify the table, which explains why the upgrade only occurred in less than 50% of the
time.) Checking these accesses against the graphs in Figure 4.8, we notice that these accesses are
responsible for a large fraction of the overall conflicts’ cost, suggesting that promoting these reads
to writes may help to avoid some unnecessary aborts.
Note that a particular user-code read access instruction may be executed multiple times by a
single transaction, each time accessing different data items (for example, walking over a tree or linked
list), where the transaction later upgrades only one of the data items. In this case the profiler counts
multiple regular executions for the instruction, and only one upgrade. This is because marking this
instruction as an access to be promoted will have the effect of preventing read sharing for all of the
data items it accesses, even those that are never upgraded.

85
Figure 4.10: Output of write-upgrades analysis
Silent Writes
A second kind of flagged access is a silent write, one that does not change the data item’s value.
Such writes can cause unnecessary synchronization and contention overhead. For example, in a
red-black tree, the root node is always colored black. In a sequential implementation, a thread
rebalancing the tree does no harm by coloring the new root node black, even if that node is already
black. In a transactional implementation, however, recoloring that node may force the transaction
to acquire write ownership unnecessarily, introducing a gratuitous conflict with all other concurrent
transactions. Instead, it makes sense to read the node’s color, and to change it only if necessary.
In addition, since transactions group together multiple writes into one atomic operation, a silent
write may be also caused by a series of writes that change a variable from value A to B, and then
back to A. We denote these as silent series, as opposed to simple silent writes. For example, in the
following code:
atomic {
x = x*y;
if (z != 0) x = x/z;

86
}
the value of variable x is not modified if y and z are equal and z is nonzero. The user can guarantee
that any particular write is not silent by reading the value in the location to be written before writing
it. In many cases avoiding certain silent series is also possible with a slightly higher overhead, like
in the example above that can be re-written as:
atomic {
if (y != z) {
x = x * y;
if (z != 0) x = x/z;
} else if (z == 0) x = 0;
}
to avoid the silent write to x. In a more complex code, where x may undergo a long series of writes,
the programmer may be able to cache the written values in a local variable (e.g. one that is stored
on the stack or in a register) and only write the final value to x at the end of the transaction if that
value differ from the current value of x:
atomic {
int cached_x = x;
// replace all access to x with accesses to cached_x
...
if (x != cached_x) x = cached_x;
}
T-PASS detects writes, and series of writes, that are often silent, presenting the silent vs. non-
sielnt ratio for each. In addition, note that eliminating a silent write will not always eliminate
acquiring write ownership, because the transaction may have written to other data items controlled
by the same ownership record. T-PASS takes this into account, reporting for each silent write (or

87
silent series) how many times avoiding the write access would eliminate a write acquisition. This
information, together with the conflicting accesses information in Figure 4.8, can guide the user to
the instructions for which the overhead of avoiding the silent writes may be worthwhile.
Finally, note that silent writes could be prevented by the TM run-time, by testing whether a write
is silent before acquiring the ownership record. Such tests, however, incur additional overhead for
all transactions, even if no silent writes are executed in the common case. We hope that experience
profiling applications will help us understand whether such heuristics are effective.
4.3.5 Discussion
While T-PASS divides the data into the aforementioned categories, it is important to remember to
combine the information from all four reports when profiling and optimizing a transactional program.
For example, one way to reduce the synchronization overhead imposed by an atomic block is
by privatizing some of the accessed data. In particular, if an atomic block processes a large data
structure transactionally, where some portion of the structure is rarely accessed concurrently, then
it often makes sense to use a short atomic block to make this portion inaccessible to other threads,
then process it outside of an atomic block, and finally use another atomic block to make it publicly
available again. Because the portion being privatized was rarely accessed concurrently, it is unlikely
that making it inaccessible to other threads while processing it non-transactionally will cause other
threads long delays due to waiting for the data to be publicly available again. To identify where this
technique may be useful, we can use the T-PASS’s basic characteristics report to identify atomic
blocks whose execution time is dominated by long, large transactions. Then, to find out whether
privatizing the data is likely to cause long waiting times for other threads, we can add gratuitous
writes of that data, and check the conflicts analysis report to see if there are any conflicts with
concurrent reads or writes. If conflicts involving the gratuitous write are sufficiently rare, privatizing
the data is unlikely to delay other threads.
If an HTM mechanism is available, it can also help in reducing the synchronization overhead

88
of atomic blocks by executing some of the user transactions using the hardware support. Profiling
information can help by providing program-specific “hints” with regards to which transactions should
be executed in hardware and which in software. What information is relevant for these hints depends
on the limitation of the particular HTM mechanism. For example, with an HTM mechanism that
can only execute transactions up to a certain size, we may want to detect transactions of a small
data footprint, and see how much of the execution time was spent in them. If the HTM mechanism
does not implement a good contention management policy, we may also want to check the contention
overhead for these transactions, and so on.
Finally, we should remember to take all timing information with respect to the program execution
time. A high value in the contention overhead report does not necessarily indicate a problem if the
total time spent on these transactions is small compared to the total execution time. Knowing the
sampling rate (that is, what fraction of the transactions are profiled), the profiler can easily project
any timing information over all transactions, showing it as a fraction of the program execution time.
4.4 The T-PASS System Design
Figure 4.11 shows an overview of our profiling system. On the bottom, the user program calls the TM
runtime to run transactions. The TM runtime is extended with a runtime profiling support (RTPF)
extension that collects additional profiling information about transactions. The profiler runs in a
separate process space. The RTPF extension reports to the profiler by calling stubs: empty reporting
functions that do nothing except for isolating the profiled information as arguments. The profiler
reads the reported information by tracing calls to these stubs and reading their arguments.
T-PASS uses DTrace [1] to trace the information reported via the stub calls. DTrace is a compre-
hensive dynamic tracing framework for the SolarisTM operating system that supports tracing events
in other processes with very low overhead. DTrace works well with multithreaded programs: for
example, if two threads call the same stub concurrently, DTrace can detect and process these two
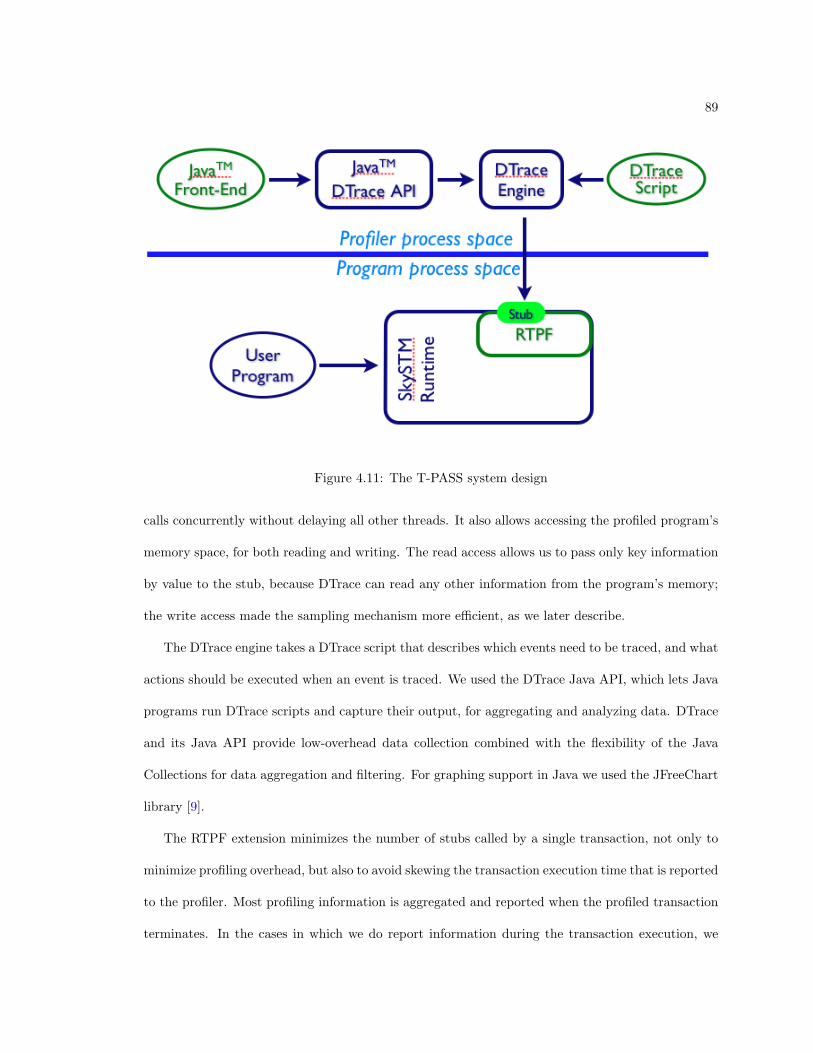
89
Figure 4.11: The T-PASS system design
calls concurrently without delaying all other threads. It also allows accessing the profiled program’s
memory space, for both reading and writing. The read access allows us to pass only key information
by value to the stub, because DTrace can read any other information from the program’s memory;
the write access made the sampling mechanism more efficient, as we later describe.
The DTrace engine takes a DTrace script that describes which events need to be traced, and what
actions should be executed when an event is traced. We used the DTrace Java API, which lets Java
programs run DTrace scripts and capture their output, for aggregating and analyzing data. DTrace
and its Java API provide low-overhead data collection combined with the flexibility of the Java
Collections for data aggregation and filtering. For graphing support in Java we used the JFreeChart
library [9].
The RTPF extension minimizes the number of stubs called by a single transaction, not only to
minimize profiling overhead, but also to avoid skewing the transaction execution time that is reported
to the profiler. Most profiling information is aggregated and reported when the profiled transaction
terminates. In the cases in which we do report information during the transaction execution, we

90
“fix” the transaction’s execution time by measuring and deducting the reporting time from it.
We implemented the RTPF extension for several configurations of the SkySTM [20] library: lazy
or eager conflict detection, semi-visible or invisible reads, with or without implicit privatization
support, plus a variety of contention management strategies. T-PASS allows us to compare the
behavior of different runtime configurations on the same code.
4.4.1 Reducing Overhead
We keep the profiling costs under control by sampling : we collect information about only a small
fraction of transactions. There are two sources of profiling costs: first there is the overhead intro-
duced by the RTPF extension for collecting profiling data, and second there is the overhead caused
by DTrace, when it stops threads that report data.
We addressed both by implementing the sampling mechanism in the RTPF extension, allowing
the RTPF to collect data only for transactions that will be reported. The overhead for all other
transactions consists only of querying whether the transaction is being profiled whenever profiling
information may needed to be collected. While this may introduce minor imbalances because some
transactions incur profiling overhead and some do not, we believe that random sampling ensures
that any such perturbations will have only minor effects on observations.
Each thread performs its own sampling by maintaining a count-down counter, indicating how
many physical transactions should be executed before one is profiled. Every (physical) transaction
that is not profiled decrements the counter. Once the counter reaches zero, the thread profiles the
next transaction, the data is reported by stub calls, and the counter is assigned a new random
value. To get a uniform distribution with probability p, we assign the counter a random value from
a geometric distribution with parameter p. Because each thread does its own sampling, it is possible
to have different threads sample at different rates. We only experimented with the same sampling
rate for all threads.
It is desirable to minimize profiling overhead while the profiler is not attached, so we can always

91
compile programs with a TM runtime that supports profiling. To turn on profiling dynamically as
needed, we take advantage of DTrace’s ability to write the profiled program memory. The RTPF
extension initializes the sampling rate for all threads to zero, so no transaction is profiled or reported.
Every once in a while the RTPF calls a special profiling-enable-stub, providing DTrace with a pointer
to a flag which it can set to request that profiling begin. This request can include parameters such
as the requested sampling rate. The overhead when profiling is turned off is just the overhead for
non profiled transactions, and the cost of periodically calling the profiling-enabled stub.
4.4.2 Extendability
For our prototype, we chose to use DTrace for communicating information between the profiled
process and the profiler, because DTrace allowed us to quickly come up with a set of scripts to read
and aggregate the profiled data, and to manipulate these scripts as we expanded and changed the
profiled data while developing the profiler. Users of T-PASS can easily edit these scripts, or write
their own, to examine different statistics on the profiled data, or to see more information about a
particular data point. We note, however, that DTrace is not the only tool that can provide the data
collection functionality; in particular, it can be replaced by any mechanism that can efficiently detect
user function calls in a remote process. (For example, most debugger can provide this functionality,
by placing breakpoints on the first statement in each stub function.) While using a different tool
will require some changes in the profiler front-end (that is, the Java program that runs the DTrace
scripts and aggregate the data), the RTPF layer can stay untouched.
Furthermore, T-PASS can be modified to work with a profiler front-end that runs as part of the
profiled process. This can be done by replacing the stubs with non-empty functions that record
and/or process the data. Having the RTPF layer report the information by passing it as parameters
to the stubs gives us the flexibility of either reading the information remotely using DTrace (or a
similar tool), or to record it locally by filling in the stubs with the appropriate recording functionality.
Finally, while T-PASS was designed to work with the SkySTM library, it can be extended to

92
support additional TM runtimes without needing to change the profiler front-end, or the DTrace
scripts that report the information to it. To support profiling for a TM runtime, the TM runtime
designer will need to write a RTPF layer for that runtime so that it reports the profiled information
using the stubs defined by the SkySTM RTPF layer. Furthermore, we believe that much of the code
in the SkySTM RTPF layer could be used as-is when writing a RTPF layer for other TM runtimes.
4.5 Debugger Integration
In Chapter 3 we presented the tm db [15] library that provides a range of transaction-related de-
bugging features, effectively making the debugger transaction-aware. It is often useful to use such
a transaction-aware debugger to see additional information for some of the profiled transactions.
For example, Figure 4.4 shows that while most transactions were shorter than 15us, one transac-
tion took longer than 100µs. One way to discover what happened is to rerun the program under a
transaction-aware debugger, stopping when a transaction runs for longer than 100µs. This kind of
scrutiny may reveal additional information not available to the profiler, such as the exact addresses
that the transaction wrote (instead of how many unique locations it wrote). One advantage of
DTrace is that it allows us to stop traced process at any point so the the user can attach a debugger.
We can structure the DTrace script to stop the process if the information reported to the profiler
satisfies certain conditions. These conditions can refer to any piece of profiled information, or even
information gathered from multiple transactions. For example, it could stop when encountering the
10th transaction that executed for longer than 100µs with a write-set of fewer than 5 items.
Integration with a debugger encourages a two-phase profiling methodology. First, run the pro-
gram in the profiler, to accumulate broad-ranging statistics. After identifying phenomena of interest,
run the program again, using the first-run statistics to instruct DTrace to halt the program when
something interesting occurs.

93
4.5.1 Replay Debugging
As described in Chapter 2, to replay a transaction’s execution in a debugger it is enough to know
the pre-transaction values of all locations the transaction read. Given the pre-transaction values
the debugger can reconstruct the value returned by each of the transaction’s reads by re-executing
the transaction, and logging writes in a new, initially empty write set. Each read returns the pre-
transaction value, unless that location is in the write set, in which case it returns the write-set value.
Knowing the value returned by all of the transaction’s reads, the debugger can accurately replay
the transaction’s execution, assuming that the code is deterministic in the read values: that is, it
behaves the same given the same read values.
While providing the pre-transactional values for all transactions may be costly, we can still
support replay for only profiled transactions. Because we profile only a small sample of the trans-
actions, and because we need to keep track of additional information for these transactions anyway,
it is possible to keep the information required for replaying with a reasonable cost.
Here is how we do it. Instead of keeping track of pre-transaction values for locations read, we
simply log all values returned by transactional reads, in execution order. Hence, there is no need to
maintain a write set during replay, because the read values are known without checking whether the
location was written. Indeed, we do not even need to log read addresses, only the value returned
by each read in sequence. We can even replay aborted transactions, which, in some TM run-times,
may have seen an inconsistent state.
Here is a new and simple way to support transaction replay by exploiting the TM run-time’s
ability to retry failed transactions. When we decide to replay a transaction, we deceive the run-
time into thinking that the commit failed, and the run-time then reschedules that transaction. The
second time around, however, the transaction runs in a special side-effect free replay mode, where
reads return the logged values, and writes are suppressed.
In more detail, at run-time a transaction is in either a regular or a replay mode (the default

94
is regular). To replay a transaction, DTrace stops the transaction just before it tries to commit,
and sets a flag requesting a replay. This can be easily done because the RTPF extension calls the
stub to report the profiled information at commit time, allowing DTrace to respond by setting the
flag if the transaction should be replayed. After attaching the debugger, the commit proceeds as
usual except that when it is done, it caches the outcome (success or failure), changes the transaction
mode to replay and regardless of the actual outcome, reports that the transaction commit failed,
tricking the run-time into retrying the transaction. The second time around, when the transaction
commits in replay mode, it simply resets the transaction mode to regular, and returns the cached
result of the first commit attempt. In replay mode, a transactional read simply returns the value
logged for that read, and a transactional write does nothing. Finally, if a replaying transaction does
a read validation, that validation succeeds unless the original transaction failed and there are no
more logged read values to return.
We implemented the replay mechanism in the RTPF extension of SkySTM, together with struc-
turing the DTrace script to stop and replay transactions whose execution time is longer than a given
value. We then examined the long transactions in the hash table execution shown in Figure 4.4. It
turns out that the long transactions were the ones that resized the hash table.
Further examination yielded an interesting observation, explaining why we rarely see very high
contention overhead even for transactions that have only two trials (Figure 4.6). If two transactions
try to add a value to a hash table that has to be resized, they will conflict (even if the values are
added in different buckets). One transaction will successfully resize the table, and the other will
be retried. The second trial will not need to resize, and will be much shorter, resulting in a high
ratio between the overall and the useful transaction time. Using the combination of a profiler and
a debugger, we observe that sometimes high contention overhead is reported because different trials
do different things, when the underlying data structure has changed between the trials.
Note that in principle, the technique introduced here where a transaction pretends to abort to

95
trick the run-time into replaying, can be used with any debugger, not just a transaction-aware debug-
ger using tm db. Of course, a transaction-aware debugger will report more meaningful information.
4.6 Discussion
We presented T-PASS, a prototype system for profiling transactional programs. T-PASS provides
profiling information in various categories, as well as a flexible querying mechanism, to address
bottlenecks that are commonly found in transactional programs.
We believe T-PASS shows that TM can make concurrent programs easier to profile. Although
a lock-based system could instrument locks and critical sections, the principal difference between
locking and TM is that TM run-times naturally keep track of much more information about data
accesses, so it becomes possible to track data accesses at a finer level of granularity.
In addition, the speculative nature of many TM run-time systems is helpful for choosing an
appropriate synchronization granularity. Locks ensure that conflicting critical sections do not run
concurrently. Because locking must be conservative, it may not be possible to detect when critical
sections are too coarse-grained. Because TM run-times detect conflicts dynamically, the profiler can
aggregate and format fine-grained information about actual conflicts to allow programmers to detect
when a program’s performance might be improved by refactoring the atomic block granularity.
TM runtimes and transactional programming are still in their infancy, and therefore the kind of
bottlenecks that a profiler needs to look for are likely to change over time. For example, the recently
proposed NOrec TM runtime [4] does not map the user-level data to metadata; instead, it uses a
global lock to serialize all writing transactions, and a value based validation scheme to guarantee
that a transaction reads consistent data. Thus, the NOrec TM runtime eliminates the false conflicts
problem, which may significantly affect the way profiling data should be presented to the user.
Another example is that of TM runtimes that may support true closed nesting of transactions.
Our profiler assumes only the simplest form of nesting, called flattening, where a nested atomic

96
block is executed as part of the parent transaction that executes the outermost atomic block. Thus,
with flattening, losing a conflict with an access in a nested atomic block causes the whole outermost
atomic block to be retried. With true closed nesting, on the other hand, a conflict with an access
inside a nested atomic block may cause only the execution of that atomic block to be retried, which
may significantly change the kind of cost analysis that T-PASS needs to present the user with in
the present of conflicts (e.g. the cost of losing a conflict changes, etc.).
Finally, emerging HTM mechanisms may introduce different limitations on transactions, requiring
profilers to appropriately adapt.
Chapter 5
Conclusions
In this dissertation we investigated the debugging and profiling needs of transactional programs.
We showed why debuggers will have to change to support even just the most basic debugging
features for transactional programs, and demonstrated the additional power that TM provides to
support more advanced debugging capabilities. We showed how to build an infrastructure to support
debugging of transactional programs with various STM runtimes, and built a library to provide such
an infrastructure. To better understand the performance characteristics of transactional programs,
we built a profiling prototype that identifies performance bottlenecks in the program, and provides
guidance for how to optimize it in both software and hybrid TM environments.
To date, there are very few realistic parallel programs that use transactional memory, and most
of those that do were converted from lock-based programs by replacing critical sections with atomic
blocks. In many cases, this method resulted in transactional programs that did not scale due to
unnecessary sharing of data between atomic blocks [5], or in programs that did scale but performed
badly comparing to the original lock-based program due to the high overhead of the STM runtime [18,
2]. While preliminary experience with writing transactional programs “from scratch” indicates that
it can significantly simplify concurrent programming [29], it is clear that there is still a long way to
go before we understand how transactional programs should be designed to make writing efficient
97

98
concurrent programs easier.
We believe that our work on debugging and profiling of transactional programs is a necessary key
step towards building this understanding. The infrastructure and tools that we built significantly
simplify the task of writing transactional programs and understanding their needs. In the future,
we plan to use these tools to explore how realistic parallel programs can be better designed to
use transactional memory, and other newly available synchronization mechanisms. We expect that
this research direction will provide guidance not only for writing better parallel programs, but
also for improving TM runtimes, the hardware support that they require, and the interface to the
programmer, resulting in a better environment for writing parallel programs.
One interesting direction to explore is whether and how the integration of TM with programming
languages should change to allow addressing bottlenecks presented by the profiler. Here are a few
examples:
• Write upgrades and silent writes: can the programmer mark particular read statements that
are likely to be upgraded, or particular write statements that are likely to be silent, and have
the compiler generate the required code to avoid the unnecessary overhead in these special
cases?
• Contention management: can the programmer annotate particular atomic blocks, or even
particular accesses, to affect the contention management policy applied to these statements
(e.g. by applying different priorities to atomic blocks)?
• False conflicts: can the programmer ask the TM runtime that two particular accesses will
not falsely conflict (for example by annotating them with different IDs, and having the TM
runtime re-assign orecs in case that two accesses to different variables with different IDs map
to the same orec)? While avoiding all false conflicts may be costly, doing so for only a few
accesses that are usually conflicting may be worthwhile.
While these examples may be helpful for improving performance of transactional programs, they also

99
complicate the interface to the programmer and are better avoided. Therefore, another interesting
direction to explore is whether the profiler can directly feed the compiler with profiling information,
and have the compiler generate the appropriate optimized code without having users manually
annotate their code. For example, the compiler can implant requests to write access a variable
before it is first read if the profiler indicates that this read statement is usually upgraded. In some
cases this process can be only partly automated, where the user is asked for their preferences in
cases where it is not clear what optimization to apply based only on the profiled data.
Finally, another important future research direction is that of debugging and profiling support
for HTM mechanisms. To date, most HTM proposals do not provide any debugging capabilities
for transactions that they run. In this dissertation we described how in a hybrid environment
the debugger can force a user transaction to be run using STM, so that it can be debugged, but
we did not discuss debugging mechanisms for transactions that are run using the HTM. Lev and
Maessen [22] proposed the SpHT mechanism, which augments a best-effort HTM with a software
component to improve the debugging capabilities of user transactions, while still taking advantage
of the HTM when running them. The SpHT mechanism can run transactions significantly faster
than an equivalent software only solution, but still imposes a significant overhead due to logging of
the transaction’s reads and writes, which is done in software. We hope that future work on HTM
design will improve the debugging capabilities of newly available HTM mechanisms; we believe that
our work, which defined an interface for transactional debugging support, is a first step towards
achieving this goal.
5.1 Open Source
Most of the work described in this dissertation is made open source and will be soon available to
the public at http://www.cs.brown.edu/people/levyossi/Thesis/.
In particular, the extended version of the SkySTM library with the runtime debugging and

100
profiling support (the RTDB and RTPF layers), as well as the SkySTM’s RDM modules, will be
available as open source. We hope that the availability of the RDM and the RTDB code will
encourage other researchers to extend additional TM runtimes with transactional debugging support,
by writing new RDM components that will be used with the tm db library and the transactional
debugging extension of the Sun Studio dbx debugger that uses it.
In addition, we are making the code of the tm db library itself available, to help researchers who
may want to adapt it to other debuggers as well, or experiment with additional debugging features.
Finally, because the T-PASS Java front-end is still in an initial development stage, we are not
yet open sourcing it; instead, we are providing a variety of DTrace scripts that demonstrate how the
profiling information collected by the RTPF layer can be extracted and presented to the user.

Bibliography
[1] Bryan M. Cantrill, Michael W. Shapiro, and Adam H. Leventhal. Dynamic instrumentation of
production systems. In ATEC ’04: Proceedings of the annual conference on USENIX Annual
Technical Conference, pages 2–2, Berkeley, CA, USA, 2004. USENIX Association.
[2] Calin Cascaval, Colin Blundell, Maged Michael, Harold W. Cain, Peng Wu, Stefanie Chiras,
and Siddhartha Chatterjee. Software transactional memory: Why is it only a research toy?
Queue, 6(5):46–58, 2008.
[3] Hassan Chafi, Chi Cao Minh, Austen McDonald, Brian D. Carlstrom, JaeWoong Chung, Lance
Hammond, Christos Kozyrakis, and Kunle Olukotun. Tape: a transactional application pro-
filing environment. In ICS ’05: Proceedings of the 19th annual international conference on
Supercomputing, pages 199–208, New York, NY, USA, 2005. ACM.
[4] Luke Dalessandro, Michael F. Spear, and Michael L. Scott. Norec: streamlining stm by abol-
ishing ownership records. In PPoPP ’10: Proceedings of the 15th ACM SIGPLAN symposium
on Principles and practice of parallel programming, pages 67–78, New York, NY, USA, 2010.
ACM.
[5] Peter Damron, Alexandra Fedorova, Yossi Lev, Victor Luchangco, Mark Moir, and Dan Nuss-
baum. Hybrid transactional memory. In International Conference on Architectural Support for
Programming Languages and Operating Systems, 2006.
101
102
[6] Dave Dice, Maurice Herlihy, Doug Lea, Yossi Lev, Victor Luchangco, Wayne Mesard, Mark
Moir, Kevin Moore, and Dan Nussbaum. Applications of the adaptive transactional memory
test platform. Transact 2008 workshop.
http://research.sun.com/scalable/pubs/ TRANSACT2008-ATMTP-Apps.pdf.
[7] Dave Dice, Yossi Lev, Mark Moir, and Daniel Nussbaum. Early experience with a commercial
hardware transactional memory implementation. In ASPLOS ’09: Proceeding of the 14th inter-
national conference on Architectural support for programming languages and operating systems,
pages 157–168, New York, NY, USA, 2009. ACM.
[8] David Dice, Ori Shalev, and Nir Shavit. Transactional locking ii. In DISC, pages 194–208,
2006.
[9] David Gilbert. JFreeChart. http://www.jfree.org/jfreechart/.
[10] Lance Hammond, Brian D. Carlstrom, Vicky Wong, Ben Hertzberg, Mike Chen, Christos
Kozyrakis, and Kunle Olukotun. Programming with transactional coherence and consistency
(TCC). ACM SIGOPS Operating Systems Review, 38(5):1–13, 2004.
[11] Derin Harmanci, Pascal Felber, Vincent Gramoli, and Christof Fetzer. TMunit: Testing Trans-
actional Memories. 2009. 4th ACM SIGPLAN Workshop on Transactional Computing (TRANS-
ACT’09), Raleigh, North Carolina, USA, February 15 2009.
[12] Tim Harris, Mark Plesko, Avraham Shinnar, and David Tarditi. Optimizing memory transac-
tions. SIGPLAN Not., 41(6):14–25, 2006.
[13] M. Herlihy and J. Moss. Transactional memory: Architectural support for lock-free data struc-
tures. Technical Report CRL 92/07, Digital Equipment Corporation, Cambridge Research Lab,
1992.
[14] Maurice Herlihy and Yossi Lev. T-PASS: A profiler for transactional programs. Under submis-
sion.
103
[15] Maurice Herlihy and Yossi Lev. tm db: A generic debugging library for transactional programs.
Parallel Architectures and Compilation Techniques, International Conference on, 0:136–145,
2009.
[16] Maurice Herlihy, Victor Luchangco, Mark Moir, and William N. Scherer, III. Software trans-
actional memory for dynamic-sized data structures. In PODC ’03: Proceedings of the twenty-
second annual symposium on Principles of distributed computing, pages 92–101, New York, NY,
USA, 2003. ACM.
[17] Intel, IBM, and Sun. Draft specification of transactional language constructs for c++, Aug
2009. http://research.sun.com/scalable/pubs/C++-transactional-constructs-1.0.pdf.
[18] Seunghwa Kang and David A. Bader. An efficient transactional memory algorithm for comput-
ing minimum spanning forest of sparse graphs. SIGPLAN Not., 44(4):15–24, 2009.
[19] Sanjeev Kumar, Michael Chu, Christopher Hughes, Partha Kundu, and Anthony Nguyen. Hy-
brid transactional memory. In Preceedings of the 11th ACM SIGPLAN Symposium on Principles
and Practice of Parallel Programming, 2006.
[20] Yossi Lev, Victor Luchangco, Virendra Marathe, Mark Moir, Dan Nussbaum, and Marek Ol-
szewski. Anatomy of a scalable software transactional memory. In TRANSACT ’09: 4th
Workshop on Transactional Computing, feb 2009.
[21] Yossi Lev and Jan Maessen. Towards a safer interaction with transactional memory by track-
ing object visibility. In Workshop on Synchronization and Concurrency in Object-Oriented
Languages (SCOOL), October 2005.
[22] Yossi Lev and Jan-Willem Maessen. Split hardware transactions: true nesting of transactions
using best-effort hardware transactional memory. In PPoPP ’08: Proceedings of the 13th ACM
SIGPLAN Symposium on Principles and practice of parallel programming, pages 197–206, New
York, NY, USA, 2008. ACM.

104
[23] Yossi Lev and Mark Moir. Debugging with transactional memory. In Proceedings of the First
ACM SIGPLAN Workshop on Languages, Compilers, and Hardware Support for Transactional
Computing. Jun 2006.
[24] Yossi Lev, Mark Moir, and Dan Nussbaum. PhTM: Phased transactional memory. In Workshop
on Transactional Computing (TRANSACT), 2007.
[25] Mark Moir. Hybrid transactional memory, Jul 2005. http://www.cs.wisc.edu/trans-
memory/misc-papers/moir:hybrid-tm:tr:2005.pdf.
[26] Satish Narayanasamy, Gilles Pokam, and Brad Calder. Bugnet: Continuously recording program
execution for deterministic replay debugging. In ISCA ’05: Proceedings of the 32nd Annual
International Symposium on Computer Architecture, pages 284–295, Washington, DC, USA,
2005. IEEE Computer Society.
[27] Njuguna Njoroge, Jared Casper, Sewook Wee, Teslyar Yuriy, Daxia Ge, Christos Kozyrakis,
, and Kunle Olukotun. Atlas: A chip-multiprocessor with transactional memory support. In
Proceedings of the Conference on Design Automation and Test in Europe (DATE), Nice, France,
April 2007, 2007.
[28] Njuguna Njoroge, Sewook Wee, Jared Casper, Justin Burdick, Teslyar Yuriy, Christos
Kozyrakis, and Kunle Olukotun. Building and using the atlas transactional memory system.
In Workshop on Architecture Research using FPGA Platforms, 12th International Symposium
on High-Performance Computer Architecture. Feb 2006.
[29] Christopher J. Rossbach, Owen S. Hofmann, and Emmett Witchel. Is transactional program-
ming actually easier? In PPoPP ’10: Proceedings of the 15th ACM SIGPLAN symposium on
Principles and practice of parallel programming, pages 47–56, New York, NY, USA, 2010. ACM.

105
[30] Bratin Saha, Ali-Reza Adl-Tabatabai, Richard L. Hudson, Chi Cao Minh, and Benjamin
Hertzberg. Mcrt-stm: a high performance software transactional memory system for a multi-
core runtime. In PPoPP ’06: Proceedings of the eleventh ACM SIGPLAN symposium on
Principles and practice of parallel programming, pages 187–197, New York, NY, USA, 2006.
ACM.
[31] Yasushi Saito. Jockey: A user-space library for record-replay debugging. Technical Report
HP-2006-46, HP Laboratories, Palo Alto, CA, March 2005.
[32] W. Scherer and M. Scott. Advanced contention management for dynamic software transactional
memory. In Proc. 24th Annual ACM Symposium on Principles of Distributed Computing, 2005.
[33] N. Shavit and D. Touitou. Software transactional memory. Distributed Computing, 10(2):99–
116, February 1997.
[34] Nicholas A. Solter, Jerry Jelinek, and David Miner. OpenSolaris Bible. Wiley, 2009. SBN-10:
0470385480.
[35] Michael F. Spear, Virendra J. Marathe, Luke Dalessandro, and Michael L. Scott. Privatization
techniques for software transactional memory. In PODC ’07: Proceedings of the twenty-sixth
annual ACM symposium on Principles of distributed computing, pages 338–339, New York, NY,
USA, 2007. ACM.
[36] Inc. Sun Microsystems. Sun Studio 12: Debugging a Program With dbx. Sun Microsystems,
Inc., 4150 Network Circle Santa Clara, CA 95054 U.S.A.
[37] Ferad Zyulkyarov, Tim Harris, Osman S. Unsal, Adrian Cristal, and Mateo Valero. Debug-
ging programs that use atomic blocks and transactional memory. In PPoPP 2010, to appear:
Proceedings of the eleventh ACM SIGPLAN symposium on Principles and practice of parallel
programming. ACM, 2010.