transactive control & coordination: a double-auction … · transactive control &...
TRANSCRIPT
Transactive Control & Coordination: A Double-Auction Based Approach to Distributed Control and Decision-making
Jakob Stoustrup Pacific Northwest National Laboratory [email protected]
IMA Workshop: Distributed Control and Decision Making Over Networks Minneapolis, MN Sep 28, 2015
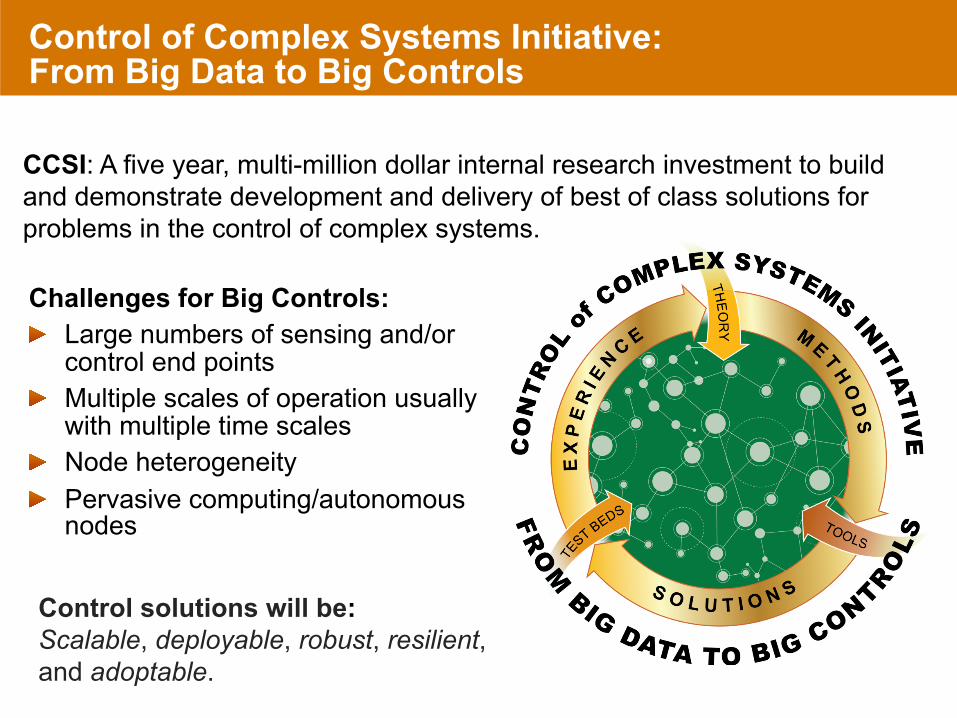
Control of Complex Systems Initiative: From Big Data to Big Controls
Challenges for Big Controls: Large numbers of sensing and/or control end points Multiple scales of operation usually with multiple time scales Node heterogeneity Pervasive computing/autonomous nodes
CCSI: A five year, multi-million dollar internal research investment to build and demonstrate development and delivery of best of class solutions for problems in the control of complex systems.
Control solutions will be: Scalable, deployable, robust, resilient, and adoptable. m
Significant Challenges Facing the Grid
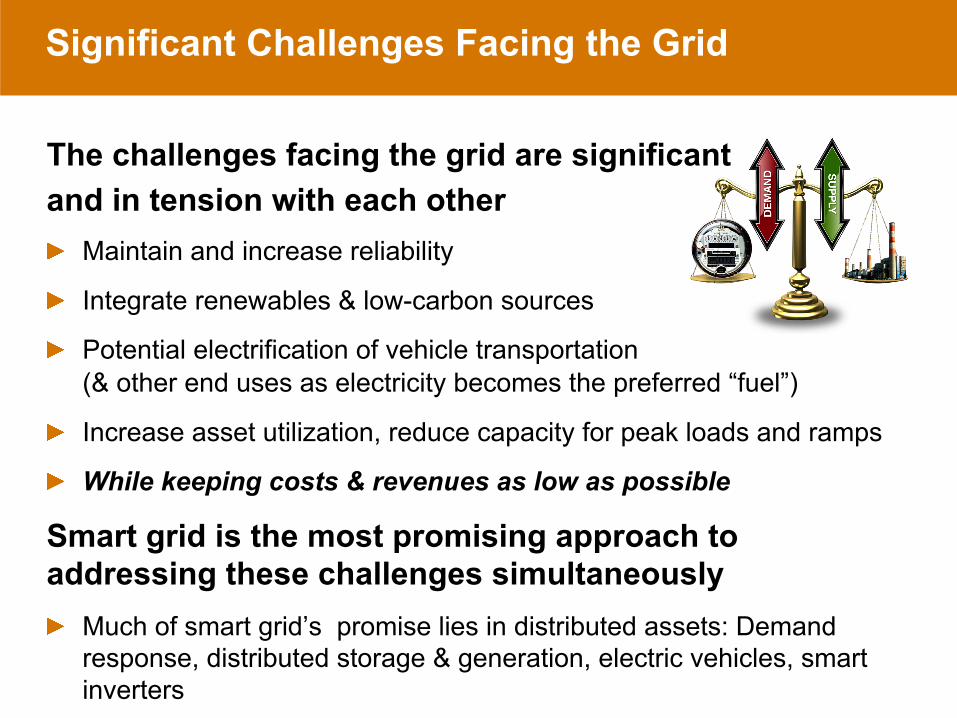
The challenges facing the grid are significant and in tension with each other
Maintain and increase reliability
Integrate renewables & low-carbon sources
Potential electrification of vehicle transportation (& other end uses as electricity becomes the preferred “fuel”)
Increase asset utilization, reduce capacity for peak loads and ramps
While keeping costs & revenues as low as possible
Smart grid is the most promising approach to addressing these challenges simultaneously
Much of smart grid’s promise lies in distributed assets: Demand response, distributed storage & generation, electric vehicles, smart inverters
Future Control Architecture of the Grid
Designing a novel control architecture for the power grid needs a significant number of considerations, e.g.:
Laws of electro-physics must be observed
Current/future stakeholder boundaries must be respected
Architecture must be deployable in a modular, incremental fashion
For reasons of robustness, resilience & flexibility, the control architecture must be layered
Considering the huge number of assets, lowest layer must be a distributed control architecture
Transactive Controls is a very promising approach for such a distributed control architecture
Transactive Controls / Transactive Energy
Refers to techniques for managing the generation, consumption or flow of electricity within a power system, using economic or market-based constructs, while respecting grid reliability constraints.
The term “transactive” comes from considering that decisions are made based on a value. These decisions may be analogous to, or literally, economic transactions.
Transactive Energy Workshop Proceedings 2012, prepared by the GridWise® Architecture Council, March 2012, PNNL-SA-90082 (http://www.gridwiseac.org/historical/tew2012/tew2012.aspx)
What Problems or Issues is Transactive Control and Coordination, TC2, Designed to Address?
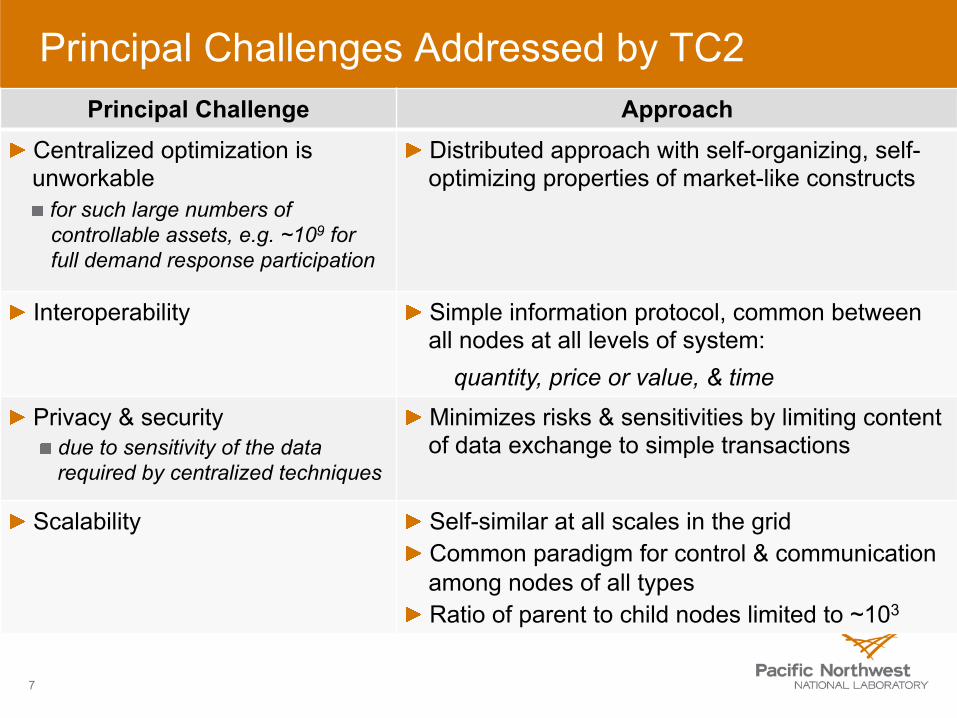
Principal Challenges Addressed by TC2
7
Principal Challenge Approach Centralized optimization is unworkable
for such large numbers of controllable assets, e.g. ~109 for full demand response participation
Distributed approach with self-organizing, self-optimizing properties of market-like constructs
Interoperability Simple information protocol, common between all nodes at all levels of system:
quantity, price or value, & time
Privacy & security due to sensitivity of the data required by centralized techniques
Minimizes risks & sensitivities by limiting content of data exchange to simple transactions
Scalability Self-similar at all scales in the grid Common paradigm for control & communication among nodes of all types Ratio of parent to child nodes limited to ~103
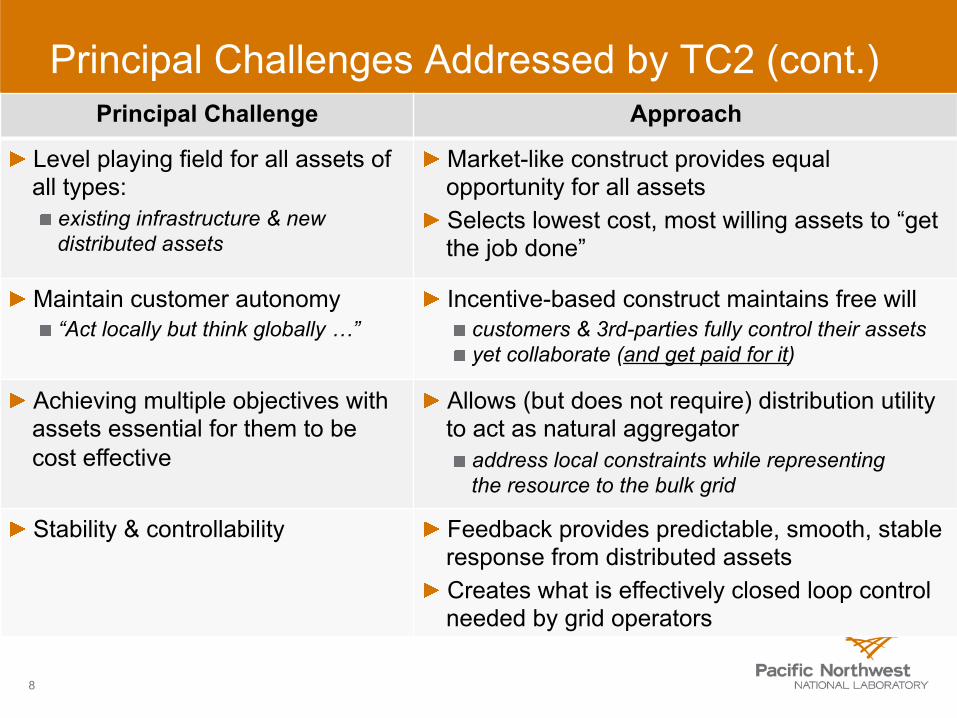
Principal Challenges Addressed by TC2 (cont.)
8
Principal Challenge Approach
Level playing field for all assets of all types:
existing infrastructure & new distributed assets
Market-like construct provides equal opportunity for all assets Selects lowest cost, most willing assets to “get the job done”
Maintain customer autonomy “Act locally but think globally …”
Incentive-based construct maintains free will customers & 3rd-parties fully control their assets yet collaborate (and get paid for it)
Achieving multiple objectives with assets essential for them to be cost effective
Allows (but does not require) distribution utility to act as natural aggregator
address local constraints while representing the resource to the bulk grid
Stability & controllability Feedback provides predictable, smooth, stable response from distributed assets Creates what is effectively closed loop control needed by grid operators

PNNL Transactive Energy Approach: Transactive Control & Coordination (TC2)
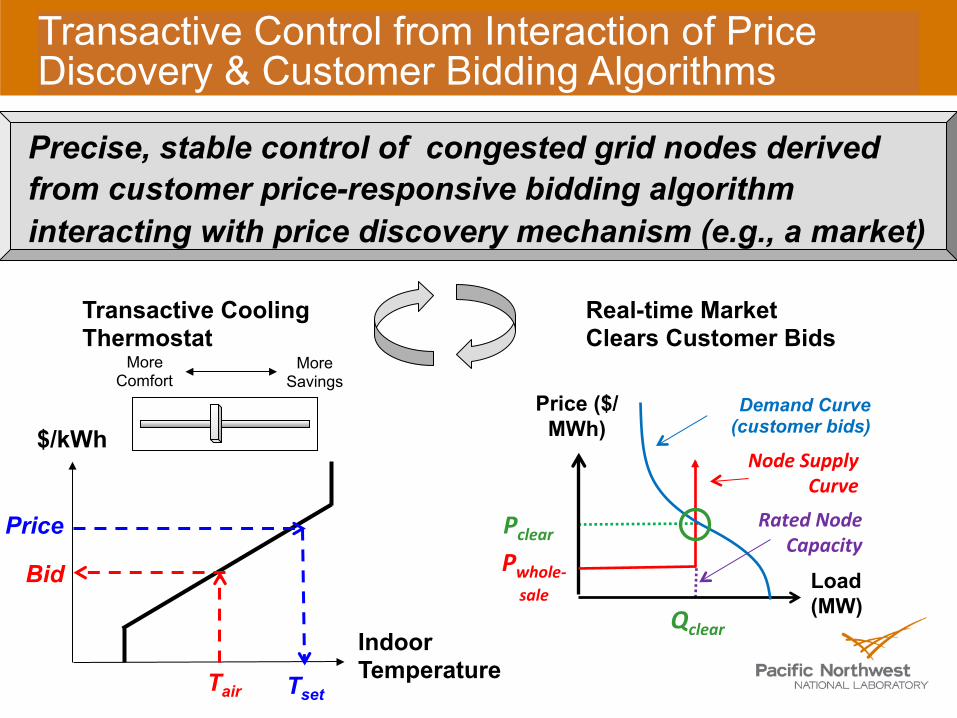
Transactive Control from Interaction of Price Discovery & Customer Bidding Algorithms
Indoor Temperature
$/kWh
Tair
Bid
Price
Tset
More Comfort
More Savings
Load (MW)
Price ($/MWh)
Demand Curve (customer bids)
Pclear
Qclear
Rated Node Capacity
Node Supply Curve
Pwhole-‐sale
Precise, stable control of congested grid nodes derived from customer price-responsive bidding algorithm interacting with price discovery mechanism (e.g., a market)
Transactive Cooling Thermostat
Real-time Market Clears Customer Bids
11
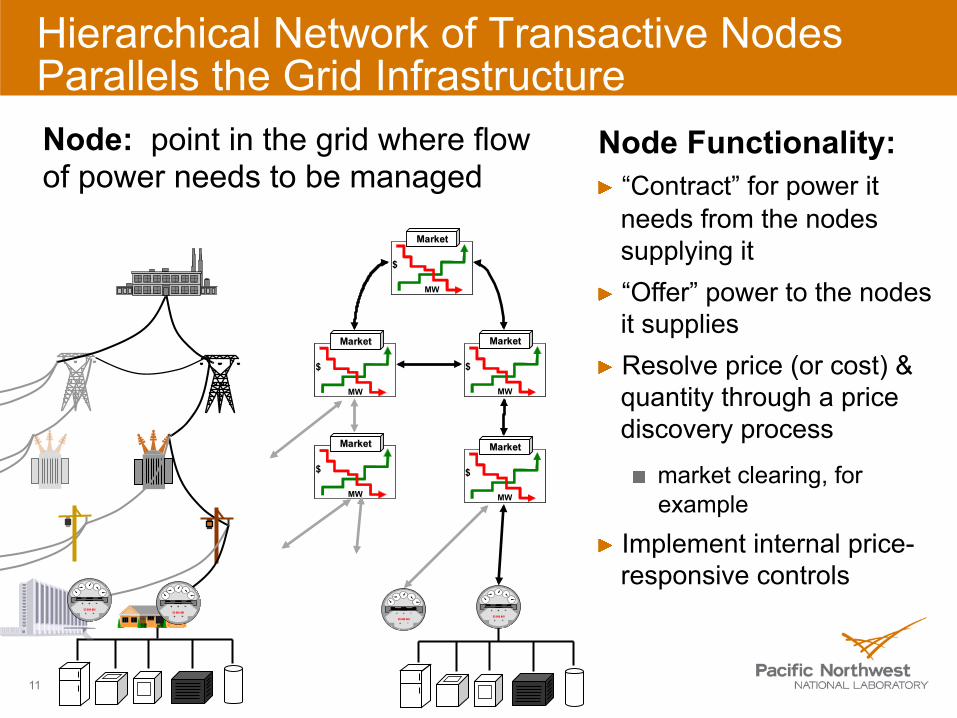
Hierarchical Network of Transactive Nodes Parallels the Grid Infrastructure
$
MW
$
MW
MarketMarket
Node Functionality: “Contract” for power it needs from the nodes supplying it “Offer” power to the nodes it supplies Resolve price (or cost) & quantity through a price discovery process
market clearing, for example
Implement internal price- responsive controls
$
MW
$
MW
MarketMarket
$
MW
$
MW
MarketMarket
Node: point in the grid where flow of power needs to be managed
$
MW
$
MW
MarketMarket
$
MW
$
MW
MarketMarket
Properties of Transactive Nodes Use local conditions & global information to make control decisions for its own operation
Indicate their response to the network node(s) serving them to an incentive signal from the node(s) serving them
as a feedback signal forecasting their projected net flow of electricity (production, delivery, or consumption)
Setting incentive signal for nodes serves to obtain precise response from them, based on their feedback signals
Responsiveness is voluntary (set by the node owner)
Response is typically automated (and reflected in the feedback signal)
12
Links All Values/Benefits in Multi-Objective Control
Long-term objective for TC2 is to simultaneously achieve combined benefits
Reduce peak loads (minimize new capacity, maximize asset utilization) – generation, transmission, & distribution Minimize wholesale prices/production costs Reduce transmission congestion costs Provide stabilizing services on dynamically-constrained transmission lines to free up capacity for renewables Provide ancillary services, ramping, & balancing (especially in light of renewables) Managing distribution voltages in light of rapid fluctuations in rooftop solar PV system output
13
14
Thermostat (Today) Transactive Cooling Thermostat Generates Demand Bid based on Customer Settings Price (Cooling Example) –
k
Tmax Tmin
k
1
Indoor Temperature
Pric
e*
Tcurrent
Pbid
Pavg
Pclear
Tset Tdesired
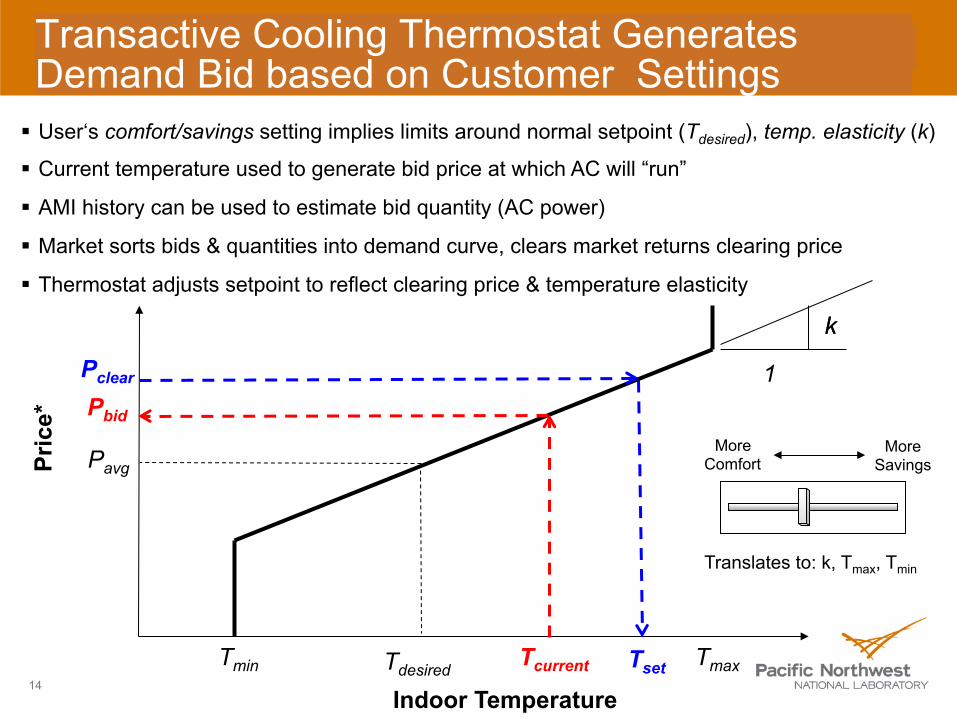
§ User‘s comfort/savings setting implies limits around normal setpoint (Tdesired), temp. elasticity (k)
§ Current temperature used to generate bid price at which AC will “run”
§ AMI history can be used to estimate bid quantity (AC power)
§ Market sorts bids & quantities into demand curve, clears market returns clearing price
§ Thermostat adjusts setpoint to reflect clearing price & temperature elasticity
More Comfort
More Savings
Translates to: k, Tmax, Tmin
Pbase
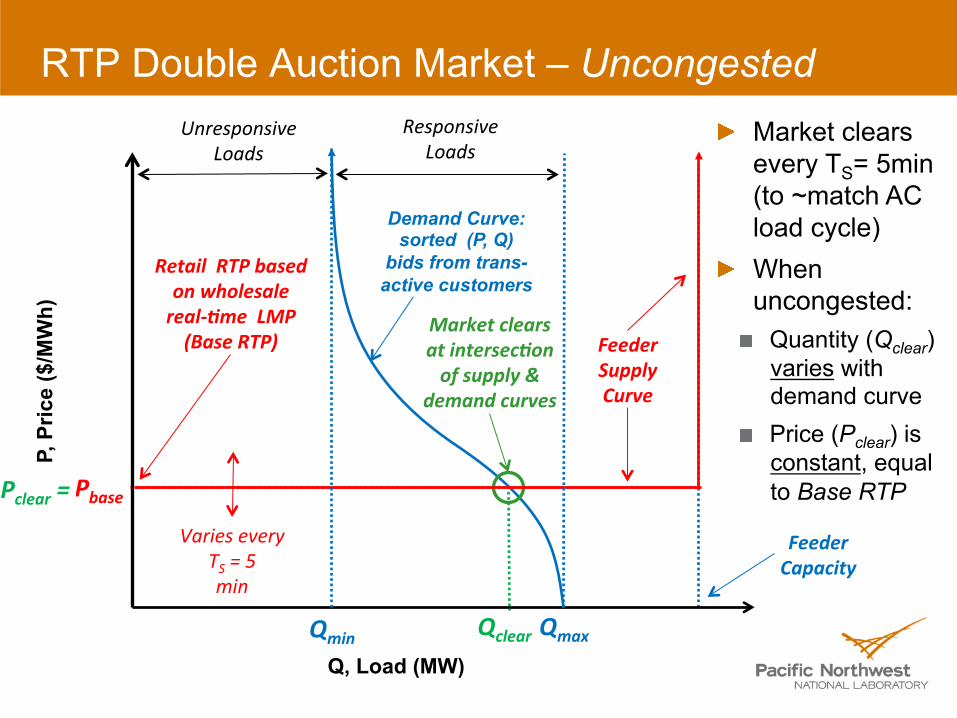
RTP Double Auction Market – Uncongested
Retail RTP based on wholesale real-‐<me LMP (Base RTP)
Unresponsive Loads
Q, Load (MW)
P, P
rice
($/M
Wh)
Responsive Loads
Demand Curve: sorted (P, Q)
bids from trans-active customers
Pclear =
Qclear
Feeder Capacity
Varies every TS = 5 min
Feeder Supply Curve
Market clears every TS= 5min (to ~match AC load cycle) When uncongested:
Quantity (Qclear) varies with demand curve Price (Pclear) is constant, equal to Base RTP
Qmin Qmax
Market clears at intersec<on of supply &
demand curves
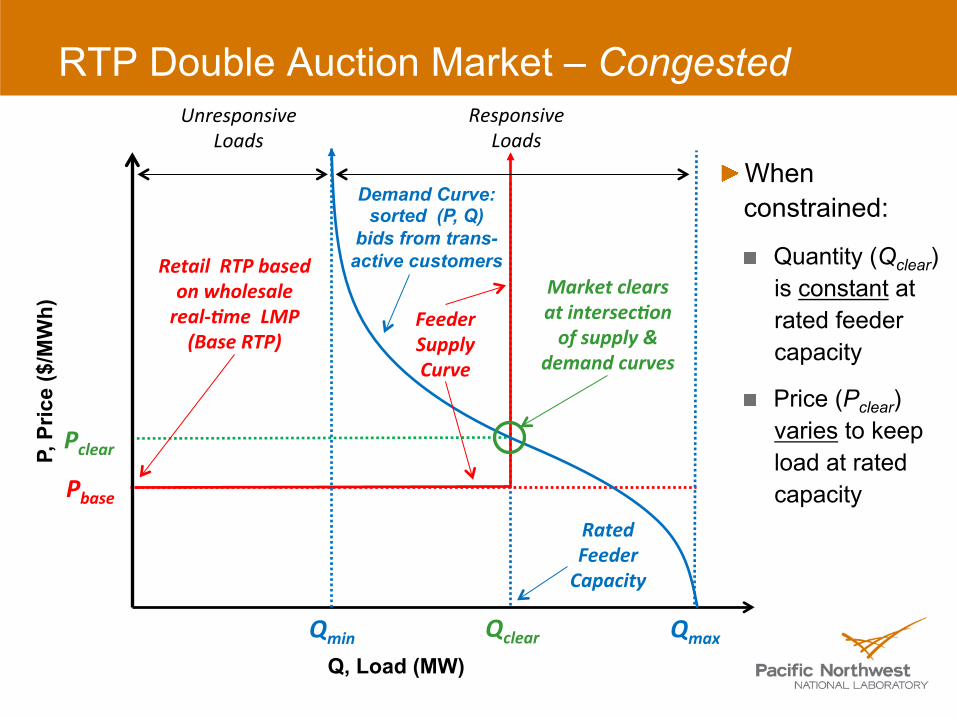
RTP Double Auction Market – Congested
Retail RTP based on wholesale real-‐<me LMP (Base RTP)
Unresponsive Loads
Q, Load (MW)
P, P
rice
($/M
Wh)
Responsive Loads
Demand Curve: sorted (P, Q)
bids from trans-active customers
Pclear
Qclear
Rated Feeder Capacity
When constrained:
Quantity (Qclear) is constant at rated feeder capacity
Price (Pclear) varies to keep load at rated capacity
Feeder Supply Curve
Pbase
Market clears at intersec<on of supply &
demand curves
Qmin Qmax
Feeder Supply Curve
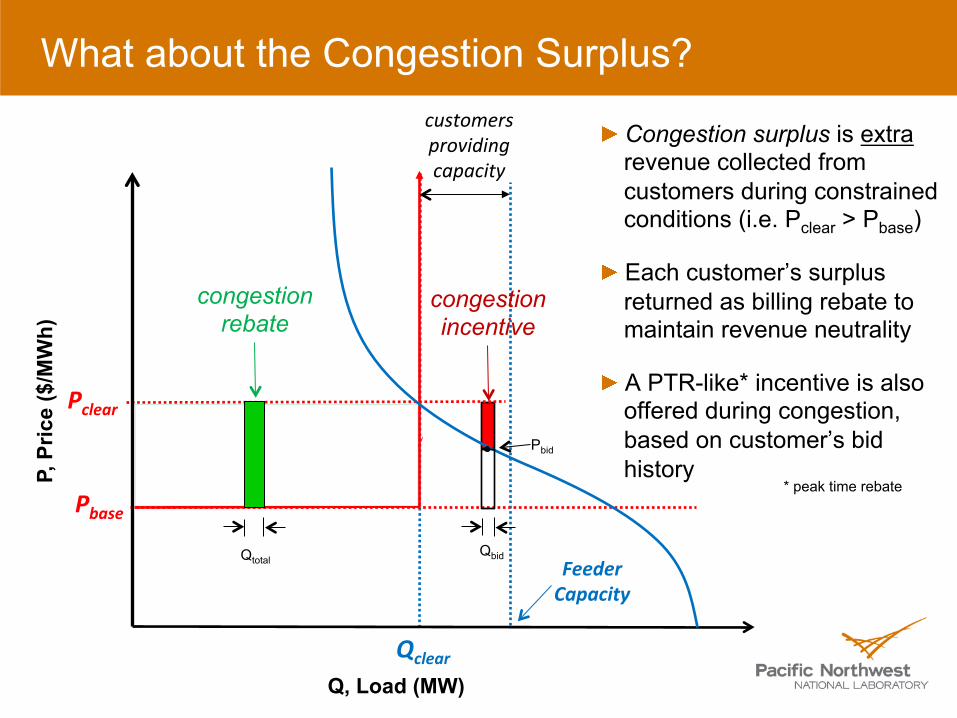
What about the Congestion Surplus? customers providing capacity
Q, Load (MW)
P, P
rice
($/M
Wh)
Pclear
Qclear
Feeder Capacity
Congestion surplus is extra revenue collected from customers during constrained conditions (i.e. Pclear > Pbase)
Each customer’s surplus returned as billing rebate to maintain revenue neutrality
A PTR-like* incentive is also offered during congestion, based on customer’s bid history
Pbase
Congestion Surplust
Qbid
Pbid
* peak time rebate
Qtotal
congestion rebate
congestion incentive

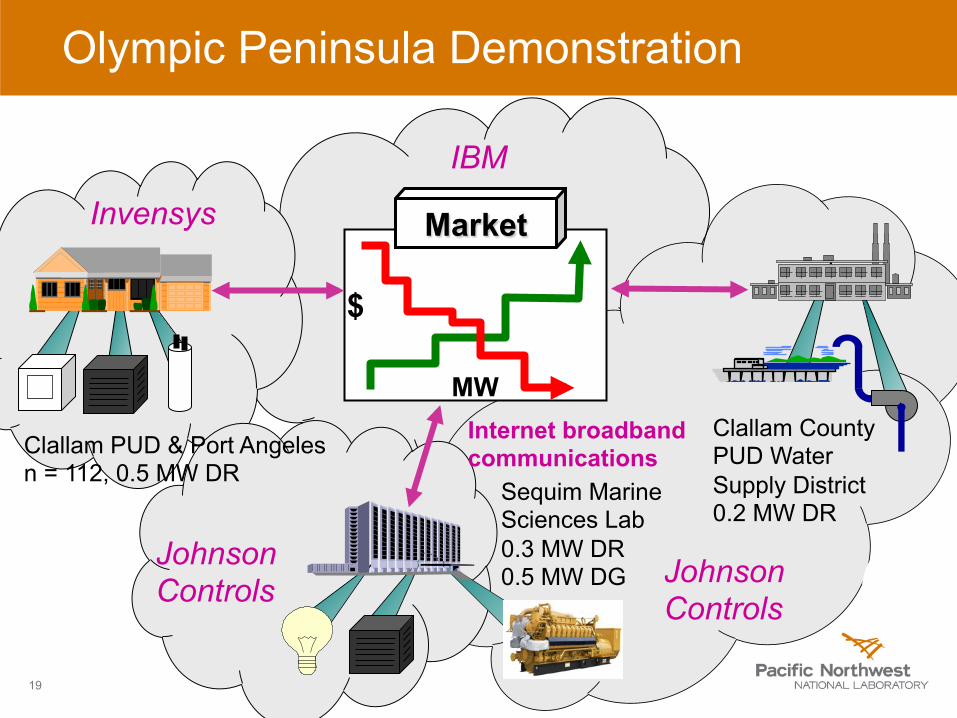
Fully Engaging Demand: What We’ve Learned from the Olympic Peninsula Demonstration
19
ancillary services
0 6 12 18 24
IBM
distribution congestion transmission congestion
wholesale cost
Johnson Controls
Invensys
Johnson Controls
$
MW
Market
Internet broadband communications Clallam PUD & Port Angeles
n = 112, 0.5 MW DR
Clallam County PUD Water Supply District 0.2 MW DR
Sequim Marine Sciences Lab 0.3 MW DR 0.5 MW DG
Olympic Peninsula Demonstration
20
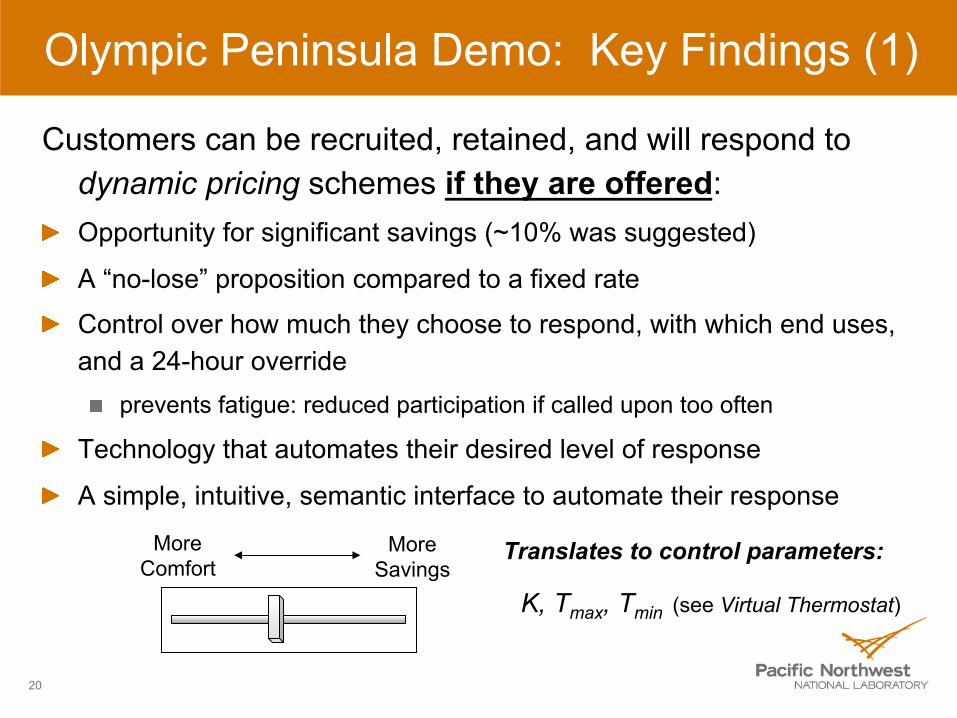
Olympic Peninsula Demo: Key Findings (1)
Customers can be recruited, retained, and will respond to dynamic pricing schemes if they are offered: Opportunity for significant savings (~10% was suggested)
A “no-lose” proposition compared to a fixed rate
Control over how much they choose to respond, with which end uses, and a 24-hour override
prevents fatigue: reduced participation if called upon too often
Technology that automates their desired level of response
A simple, intuitive, semantic interface to automate their response
Translates to control parameters:
K, Tmax, Tmin (see Virtual Thermostat)
More Comfort
More Savings
21
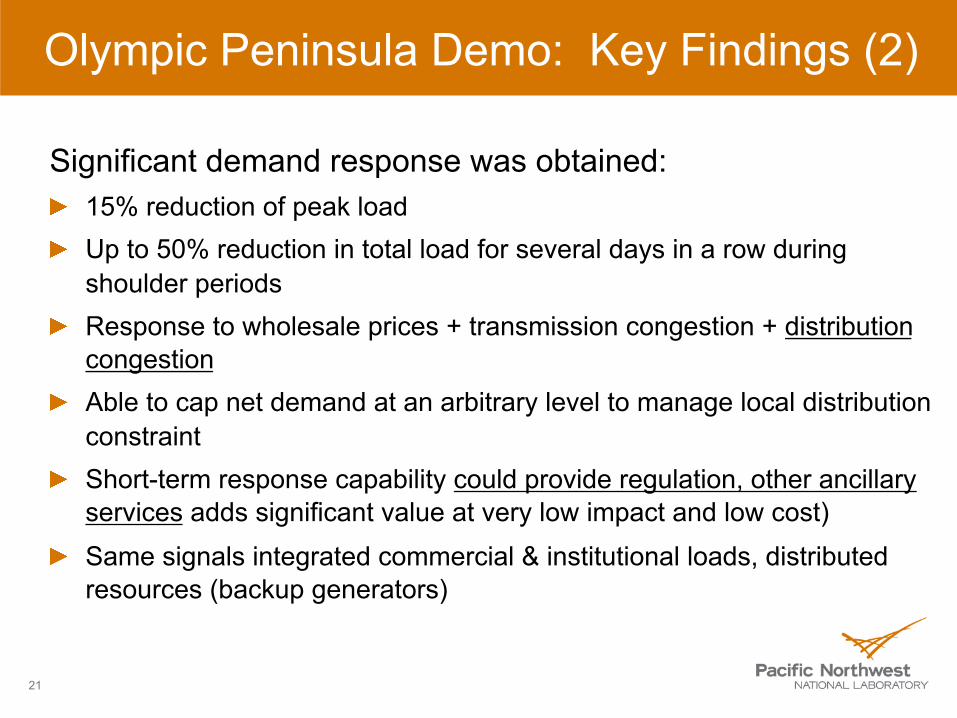
Olympic Peninsula Demo: Key Findings (2)
Significant demand response was obtained: 15% reduction of peak load Up to 50% reduction in total load for several days in a row during shoulder periods Response to wholesale prices + transmission congestion + distribution congestion Able to cap net demand at an arbitrary level to manage local distribution constraint Short-term response capability could provide regulation, other ancillary services adds significant value at very low impact and low cost) Same signals integrated commercial & institutional loads, distributed resources (backup generators)
Market-based Coordination of Thermostatically Controlled Loads With User Preferences
Background
23
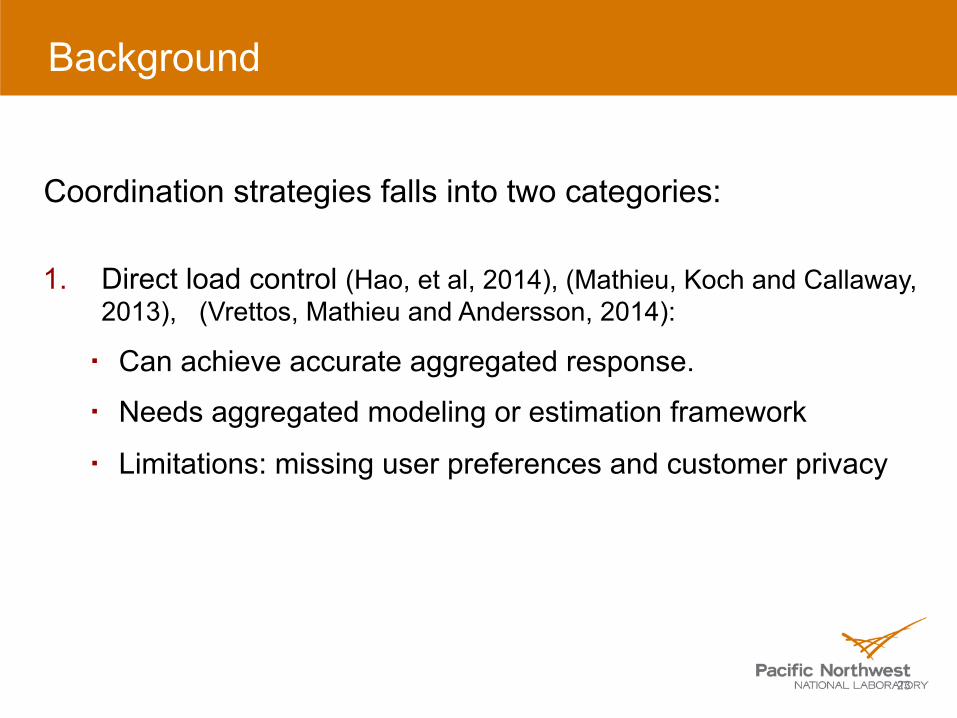
1. Direct load control (Hao, et al, 2014), (Mathieu, Koch and Callaway, 2013), (Vrettos, Mathieu and Andersson, 2014):
▪ Can achieve accurate aggregated response.
▪ Needs aggregated modeling or estimation framework
▪ Limitations: missing user preferences and customer privacy
Coordination strategies falls into two categories:
Background
24
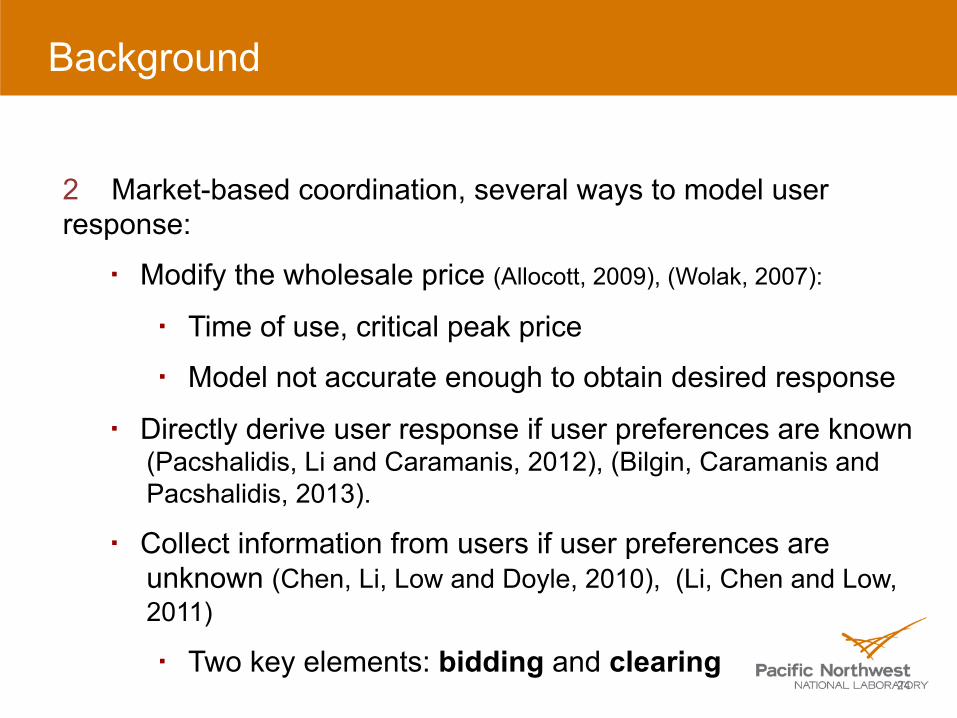
2 Market-based coordination, several ways to model user response:
▪ Modify the wholesale price (Allocott, 2009), (Wolak, 2007):
▪ Time of use, critical peak price
▪ Model not accurate enough to obtain desired response
▪ Directly derive user response if user preferences are known (Pacshalidis, Li and Caramanis, 2012), (Bilgin, Caramanis and Pacshalidis, 2013).
▪ Collect information from users if user preferences are unknown (Chen, Li, Low and Doyle, 2010), (Li, Chen and Low, 2011)
▪ Two key elements: bidding and clearing
Motivating Example
25
▪ The coordinator purchases energy from the wholesale market and sells it to users.
▪ Needs to respect the feeder capacity constraint
▪ Two key elements: bidding and clearing.
The GridWise demonstration project: (Fuller, Schneider and Chassin, 2011)
Motivating Example
26
Price
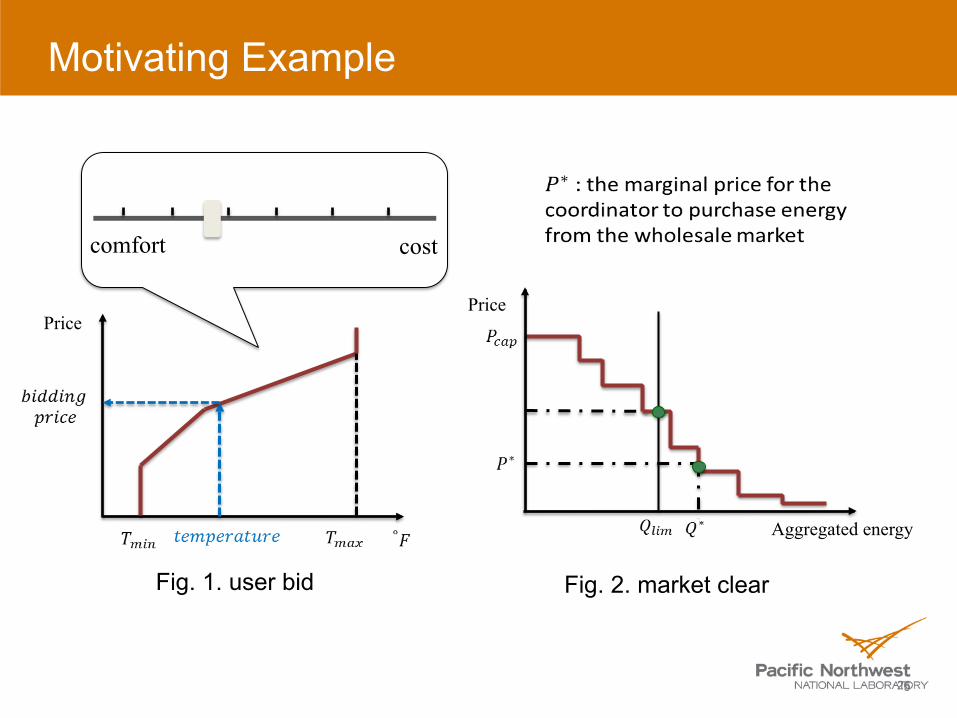
Fig. 1. user bid
comfort cost
5
Price
Aggregated energy
Fig. 2. market clear
Motivating Example
▪ The demonstration project:
▪ Novelties: a pre-fixed way to enable user-coordinator interaction.
▪ Limitation: the aggregated user response curve is not accurate.
▪ Our objective
▪ Formally formulate the problem.
▪ bidding and clearing.
The Formulation
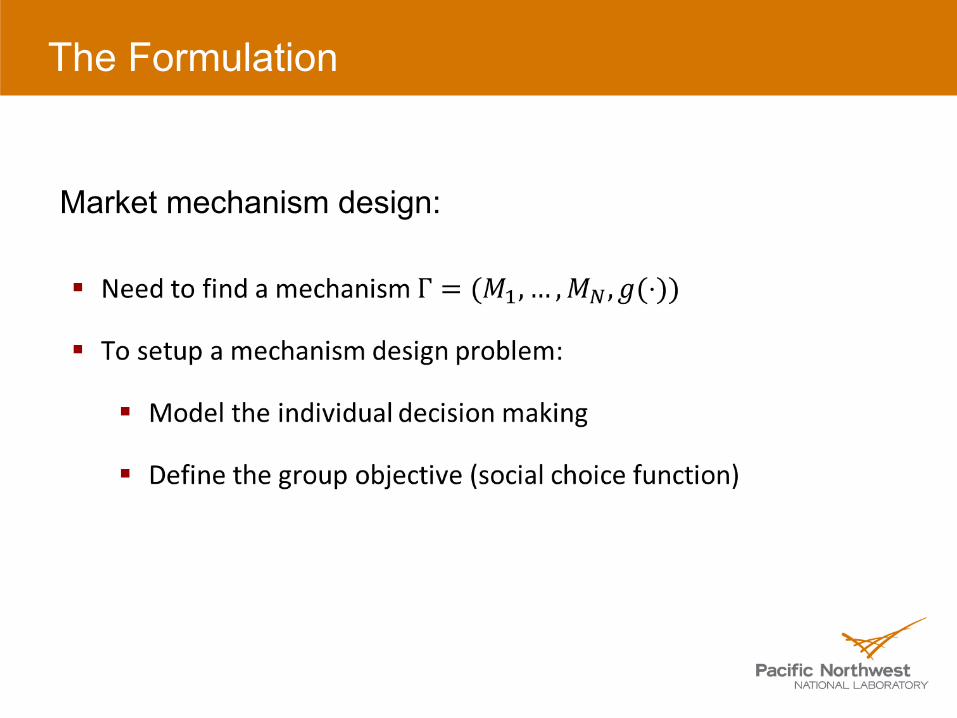
Market mechanism design:
The Formulation
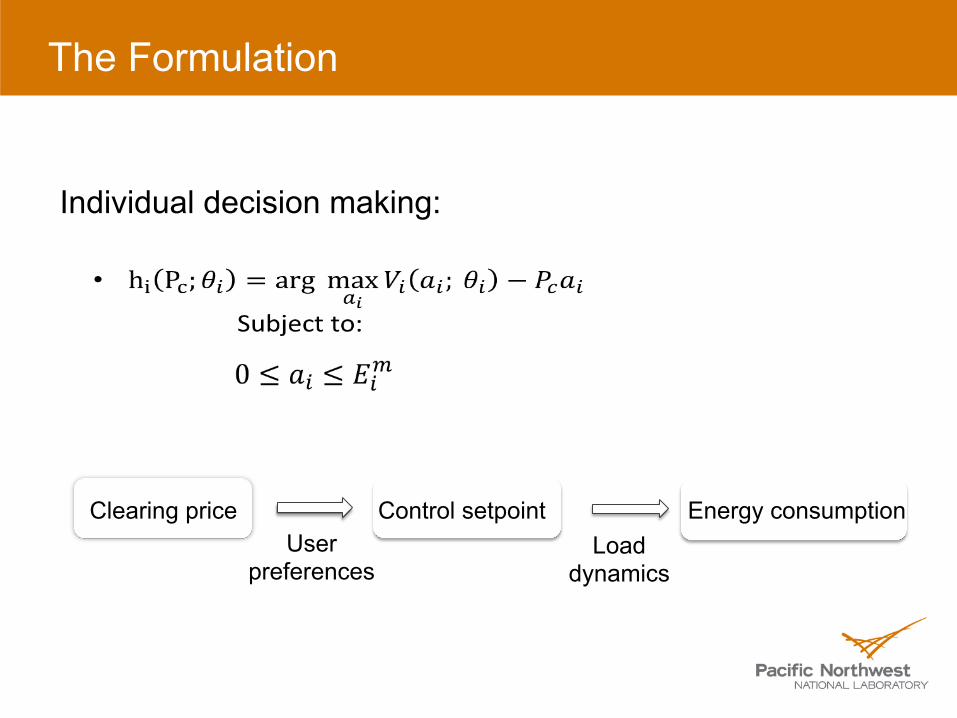
Individual decision making:
Clearing price Control setpoint Energy consumption User
preferences Load
dynamics
The Formulation
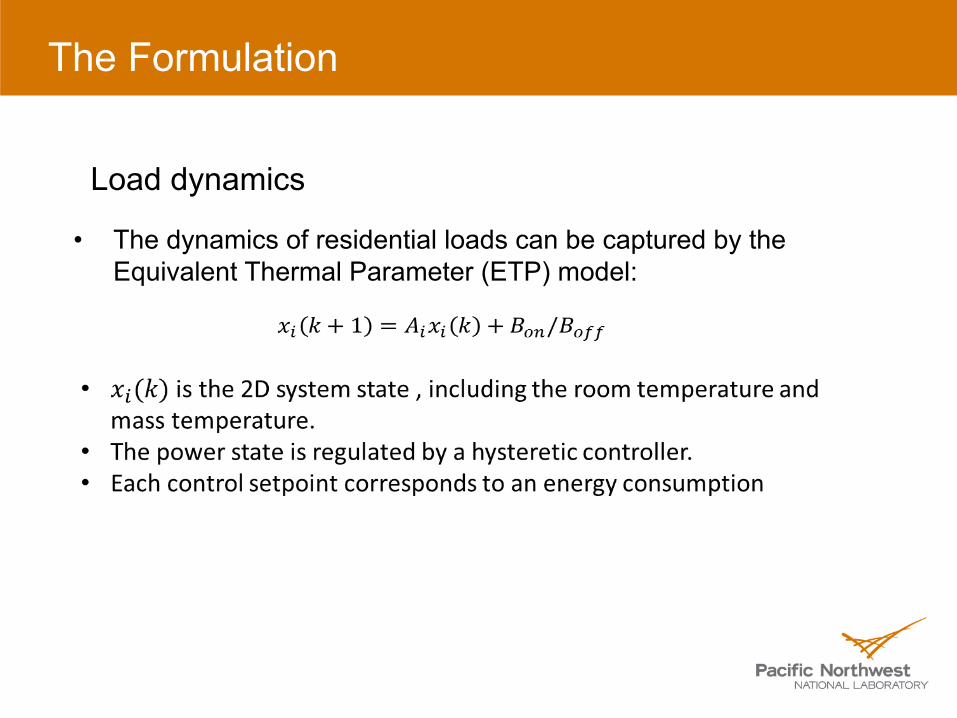
• The dynamics of residential loads can be captured by the Equivalent Thermal Parameter (ETP) model:
Load dynamics
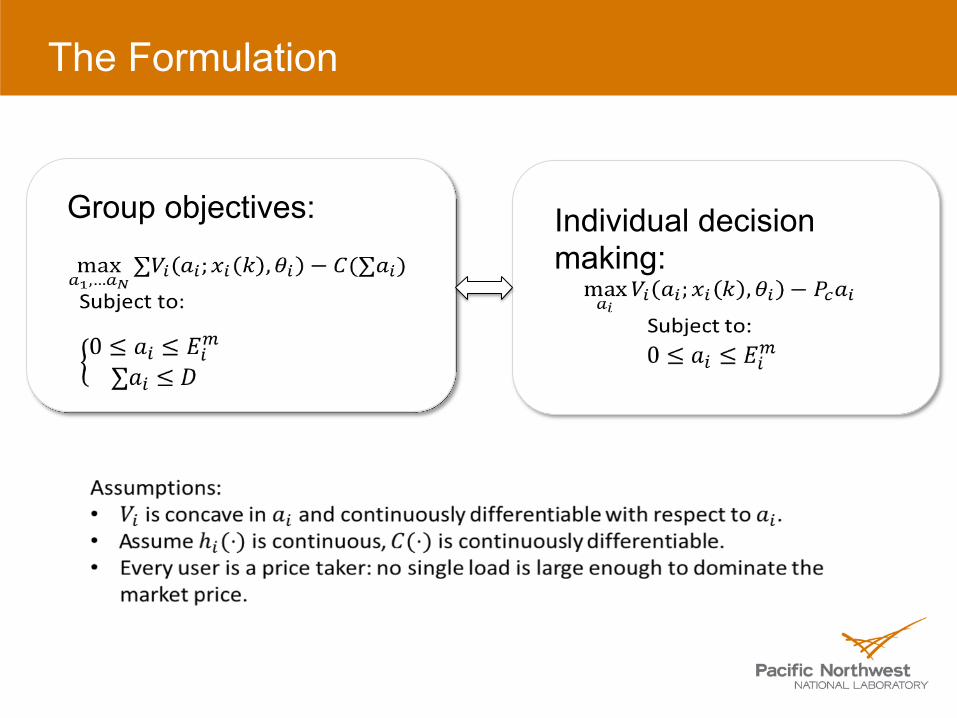
The Formulation
Energy allocation
Group objectives:
Individual decision making:
The Proposed Mechanism*
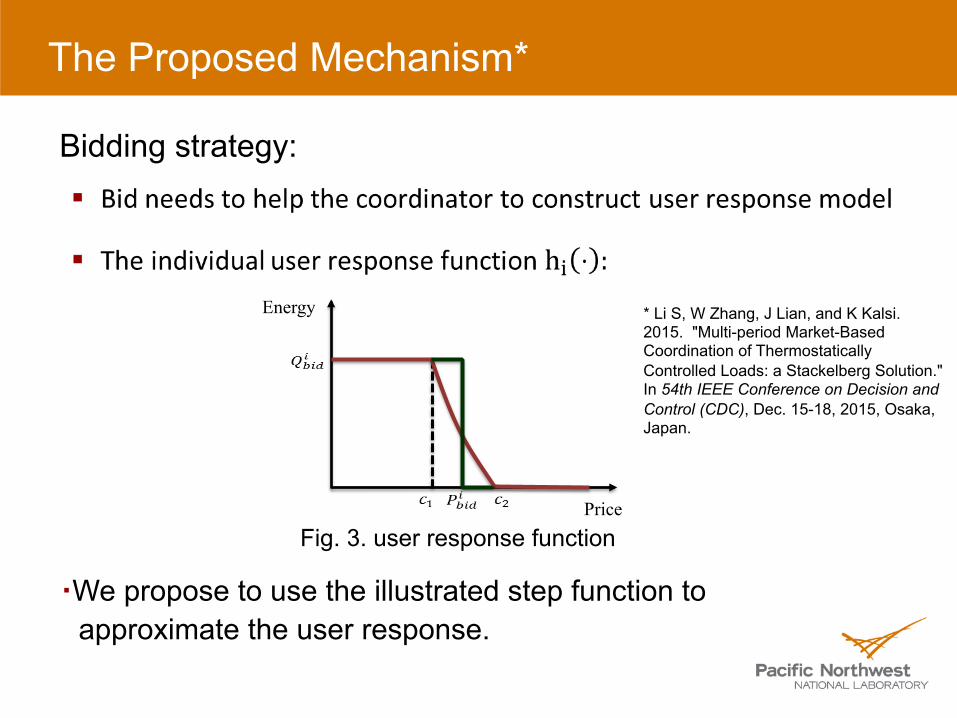
Bidding strategy:
Price
Energy
▪ We propose to use the illustrated step function to approximate the user response.
Fig. 3. user response function
* Li S, W Zhang, J Lian, and K Kalsi. 2015. "Multi-period Market-Based Coordination of Thermostatically Controlled Loads: a Stackelberg Solution." In 54th IEEE Conference on Decision and Control (CDC), Dec. 15-18, 2015, Osaka, Japan.
The Proposed Mechanism
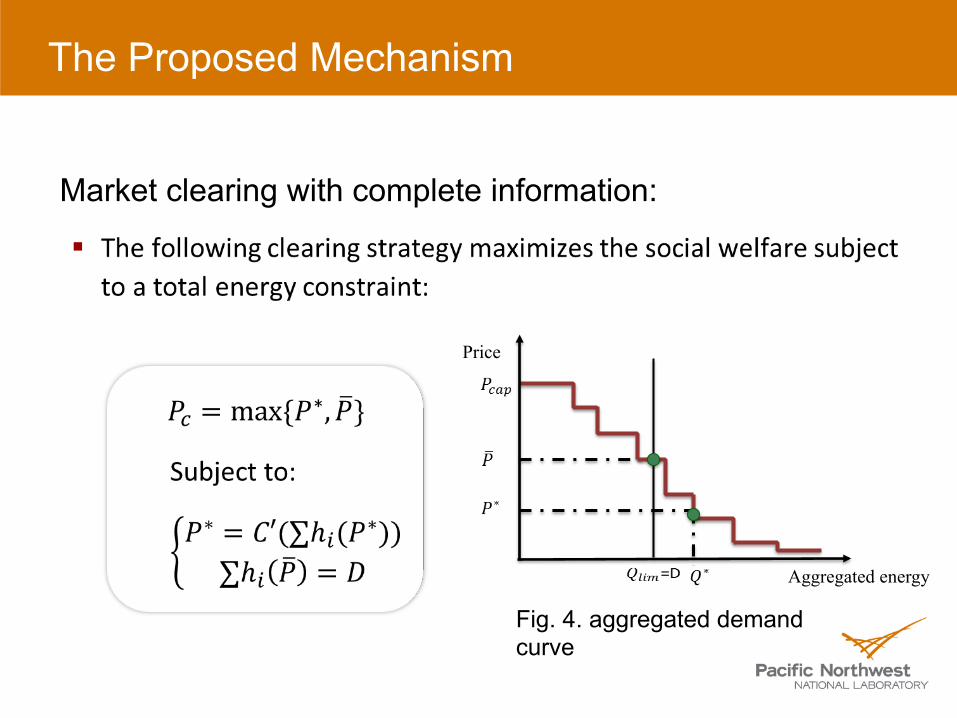
Market clearing with complete information:
Price
Aggregated energy
Fig. 4. aggregated demand curve
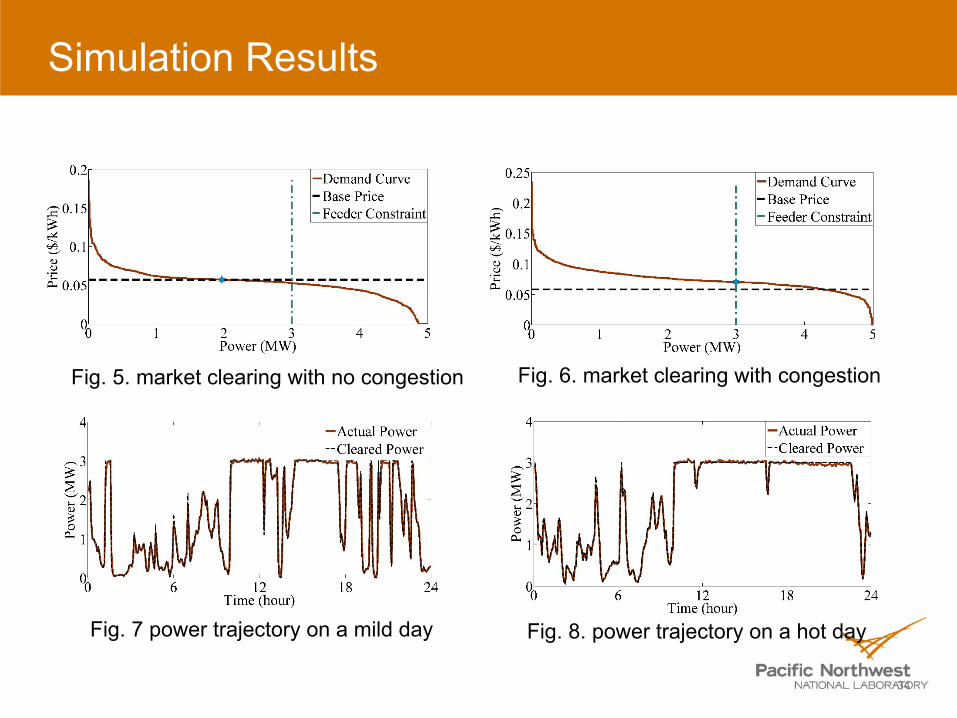
Simulation Results
34
Fig. 5. market clearing with no congestion Fig. 6. market clearing with congestion
Fig. 7 power trajectory on a mild day Fig. 8. power trajectory on a hot day

Comments and questions?
35
Thank you!