transcentury - opportunities in power in africa
TRANSCRIPT

INVESTING IN AFRICA
TransCentury Opportunities in Power in Africa8th July, 2015
2

Installed power generation in Africa
3
Source: EIA 2008 and AFREPEN Nairobi
NorthAfrica (172m)
Sub-SaharanAfrica (883m)
SouthAfrica (53m)
44 GW
123 GW
31 GW
48 GW
Russia: 245 GW of power for 142m inhabitants
2008 2009 2010 2011 2012 2013 2014 2015 2016 2017 2030
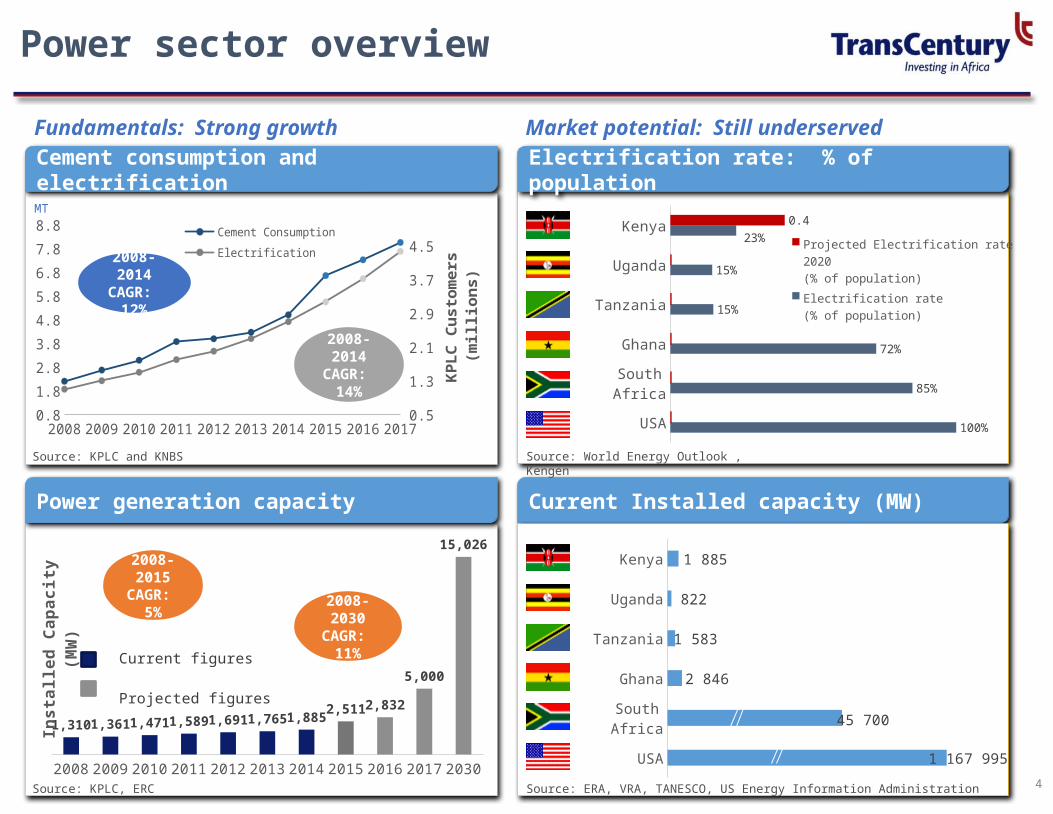
1,310 1,361 1,471 1,589 1,691 1,765 1,8852,511 2,832
5,000
15,026
Ins
talle
d C
ap
ac
ity
(M
W)
Current figures
Projected figures
2008 2009 2010 2011 2012 2013 2014 2015 2016 20170.8
1.8
2.8
3.8
4.8
5.8
6.8
7.8
8.8
0.50.91.31.72.12.52.93.33.74.14.54.9Cement Consumption
Electrification
KPLC
Cus
tom
ers
(mill
ions
)
USA
South Africa
Ghana
Tanzania
Uganda
Kenya
100%
85%
72%
15%
15%
23%
0.4
Projected Electrification rate 2020 (% of population)
Electrification rate (% of population)
Power sector overview
Electrification rate: % of populationCement consumption and electrification
Current Installed capacity (MW)Power generation capacity
4
Fundamentals: Strong growth Market potential: Still underserved
Source: World Energy Outlook , Kengen
Source: ERA, VRA, TANESCO, US Energy Information Administration
Source: KPLC and KNBS
Source: KPLC, ERC
MT
2008-2014CAGR: 12%
2008-2014CAGR: 14%
Kenya
Uganda
Tanzania
Ghana
South Africa
USA
1 885
822
1 583
2 846
45 700
1 167 995
2008-2015CAGR: 5%
2008-2030CAGR: 11%
Contact us
5
For enquiries, please contact:
Dr. Gachao Kiuna
Chief Executive Officer – TransCentury Limited
Tel: +254 20 224 5350/5232 or +254 20 300 6327
Fax: +254 20 224 5253
Email: [email protected]