transcom swedbank mid-quarter update seminar quarter updat… · transcom swedbank mid-quarter...
TRANSCRIPT

29 August 2013
TranscomSwedbank Mid-Quarter Update Seminar
Johan Eriksson, President & CEO
Outstanding
Customer
Experience

Transcom at a glance
1

Transcom in numbers
3
• 29,000 people
• 62 contact centers, onshore, off-shore and near shore
• 26 countries
• Delivering services in 33 languages...
• ...to over 400 clients in various industry verticals
• €605.6 million revenue in 2012
• Market cap: SEK 921.7 million as at August 26, 2013. Listed on NASDAQ OMX Stockholm
(TWW SDB B and TWW SDB A)
4
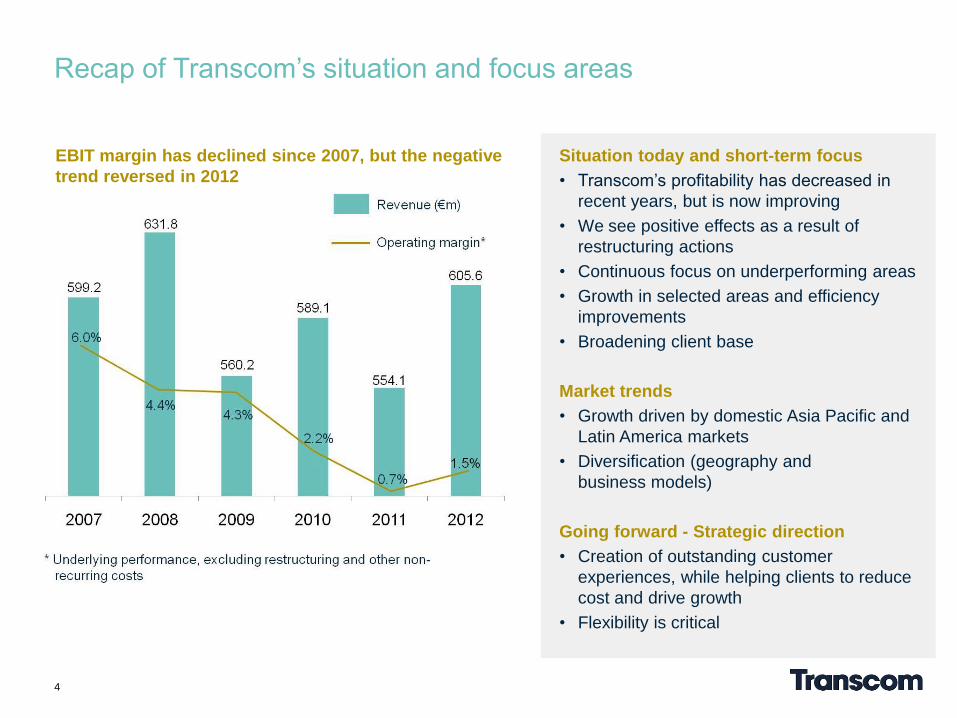
Situation today and short-term focus
• Transcom’s profitability has decreased in
recent years, but is now improving
• We see positive effects as a result of
restructuring actions
• Continuous focus on underperforming areas
• Growth in selected areas and efficiency
improvements
• Broadening client base
Market trends
• Growth driven by domestic Asia Pacific and
Latin America markets
• Diversification (geography and
business models)
Going forward - Strategic direction
• Creation of outstanding customer
experiences, while helping clients to reduce
cost and drive growth
• Flexibility is critical
EBIT margin has declined since 2007, but the negative
trend reversed in 2012
Recap of Transcom’s situation and focus areas

Our performance in Q2 2013
2

Revenue in Q2 2013 increased 13.0% compared to Q2 2012
38.0 43.9
27.031.6
28.9
34.6
25.7
27.514.0
15.813.8
13.1
Q2 2012 Q2 20136
Central Europe
South
Iberia
North America
& Asia Pacific
North
Growth
+15.5%
CMS
Net revenue, Q213 vs. Q212
€m
+17.0%
+19.7%
+7.0%
+12.9%
-5.1%
166.5
147.4
• Stable growth in our CRM operations
• Main driver is increasing volumes with our installed client base
• Several new clients added during the year also contributed significantly

Transcom’s win rate* increased by 22 percent in H1 2013 compared to H1 2012
7
• Qualification process strengthened
• Leverage existing client relationships to grow with them in new
geographies
• Targeted sales efforts
- Focus on business proposition
- Optimize seat capacity utilization in all locations
- Grow with domestic clients in selected geographies,
especially Latin America (focus in 2014) and Asia Pacific
(business started for several new local clients in 2013)
* % win of qualified opportunities
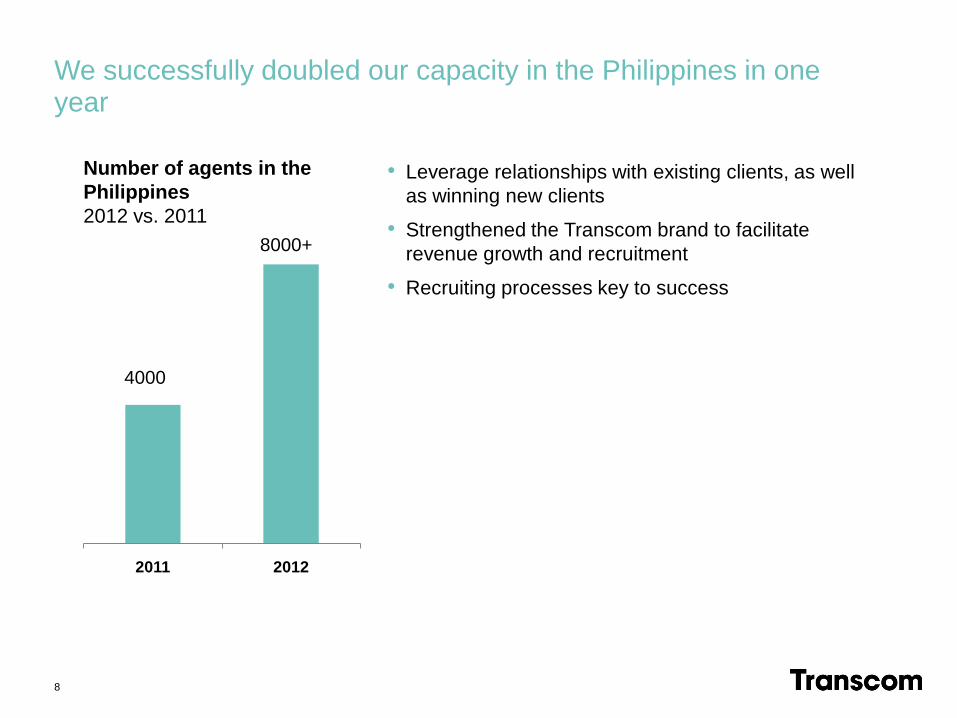
We successfully doubled our capacity in the Philippines in one year
8
2011 2012
4000
8000+
Number of agents in the
Philippines
2012 vs. 2011
• Leverage relationships with existing clients, as well
as winning new clients
• Strengthened the Transcom brand to facilitate
revenue growth and recruitment
• Recruiting processes key to success

The value we deliver to our clients is also recognized by industry observers
9
• Transcom was presented with the 2013 Frost & Sullivan Philippines Contact Center
Outsourcing Customer Value Enhancement Award
“Increasingly, Transcom is seen by its clients as a reliable partner whom they
can rely on to drive sales and growth. The company’s organic revenue growth is
testimony enough of its client engagement and value it delivers for them.”
Krishna Baidya, Research Manager for ICT, Frost & Sullivan Asia Pacific
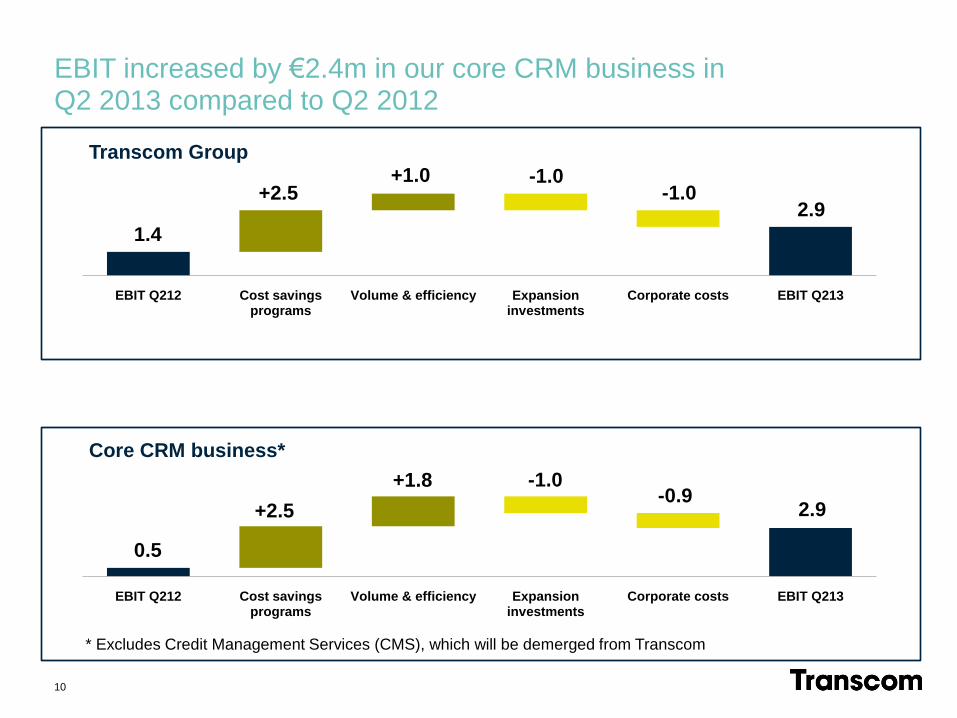
EBIT Q212 Cost savings programs
Volume & efficiency Expansion investments
Corporate costs EBIT Q213
1.4
+2.5+1.0 -1.0
-1.02.9
EBIT Q212 Cost savings programs
Volume & efficiency Expansion investments
Corporate costs EBIT Q213
0.5
+2.5
+1.8 -1.0-0.9
2.9
EBIT increased by €2.4m in our core CRM business in Q2 2013 compared to Q2 2012
10
Transcom Group
Core CRM business*
* Excludes Credit Management Services (CMS), which will be demerged from Transcom

Short-term focus areas to improve profitability
3

We need to successfully address a number of short-and medium-term operational and financial challenges
12
Stop the losses in France (€1m/month in 2012).
Increase onshore seat utilization in North America
Successfully resolve tax claims
Lower corporate costs
Improve operational performance in Latin America
Successfully implement action plan to improve operational performance in the North region

Key business/pricing models used by Transcom
13
Business/pricing
model
Key characteristics
Price per
transaction (e.g.
call or data entry)
• Transcom gets paid for each transaction, e.g. each call
taken
• Time spent per transaction is capped critical to
balance quality and time spent on each transaction
• Accuracy of volume forecast is key to planning and
profitability
Price per minute • Transcom gets paid based on the time the agent
spends with each customer (usually no cap)
• Accuracy of volume forecast is key to planning and
profitability, but less risk than in price per call models
Price per activity • Typically used for back-office tasks/processes
• Time spent per activity is capped important to
balance quality and time spent on each task
• Transcom uses client systems and pre-defined
processes
• Back-office tasks usually take longer to complete than
the typical call
Price per hour • Provides a greater degree of financial predictability
and stability
Currently the most
commonly used
model in the North
region
Alternative models
used by Transcom

Our target is to improve the balance of pricing models used in all regions…
14
Pricing model North
region
Average for other
regions
(benchmark)
Price per transaction (e.g. call)
Price per minute
Price per activity
Price per hour
1-25%
26-50%
51-80%
0%
• Business model mix currently used in the North
region is more exposed to accuracy of volume
forecasts, compared to other regions
Key business models used by Transcom, by region

...in order to avoid excessive risk due to poor forecast accuracy
15
Scheduled staffing level based on forecast
Staffing need based on actual volume
Invoice sent out
two days later
than forecast
Delayed
campaign
Time
Example
Going forward– Transcom’s strategic direction
4

17
Transcom’s brand promise
Outstanding Customer
Experience, driving
revenue and brand
loyalty
”
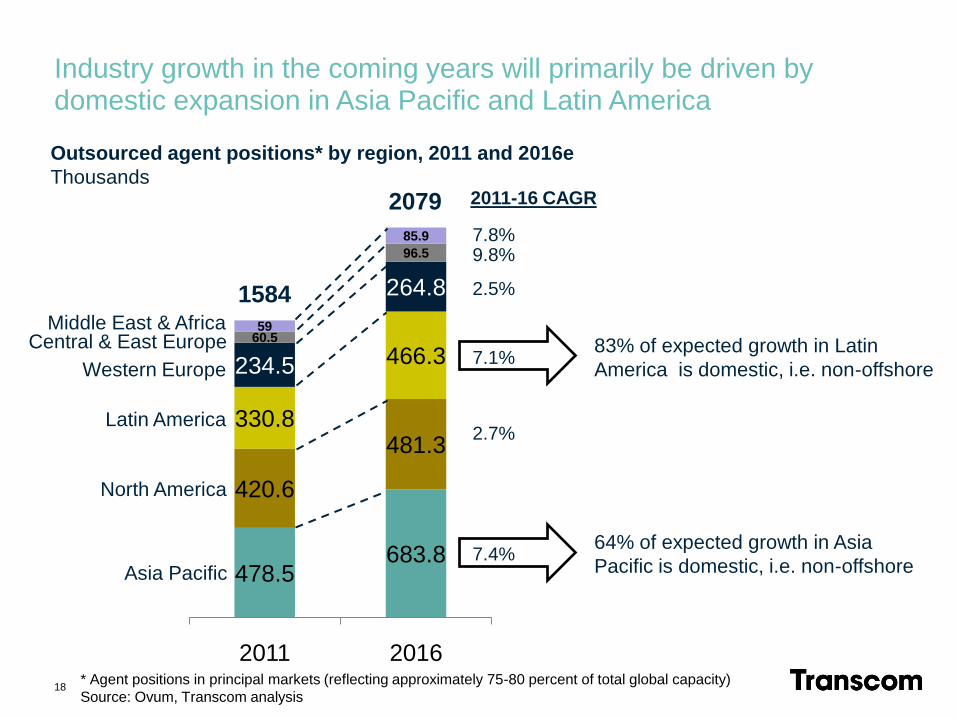
Industry growth in the coming years will primarily be driven by domestic expansion in Asia Pacific and Latin America
478.5683.8
420.6
481.3330.8
466.3234.5
264.8
60.5
96.5
59
85.9
2011 2016
18
Central & East Europe
Western Europe
Latin America
North America
Asia Pacific
1584
2079 2011-16 CAGR
7.8%9.8%
7.1%
2.7%
7.4%
* Agent positions in principal markets (reflecting approximately 75-80 percent of total global capacity)
Source: Ovum, Transcom analysis
Middle East & Africa
2.5%
83% of expected growth in Latin
America is domestic, i.e. non-offshore
64% of expected growth in Asia
Pacific is domestic, i.e. non-offshore
Outsourced agent positions* by region, 2011 and 2016e
Thousands

19
Short-term focus
• Executing turnaround in underperforming areas
• Revenue expansion and efficiency improvements
• Quality and service delivery
Medium-to long-term priorities
• Grow revenue at least in line with overall market growth in the markets where we choose to compete
• Improve profitability and decrease earnings volatility
- Continuously strengthen operational
efficiency
- Optimizing our geographic delivery mix
- Focus on broadening our client base
Growth opportunities and key priorities going forward
North America and Asia Pacific
• Continue expanding in local markets in Asia Pacific
Latin America
• Serving domestic markets and the US, in addition to Spanish clients
• Enter new countries to improve competitiveness
North Europe
• Leverage strong position in home market
Central Europe
• Primarily near shore opportunities
• Strong capability in expanding Eastern European markets
Growth opportunities Key priorities

Thank you!
Questions?
