transcriptome analysis of lactococcus lactis in co...
TRANSCRIPT

1
Transcriptome analysis of Lactococcus lactis in co-culture with
Saccharomyces cerevisiae
Mathieu MALIGOY, Myriam MERCADE, Muriel COCAIGN-BOUSQUET, Pascal
LOUBIERE*
UMR5504, UMR792 Ingénierie des Systèmes Biologiques et des Procédés, CNRS, INRA,
INSA, F-31400 Toulouse
*correspondent foot-note: e-mail: [email protected]
INSA – LISBP, 135 Avenue de Rangueil,
31077 Toulouse cedex 4, France.
Tel: (33) 561 559 465
Fax: (33) 561 559 400
RUNNING TITLE: The mixed culture of L. lactis and S. cerevisiae
KEY WORDS: Lactococcus lactis, Saccharomyces cerevisiae, mixed culture, transcriptome,
interspecies interaction.
ACCEPTED
Copyright © 2007, American Society for Microbiology and/or the Listed Authors/Institutions. All Rights Reserved.Appl. Environ. Microbiol. doi:10.1128/AEM.01531-07 AEM Accepts, published online ahead of print on 9 November 2007
on May 26, 2018 by guest
http://aem.asm
.org/D
ownloaded from

2
Transcriptome analysis of Lactococcus lactis in co-culture with 1
Saccharomyces cerevisiae 2
3
Mathieu MALIGOY, Myriam MERCADE, Muriel COCAIGN-BOUSQUET, Pascal 4
LOUBIERE* 5
6
ABSTRACT 7
The study of microbial interactions in mixed cultures remains an important conceptual 8
and methodological challenge, for which transcriptomic analysis could prove to be an 9
essential manner in which to improve our understanding.. However, the use of whole genome 10
DNA chips is often restricted to pure cultures of the species for which they were designed. In 11
this study massive cross-hybridization was observed between foreign cDNA and a specific L. 12
lactis DNA chip. A very simple method, consisting in the addition of microbial partner’s 13
DNA, was proposed to considerably decrease this non specific hybridization. A correlation 14
was established between the resulting cross-hybridization and the phylogenetic distance 15
between the microbial partners. The response of L. lactis to the presence of S. cerevisiae was 16
analyzed during the exponential growth phase in fermentors in defined growth conditions. 17
Although no differences in growth kinetics were observed between the pure and mixed 18
cultures of L. lactis, the mRNA level of 158 genes was significantly modified. More 19
particularly, a strong reorientation of pyrimidine metabolism was observed when L. lactis was 20
grown in mixed cultures. These transcript abundance changes were demonstrated to be 21
regulated by the ethanol produced by the yeast, and were confirmed by an independent 22
method (quantitative RT-PCR). 23
24
ACCEPTED
on May 26, 2018 by guest
http://aem.asm
.org/D
ownloaded from

3
INTRODUCTION 1
In technological food processes as well as in natural ecosystems, the observed 2
biological transformations are generally the result of the activity of complex microbial flora. 3
Moreover, the global activity of a mixed microbial population is determined by the presence 4
and the functions of each species, strongly determined themselves by the interactions between 5
the different partners. However, the current knowledge on microbial physiology is generally 6
based on pure culture studies which are different from the conditions encountered in complex 7
ecosystems. In consequence, performing mixed cultures is an essential way to get closer to the 8
reality of complex populations. 9
Microarray technology provides a powerful tool to give an overview of cell responses 10
to environmental changes at the transcriptional level. However, the application of this 11
technology to the study of heterogeneous microbial populations is still a conceptual and 12
methodological challenge. Generally, the biochips used in mixed cultures are not pangenomic 13
and only rarely serve for transcript detection. Most of them are devoted to the detection of 14
microbial species in complex ecosystems -through ribosomal DNA sequences-, or to the 15
detection of reduced number of DNA sequences without quantifying their expression level (5; 16
27; 34; 41; 42). Some articles mention the use of DNA biochips for mRNA quantification but 17
were mostly restricted to a limited number of mRNAs (8; 12; 32). Only very recently has the 18
use of pangenomic biochips to study mixed cultures been mentioned (15). 19
The major obstacle to the utilization of microarray for transcriptome analysis with 20
multiple species population is the cross-hybridization of the partner species’ DNA on the 21
microarray spots defined for a specific organism. RNA extracted from mixed cultures comes 22
from each species in the population, is reverse-transcribed and labeled, and the resulting mix 23
of cDNA is hybridized on the microarray. In consequence, the specific signal of cDNA 24
coming from the organism of interest is corrupted by hybridization of foreign cDNA. 25
ACCEPTED
on May 26, 2018 by guest
http://aem.asm
.org/D
ownloaded from

4
Differential extraction protocols could be an interesting way in the future to reduce this cross 1
hybridization, but in this case the methodological improvements should be more or less 2
species specific. In this paper, we describe a new and simple method which enabled the noise 3
resulting from other species cDNA from different species to be significantly reduced on 4
Lactococcus lactis microarrays. 5
L. lactis is considered as a model lactic acid bacteria, extensively encountered in 6
numerous food fermentations, particularly in cheese production, industrial processes and 7
natural ecosystems. The DNA arrays for L. lactis IL1403 strain, the first sequenced 8
lactococcal strain (6), have recently been used for transcriptomic analysis of L. lactis pure 9
cultures (4; 19; 30; 31). However, in most cases, L. lactis lives together with multiple 10
microorganisms such as lactobacilli, corynebacteria, or yeasts (7; 11; 24; 26; 28; 33; 35). It is 11
then of critical interest to be able to study its behaviour in mixed cultures. On the other hand, 12
Saccharomyces cerevisiae is the model yeast, well characterized and studied, which co-exists 13
in ecosystems such as kefir with lactic acid bacteria. Thus yeasts and lactic acid bacteria often 14
share the same environment, but little is known about their possible interactions. In our study, 15
L. lactis pure cultures and L. lactis / S. cerevisiae mixed cultures were compared in 16
fermentors in well-defined culture conditions. The macroscopic behaviour of each culture was 17
linked to the measured nutritional and environmental parameters. Finally, the proposed 18
microarray method improvement enabled the complete transcriptomic analysis of a bacterium 19
in a mixed culture to be undertaken. 20
21
MATERIALS AND METHODS 22
Organisms and growth conditions 23
The microorganisms used throughout this work were Lactococcus lactis ssp. lactis 24
IL1403, Lactobacillus plantarum WCFS1, Corynebacterium glutamicum ATCC13032, and 25
ACCEPTED
on May 26, 2018 by guest
http://aem.asm
.org/D
ownloaded from

5
Saccharomyces cerevisiae CEN-PK905. They were all grown, except Corynebacteriurm 1
glutamicum, in a semi-synthetic medium containing glucose (20 g.l-1
), yeast extract (10 g.l-1
), 2
KH2PO4 (9 g.l-1
), K2HPO4 (7.5 g.l-1
), MgCl2 (0.2 g.l-1
), and ergosterol (6 mg.l-1
) dissolved in 3
pure ethanol, and sterilized by filtration (Sartorius 0.2 µm), in anaerobic conditions, under 4
nitrogen atmosphere, in a 2-liters fermentor (Setric Génie Industriel, Toulouse, France) at 5
agitation speed of 350 rpm. The temperature in the fermentor was maintained at 34 °C, and 6
the pH was maintained at 6.6 with automatic addition of KOH (10 N). Inoculation was made 7
with cells from pre-cultures grown on the same medium. Pre-culture cells were harvested 8
during the exponential growth phase and concentrated in order to obtain an initial OD580 of 9
0.01-0.02 in the fermentor. Corynebacterium glutamicum was grown in LB medium 10
supplemented with glucose (20 g.l-1
) in same conditions but with aeration. 11
In order to analyze the effect of the yeast fermentation products on some of the L. 12
lactis transcript levels, pulse experiments consisting in the addition of ethanol (30 mM) or 13
Na-carbonate (30 mM) at 2.5 hours of L. lactis batch culture were done. A concentrated 14
solution of sodium carbonate (160 g.l-1
) as well as pure ethanol were sterilized by filtration 15
(Sartorius 0.2 µm), and added in the fermentor with a syringe. 16
Fermentation analysis 17
Bacterial growth was estimated by spectrophotometric measurement at 580 nm and 18
plate count on the medium used in bioreactors supplemented with agarose (20 g.l-1
) (1 OD 19
unit was equivalent to 0.30 and 0.24 g of dry matter per liter, and to 7.108 and 5.10
7 cfu per 20
liter for L. lactis and S. cerevisiae respectively). Differences in colony morphology enabled 21
the two species to be counted separately in mixed cultures. Protein precipitation of the 22
samples was performed with a solution of Barium Hydroxide and Zinc Sulfate 0.3 M prior to 23
measurement of substrate (glucose) and fermentation product (lactate, formate, acetate, 24
glycerol and ethanol) concentrations by high-pressure liquid chromatography (9). 25
ACCEPTED
on May 26, 2018 by guest
http://aem.asm
.org/D
ownloaded from

6
Concentrations of ethanol and acetic acid in the medium were determined by gas 1
chromatography using a Poraplot Q column (25 m × 0.53 mm) with nitrogen as carrier gas 2
and flame ionisation detection (Hewlett Packard, 5890 A) and the following conditions : an 3
injection temperature of 220 °C, initial oven temperature of 210 °C to final temperature of 4
245 °C at a rate of 30 °C.min–1
and an isotherm of 5 min, a flow rate of carrier gas of 20 5
ml.min–1
and an injected volume of 0.1 µl. The CO2 concentration was not measured in the 6
medium, but was estimated according to the theoretical stoechiometry of 1 mole of CO2 7
produced by mole of ethanol. Concentrations of nucleotide precursor in the supernatant 8
cultures were measured as recently described with a limit of detection of 1 µM (20). 9
Phylogenetic tree 10
The phylogenetic distances between the various species used in the study were 11
estimated with their rRNA homology. Multiple alignments of rRNA sequences (16S for 12
prokaryotes and 18S for the yeast) of Lactococcus lactis, Lactobacillus plantarum, 13
Corynebacterium glutamicum, and Saccharomyces cerevisiae were performed with ClustalW 14
1.8 (36). The phylogenetic tree was then constructed with PHYLIP 3.65 (Joseph Felsenstein, 15
University of Washington), with distance and neighbor-joining methods. Branch lengths are 16
reported in Figure 1. 17
Biochips of Lactococcus lactis 18
L. lactis IL1403 specific PCR products (mean length 535 bp) were provided by 19
Eurogentec and spotted in duplicate on glass slides by the Biochips Platform (Toulouse 20
Génopôle, France). 2003 ORFs of the 2310 identified on the genome were effectively 21
available. 22
RNA extraction 23
Frozen cell pellets corresponding to 6 mg dry weight were dropped into a pre-cooled 5 24
ml Teflon vessel. For the co-culture, the 6 mg of cell dry weight containing L. lactis and S. 25
ACCEPTED
on May 26, 2018 by guest
http://aem.asm
.org/D
ownloaded from
7
cerevisiae was estimated from the plate count. A 7 mm bead made of tungsten carbide was 1
added. The flask was then shaked at 2600 rpm for 2 minutes into a Mikro-Dismembrator 2
(Braun, Melsungen). Powder was re-suspended into 4 ml of RLT buffer (Qiagen) supplied 3
with beta-mercaptoethanol. Following steps of RNA extraction were done according to 4
Qiagen RNeasy protocol including DNase I treatment. RNA quality and quantification were 5
analyzed using a Bioanalyser Agilent 2100 (Agilent technologies). 6
Genomic DNA extraction 7
DNA from Saccharomyces cerevisiae, Lactobacillus plantarum and Corynebacterium 8
glutamicum was extracted using zymolyase or lysozyme digestion and EDTA/SDS treatment 9
in TE buffer. DNA was then purified using isopropanol and ethanol 70 %. The final DNA 10
pellet was treated with RNase and partially digested with SAU3AI. 11
Reverse-transcription and labeling 12
RNA coming from pure or mixed cultures was reverse-transcribed and labeled with a 13
cyanine dye (Cy3 for the reference and Cy5 for the test condition) in a direct process using 14
Labelstar array kits (Qiagen). For the biochip specificity, the L. lactis RNA was labeled with 15
Cy5 and the other species RNA with Cy3 and both were hybridized on the same biochip. 16
For the transcriptomic analysis, the mixed culture (test condition, 2.5 hours of culture, 17
B’) was compared to the pure culture (reference, 2.5 hours of culture, B) on the same slide at 18
the same time. The mRNA level changes between 2 and 3 hours (A and C samples) flanking 19
B sample (2.5 hours) in the pure culture were also determined on another slide. RNA (30 µg) 20
was denatured and then combined with RT-buffer, dNTP mix (0.5 mM final for dATP, dTTP, 21
dCTP; 0.08 mM final for dCTP), random hexamer primers 5 µl (invitrogen), Cy3 or Cy5-22
labelled dCTP (0.02 mM final), RNase inhibitor 20 units (Qiagen) and labelstar reverse 23
transcriptase (Qiagen). The mix was incubated 2 hours at 37 °C. The reaction was stopped by 24
ACCEPTED
on May 26, 2018 by guest
http://aem.asm
.org/D
ownloaded from

8
adding LS solution (Qiagen) and cDNA was purified using MinElute columns (Qiagen). 10 µl 1
were collected for each reaction. 2
An indirect labeling technique adapted for high GC% bacteria was used for C. 3
glutamicum as previously described (14). Aminoallyl-modified nucleotides (aa-dUTP) were 4
incorporated during a first strand reverse transcription (RT reaction). Each RT reaction was 5
performed in 30 µl volumes containing 30 µg total RNA, 2 µl random hexamer primers 6
(Amersham), 0.8 mM dATP, 0.8 mM dCTP, 0.8 mM dGTP, 0.2 mM dTTP, 0.6 mM aa-dUTP 7
(Sigma–Aldrich), 300 units SuperscriptII Reverse transcriptase (Invitrogen), 6 µl five-fold 8
first-strand buffer, 3 µl 100 mM DTT and 0.4 µl of sterile water. Total RNA and hexamer 9
primers were heated to 70 °C for 10 min to denaturate the RNA and chilled on ice for 5 min to 10
anneal the primers. Subsequently, the other components were added to the reaction mix. The 11
RT reaction was carried out for 3 h at 42 °C. The solution was treated with RNaseH 1,25 µl 12
(1,5 U.µl-1
) for 15 min at 37 °C to digest RNA, and 10 min at 70 °C to denaturate the 13
enzymes. The cDNA was purified with columns provided by the MinElute PCR Purification 14
kit (Qiagen). The columns were washed with 70 % ethanol and the cDNA was eluted with 10 15
µl of EB buffer (Qiagen LabelStar kit). Subsequently, 1 µl 0.5 M sodium bicarbonate (pH 9.0) 16
was added to the preparation. The cDNA was transferred to aliquots of Cy3 and Cy5 17
monofunctional NHS-esters (Amersham Biosciences Europe) and incubated for 60 min in the 18
dark. To remove unincorporated fluorophores, the probes were purified again with the 19
MinElute PCR Purification kit following the manufacturer’s protocol. 20
Hybridization of labeled cDNA and scanning the glass slides 21
Experiments were carried out at the Biochips platform of Toulouse with an automatic 22
hybridization chamber (Discovery from Ventana Medical System, Inc). Pre-hybridization 23
occurred in a freshly prepared solution of 1 % BSA, 2x SSC, 0.2 % SDS over 1.5 h at 42, 47 24
or 50 °C. After automatic washing according to the manufacturer’s instructions, the slides 25
ACCEPTED
on May 26, 2018 by guest
http://aem.asm
.org/D
ownloaded from

9
were hybridized for 8 h at 42 or 47 °C, or 5 h at 50 °C in 200 µl ChipHybeTM buffer (Ventana 1
Medical System, Inc) containing 3 µl of Cy3-labelled cDNA and 3 µl of Cy5-labelled cDNA. 2
Unlabelled genomic DNA (20 µl at 20 µg.µl-1
) was added to the solution when necessary, as 3
stated in the text. After hybridization, the slides were washed twice in RiboWash® (Discovery 4
from Ventana Medical System, Inc), then 2 min
in 0.2x SSC, quickly rinsed in isopropanol, 5
and then dried by centrifugation 5 minutes at 3,000 g. Fluorescence signals were captured 6
with a laser scanner (GenePix 4000A from Axon Instrument, CA) and analyzed with the
7
GenePix 3.01 software. 8
Statistical analysis 9
Data were further processed by statistical methods using BioPlot software developed 10
by S. Sokol (Biochips Platform of Toulouse, see http://biopuce.insa-toulouse.fr/). Three 11
methodological independent repetitions were made for each experiment. 12
For the biochip specificity, spot intensity significance was estimated from the 13
fluorescence measured on empty spots. A cutoff threshold (T) was calculated with the 562 14
empty spots, as follows: T = Kempty + 3.σ with Kempty being the mean of the log-intensity of all 15
empty spots and σ the corresponding standard deviation. Intensities beyond this threshold 16
were considered as significant and cross-hybridizing. Spots with insignificant signal as well 17
as empty spots were subtracted from each biochip before normalization. 18
For the transcriptomic analysis, the cross-hybridizing spots were removed from further 19
analysis. Normalization by all spot means was applied excluding insignificant and empty 20
spots of the slide. Normalized log-intensity of each remaining spot (Ns) was then calculated 21
by subtracting the mean of log-intensity of all those spots (Knorm) from the log-intensity of 22
each spot (Ms): Ns = Ms - Knorm. Student’s test was then applied to each normalized spot log-23
intensity in order to detect significant differences between the two wavelengths (P-value < 24
ACCEPTED
on May 26, 2018 by guest
http://aem.asm
.org/D
ownloaded from

10
0.05). Cut-off thresholds have been arbitrarily set so that ratios within the interval 0.91 to 1.1 1
interval were excluded from analysis. Genes with FDR > 0.1 were excluded from analysis. 2
Real-time PCR 3
Four independant RNA extractions from four biological replicates were tested with 4
four independent real-time PCR experiments. 5
RNA extraction and purification including DNAse treatment was described above. 6
Then cDNAs were synthesized, using random primer (invitrogen, 10 ng.µl-1
final), dNTP (0.3 7
mM) and superscript II transcriptase (invitrogen, 6 U.µl-1
) incubated for 1 hour at 42 °C. The 8
reaction was stopped by incubation 15 min at 70 °C. RNase H (invitrogen, 0.05 U) was added 9
before purification of cDNA by microspin G25 columns (Amersham biosciences). 10
Primers for real-time PCR were designed in order to have a length of about 20-24 11
bases, a G/C content over 50 %, a Tm of about 60 °C, and the length of the PCR products 12
ranged between 90 and 150 bp. Beacon designer Biorad software was used to select primer 13
sequences. The specificity of the primers for the gene of interest relative to the entire L. lactis 14
genome sequence was controlled using blast NCBI software. Primers were purchased from 15
Sigma or Eurogentec. 16
Real-time PCR were carried out on a Biorad-MyIQ with SYBR® Green Supermix 17
(Biorad) in 96-well plates. After dilution of cDNA, 5 µl was added to 20 µl of PCR mixture 18
(12.5 µl SYBR® Green Supermix, 4 µl of primer at 5 µM and 3.5 µl of RNase-free water). 19
Three or four dilutions of cDNA were performed to determine the efficiencies of real-time 20
PCR. A negative control in which cDNA was replaced by water was systematically included. 21
Thermal cycling conditions were as follows : denaturation at 95 °C for 3 min, 40 repeats at 95 22
°C for 15 s and 60 °C for 45 s, and annealing step where fluorescence measurements were 23
recorded. The melting curve was performed from 60 to 95 °C (0.05 °C.s-1
). The threshold 24
cycle value (CT) was determined with a baseline set manually at 70 relative fluorescence 25
ACCEPTED
on May 26, 2018 by guest
http://aem.asm
.org/D
ownloaded from

11
units, above the background. The PCR efficiency ranged between 85 and 110 %. The butB 1
gene was chosen as a suitable internal control gene used to normalize the results, from the 2
biochip data and after checking by RT-PCR that its mRNA level was unaffected during the 3
pulse experiments. The Pffafl method (29) was used to calculate the fold change in transcript 4
abundance normalized to the butB gene and relative to the sample collected before the pulse. 5
RESULTS 6
Biochips specificity. 7
In order to measure the specificity of the L. lactis IL1403 biochip, the slides were 8
hybridized with mixed labelled cDNA coming from L. lactis IL1403 (Cy5 labelled, reference) 9
and from pure cultures of one of the other species (L. plantarum, C. glutamicum, S. 10
cerevisiae, Cy3 labeled, test condition). As expected, cDNA coming from other species than 11
L. lactis IL1403 hybridized on the L. lactis specific DNA microarrays (Figure 1) so that 72.5 12
% of the spots gave out significant fluorescence intensity with labeled cDNA from L. 13
plantarum, 78.1 % with labeled cDNA from C. glutamicum, and 54.2 % with labelled cDNA 14
from S. cerevisiae, indicating a strong inter-species hybridization. 15
Hybridizations were made in the same conditions but with different hybridization 16
temperatures, ranging from 42°C to 65°C, in order to reduce the non specific signal. The 17
temperature increase was not efficient enough to improve the biochip specificity (data not 18
shown) and led to some technical disadvantages like the necessity to perform manual 19
hybridizations. Moreover, fluorescence intensity decreased with high temperature, leading to 20
loss of data, thus it was not pertinent to further increase hybridization temperature. 21
Effect of the addition of genomic DNA on cross-hybridization. 22
A method was developed in order to reduce the inter-species hybridization and to be 23
able to use the L. lactis microarrays in binary co-cultures. The addition of unlabeled genomic 24
DNA of the partner to the cDNA coming from the partner allowed the signal stemming from 25
ACCEPTED
on May 26, 2018 by guest
http://aem.asm
.org/D
ownloaded from
12
cross-hybridizations to be significantly decreased. The efficiency of the method seemed to be 1
correlated to the phylogenetic distance between L. lactis and the partner species (Figure 1). 2
While 49.6 % of the spots still emitted significant fluorescence intensity with labeled cDNA 3
from L. plantarum, only 24.1 % and 0.3 % gave out fluorescence with labeled cDNA from C. 4
glutamicum and S. cerevisiae respectively. The dye-swap was tested (L. lactis cDNA Cy3-5
labeled and the other species cDNA Cy5-labeled) and no significant differences were 6
observed between the two methods. 7
The addition of foreign unlabeled genomic DNA may also diminish the specific 8
fluorescence from L. lactis IL1403 labeled cDNA. Hybridization of L. lactis cDNA on 9
microarray without yeast genomic DNA gave out 1743 spots with significant signal (87% of 10
the entire biochip) and 1336 spots with significant signal when yeast genomic DNA was 11
added (67% of the entire biochip), thus 1.30 fold lower spots with yeast genomic DNA. 12
However, the addition of yeast genomic DNA diminished S. cerevisiae labelled cDNA 13
significant signal from 54% to 0.3% (figure 1), that is 163 fold less. Finally, the effect of 14
unlabeled yeast genomic DNA on cDNA hybridization decrease was around 125 fold lower 15
with L. lactis cDNA than with S. cerevisiae cDNA. 16
Metabolic analysis 17
In order to study the interactions between L. lactis and S. cerevisiae at macroscopic 18
and transcriptomic levels, three types of cultures were compared : pure cultures of L. lactis 19
IL1403 and S. cerevisiae CEN-PK905, and the mixed culture in which both species shared the 20
same environment. 21
L. lactis IL1403 exhibited a homolactic metabolism at the expense of glucose, which 22
was exhausted at 6 hours of culture (Figure 2A). In the same conditions, S. cerevisiae CEN-23
PK905 consumed the glucose in 7 hours, and produced ethanol and low amounts of glycerol 24
(Figure 2B). The products yields observed for these two pure cultures fitted the theoretical 25
ACCEPTED
on May 26, 2018 by guest
http://aem.asm
.org/D
ownloaded from

13
yields of the homolactic metabolism and of the anaerobic yeast metabolism respectively 1
(Table 1). CO2, not quantified here, was also produced by S. cerevisiae with a theoretical 2
yield given by the metabolic pathways of 1 mole of CO2 per mole of ethanol. The initial 3
biomass concentrations in the mixed culture were chosen to reach similar concentrations of 4
lactococci and yeast at the end of growth. The stationary phase was reached at 5 hours of 5
culture, while the products formed were intermediate concentrations of lactic acid and 6
ethanol, and trace amounts of glycerol (Figure 2C). 7
The maximal specific growth rate of L. lactis (µ IL1403) was similar, around 0.9 to 1.0 h-
8
1, in pure and mixed cultures (Table 1). Furthermore, the maximum lactic acid specific 9
production rate (νlactate) was similar in both culture conditions. The exponential growth phase 10
was slightly shorter in the mixed culture than in pure cultures, since the growth rate started to 11
decrease at about 3 and 4 hours respectively. The maximal specific growth rate of S. 12
cerevisiae (µCEN-PK905) as well as the maximum ethanol specific production rate (νethanol) were 13
similar in pure and mixed cultures, respectively around 0.45 h-1
, and 23 to 27 mmol.g-1
.h-1
. As 14
for L. lactis, the exponential growth phase of S. cerevisiae was shorter in mixed culture (4 15
hours) than in pure culture (5.5 hours). 16
Besides the classical fermentation substrates and products concentration, purine and 17
pyrimidine precursor concentrations were analyzed in the culture supernatants. The observed 18
variations were widely above the limit of detection of the method (1 µM). The yeast extract 19
containing medium harboured nucleobase precursor concentrations varying from 0.2 mM for 20
adenosine to undetectable concentrations, most of them being around 0.1 mM (Figure 3). Pure 21
cultures of S. cerevisiae showed decreased adenine, hypoxanthine, xanthine, uracile and 22
uridine concentrations, which were totally exhausted from the medium at around 2.5, 3, 2.5, 5 23
and 3.5 hours of culture respectively. Adenosine concentration did not show strong variations 24
during the culture. Adenine, adenosine, xanthine, uracile and uridine concentrations in pure 25
ACCEPTED
on May 26, 2018 by guest
http://aem.asm
.org/D
ownloaded from

14
cultures of L. lactis IL1403 decreased until exhaustion during the first 1.5, 2, 1.5, 3 and 2.5 1
hours respectively (Figure 3). Hypoxanthine concentration increased during 2 hours of culture 2
and then decreased becoming undetectable in the next hour. For the above mentioned 3
nucleobase precursors, concentration profiles obtained with mixed cultures were similar to 4
those obtained with pure cultures of L. lactis IL1403, except for xanthine. 5
The initial guanine concentration in the culture medium was about 0.01 mM, and 6
hence its profile could not be accurately determined (data not shown). Finally, guanosine, 7
cytosine and cytidine were not detected in the samples with our chromatographic method, 8
indicating that they were at a concentration lower than the method threshold in the culture 9
medium. 10
Transcriptomic analysis 11
Samples for transcriptomic analysis were taken during exponential growth phase of 12
each culture, e. g., at 2.5 hours, and labelled. The goal of the experiment was to compare the 13
L. lactis IL1403 behaviour during pure cultures and mixed cultures with S. cerevisiae CEN-14
PK905. Hybridizations were performed on IL1403 biochips in the presence of unlabeled 15
genomic DNA of S. cerevisiae CEN-PK905 in order to limit cross-hybridization. Spots with 16
cross-hybridization representing 0.3 % of the genome (see above) were excluded from the 17
analysis. 174 spots showed a significant variation in fluorescence intensity according to our 18
statistical test between these two conditions, i. e., at the time of sampling the mRNA 19
abundance of these L. lactis genes was different in mixed and in pure cultures. However, care 20
should be taken when analyzing transcriptomic data from two parallel cultures, since the 21
variations of transcript level observed could either be specific to the comparison of the two 22
culture conditions or be linked to a difference in the dynamic culture progress of the two 23
cultures. In this example of mixed culture, the growth of two species led to conjointly 24
accelerated substrate consumption and product formation. 25
ACCEPTED
on May 26, 2018 by guest
http://aem.asm
.org/D
ownloaded from

15
In order to discard possible non specific responses from the 174 spots showing a 1
significant variation between the mixed and pure L. lactis IL1403 cultures, a second set of 2
experiments was done to analyze the dynamic variations due to the culture progression. The 3
culture progression effect was estimated by the quantification of mRNA abundance ratio 4
surrounding the time for which the comparison, mixed culture versus pure culture, was 5
performed. Labeled cDNA from L. lactis collected after 2 and 3 hours in pure culture were 6
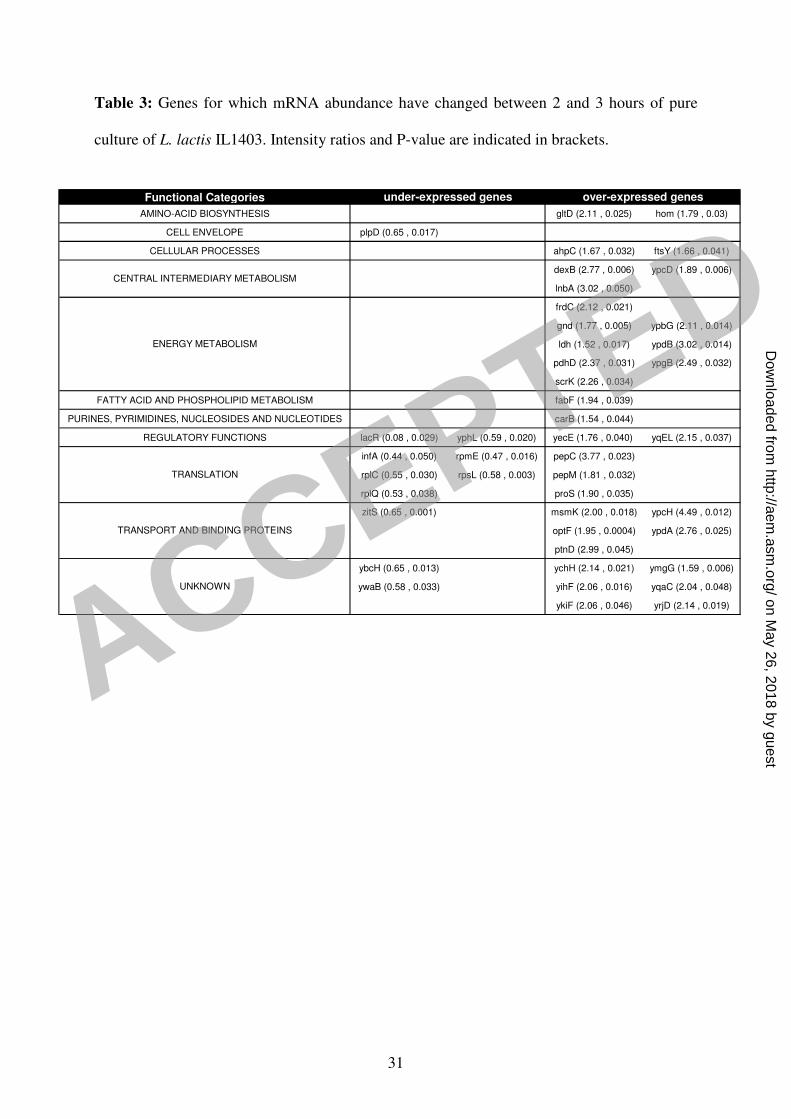
hybridized simultaneously on the same biochip. Statistical analysis showed that 109 spots 7
exhibited significant signal variation between these two cultivation times (table 3), among 8
which 16 overlapped with the 174 spots identified in the previous comparison. Consequently, 9
it was considered that the 158 (174 – 16) remaining L. lactis open reading frames 10
corresponded to genes for which the transcript level specifically varied due to the presence of 11
S. cerevisiae in the culture. Data are available online in GEO database (accession number : 12
GPL6052). 13
These 158 genes were classified by functional categories following the classification 14
of Bolotin et al. (6). All the functional categories were represented. The fold change ratios of 15
normalized signals between mixed and pure cultures varied from 0.18 to 2.83. The selected 16
genes were fairly distributed in genes for which mRNA level diminished (54%) and genes for 17
which mRNA level increased (46 %) in mixed culture compared to the pure culture. These 18
genes were involved in various metabolic pathways such as amino acids biosynthesis or 19
degradation, transporters, and nucleoside and nucleotide metabolism (Table 2). 20
Among the identified transcriptomic responses, the lowering of mRNA level linked 21
with the pyrimidine metabolism appeared as the major event (Table 2). The pyrimidine de 22
novo biosynthesis pathway (figure 4) consists in six enzymatic reactions (eight genes) leading 23
to the synthesis of uridine-mono-phosphate (UMP) from L-glutamine and PRPP (5-24
phosphorybosyl-pyrophosphate) (1; 2; 13; 21; 22; 38; for a review, see 18). Six of the eight 25
ACCEPTED
on May 26, 2018 by guest
http://aem.asm
.org/D
ownloaded from

16
known genes of the pyrimidine de novo biosynthesis pathway (carA, carB, pydB also named 1
pyrDb in L. lactis MG1363, pyrB, pyrC, and pyrE), and four genes related to the pyrimidine 2
metabolism (pyrZ encoding the electron transfer domain of the dihydroorotate dehydrogenase, 3
pdp encoding pyrimidine-nucleoside phosphorylase, rmlB and rmlC involved in thymidine 4
sugar metabolism) exhibited a lower mRNA level in mixed culture compared to the pure 5
culture. The pyrP gene encoding an uracile transporter (“transport and binding proteins” 6
category) also showed a lower transcript level in the mixed culture. 7
The only 4 genes of the purine, pyrimidine, nucleosides and nucleotides metabolism 8
for which the amount of mRNA was higher in mixed culture than in pure culture (pyrG, purH, 9
purL, and deoB) were related to the purine metabolism except pyrG responsible for the 10
synthesis of the enzyme catalyzing the conversion from UTP to CTP (39). 11
RT-PCR analysis after a pulse in pure culture of L. lactis. 12
The main difference in physico-chemical environment between pure L. lactis and 13
mixed cultures was the presence of ethanol and CO2 produced by S. cerevisiae. These 14
metabolic products may have affected gene expression. In order to define the role of those 15
chemicals in the modification of pyrimidine metabolism, pulse experiments consisting in the 16
addition of ethanol or carbonate in batch pure cultures of L. lactis IL1403 were conducted. 17
The concentration of these products was chosen to be identical to the ethanol concentration 18
observed in the mixed culture at the time of sampling. Total RNA was extracted 15 min 19
before (2 h 15) and 15 min after the pulse (2 h 45), reverse-transcribed, and real-time 20
quantitative PCR was performed with primers specific of the genes carB, pydB, pyrE, pyrG, 21
pyrP, and pyrR. 22
The measured ratios of mRNA levels for most of those genes were close to one after 23
carbonate addition, and only for pyrE, pyrP and pyrR was a very weak mRNA level decrease 24
observed (Figure 5). After ethanol addition, the fold change ratio of carB, pydB, pyrE, pyrP, 25
ACCEPTED
on May 26, 2018 by guest
http://aem.asm
.org/D
ownloaded from

17
and pyrR was lower than one (from about 0.2 to 0.5), while pyrG mRNA level seemed to be 1
about 1.5 fold increased. 2
3
DISCUSSION 4
The measurement of biochip hybridization specificity using S. cerevisiae labelled 5
cDNA on L. lactis biochip showed that a big part of the L. lactis designed spots hybridized 6
with the unspecific S. cerevisiae labelled cDNA. In this standard hybridization condition, the 7
biochip was clearly not usable in mixed cultures. Since the possibility of using specific 8
biochips in a mixed culture remained until now both a methodological constraint and a 9
challenge for further knowledge acquisition, attempts were made to decrease the cross-10
hybridizations of foreign DNA on the specific L. lactis microarrays. The temperature, known 11
to have a positive effect on the hybridization specificity by increasing the stringency (40), was 12
unable to significantly reduce the cross-hybridization signal. 13
The addition of genomic DNA of the partner species enabled a good specificity of the 14
biochip to be obtained. The efficiency of the method seemed to be correlated with the 15
phylogenetic distance between the microbial partners. Since the sequence divergence can be 16
considered to be similar between ribosomal and other genomic sequences, the estimation of 17
the phylogenetic distance between the partners was based on 16S and 18S ribosomal 18
sequences alignment. The further the partner species was from L. lactis, the more efficiently 19
the genomic DNA addition reduced unspecific signals (Figure 1). Some additives are 20
frequently added prior to hybridization on biochips, in order to decrease the non specific 21
fixation of the cDNA on the support. Among them, proteins like BSA, or genomic DNA, 22
mostly salmon sperm DNA, could be mentioned. In our method improvement strategy, the 23
added DNA was not a random non specific DNA, but the DNA of the species being cultivated 24
with our model bacterium. This method enabled the cross-hybridization between S. cerevisiae 25
ACCEPTED
on May 26, 2018 by guest
http://aem.asm
.org/D
ownloaded from

18
cDNA and L. lactis microarray to be reduced from 54 % to less than 1 %, or in other words, 1
more than 99% of the L. lactis spots could now be analyzed. The proposed method to 2
decrease this non specific hybridization in binary cultures can be extended to more complex 3
ecosystems. Thus this approach can be considered as universal in principle, but in practice 4
will not be applicable for closely related genera, or for species of a same genera. 5
The interactions between L. lactis IL1403 and S. cerevisiae CEN-PK905 were 6
investigated using the comparison of transcriptome and of some metabolic features in pure 7
and mixed cultures. Biochip analysis was made with methodological replicates in order to 8
evaluate the method’s precision, avoiding artifacts due to biological interactions. The strategy 9
with regard to the culture medium and the environmental parameters was chosen to avoid any 10
evident interactions between the two partners such as medium acidification. The macroscopic 11
data observed were in agreement with literature, and particularly the specific growth rates of 12
the two species and their productions rates (10; 23; 37). The growth period in each culture 13
started with an exponential growth phase, in which it is considered that the environmental 14
conditions allow the cells to grow at constant and maximum rate. Nevertheless, there were 15
differences in substrate and product concentrations between pure and mixed cultures during 16
this exponential growth phase. For example, after 3 hours of culture at the end of the 17
exponential growth phase, there was about 40 mM lactic acid in both cultures, but higher 18
ethanol concentration in the mixed culture, and an increased amount of glucose consumed 19
under these conditions. Moreover, one cannot exclude the accumulation of other undetected 20
metabolites during the cultures. Thus, even if no major kinetic variations were observed 21
between the mixed and pure cultures, there were some differences in substrate and metabolite 22
concentrations. 23
It is well known that the diminished growth rate, whatever the cause of this slowing 24
down, has large implications on global gene expression, affecting functions like amino acid 25
ACCEPTED
on May 26, 2018 by guest
http://aem.asm
.org/D
ownloaded from

19
transporters, sugar metabolism, large and small ribosomal subunit, etc (30; 31). On the other 1
hand, it is expected that very few genes should show variation of expression during 2
exponential growth phases in which specific rates are comparable. Indeed, the comparative 3
analysis of transcript abundances between 2 and 3 hours in L. lactis pure culture showed only 4
109 spots having a significant variation of fluorescence intensity (5% of the entire biochip, 5
table 3), compared to about 900 spots at the onset of the growth decrease (31). Nevertheless, 6
this result indicates that even between two samples taken during an exponential growth phase, 7
the mRNA level of certain genes can vary significantly. It was then considered that these 8
differences in transcript abundances between 2 and 3 hours were due to the natural 9
progression of the culture, and then would be equally expected between the same samples 10
taken in the mixed culture. In consequence, these variations were non specific to the L. lactis 11
– yeast interactions and the corresponding genes considered as false positive or negative 12
genes were discarded from the comparative analysis of the pure and mixed cultures. This is a 13
crucial problem when comparing gene expression in two different cultures: differentiating 14
between those variations in mRNA levels which can be specifically correlated to the planned 15
modification of the culture and those which are probably linked to time course differences 16
between the two cultures. 17
Most of the genes linked to the pyrimidine metabolism and exhibiting a lower mRNA 18
abundance in mixed culture were PyrR regulated (2; 18; 21; 22). The others were 19
independently regulated (pdp, rmlB, rmlC, pyrG). These results naturally led us to formulate 20
two non-exclusive hypotheses: the yeast may produce pyrimidines in co-culture, or there may 21
be an earlier depletion of purines in co-culture. Both phenomena could provoke a 22
modification of the relative amounts of intracellular purine/pyrimidine and trigger the 23
inhibition of pyrimidine synthesis to restore balance. 24
ACCEPTED
on May 26, 2018 by guest
http://aem.asm
.org/D
ownloaded from
20
The estimation of purine and pyrimidine precursors in the extracellular medium did 1
not give a satisfactory explanation of this strong variation of transcript levels. Globally L. 2
lactis used nucleobase precursors faster than the yeast, and thus the evolution of their 3
concentrations in mixed culture was very close to that observed in pure L. lactis cultures 4
(Figure 3). The only significant difference between pure L. lactis and mixed cultures was 5
observed for xanthine. In opposition to the hypothesis suggested above, this purine was 6
apparently less consumed in the mixed culture than in the L. lactis pure culture. 7
Since the nucleobase metabolism did not seem to be responsible for the observed 8
transcriptomic change of the corresponding genes, the factors affecting pyr mRNA abundance 9
remained to be found. Regarding fermentation dynamics, the main difference between the 10
pure and the mixed cultures was the production of ethanol and carbonate by the yeast in 11
mixed culture. Those chemical compounds were absent in L. lactis pure culture since it 12
exhibited a homolactic metabolism in these growth conditions. Carbonate is a substrate for the 13
carbamoyl-phosphate synthase, encoded by carA and carB, catalyzing the first reaction of the 14
de novo pyrimidine biosynthesis pathway. This reaction leads to the transformation of L-15
glutamine and carbonate to L-glutamate and carbamoyl-phosphate (25). So a variation of 16
carbonate concentration might have an effect on pathway flux and/or regulation of genes 17
involved in de novo pyrimidine biosynthesis, as recently demonstrated in L. plantarum (3). 18
Thus we investigated separately the effect of carbonate and ethanol on the mRNA level of L. 19
lactis genes involved in pyrimidine metabolism by RT-qPCR. The pulses did not change the 20
observed kinetic parameters (data not shown) indicating that the observations in pulse 21
experiments are similar to what took place in mixed cultures. 22
While biochip measurement showed an increased amount of pyrG mRNA in mixed 23
cultures, neither ethanol nor carbonate, significantly altered the transcript abundance ratio 24
when pulsed into the medium. It is more probable that control of pyrG expression responds to 25
ACCEPTED
on May 26, 2018 by guest
http://aem.asm
.org/D
ownloaded from

21
the intracellular CTP concentration (16; 17. Decreased expression of the de novo pyrimidine 1
biosynthesis genes could have led indirectly to a diminished intracellular pool of CTP thereby 2
inducing higher expression of pyrG. A time shift response consequently to the decrease of the 3
intracellular CTP pool could explain therefore that the change of mRNA level may not have 4
time to occur within the 15 minutes after the pulse. Surprisingly, carbonate addition in the 5
medium had very little influence on the transcription level of these genes (Figure 5), since no 6
significant differences before and after addition of carbonate were observed. Only for pyrP 7
and pyrR could carbonate accumulation contribute to the diminished transcription profiles. On 8
the other hand, ethanol addition led to a decreased transcript abundance for carB, pydB, pyrE 9
and pyrR genes, to the same extent as previously revealed by DNA microarrays, indicating 10
that ethanol accumulation could account for the totality of this transcriptomic change in the 11
mixed culture. 12
Thus, ethanol production appeared to be the main vector of the observed interspecies 13
interaction. Ethanol stress on Lactococci is rarely mentioned in literature, especially regarding 14
transcription analysis. Further researches may provide useful data to understand the 15
mechanisms triggering such transcriptional changes, and the extent of ethanol effect on L. 16
lactis. 17
18
ACKNOWLEDGMENTS 19
The authors wish to thank Lidwine Trouilh and Sergei Sokol (Biochips Platform, Genopôle 20
Toulouse) for technical assistance and help provided in the biochips analysis, and Marie-21
Odile Loret for nucleosides/nucleotides analysis. 22
This work was supported by an ANR (French Research National Agency) grant in the frame 23
of the “Genoferment” 2E.11 PNRA program. 24
25
ACCEPTED
on May 26, 2018 by guest
http://aem.asm
.org/D
ownloaded from

22
REFERENCES 1
1. Andersen, P.S., Gildsig Jansen, P.J., and Hammer, K. 1994. Two different 2
dihydroorotate dehydrogenases in Lactococcus lactis. J. Bacteriol. 176: 3975-3982. 3
2. Andersen, P.S., Martinussen, J., and Hammer, K. 1996. Sequence analysis and 4
identification of the pyrKDbF operon from Lactococcus lactis including a novel gene, pyrK, 5
involved in pyrimidine biosynthesis. J. Bacteriol. 178: 5005-5012. 6
3. Arsene-Ploetze, F., Kugler, V., Martinussen, J., and Bringel, F. 2006. Expression of the 7
pyr operon of Lactobacillus plantarum is regulated by inorganic carbon availability through a 8
second regulator, PyrR2, homologous to the pyrimidine-dependent regulator PyrR1. J. 9
Bacteriol. 188: 8607-8616. 10
4. Barriere, C., Veiga-da-Cunha, M., Pons, N., Guedon, E., van Hijum, S.A., Kok, J., 11
Kuipers, O.P., Ehrlich, D.S., and Renault, P. 2005. Fructose utilization in Lactococcus 12
lactis as a model for low-GC gram-positive bacteria : its regulator, signal, and DNA-binding 13
site. J. Bacteriol. 187: 3752-61 14
5. Bodrossy, L., Stralis-Pavese, N., Konrad-Koszler, M., Weilharter, A., Reichenauer, 15
T.G., Schofer, D., and Sessitsch, A. 2006. mRNA-based parallel detection of active 16
methanotroph populations by use of a diagnostic microarray. Appl. Environ. Microbiol. 72: 17
1672-1676. 18
6. Bolotin, A., Wincker, P., Mauger, S., Jaillon, O., Malarme, K., Weissenbach, J., 19
Ehrlich, S. D., and Sorokin, A. 2001. The complete genome sequence of the lactic acid 20
bacterium Lactococcus lactis ssp. lactis IL1403. Genome Res. 11: 731-753. 21
7. Callon, C., Millet, L., and Montel, M. C. 2004. Diversity of lactic acid bacteria isolated 22
from AOC Salers cheese. J. Dairy Res. 71: 231-244. 23
8. Cho, J.-C., and Tiedje, J.M. 2002. Quantitative detection of microbial genes by using 24
DNA microarrays. Appl. Environ. Microbiol. 68: 425-1430. 25
ACCEPTED
on May 26, 2018 by guest
http://aem.asm
.org/D
ownloaded from

23
9. Cocaign-Bousquet, M., and Lindley, N.D. 1995. Pyruvate overflow and carbon flux 1
within the central metabolic pathways of Corynebacterium glutamicum during growth on 2
lactate. Enzyme Microb. Technol. 17: 260-267. 3
10. Cocaign-Bousquet, M., Garrigues, C., Loubière, P., and Lindley, N.D. 1996. 4
Physiology of pyruvate metabolism in Lactococcus lactis. Antonie Van Leeuwenhoek 70: 5
253-267. 6
11. Corsetti, A., Rossi, J., and Gobbetti, M. 2001. Interactions between yeasts and bacteria 7
in the smear surface-ripened cheeses. Int. J. Food Microbiol. 69: 1-10. 8
12. Dennis, P., Edwards, E.A., Liss, S.N., and Fulthorpe, R. 2003. Monitoring gene 9
expression in mixed microbial communities by using DNA microarrays. Appl. Environ. 10
Microbiol. 69: 769-778. 11
13. Elagoz, A., Abdi, A., Hubert, J.C., and Kammerer, B. 1996. Structure and organisation 12
of the pyrimidine biosynthesis pathway genes in Lactobacillus plantarum: a PCR strategy for 13
sequencing without cloning. Gene 183: 37-43. 14
14. Hüser, A.T., Becker, A., Brune, I., Dondrup, M., Kalinowski, J., Plassmeier, J., 15
Puhler, A., Wiegrabe, I., and Tauch, A. 2003. Development of a Corynebacterium 16
glutamicum DNA microarray and validation by genome-wide expression profiling during 17
growth with propionate as carbon source. J. Biotechnol. 106: 269-286. 18
15. Johnson, M.R., Conners, S.B., Montero, C.I., Chou, C.J., Shockley, K.R., and Kelly, 19
R.M. 2006. The Thermotoga maritima phenotype is impacted by syntrophic interaction with 20
methanococcus jannaschii in hyperthermophilic coculture. Appl. Environ. Microbiol. 72: 21
811–818. 22
16. Jørgensen, C.M., Hammer, K., and Martinussen, J. 2003. CTP limitation increases 23
expression of CTP synthase in Lactococcus lactis. J. Bacteriol. 185: 6562–6574. 24
ACCEPTED
on May 26, 2018 by guest
http://aem.asm
.org/D
ownloaded from

24
17. Jørgensen, C.M., Hammer, K., Jensen, P.R., and Martinussen, J. 2004. Expression of 1
the pyrG gene determines the pool sizes of CTP and dCTP in Lactococcus lactis. Eur. J. 2
Biochem. 271: 2438-2445. 3
18. Kilstrup, M., Hammer, K., Ruhdal Jensen, P., and Martinussen, J. 2005. Nucleotide 4
metabolism and its control in lactic acid bacteria. FEMS Microbiol. Rev. 29: 555-590. 5
19. Larsen, R., Kloosterman, T.G., Kok, J., and Kuipers, O.P. 2006. GlnR-mediated 6
regulation of nitrogen metabolism in Lactococcus lactis. J. Bacteriol. 188: 4978-4982. 7
20. Loret, M.O., Pedersen, L., and François, J. 2007. Revised procedures for yeast 8
metabolites extraction: application to a glucose pulse to carbon-limited yeast cultures, which 9
reveals a transient activation of the purine salvage pathway. Yeast 24: 47-60. 10
21. Martinussen, J., and Hammer, K. 1998. The carB gene encoding the large subunit of 11
carbamoylphosphate synthetase from Lactococcus lactis is transcribed monocistronically. J. 12
Bacteriol. 180: 4380-4386. 13
22. Martinussen, J., Schallert, J., Andersen, B., and Hammer, K. 2001. The pyrimidine 14
operon pyrRPB-carA from Lactococcus lactis. J. Bacteriol. 183: 2785-2794. 15
23. Møller, K., Olsson, L., and Piskur, J. 2001. Ability for anaerobic growth is not 16
sufficient for development of the petite phenotype in Saccharomyces kluyveri. J. Bacteriol. 17
183: 2485-2489. 18
24. Narvhusa, J.A., and Gadaga, T. H. 2003. The role of interaction between yeasts and 19
lactic acid bacteria in African fermented milks: a review. Int. J. Food Microbiol. 86: 51-60. 20
25. Nicoloff, H., Elagöz, A., Arsene-Ploetze, F., Kammerer, B., Martinussen, J., and 21
Bringel, F. 2005. Repression of the pyr operon in Lactobacillus plantarum prevents its ability 22
to grow at low carbon dioxide levels. J. Bacteriol. 187: 2093-2104. 23
26. Ouadghiri, M., Amar, M., Vancanneyt, M., and Swings, J. 2005. Biodiversity of lactic 24
acid bacteria in Moroccan soft white cheese (Jben). FEMS Microbiol. Lett. 251: 267-271. 25
ACCEPTED
on May 26, 2018 by guest
http://aem.asm
.org/D
ownloaded from
25
27. Palmer, C., Bik, E.M., Eisen, M.B., Eckburg, P.B., Sana, T.R., Wolber, P.K., 1
Relman, D.A., and Brown, P.O. 2006. Rapid quantitative profiling of complex microbial 2
populations. Nucl. Acids Res. 34: e5. 3
28. Patrignani, F., Lanciotti, R., Mathara, J.M., Guerzoni, M.E., and Holzapfel, W.H. 4
2006. Potential of functional strains, isolated from traditional Maasai milk, as starters for the 5
production of fermented milks. Int. J. Food Microbiol. 107: 1-11. 6
29. Pfaffl, M.W., 2001. A new mathematical model for relative quantification in real-time 7
RT-PCR. Nucleic Acids Res. 29:e45. 8
30. Raynaud, S., Perrin, R., Cocaign-Bousquet, M., and Loubière, P. 2005. Metabolic and 9
transcriptomic adaptation of Lactococcus lactis subsp. lactis Biovar diacetylactis in response 10
to autoacidification and temperature downshift in skim milk. Appl. Environ. Microbiol. 71: 11
8016-8023. 12
31. Redon, E., Loubière, P., and Cocaign-Bousquet, M. 2005. Transcriptome analysis of 13
the progressive adaptation of Lactococcus lactis to carbon starvation. J. Bacteriol. 187: 3589-14
3592. 15
32. Rhee, S.K., Liu, X., Wu, L., Chong, S.C., Wan, X., and Zhou, J. 2004. Detection of 16
genes involved in biodegradation and biotransformation in microbial communities by using 17
50-mer oligonucleotide microarrays. Appl. Environ. Microbiol. 70: 4303-4317. 18
33. Sakala, R.M., Hayashidani, H., Kato, Y., Hirata, T., Makino, Y., Fukushima, A., 19
Yamada, T., Kaneuchi, C., and Ogawa, M. 2002. Change in the composition of the 20
microflora on vacuum-packaged beef during chiller storage. Int. J. Food Microbiol. 74: 87-99. 21
34. Sessitsch, A., Hackl, E., Wenzl, P., Kilian, A., Kostic, T., Stralis-Pavese, N., 22
Sandjong, B.T., and Bodrossy, L. 2006. Diagnostic microbial microarrays in soil ecology. 23
New Phytol. 171: 719-735. 24
ACCEPTED
on May 26, 2018 by guest
http://aem.asm
.org/D
ownloaded from

26
35. Simova, E., Beshkova, D., Angelov, A., Hristozova, T., Frengova, G., and Spasov, Z. 1
2002. Lactic acid bacteria and yeasts in kefir grains and kefir made from them. J. Ind. 2
Microbiol. Biotech. 28: 1-6. 3
36. Thompson, J.D., Higgins, D.G., and Gibson, T.J. 1994. CLUSTAL W: improving the 4
sensitivity of progressive multiple sequence alignment through sequence weighting, position-5
specific gap penalties and weight matrix choice. Nucleic Acids Res. 22: 4673-4680. 6
37. Visser, W., Scheffers, W.A., Batenburg-Van der Vegte, W.H., and Van Dijken, J.P. 7
1990. Oxygen requirements of yeasts. Appl. Environ. Microbiol. 56: 3785-3792. 8
38. Wadskov-Hansen, S.L.L., Martinussen, J., and Hammer, K. 2000. The pyrH gene of 9
Lactococcus lactis subsp. cremoris encoding UMP kinase is transcribed as part of an operon 10
including the frr1 gene encoding ribosomal recycling factor 1. Gene 241: 157-166. 11
39. Wadskov-Hansen, S.L.L., Willemoes, M., Martinussen, J., Hammer, K., Neuhard, J., 12
and Larsen, S. 2001. Cloning and verification of the Lactococcus lactis pyrG gene and 13
characterization of the gene product, CTP synthase. J. Biol. Chem. 276: 38002–38009. 14
40. Wu, L., Thompson, D.K., Li, G., Hurt, R.A., Tiedje J.M., and Zhou, J. 2001. 15
Development and evaluation of functional gene arrays for detection of selected genes in the 16
environment. Appl. Environ. Microbiol. 67: 5780-5790. 17
41. Wu, L., Liu, X., Schadt, C.W., and Zhou, J. 2006. Microarray-based analysis of 18
subnanogram quantities of microbial community DNAs by using whole-community genome 19
amplification. Appl. Environ. Microbiol. 72: 4931-4941. 20
42. Zhou, J. 2003. Microarrays for bacterial detection and microbial community analysis. 21
Curr. Opin. Microbiol. 6: 288-294. 22
ACCEPTED
on May 26, 2018 by guest
http://aem.asm
.org/D
ownloaded from
27
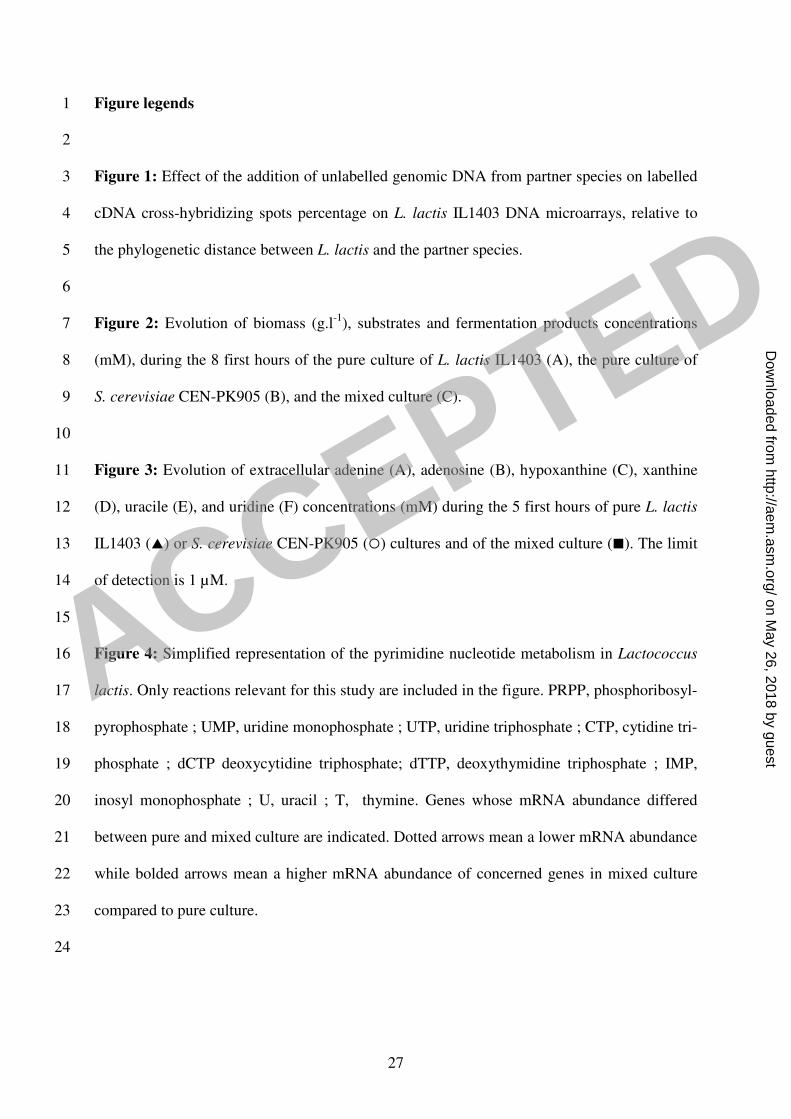
Figure legends 1
2
Figure 1: Effect of the addition of unlabelled genomic DNA from partner species on labelled 3
cDNA cross-hybridizing spots percentage on L. lactis IL1403 DNA microarrays, relative to 4
the phylogenetic distance between L. lactis and the partner species. 5
6
Figure 2: Evolution of biomass (g.l-1
), substrates and fermentation products concentrations 7
(mM), during the 8 first hours of the pure culture of L. lactis IL1403 (A), the pure culture of 8
S. cerevisiae CEN-PK905 (B), and the mixed culture (C). 9
10
Figure 3: Evolution of extracellular adenine (A), adenosine (B), hypoxanthine (C), xanthine 11
(D), uracile (E), and uridine (F) concentrations (mM) during the 5 first hours of pure L. lactis 12
IL1403 (�) or S. cerevisiae CEN-PK905 (�) cultures and of the mixed culture (�). The limit 13
of detection is 1 µM. 14
15
Figure 4: Simplified representation of the pyrimidine nucleotide metabolism in Lactococcus 16
lactis. Only reactions relevant for this study are included in the figure. PRPP, phosphoribosyl-17
pyrophosphate ; UMP, uridine monophosphate ; UTP, uridine triphosphate ; CTP, cytidine tri-18
phosphate ; dCTP deoxycytidine triphosphate; dTTP, deoxythymidine triphosphate ; IMP, 19
inosyl monophosphate ; U, uracil ; T, thymine. Genes whose mRNA abundance differed 20
between pure and mixed culture are indicated. Dotted arrows mean a lower mRNA abundance 21
while bolded arrows mean a higher mRNA abundance of concerned genes in mixed culture 22
compared to pure culture. 23
24
ACCEPTED
on May 26, 2018 by guest
http://aem.asm
.org/D
ownloaded from

28
Figure 5: Comparison of transcript level ratios of pyrimidine de novo synthesis genes 1
measured with real-time PCR after ethanol or carbonate pulses, or with biochips for the 2
comparison between mixed L. lactis / S. cerevisiae and pure L. lactis cultures. Asterisks 3
indicate P-value < 0.05 in biochip experiment. 4
5
6
7
8
9
10
11
12
13
14
15
16
17
18
19
20
21
ACCEPTED
on May 26, 2018 by guest
http://aem.asm
.org/D
ownloaded from

29
Table 1 : Fermentation parameters calculated from the L. lactis IL1403 or S. cerevisiae CEN-
PK905 pure cultures, or the mixed culture of both species.
a Cultures were performed three times.
b Calculated taking into account the L. lactis IL1403 biomass only.
c Calculated taking into account the S. cerevisiae CEN-PK905 biomass only.
Abbreviations: µ IL1403: specific growth rate of L. lactis IL1403; µCEN-PK905: specific growth rate of S.
cerevisiae CEN-PK905; qglucose: specific glucose consumption rate; νlactate: specific lactate production
rate; νethanol: specific ethanol production rate; Yglucose,IL1403: biomass yield of L. lactis IL1403 relative to
glucose; Yglucose,CEN-PK905: biomass yield of S. cerevisiae CEN-PK905 relative to glucose; Yglucose,lactate:
lactate yield relative to glucose; Yglucose,ethanol: ethanol yield relative to glucose; Yglucose,glycerol: glycerol
yield relative to glucose.
Value Parameter and unit
L. lactis IL1403
pure culture a
S. cerevisiae CEN-PK905
pure culture a mixed culture
a
µ IL1403 (h-1
) 0.92 ± 0.04 - 1.01 ± 0.08
µCEN-PK905(h-1
) - 0.45 ± 0.01 0.45 ± 0.01
qglucose (mmol.g-1
.h-1
) 25.6 ± 0.9 15.8 ± 0.1 -
νlactate (mmol.g-1
.h-1
) 49.3 ± 1.4 - 42.1 ± 0.2b
νethanol (mmol.g-1
.h-1
) - 26.6 ± 0.5 22.8 ± 1.0c
Yglucose,IL1403 (g.mmol-1
) 0.03 ± 0.00 - -
Yglucose,CEN-PK905 (g.mmol-1
) - 0.02 ± 0.00 -
Yglucose,lactate (Cmol.Cmol-1
) 0.93 ± 0.03 - -
Yglucose,ethanol (Cmol.Cmol-1
) - 0.56 ± 0.05 -
Yglucose,glycerol (Cmol.Cmol-1
) - 0.09 ± 0.05 -
ACCEPTED
on May 26, 2018 by guest
http://aem.asm
.org/D
ownloaded from

30
Table 2 : Genes for which mRNA abundance have changed in mixed culture compared to
pure culture of L. lactis IL1403. Intensity ratios and P-value are indicated in brackets.
Functional Categories
metB2 (0.39 , 0.030) aroE (1.82 , 0.020) leuB (1.90 , 0.005)
thrC (0.63 , 0.006) ilvC (1.66 , 0.025) trpB (1.98 , 0.007)
BIOSYNTHESIS OF COFACTORS, PROSTHETIC GROUPS, AND
CARRIERSdfpB (1.80 , 0.040) thiM (1.74 , 0.019)
acmB (0.54 , 0.022) plpA (0.64 , 0.014) pbp2A (1.56 , 0.008)
pbp1B (0.055 , 0.048) ycbF (2.69 , 0.033)
CELLULAR PROCESSES sipL (2.10 , 0.028)
adhE (0.32 , 0.026) pta (0.59 , 0.011) citC (2.51 , 0.032) ypdD (1.60 , 0.016)
atpE (0.64 , 0.001) yjiB (0.64 , 0.021) fbp (1.95 , 0.036)
pdhA (0.41 , 0.041) noxB (1.52, 0.032)
FATTY ACID AND PHOSPHOLIPID METABOLISM fabI (0.36 , 0.015) thiL (0.44 , 0.009)
clpP (0.18 , 0.006) dinF (1.42 , 0.026) ps122 (1.71 , 0.037)
clpE (0.38 , 0.035) pi103 (2.26 , 0.008) yebB (2.04 , 0.002)
pi359 (0.64 , 0.016) pi242 (1.85 , 0.041)
carA (0.65 , 0.020) pyrC (0.40 , 0.009) deoD (1.774 , 0.007)
carB (0.044 , 0.012) pyrE (0.33 , 0.025) purL (2.15 , 0.023)
pydB (0.28 , 0.010) pyrZ (0.63 , 0.02) pyrG (2.02 , 0.039)
pyrB (0.37 , 0.021) rmlB (0.63 , 0.017)
codY (0.48 , 0.002) rliB (0.43 , 0.006) llrG (1.88 , 0.026)
glnR (0.51 , 0.036) typA (0.49 , 0.049) yjfE (1.55 , 0.045)
REPLICATION polA (1.83 , 0.014)
TRANSCRIPTION rpoA (1.96 , 0.019) trmD (1.79 , 0.002)
metS (0.56, 0.015) tuf (0.44 , 0.030) argS (1.89 , 0.005) prfA (2.14 , 0.010)
pepO (0.66 , 0.017) cysS (2.39 , 0.013) rplV (2.06 , 0.036)
rplF (0.45 , 0.045) infC (1.50 , 0.042) thrS (1.67 , 0.046)
rpsH (0.55 , 0.040) leuS (1.58 , 0.023) yugD (2.12 , 0.023)
serS (0.60 , 0.041) ppiA (1.70 , 0.003)
mtsB (0.50 , 0.037) yogJ (0.37 , 0.047) arcD1 (1.88 , 0.023) rbsA (1.57 , 0.041)
pyrP (0.23 , 0.015) ypcG (0.36 , 0.020) pstC (2.32 , 0.044) ynaD (1.57 , 0.007)
ychE (0.66 , 0.037)
ybeC (0.60 , 0.018) ytcC (0.41 , 0.012) ydiB (1.50 , 0.027) ydgI (1.93 , 0.028)
yhgE (0.53 , 0.026) ytdB (0.52 , 0.025) ygiK (1.60 , 0.032) yjhE (2.83 , 0.046)
yicE (0.65 , 0.008) ytdC (0.45 , 0.035) yqgC (1.82 , 0.045) ybfB (1.50 , 0.028)
yniC (0.49 , 0.033) yvdE (0.57 , 0.034) yfdC (2.30 , 0.025) yqaD (1.55 , 0.018)
ypdC (0.60 , 0.036) ywaI (0.57 , 0.016) ythA (1.54 , 0.041) ynbD (1.79 , 0.013)
yqgA (0.48 , 0.016) ybgD (1.73 , 0.037) yudK (2.07 , 0.006)
PURINES, PYRIMIDINES, NUCLEOSIDES AND NUCLEOTIDES
UNKNOWN
TRANSLATION
under-expressed genes
OTHER CATEGORIES
REGULATORY FUNCTIONS
TRANSPORT AND BINDING PROTEINS
over-expressed genes
AMINO-ACID BIOSYNTHESIS
CELL ENVELOPE
ENERGY METABOLISM
ACCEPTED
on May 26, 2018 by guest
http://aem.asm
.org/D
ownloaded from
31
Table 3: Genes for which mRNA abundance have changed between 2 and 3 hours of pure
culture of L. lactis IL1403. Intensity ratios and P-value are indicated in brackets.
Functional Categories
AMINO-ACID BIOSYNTHESIS gltD (2.11 , 0.025) hom (1.79 , 0.03)
CELL ENVELOPE plpD (0.65 , 0.017)
CELLULAR PROCESSES ahpC (1.67 , 0.032) ftsY (1.66 , 0.041)
dexB (2.77 , 0.006) ypcD (1.89 , 0.006)
lnbA (3.02 , 0.050)
frdC (2.12 , 0.021)
gnd (1.77 , 0.005) ypbG (2.11 , 0.014)
ldh (1.52 , 0.017) ypdB (3.02 , 0.014)
pdhD (2.37 , 0.031) ypgB (2.49 , 0.032)
scrK (2.26 , 0.034)
FATTY ACID AND PHOSPHOLIPID METABOLISM fabF (1.94 , 0.039)
PURINES, PYRIMIDINES, NUCLEOSIDES AND NUCLEOTIDES carB (1.54 , 0.044)
REGULATORY FUNCTIONS lacR (0.08 , 0.029) yphL (0.59 , 0.020) yecE (1.76 , 0.040) yqEL (2.15 , 0.037)
infA (0.44 , 0.050) rpmE (0.47 , 0.016) pepC (3.77 , 0.023)
rplC (0.55 , 0.030) rpsL (0.58 , 0.003) pepM (1.81 , 0.032)
rplQ (0.53 , 0.038) proS (1.90 , 0.035)
zitS (0.65 , 0.001) msmK (2.00 , 0.018) ypcH (4.49 , 0.012)
optF (1.95 , 0.0004) ypdA (2.76 , 0.025)
ptnD (2.99 , 0.045)
ybcH (0.65 , 0.013) ychH (2.14 , 0.021) ymgG (1.59 , 0.006)
ywaB (0.58 , 0.033) yihF (2.06 , 0.016) yqaC (2.04 , 0.048)
ykiF (2.06 , 0.046) yrjD (2.14 , 0.019)
UNKNOWN
TRANSLATION
under-expressed genes over-expressed genes
TRANSPORT AND BINDING PROTEINS
ENERGY METABOLISM
CENTRAL INTERMEDIARY METABOLISM
ACCEPTED
on May 26, 2018 by guest
http://aem.asm
.org/D
ownloaded from

32
Figure 1
phylogenetic distance from (L. lactis)
0.143 0.268 0.645
cro
ss-h
ybri
diz
ing
sp
ots
(%
)
0
20
40
60
80
100
standard hybridization
hybridization with genomic DNA
(L. lactis) (L. plantarum) (C. glutamicum) (S. cerevisiae)
0.000
ACCEPTED
on May 26, 2018 by guest
http://aem.asm
.org/D
ownloaded from

33
Figure 2
(A)
(B)
(C)
0
50
100
150
200
250
0.01
0.10
1.00
10.00
0
50
100
150
200
250
0.01
0.10
1.00
10.00
Time (hours)
0 1 2 3 4 5 6 7 8
0
50
100
150
200
250
0.01
0.10
1.00
10.00
glu
co
se
(m
M)
lactic a
cid
(m
M)
eth
an
ol (m
M)
gly
ce
rol (m
M)
IL1
40
3 b
iom
ass (
g/l)
CE
N-P
K 9
05
bio
ma
ss (
g/l)
ACCEPTED
on May 26, 2018 by guest
http://aem.asm
.org/D
ownloaded from

34
Figure 3
0.00
0.05
0.10
0.15
0.20
time (h)
0 1 2 3 4 5
0.00
0.05
0.10
0.15
0.20
(E)
(F)
concentr
ation (
mM
)0.00
0.05
0.10
0.15
0.20(D)
concentr
ation (
mM
)
0.00
0.05
0.10
0.15
0.20
0.00
0.05
0.10
0.15
0.20
time (h)
0 1 2 3 4 5
0.00
0.05
0.10
0.15
0.20
(A)
(B)
(C)
pure culture of Lactococcus lactis
mixed culturepure culture of Saccharomyces cerevisiae
ACCEPTED
on May 26, 2018 by guest
http://aem.asm
.org/D
ownloaded from

35
Figure 4
L-glutamine UMP
PRPP
dCTPUTP CTP
dTTP
pyrimidines de novo biosynthesis
carA
carB pyrB pyrC pydB pyrE pyrG
U intracell
U extracell
pyrP
HCO3- UR
pdp
Tpdp
pyrimidines interconversion pathway
GDP-L-rhamnose
D-TDP-L-rhamnose
rmlC
rmlC
rmlB
Nucleotide sugars metabolism
ACCEPTED
on May 26, 2018 by guest
http://aem.asm
.org/D
ownloaded from

36
Figure 5
0.1
1
10
carB pydB pyrE pyrG pyrP pyrR
Genes
Fo
ld C
han
ge R
ati
o
Carbonate pulse
Ethanol pulse
Biochip data
*
**
*
*
ACCEPTED
on May 26, 2018 by guest
http://aem.asm
.org/D
ownloaded from