transfer parameters for icrp's reference animals and ... fileand a dehesa (grassland with...
TRANSCRIPT

Transfer parameters for ICRP's Reference Animals and Plants in a terrestrial
Mediterranean ecosystemGuillén, J, Beresford, NA, Baeza, A, Izquierdo, M, Wood, MD, Salas, A, Muñoz
Serrano, A, CorralesVázquez, JM and MuñozMuñoz, JG
http://dx.doi.org/10.1016/j.jenvrad.2017.06.024
Title Transfer parameters for ICRP's Reference Animals and Plants in a terrestrial Mediterranean ecosystem
Authors Guillén, J, Beresford, NA, Baeza, A, Izquierdo, M, Wood, MD, Salas, A, MuñozSerrano, A, CorralesVázquez, JM and MuñozMuñoz, JG
Type Article
URL This version is available at: http://usir.salford.ac.uk/id/eprint/43897/
Published Date 2017
USIR is a digital collection of the research output of the University of Salford. Where copyright permits, full text material held in the repository is made freely available online and can be read, downloaded and copied for noncommercial private study or research purposes. Please check the manuscript for any further copyright restrictions.
For more information, including our policy and submission procedure, pleasecontact the Repository Team at: [email protected].

lable at ScienceDirect
Journal of Environmental Radioactivity xxx (2017) 1e14
Contents lists avai
Journal of Environmental Radioactivity
journal homepage: www.elsevier .com/locate/ jenvrad
Transfer parameters for ICRP's Reference Animals and Plants in aterrestrial Mediterranean ecosystem
J. Guill�en a, *, N.A. Beresford b, c, A. Baeza a, M. Izquierdo d, M.D. Wood c, A. Salas a,A. Mu~noz-Serrano a, J.M. Corrales-V�azquez e, J.G. Mu~noz-Mu~noz a
a LARUEX, Dpt. Applied Physics, Faculty of Veterinary Sciences, University of Extremadura, Avda. Universidad, s/n, 10003, C�aceres, Spainb NERC Centre for Ecology & Hydrology, Lancaster Environment Centre, Library Av. Bailrigg, Lancaster, LA1 4AP, United Kingdomc School of Environment and Life Sciences, Room 323, Peel Building, University of Salford, Manchester, M5 4WT, United Kingdomd School of Biosciences, Faculty of Science, University of Nottingham, Sutton Bonnington Campus, Leicerstershire, LE12 5RD, United Kingdome Department of Experimental Sciences and Mathematics Teaching, University of Extremadura, Avda. Universidad, s/n, 10003, C�aceres, Spain
a r t i c l e i n f o
Article history:Received 29 March 2017Accepted 20 June 2017Available online xxx
Keywords:Reference Animal and PlantMediterranean ecosystemConcentration ratiosTransferNon-human biotaWildlife
* Corresponding author. Corresponding author. autE-mail address: [email protected] (J. Guill�en).
http://dx.doi.org/10.1016/j.jenvrad.2017.06.0240265-931X/© 2017 Published by Elsevier Ltd.
Please cite this article in press as: Guill�en, J.ecosystem, Journal of Environmental Radioa
a b s t r a c t
A system for the radiological protection of the environment (or wildlife) based on Reference Animals andPlants (RAPs) has been suggested by the International Commission on Radiological Protection (ICRP). Toassess whole-body activity concentrations for RAPs and the resultant internal dose rates, transfer pa-rameters are required. However, transfer values specifically for the taxonomic families defined for theRAPs are often sparse and furthermore can be extremely site dependent. There is also a considerablegeographical bias within available transfer data, with few data for Mediterranean ecosystems. In thepresent work, stable element concentrations (I, Li, Be, B, Na, Mg, Al, P, S, K. Ca, Ti, V, Cr, Mn, Fe, Co, Ni, Cu,Zn, As, Se, Rb, Sr, Mo, Ag, Cd, Cs, Ba, Tl, Pb and U) in terrestrial RAPs, and the corresponding whole-bodyconcentration ratios, CRwo, were determined in two different Mediterranean ecosystems: a Pinewoodand a Dehesa (grassland with disperse tree cover). The RAPs considered in the Pinewood ecosystemwerePine Tree and Wild Grass; whereas in the Dehesa ecosystem those considered were Deer, Rat, Earth-worm, Bee, Frog, Duck and Wild Grass. The CRwo values estimated from these data are compared to thosereported in international compilations and databases.
© 2017 Published by Elsevier Ltd.
1. Introduction
Radiological protection of the environment has evolved from ananthropogenic perspective (‘if man is adequately protected, so isthe environment’) (ICRP, 1997; 1991) to recommendations that theenvironment is assessed in its own right (ICRP, 2008a). The conceptof Reference Animals and Plants (RAPs) has been proposed by theICRP (ICRP, 2008b) to provide a methodology similar to that used inhuman radiological protection (i.e. Reference Man). According tothe ICRP definition (ICRP, 2008b), a RAP is ‘a hypothetical entity, withthe assumed basic biological characteristics of a particular type ofanimal or plant, as described to the generality of the taxonomic level offamily, with defined anatomical, physiological, and life-history prop-erties, that can be used for the purposes of relating exposure to dose,and dose to effects, for that type of living organism’. Various models
or.
, et al., Transfer parameters foctivity (2017), http://dx.doi.o
are available to quantify exposure (usually as dose rate) of animalsand plants (wildlife). Most of these models use a quasi-equilibriumapproach to estimate the activity concentration in organisms andconsequently their internal dose rate (e.g. the ERICA Tool (Brownet al., 2008, 2016); RESRAD-BIOTA (USDoE, 2002) and R&D128/SP1a (Copplestone et al., 2001, 2003)).
Concentration ratios, CRwo, are often used in such models(Beresford et al., 2008a) to predict activity concentrations in wild-life assuming that there is equilibrium between the whole organ-ism (RAP) and the appropriate medium (i.e. usually soil in the caseof terrestrial ecosystems). Table 1 shows the existing CRwo valuesavailable for the selected RAPs as reported in ICRP 114 (Annex A.1)for terrestrial ecosystems (ICRP, 2009); CRwo values are generallysummarized by element (not specific radioisotope). It can be seenthat there are many gaps, and that there are only available data forabout 37% of the 200 element-RAP combinations considered inICRP (2009). Data are also lacking for some radiologically significantelements (e.g. iodine). Data reported in ICRP (2009) were derivedfrom the online database described by (Copplestone et al., 2013).
r ICRP's Reference Animals and Plants in a terrestrial Mediterraneanrg/10.1016/j.jenvrad.2017.06.024

Table 1Availability of CRwo values for RAP in terrestrial ecosystem. Adapted from ICRP 114(ICRP, 2009).
Element Earthworm Bee Rat Frog Deer Duck Wild Grass Pine Tree
Am X X X X X XBa XCd X X XCe X XCl X X XCo X XCr XCs X X X X X X XEu X XI XLa XMn XNb XNi X XPb X X X X XPo X X X XPu X X X XRa X X X XSb X XSe X XSr X X X X X X XTc X XTh X X XU X X X XZn X X X
J. Guill�en et al. / Journal of Environmental Radioactivity xxx (2017) 1e142
Although this database has been updated since its use in the ICRPpublication (see Brown et al., 2016), data remain sparse or lackingfor many RAP-element combinations (see http://www.wildlifetransferdatabase.org/). CRwo values are also likely to behighly site specific which contributes to the large variationobserved within the available data (Wood et al., 2009; Beresfordet al., 2016; Johansen et al., 2012; Hirth et al., 2017), and there arealso biases in the available data (Wood et al., 2013; Beresford et al.,2013). The data included for RAPs in the on-line database(Copplestone et al., 2013) are predominantly from Europe, Japan,North America and Australasia, and mainly in temperate and arcticecosystems (Howard et al., 2013). To address the lack of data, ICRP(2009) suggested the identification of sites fromwhich all RAPs fora given generic ecosystem could be sampled.
The goal of this study was to determine CRwo values forterrestrial RAPs (Earthworm, Bee, Rat, Frog, Deer, Duck, Wild Grassand Pine Tree) collected in Mediterranean ecosystems for 32 ele-ments (Ag, Al, As, B, Ba, Be, Ca, Cd, Co, Cr, Cs, Cu, Fe, I, K, Li, Mg, Mn,Mo, Na, Ni, P, Pb, Rb, S, Se, Sr, Ti, Tl, U, V and Zn). The main samplingsite was a Dehesa, which is a typical Mediterranean semi-naturalgrassland with disperse tree cover, mainly holm oaks (Quercusilex). As there was no pine tree at this location, a Pinewood locatedin the vicinity was also selected. Pine Tree (wood (trunk), bark,needles and branches) and Wild Grass were collected from thissecond site. The CRwo values for these Mediterranean ecosystemsare compared with values reported in temperate climates and in-ternational databases (Barnett et al., 2013, 2014; ICRP, 2009;Copplestone et al., 2013). Ratios of elemental concentrations inthe RAPs are also discussed.
2. Material and methods
2.1. Sampling sites
Two locations were selected for sampling terrestrial RAPs in theprovince of C�aceres, western Spain, in the surroundings of Mon-fragüe National Park: a Dehesa and a Pinewood. Fig. 1 shows theapproximate location of the sampling sites. The climate is dry sub-
Please cite this article in press as: Guill�en, J., et al., Transfer parameters foecosystem, Journal of Environmental Radioactivity (2017), http://dx.doi.o
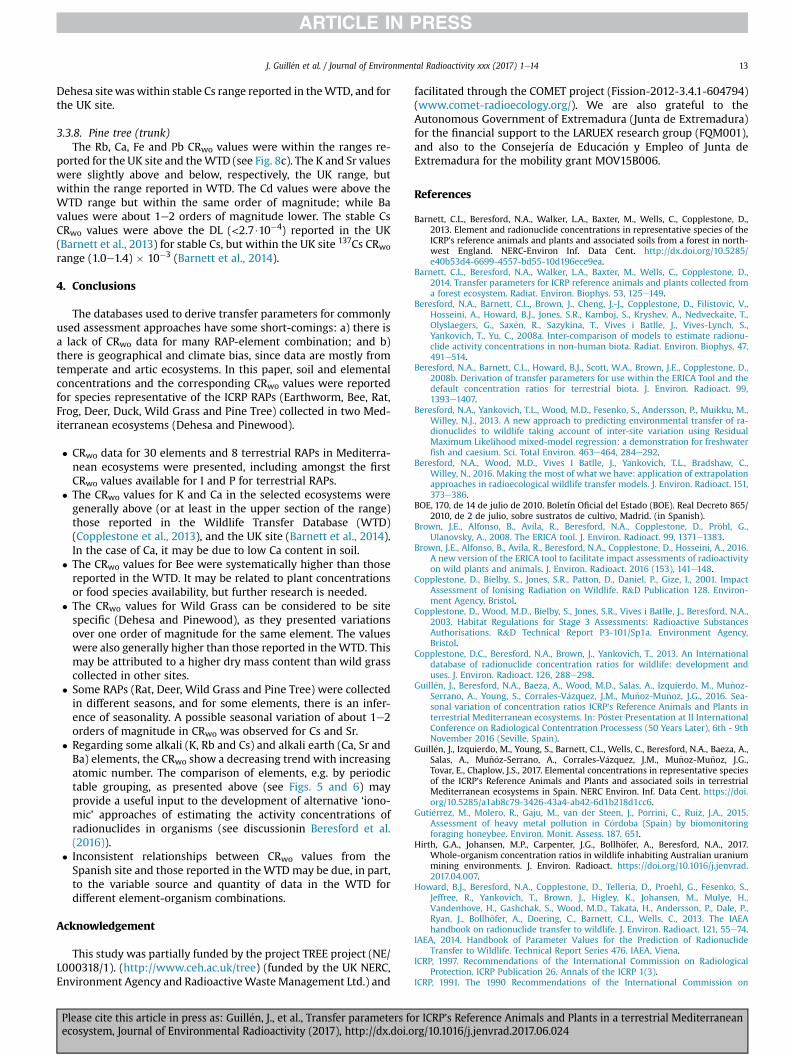
humid (‘Csa’ in K€oppen classification), with an annual averagetemperature of 16 �C and hot summers (Kottek et al., 2006). Fig. 3shows the daily temperature, humidity and accumulated rainfallin the surroundings of Monfragüe.
The Valero Dehesa is privately owned and extends over morethan 4600 ha; 1330 ha are within the National Park Monfragüe. Itserves as a hunting reserve, mainly for red deer (Cervus elaphus)and wild boar (Sus scrofa). Its management is traditional for adehesa, based on an annually rotating quarter system. A quarter ofthe site is used for growing cereals (wheat, barley or oats), anotherfor legumes (mainly lupin (Lupinus albus)), in another the soil isturned over and kept as fallow land, and the last one is left forwildlife. This rotation prevents soil from depletion, and allowsbetter control of weeds, pests and diseases. At the Dehesa, twodifferent sampling sites (see Fig. 2) were selected at which differentrepresentative species of RAPs could be sampled as follows:
� ‘Pond area’ (c. 5000 m2): Earthworms, Frogs, Rat, Deer, WildGrass and Duck RAPs and soil.
� ‘Rat sampling area’ (c. 9500 m2): Bee, Rat, Deer and Wild GrassRAPs and soil, (approximately 4 km from the ‘Pond area’).
Soil texture was silt-loam with a pH of 6.5 at the Dehesa. As nopine trees were present in the selected Dehesa, additional samplingwas undertaken at Bazagona Pinewood. This unmanaged naturalpinewood is approximately 16 km from Valero Dehesa. Wild grassand pine tree were sampled at this location. The soil texture ofPinewood site was loamy-sand with a pH of 5.2.
2.2. RAPs sampled
RAPs are defined at the taxonomic level of Family (ICRP, 2009)and Table 2 lists the representative species of RAPs sampled in theDehesa and Pinewood sites. The following sample types werecollected:
� Earthworms (Lumbricidae spp.): nineteen individuals werecollected by digging in the ‘Pond area’ in July 2014. After rinsingin distilled water the worms were placed in aerated containersfor three days with damp tissue paper to allow gut evacuation.Six composite samples were created with 3e4 individuals ineach.
� Bees (Apis mellifera): twenty individuals were collected from ahive using smoke whilst wearing protective clothing onNovember 2014 in the ‘Rat sampling area’. The hives present inthe area are mobile, so that they can be transported to a newlocationwhen food is scarce. In the case of this particular hive, itwas placed in June on a mountain area in the north of C�aceresprovince and brought back to Valero at the end of summer (lateSeptember).
� Frogs (Pelophylax perezi): three adult individuals were collectedin the pond area in July 2014. These were skinned and the gut,liver, kidney, bone and muscle were separated. As the thyroidwas too small to easily separate, an area around it was selectedand classified as the ‘thyroid sample’.
� Rats (Apodemus sylvaticus): were sampled from two sites withinthe Dehesa (as requested by the wardens in order not to disturbhunting preparations). Three individuals were collected at the‘Pond area’ (summer 2014), and nine in the ‘Rat sampling area’(three each in autumn 2014, winter 2014/15 and spring 2015)using Sherman humane traps. Animals were skinned and thesame tissues as for the frogs were removed.
� Deer (Cervus elaphus): were shot by hunters and sampled whentheywere gathered for veterinary examination. Wewere unableto record the exact place of the hunting or weigh the animals.
r ICRP's Reference Animals and Plants in a terrestrial Mediterraneanrg/10.1016/j.jenvrad.2017.06.024
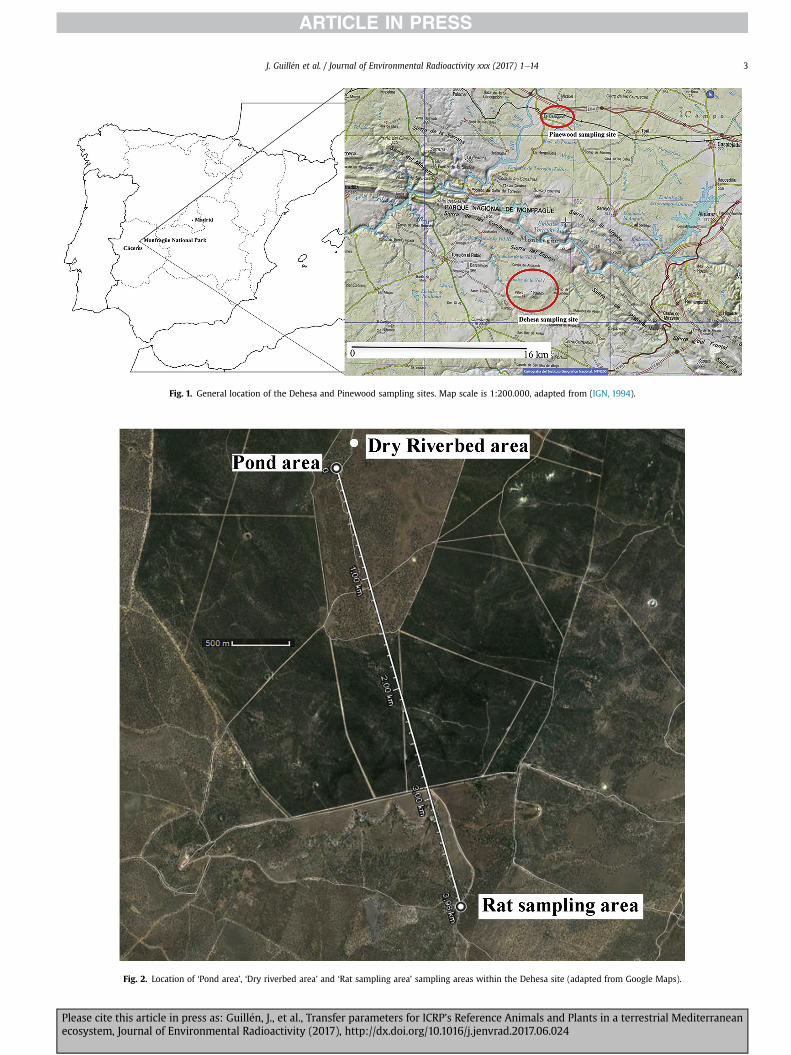
Fig. 1. General location of the Dehesa and Pinewood sampling sites. Map scale is 1:200.000, adapted from (IGN, 1994).
Fig. 2. Location of ‘Pond area’, ‘Dry riverbed area’ and ‘Rat sampling area’ sampling areas within the Dehesa site (adapted from Google Maps).
J. Guill�en et al. / Journal of Environmental Radioactivity xxx (2017) 1e14 3
Please cite this article in press as: Guill�en, J., et al., Transfer parameters for ICRP's Reference Animals and Plants in a terrestrial Mediterraneanecosystem, Journal of Environmental Radioactivity (2017), http://dx.doi.org/10.1016/j.jenvrad.2017.06.024
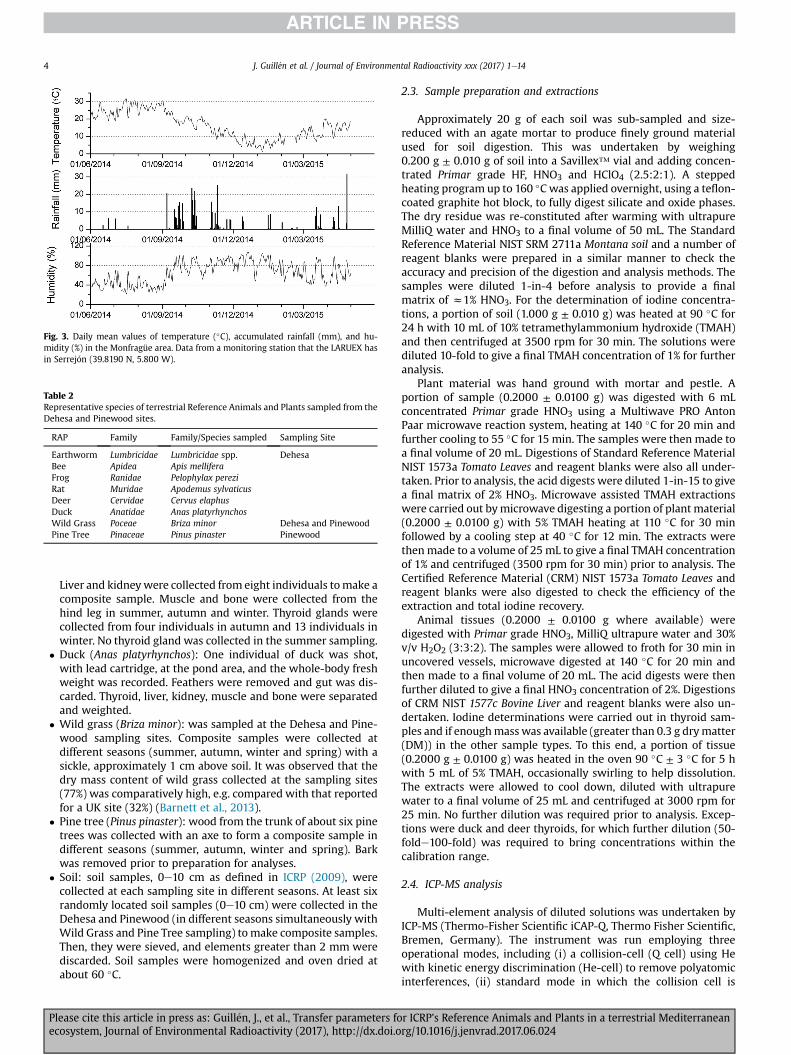
Fig. 3. Daily mean values of temperature (�C), accumulated rainfall (mm), and hu-midity (%) in the Monfragüe area. Data from a monitoring station that the LARUEX hasin Serrej�on (39.8190 N, 5.800 W).
Table 2Representative species of terrestrial Reference Animals and Plants sampled from theDehesa and Pinewood sites.
RAP Family Family/Species sampled Sampling Site
Earthworm Lumbricidae Lumbricidae spp. DehesaBee Apidea Apis melliferaFrog Ranidae Pelophylax pereziRat Muridae Apodemus sylvaticusDeer Cervidae Cervus elaphusDuck Anatidae Anas platyrhynchosWild Grass Poceae Briza minor Dehesa and PinewoodPine Tree Pinaceae Pinus pinaster Pinewood
J. Guill�en et al. / Journal of Environmental Radioactivity xxx (2017) 1e144
Liver and kidneywere collected from eight individuals tomake acomposite sample. Muscle and bone were collected from thehind leg in summer, autumn and winter. Thyroid glands werecollected from four individuals in autumn and 13 individuals inwinter. No thyroid gland was collected in the summer sampling.
� Duck (Anas platyrhynchos): One individual of duck was shot,with lead cartridge, at the pond area, and the whole-body freshweight was recorded. Feathers were removed and gut was dis-carded. Thyroid, liver, kidney, muscle and bone were separatedand weighted.
� Wild grass (Briza minor): was sampled at the Dehesa and Pine-wood sampling sites. Composite samples were collected atdifferent seasons (summer, autumn, winter and spring) with asickle, approximately 1 cm above soil. It was observed that thedry mass content of wild grass collected at the sampling sites(77%) was comparatively high, e.g. compared with that reportedfor a UK site (32%) (Barnett et al., 2013).
� Pine tree (Pinus pinaster): wood from the trunk of about six pinetrees was collected with an axe to form a composite sample indifferent seasons (summer, autumn, winter and spring). Barkwas removed prior to preparation for analyses.
� Soil: soil samples, 0e10 cm as defined in ICRP (2009), werecollected at each sampling site in different seasons. At least sixrandomly located soil samples (0e10 cm) were collected in theDehesa and Pinewood (in different seasons simultaneously withWild Grass and Pine Tree sampling) tomake composite samples.Then, they were sieved, and elements greater than 2 mm werediscarded. Soil samples were homogenized and oven dried atabout 60 �C.
Please cite this article in press as: Guill�en, J., et al., Transfer parameters foecosystem, Journal of Environmental Radioactivity (2017), http://dx.doi.o
2.3. Sample preparation and extractions
Approximately 20 g of each soil was sub-sampled and size-reduced with an agate mortar to produce finely ground materialused for soil digestion. This was undertaken by weighing0.200 g ± 0.010 g of soil into a Savillex™ vial and adding concen-trated Primar grade HF, HNO3 and HClO4 (2.5:2:1). A steppedheating program up to 160 �Cwas applied overnight, using a teflon-coated graphite hot block, to fully digest silicate and oxide phases.The dry residue was re-constituted after warming with ultrapureMilliQ water and HNO3 to a final volume of 50 mL. The StandardReference Material NIST SRM 2711a Montana soil and a number ofreagent blanks were prepared in a similar manner to check theaccuracy and precision of the digestion and analysis methods. Thesamples were diluted 1-in-4 before analysis to provide a finalmatrix of z1% HNO3. For the determination of iodine concentra-tions, a portion of soil (1.000 g ± 0.010 g) was heated at 90 �C for24 h with 10 mL of 10% tetramethylammonium hydroxide (TMAH)and then centrifuged at 3500 rpm for 30 min. The solutions werediluted 10-fold to give a final TMAH concentration of 1% for furtheranalysis.
Plant material was hand ground with mortar and pestle. Aportion of sample (0.2000 ± 0.0100 g) was digested with 6 mLconcentrated Primar grade HNO3 using a Multiwave PRO AntonPaar microwave reaction system, heating at 140 �C for 20 min andfurther cooling to 55 �C for 15 min. The samples were then made toa final volume of 20 mL. Digestions of Standard Reference MaterialNIST 1573a Tomato Leaves and reagent blanks were also all under-taken. Prior to analysis, the acid digests were diluted 1-in-15 to givea final matrix of 2% HNO3. Microwave assisted TMAH extractionswere carried out bymicrowave digesting a portion of plant material(0.2000 ± 0.0100 g) with 5% TMAH heating at 110 �C for 30 minfollowed by a cooling step at 40 �C for 12 min. The extracts werethenmade to a volume of 25 mL to give a final TMAH concentrationof 1% and centrifuged (3500 rpm for 30 min) prior to analysis. TheCertified Reference Material (CRM) NIST 1573a Tomato Leaves andreagent blanks were also digested to check the efficiency of theextraction and total iodine recovery.
Animal tissues (0.2000 ± 0.0100 g where available) weredigested with Primar grade HNO3, MilliQ ultrapure water and 30%v/v H2O2 (3:3:2). The samples were allowed to froth for 30 min inuncovered vessels, microwave digested at 140 �C for 20 min andthen made to a final volume of 20 mL. The acid digests were thenfurther diluted to give a final HNO3 concentration of 2%. Digestionsof CRM NIST 1577c Bovine Liver and reagent blanks were also un-dertaken. Iodine determinations were carried out in thyroid sam-ples and if enoughmass was available (greater than 0.3 g drymatter(DM)) in the other sample types. To this end, a portion of tissue(0.2000 g ± 0.0100 g) was heated in the oven 90 �C ± 3 �C for 5 hwith 5 mL of 5% TMAH, occasionally swirling to help dissolution.The extracts were allowed to cool down, diluted with ultrapurewater to a final volume of 25 mL and centrifuged at 3000 rpm for25 min. No further dilution was required prior to analysis. Excep-tions were duck and deer thyroids, for which further dilution (50-folde100-fold) was required to bring concentrations within thecalibration range.
2.4. ICP-MS analysis
Multi-element analysis of diluted solutions was undertaken byICP-MS (Thermo-Fisher Scientific iCAP-Q, Thermo Fisher Scientific,Bremen, Germany). The instrument was run employing threeoperational modes, including (i) a collision-cell (Q cell) using Hewith kinetic energy discrimination (He-cell) to remove polyatomicinterferences, (ii) standard mode in which the collision cell is
r ICRP's Reference Animals and Plants in a terrestrial Mediterraneanrg/10.1016/j.jenvrad.2017.06.024

J. Guill�en et al. / Journal of Environmental Radioactivity xxx (2017) 1e14 5
evacuated and (iii) hydrogenmode (H2-cell) inwhich H2 gas is usedas the cell gas. Internal standards were introduced to the samplestream on a separate line via the ASXpress unit and included Ge(10 mg L�1), Rh (10 mg L�1) and Ir (5 mg L�1) in 2% trace analysis gradeHNO3 (Fisher Scientific, UK). External multi-element calibrationstandards (Claritas-PPT grade CLMS-2 from SPEX Certiprep Inc.,Metuchen, NJ, USA) included Ag, Al, As, Ba, Be, Cd, Ca, Co, Cr, Cs, Cu,Fe, K, Li, Mg, Mn, Mo, Na, Ni, P, Pb, Rb, S, Se, Sr, Tl, U, V and Zn, in therange 0e100 mg L�1 (0, 20, 40, 100 mg L�1). A bespoke externalmulti-element calibration solution (PlasmaCAL) was used to createCa, Mg, Na and K standards in the range 0e30 mg L�1. Phosphorus,B and S calibration utilised in-house standard solutions (KH2PO4,K2SO4 and H3BO3). In-sample switching was used to measure B andP in standard mode, Se in H2-cell mode and all other elements inHe-cell mode. Peak dwell times were 10 ms for most elements with150 scans per sample. Sample processing was undertaken usingQtegra™ software (Thermo-Fisher Scientific) utilizing externalcross-calibration between pulse-counting and analogue detectormodes when required.
Iodine analysis was undertaken separately, using a 1% TMAHmatrix for standards and samples. The instrument was calibratedusing synthetic chemical solutions diluted from NaIO3 stock solu-tion. The concentrations were determined in ‘standard mode’(evacuated collision cell) using Re as internal standard to correct forsuppression/enhancement effects.
Detection limits were calculated as three times the standarddeviation of the reagent blanks for each extraction form and sampletype. The Certified Reference Material elemental recoveries were inthe range 90e95 and 95e105% for NIST 1573a (plant material) andNIST 1577c (animal tissues) respectively. In soil samples, poor CRMelemental recoveries were obtained for B and S from comparisonwith NIST 2711a, probably due to the formation of volatile speciesduring the acid digestion (open vials). For plant and animal tissues,microwave digestion was used, which allowed retention of volatileelements. Results for both B and S in these tissues compared wellwith the CRMs used. Iodine recoveries of 78e85% for NIST 1573awere determined, calculated on the basis of a non-certified iodineconcentration of 0.85 mg kg�1. No certified or non-certified iodineconcentrations are available for NIST 1577c and NIST 2711a.
2.5. RAP whole-body concentrations
The whole-body concentrations for Rat, Frog, Deer and Duckwere calculated assuming that the tissues analysed (thyroid, liver,kidney, meat and bone) represented the whole animal (anapproach taken by Barnett et al. (2014) in a similar study). In thecase of Rats and Frogs, gut concentrations were not included in thewhole organism concentrations (following IAEA, 2014). As wewerenot able to determine the fresh mass of the deer in situ, fresh masspercentages of the whole-body for each tissue were assumed to bethe same as roe deer collected from a UK site (Barnett et al., 2014) inorder to estimate Deer whole organism concentrations.
3. Results and discussion
The full dataset from this study with all individual tissue resultsis available from Guill�en et al. (2017), here we present summarizedvalues for discussion.
3.1. Soil concentrations
Table 3 presents the arithmetic mean values and standard de-viation (SD) for the element concentration in soils collected at theDehesa and Pinewood sampling sites, expressed as mg/kg DM. Theconcentration of B and S is given as the detection limit (DL) (see
Please cite this article in press as: Guill�en, J., et al., Transfer parameters foecosystem, Journal of Environmental Radioactivity (2017), http://dx.doi.o
above). The two sampling areas in the Valero Dehesa had similarelemental concentrations. Comparing the Dehesa and Pinewoodsites, the Cr and Mo concentrations were about one order ofmagnitude higher in the Dehesa, whereas those of Ca, K and Rbwere one order of magnitude higher in the Pinewood. For theremaining elements, soil concentrations at the two sampling siteswere approximately of the same order of magnitude. Heavy metalconcentrations in the soils were below screening reference levelsfor negligible risks to the population according to national pro-cedures in the EU for agricultural soils (BOE, 2010; T�oth et al., 2016).
3.2. Biota concentrations
Tables 4 and 5 presents the mean values and SD of the elementalconcentrations of animal and vegetative RAPs, respectively,considered in Dehesa and Pinewood. These concentrations are foranimal whole organisms, and expressed in mg/kg fresh mass (FM).Concentrations for individual tissues and the mass of each tissuecan be found in (Guill�en et al., 2017). If an element was notdetectable in all tissues, the approach described by Barnett et al.(2014) was used: (i) using the DL values to estimate the whole or-ganism concentration if these were estimated to contribute <10% ofthe total body burden of the element (given all other uncertaintiesthis was considered to give a reasonable estimate); (ii) if tissue(s)for which DLs were reported were estimated to contribute morethan 10% of the estimated whole organism content in total then thewhole organism concentration was reported as a ‘less than’ value(Table 4). If data for one or more individuals for a given elementincluded ‘less than’ values, then the range is presented in Tables 4and 5 instead of the arithmetic mean value and SD.
From Tables 4 and 5, it can be seen that for some elements theSD is greater for those RAPs collected over different seasons (i.e.Rat, Deer, Wild Grass and Pine Tree). Fig. 4 shows, as an example,the seasonal variation of K, Cs, Ca and Sr concentrations in Rat(whole-body) and Wild Grass (collected at the Pinewood site).Potassium and Ca presented similar concentrations in the differentseasons, whereas Cs and Sr varied about one order of magnitude.This perhaps suggests seasonal variation though further research isneeded to assess this (Guill�en et al., 2016).
Regarding alkali metals (which include Cs), the whole organismK concentration was similar for Rat, Deer, Frog and Duck. The Kconcentration in Bee and Wild Grass (Dehesa) were higher by afactor about 2.5 and 4 respectively, while it was lower for Pine Treeby a factor of about 0.2 (see Tables 3 and 4). Fig. 5 presents themeanvalue and SD of the ratios of alkali elements and K (5a), and those ofalkaline earth elements and Ca (5b) for the selected RAPs; this al-lows us to look for relationships between elements across RAPs.These ratios were calculated for each individual RAP. It can beobserved that the Na/K ratio presented the highest values, followedby Rb/K (1e2 orders of magnitude lower than Na/K ratio) and Cs/Kand Li/K (4e6 orders of magnitude lower than Na/K ratio) (seeFig. 4a). The ratio Na/K was similar for Rat, Deer, Frog, Duck andEarthworm, and about one order of magnitude higher than for Bee,Pine Tree and Wild Grass. The Rb/K was similar for all analysedRAPs, in the range 0.00052 ± 0.00005 for Earthworm and0.0039 ± 0.0008 for Rat. The Li/K and Cs/K ratios were different foreach RAP.
Regarding alkaline earth elements (which include Sr), Deerpresented the highest whole-body Ca concentration, which wasabout 3.4 times higher than that of Frog and Duck, and about 5.4times that of Wild Grass (Tables 3 and 4). The Ca concentrations ofEarthworm, Bee, Rat and Pine Tree were about 1e2 order ofmagnitude lower than Deer. The ratio Mg/Ca presented the highestvalue for alkaline earth elements for each RAP, ranging from0.023 ± 0.003 in Deer to 0.95 ± 0.03 in Bee (see Fig. 5b). The Ratio
r ICRP's Reference Animals and Plants in a terrestrial Mediterraneanrg/10.1016/j.jenvrad.2017.06.024

Table 3Arithmetic mean value and standard deviation and range of stable element content in soils, expressed in mg/kg DM, from Dehesa (‘Pond Area’, ‘Rat Area’ and All Areas) andPinewood sampling sites.
Element Pond Area (N ¼ 6) Rat Sampling Area (N ¼ 3) Dehesa Site (All Areas) Pinewood Site (N ¼ 6)
Ag 0.13 ± 0.05 0.069 ± 0.019 0.11 ± 0.05 0.046 ± 0.009Al 18500 ± 900 11700 ± 3000 15900 ± 4000 33100 ± 2000As 9 ± 3 4.9 ± 2.4 7.7 ± 3.5 2.1 ± 0.3B <5.5 <5.5 <5.5 <5.5Ba 230 ± 20 110 ± 40 180 ± 70 520 ± 40Be 1.26 ± 0.09 0.45 ± 0.11 0.96 ± 0.43 1.5 ± 0.3Ca 1160 ± 290 640 ± 240 960 ± 370 2520 ± 150Cd 0.058 ± 0.017 0.041 ± 0.008 0.052 ± 0.016 0.035 ± 0.005Co 5.5 ± 1.9 1.6 ± 0.7 4.0 ± 2.5 1.02 ± 0.08Cr 24 ± 11 20 ± 17 22 ± 13 4.4 ± 0.5Cs 3.5 ± 0.3 2.1 ± 0.8 3.0 ± 0.9 4.6 ± 0.4Cu 5 ± 1 2.5 ± 1.0 4.1 ± 1.6 1.7 ± 0.3Fe 10400 ± 3400 9900 ± 8600 10200 ± 5200 3600 ± 400I 3.7 ± 1.5 0.55 ± 0.16 2.5 ± 2.0 0.75 ± 0.03K 6900 ± 700 4300 ± 1500 6000 ± 1700 33200 ± 2100Li 29.0 ± 1.3 15 ± 4 24 ± 8 23.2 ± 0.9Mg 1560 ± 190 610 ± 260 1200 ± 500 1180 ± 90Mn 430 ± 110 200 ± 120 350 ± 160 124 ± 25Mo 0.20 ± 0.06 0.20 ± 0.11 0.20 ± 0.07 0.049 ± 0.009Na 2050 ± 260 840 ± 240 1600 ± 670 6730 ± 460Ni 8.2 ± 2.2 3.3 ± 1.4 6.3 ± 3.1 2.0 ± 0.3P 310 ± 60 350 ± 120 320 ± 80 750 ± 70Pb 17.7 ± 1.8 12 ± 3 15.6 ± 3.7 26.6 ± 1.8Rb 49 ± 5 29 ± 12 41 ± 12 156 ± 10S <300 <300 <300 <300Se 0.50 ± 0.06 0.24 ± 0.06 0.40 ± 0.15 0.127 ± 0.020Sr 26 ± 3 15 ± 5 22 ± 7 76 ± 5Ti 440 ± 40 290 ± 80 380 ± 90 300 ± 80Tl 0.32 ± 0.04 0.18 ± 0.07 0.27 ± 0.09 0.87 ± 0.05U 3.4 ± 0.7 1.5 ± 0.4 2.7 ± 1.1 1.3 ± 0.3V 31 ± 8 24 ± 17 28 ± 12 7.1 ± 0.5Zn 23.8 ± 2.2 13 ± 4 20 ± 6 16.1 ± 1.7
Table 4Arithmetic mean value and standard deviation of stable element concentration in animal RAPs, expressed in mg/kg FM, sampled in Dehesa Site. WB ¼Whole-Body. * Only onesample measured. N ¼ number of replicates/samples. If data for an element included a ‘less than’ value, then range is presented.
Element Earthworm (N ¼ 6) Bee (N ¼ 3) Rat (WB) (N ¼ 12) Frog (WB) (N ¼ 3) Deer (WB) (N ¼ 3) Duck (WB) (N ¼ 1)
Ag 0.024 ± 0.009 0.011 ± 0.005 <0.0006e0.013 0.011 ± 0.007 0.0032 ± 0.0010 0.0030 *Al 58 ± 26 14 ± 7 <3.3e85.2 <2.5e6.4 <9.4e11 <3.2As 0.7 ± 0.3 0.101 ± 0.008 <0.0027e0.0054 0.06 ± 0.06 0.06 ± 0.05 0.021 *B 0.14 ± 0.06 10.57 ± 0.15 <0.035e0.45 0.099 ± 0.009 0.61 ± 0.09 0.076 *Ba 0.79 ± 0.22 6.3 ± 0.8 6 ± 6 9.5 ± 1.8 35 ± 7 8.9 *Be 0.0035 ± 0.0013 0.0010 ± 0.0004 <0.0003 <0.00028e0.00052 <0.00079e0.0011 <0.00088Ca 600 ± 210 1020 ± 70 7800 ± 4100 8400 ± 2100 29000 ± 7000 8300 *Cd 0.17 ± 0.06 0.160 ± 0.013 <0.0027e0.019 0.011 ± 0.011 0.0087 ± 0.0015 0.0028 *Co 2.5 ± 1.0 0.70 ± 0.06 0.022 ± 0.007 0.11 ± 0.16 0.028 ± 0.018 0.013 *Cr 0.13 ± 0.05 <0.026e0.086 0.05 ± 0.03 0.0243 ± 0.0017 2 ± 3 0.87 *Cs 0.012 ± 0.004 0.045 ± 0.005 0.10 ± 0.07 0.08 ± 0.07 0.019 ± 0.013 0.0076 *Cu 2.1 ± 0.9 14.9 ± 2.0 1.9 ± 0.5 1.4 ± 0.9 3.0 ± 1.6 1.7 *Fe 120 ± 40 127 ± 7 49 ± 11 22 ± 15 180 ± 130 190 *I 1.5 ± 0.4 0.039 * 0.014 ± 0.006 0.09 ± 0.08 0.133 ± 0.017 0.50 *K 1500 ± 300 8700 ± 500 3500 ± 500 3670 ± 160 3180 ± 220 1600 *Li 0.051 ± 0.020 0.049 ± 0.014 <0.0031e0.0084 0.024 ± 0.003 0.11 ± 0.04 <0.0069Mg 160 ± 50 970 ± 40 430 ± 60 477 ± 26 650 ± 100 200 *Mn 2.1 ± 0.6 431 ± 16 1.0 ± 0.7 8.8 ± 1.7 1.0 ± 0.5 1.2 *Mo 0.19 ± 0.11 <0.072e0.088 <0.033e0.13 <0.018e0.057 <0.13 <0.10Na 720 ± 180 490 ± 70 1460 ± 240 1070 ± 70 1240 ± 320 430 *Ni 0.16 ± 0.06 1.2 ± 0.3 0.08 ± 0.08 0.07 ± 0.05 1.1 ± 1.2 0.11 *P 1800 ± 600 7000 ± 340 740 ± 190 7400 ± 1100 15000 ± 3000 4800 *Pb 0.5 ± 0.3 0.15 ± 0.08 0.025 ± 0.018 0.10 ± 0.10 0.19 ± 0.14 3.1 *Rb 0.79 ± 0.21 13.3 ± 1.0 14 ± 4 4.2 ± 0.5 4.7 ± 1.0 3.3 *S 1400 ± 500 3600 ± 90 3100 ± 310 2100 ± 40 2000 ± 500 1100 *Se 0.7 ± 0.4 0.053 ± 0.006 0.09 ± 0.04 0.17 ± 0.08 0.028 ± 0.003 0.12 *Sr 2.1 ± 0.7 2.9 ± 0.3 9 ± 6 15.4 ± 1.3 20 ± 6 10 *Ti 0.32 ± 0.09 0.32 ± 0.06 2.4 ± 1.1 3.0 ± 0.6 19 ± 5 5.5 *Tl 0.0041 ± 0.0013 0.014 ± 0.004 0.013 ± 0.013 0.0037 ± 0.0007 0.0026 ± 0.0024 0.0017 *U 0.056 ± 0.026 0.0013 ± 0.0007 <0.00031e0.00042 0.004 ± 0.004 0.00023e0.00086 0.0020 *V 0.12 ± 0.04 0.019 ± 0.006 0.0087 ± 0.0054 0.027 ± 0.010 0.036 ± 0.018 0.040 *Zn 150 ± 120 69 ± 5 23 ± 4 20 ± 10 34 ± 23 8.7 *
J. Guill�en et al. / Journal of Environmental Radioactivity xxx (2017) 1e146
Please cite this article in press as: Guill�en, J., et al., Transfer parameters for ICRP's Reference Animals and Plants in a terrestrial Mediterraneanecosystem, Journal of Environmental Radioactivity (2017), http://dx.doi.org/10.1016/j.jenvrad.2017.06.024

Table 5Arithmetic mean value and standard deviation of stable element concentration in vegetal RAPs, expressed in mg/kg FM, sampled in Dehesa and Pinewood Sites. * Only onesample measured. N ¼ number of replicates/samples. If data for an element included a ‘less than’ value, then range is presented.
Element Dehesa Pinewood Element Dehesa Pinewood
Wild Grass (N ¼ 5) Wild Grass (N ¼ 5) Pine Trunk (N ¼ 4) Wild Grass (N ¼ 5) Wild Grass (N ¼ 5) Pine Trunk (N ¼ 4)
Ag <0.074e16 <0.060e0.066 <0.058e0.11 Mg 1400 ± 700 1300 ± 800 190 ± 50Al 210 ± 180 200 ± 150 8.8 ± 2.3 Mn 230 ± 70 47 ± 15 2.1 ± 0.3As 0.13 ± 0.08 0.11 ± 0.07 <0.0069 Mo 0.14 ± 0.11 0.07 ± 0.03 <0.016B <1.9e14 <2.0e5.2 <2.5 Na 240 ± 190 340 ± 220 <29e59Ba 45 ± 27 19 ± 8 0.56 ± 0.16 Ni 1.2 ± 0.7 0.5 ± 0.4 <0.020e0.042Be 0.012 ± 0.008 0.019 ± 0.014 <0.0020 P 2200 ± 1700 1400 ± 900 190 ± 160Ca 5500 ± 3900 4700 ± 2800 220 ± 70 Pb 0.4 ± 0.4 0.34 ± 0.20 0.055 ± 0.015Cd 0.07 ± 0.06 0.05 ± 0.03 0.015 ± 0.005 Rb 20 ± 24 7 ± 8 0.53 ± 0.16Co 0.15 ± 0.07 0.08 ± 0.05 0.009 ± 0.004 S 1600 ± 800 1000 ± 900 <390Cr 1.4 ± 1.0 0.9 ± 0.9 0.13 ± 0.04 Se 0.027 ± 0.007 0.024 ± 0.012 <0.0069Cs 0.06 ± 0.04 0.06 ± 0.05 <0.0014e0.015 Sr 29 ± 22 17 ± 8 1.2 ± 0.3Cu 5 ± 3 2.1 ± 1.0 0.55 ± 0.04 Ti 2.2 ± 1.8 3.2 ± 2.6 0.080 ± 0.021Fe 240 ± 160 170 ± 150 6.3 ± 1.4 Tl 0.007 ± 0.008 0.007 ± 0.005 <0.0055e0.0064I 0.6 ± 0.4 0.32 ± 0.16 <0.00058e0.015 U <0.022e0.050 <0.010e0.026 <0.030K 14000 ± 9000 7100 ± 7300 700 ± 190 V 0.36 ± 0.32 0.25 ± 0.22 <0.0041e0.0043Li 0.32 ± 0.22 0.4 ± 0.4 0.010 ± 0.008 Zn 25 ± 12 14 ± 7 2.3 ± 1.5
Fig. 4. Seasonal variation of K, Cs, Ca and Sr in a) Rat wholebody, b) Wild Grass (Pinewood) concentrations, in mg/kg FM; c) Rat CRwo and d) Wild Grass (Pinewood) CRwo. Standarddeviation of the three individuals collected in each season is presented for Rat; while measurement uncertainty was considered for Wild Grass, as a composite sample was collectedper season. CR values calculated using soil collected in each season.
J. Guill�en et al. / Journal of Environmental Radioactivity xxx (2017) 1e14 7
Please cite this article in press as: Guill�en, J., et al., Transfer parameters for ICRP's Reference Animals and Plants in a terrestrial Mediterraneanecosystem, Journal of Environmental Radioactivity (2017), http://dx.doi.org/10.1016/j.jenvrad.2017.06.024

Fig. 5. Arithmetic mean value and SD of the ratios between a) alkali metals (Li, Na, Rb and Cs) and K: and b) alkaline earth elements (Be, Mg, Sr and Ba) and Ca. These ratios werecalculated for each individual whole organism.
J. Guill�en et al. / Journal of Environmental Radioactivity xxx (2017) 1e148
Sr/Ca was usually 1e2 orders of magnitude lower than the Mg/Caratio for all RAPs, with the exception of Rat for which Sr/Ca andMg/Ca ratios were similar. The ratios Sr/Ca and Ba/Ca presented similarvalues for each RAP. The ratio Be/Ca was 5e6 orders of magnitudelower than that of Mg/Ca.
The concentration of major nutrient elements (Ca, K, Mg and Na)for Earthworm, Deer, Rat, RAP are within the range reported pre-viously from a study in the UK (Barnett et al., 2013). However, theywere higher in Bees, Wild Grass and Pine Tree RAPs than thosereported for UK. This difference might be attributed to the fact thatdifferent species were collected, but also for Wild Grass as alreadynoted, the freshmatter content in Spanish samples were lower than
Please cite this article in press as: Guill�en, J., et al., Transfer parameters foecosystem, Journal of Environmental Radioactivity (2017), http://dx.doi.o
those of UK (hence potentially increasing the fresh mass concen-trations). The heavy metal concentration (As, Cd, Cr, Cu, Pb and Zn)in Bee were similar to those reported in C�ordoba (Spain) and theNetherlands (van der Steen et al., 2012; Guti�errez et al., 2015) forApis mellifera. Whereas, Ni and Mn concentrations in Table 4 wereabout one order of magnitude higher.
Table 5 lists the annual arithmetic mean value of the elementalconcentration in the vegetative RAPs (Wild Grass and Pine Tree).Wild Grass collected at the Dehesa and Pinewood, had similarconcentrations for most elements. Only K and Mn concentration inWild Grass collected at the Dehesa were higher than at the Pine-wood by a factor about 2 and 4.9 respectively. In Pine Tree wood,
r ICRP's Reference Animals and Plants in a terrestrial Mediterraneanrg/10.1016/j.jenvrad.2017.06.024

J. Guill�en et al. / Journal of Environmental Radioactivity xxx (2017) 1e14 9
elemental concentrations were generally 1e2 orders of magnitudelower than in Wild Grass.
3.3. CRwo values
CRwo is defined as the ratio between the equilibrium activityconcentration of a radionuclide in an organism and the corre-sponding medium (ICRP, 2009) (eq. (1)). In the existing models anddata compilations applied in environmental impact assessments,CRwo values are presented by element assuming the same value forall isotopes (of that element) including stable isotopes (eq. (2))(Beresford et al., 2008b; Copplestone et al., 2013):
CRwo ¼ Activity radionuclide X in whole body RAP ðBq=kg FMÞActivity radionuclide X in soil ðBq=kg DMÞ
(1)
CRwo ¼ Concentration element X in whole body RAP ðmg=kg FMÞConcentration element X in soil ðmg=kg DMÞ
(2)
The soil used for the calculation of Deer CRwo values in this studywas the mean value of all soils analysed in Valero Dehesa; red deerrange freely over the Dehesa and no information about where thesample animals were killed was available (the similarity in resultsfrom our two Dehesa sampling locations gives confidence in this
Table 6Arithmetic mean value and standard deviation CR values for RAPs sampled in Dehesa andelement included a ‘less than’ value, then range is presented.
Element Dehesa
Earthworm Bee Rat (WB) Frog (WB)
Ag 0.11 ± 0.04 0.22 ± 0.09 <0.0019e0.20 0.05 ± 0.03Al 0.0032 ± 0.0014 0.0015 ± 0.0008 <0.00028e0.0073 0.00014e0.00035
As 0.09 ± 0.04 0.038 ± 0.003 <0.00018e0.0011 0.008 ± 0.007B N.D. N.D. N.D. N.D.Ba 0.0030 ± 0.0008 0.083 ± 0.010 0.05 ± 0.06 0.036 ± 0.007Be 0.0026 ± 0.0010 0.0030 ± 0.0012 <0.007 <0.00021
e0.00039Ca 0.37 ± 0.13 2.37 ± 0.16 11 ± 8 5.2 ± 1.3Cd 2.2 ± 0.8 4.9 ± 0.4 <0.065e0.47 0.14 ± 0.15Co 0.55 ± 0.23 0.67 ± 0.05 0.012 ± 0.006 0.02 ± 0.04Cr 0.007 ± 0.003 0.008 ± 0.005 0.0027 ± 0.0016 0.00140 ± 0.0001Cs 0.0033 ± 0.0010 0.028 ± 0.003 0.04 ± 0.04 0.021 ± 0.018Cu 0.48 ± 0.20 9.1 ± 1.2 0.69 ± 0.25 0.33 ± 0.21Fe 0.014 ± 0.005 0.0350 ± 0.0020 0.0053 ± 0.0016 0.0026 ± 0.0017I 0.53 ± 0.15 0.083 * 0.018 ± 0.013 0.03 ± 0.03K 0.19 ± 0.04 2.55 ± 0.14 0.72 ± 0.20 0.457 ± 0.020Li 0.0017 ± 0.0007 0.0040 ± 0.0012 <0.00021
e0.000540.00079 ± 0.0001
Mg 0.11 ± 0.03 2.17 ± 0.08 0.60 ± 0.20 0.323 ± 0.018Mn 0.0047 ± 0.0015 3.28 ± 0.12 0.004 ± 0.004 0.020 ± 0.004Mo 1.0 ± 0.6 <0.72e0.88 <0.17e0.63 <0.22e0.31Na 0.34 ± 0.09 0.68 ± 0.09 1.50 ± 0.6 0.51 ± 0.03Ni 0.023 ± 0.009 0.52 ± 0.13 0.023 ± 0.024 0.010 ± 0.008P 5.1 ± 1.7 32.7 ± 1.6 21 ± 5 21 ± 3Pb 0.025 ± 0.016 0.018 ± 0.010 0.0018 ± 0.0011 0.005 ± 0.005Rb 0.014 ± 0.004 0.60 ± 0.04 0.41 ± 0.16 0.075 ± 0.009S N.D. N.D. N.D. N.D.Se 1.3 ± 0.8 0.31 ± 0.03 0.31 ± 0.13 0.30 ± 0.14Sr 0.072 ± 0.023 0.266 ± 0.025 0.5 ± 0.5 0.52 ± 0.04Ti 0.00066 ± 0.00018 0.00129 ± 0.00024 0.007 ± 0.004 0.0062 ± 0.0013Tl 0.011 ± 0.003 0.11 ± 0.03 0.7 ± 0.8 0.0095 ± 0.0017U 0.014 ± 0.006 0.0011 ± 0.0006 <0.000097
e0.000270.0009 ± 0.0009
V 0.0045 ± 0.0015 0.0019 ± 0.0005 0.00036 ± 0.00022 0.0010 ± 0.0003Zn 6 ± 5 7.0 ± 0.5 1.6 ± 0.5 0.8 ± 0.4
Please cite this article in press as: Guill�en, J., et al., Transfer parameters foecosystem, Journal of Environmental Radioactivity (2017), http://dx.doi.o
approach). For Rat, the mean values of ‘Pond area’ and ‘Rat sam-pling area’ were used for individuals collected in each area. In thecase of RAPs collected in only one area, soil mean values for thatareawere used: a) ‘Pond area’ for Earthworm, Frog and Duck, and b)‘Rat sampling area’ for Bees. In the case ofWild Grass and Pine Tree,the corresponding CRwo values were calculated using soil sampledat the same time as the plants.
Table 6 presents the CRwo mean values and standard deviationsfor the combinations of element-RAP considered. Here we presentarithmetic means for comparison with the international data; thegeometric means as estimated in the WTD have been shown to bepotentially poor estimates (Wood et al., 2013). Geometric meansand standard deviation are presented in the accompanying dataset(Guill�en et al., 2017). As only one individual of duck was available,the corresponding CRwo values should be considered to give anapproximate order of magnitude estimate. If only one sample wasanalysed, this is noted in Table 6. If data for an element includes‘less than’ values, then the range is presented in Table 6.
The coefficient of variation of CRwo values for some elements(ratio between standard deviation and mean value) was in therange 6e170% for RAPs collected in different seasons (Rat, Deer,Wild Grass and Pine Tree). Seasonal variation is suggested in Fig. 4,CRwo values for Rat and Wild Grass (Pinewood site) although asnoted above given the limited number of samples further samplingand analyses would be required to properly demonstrate this. TheCRwo values for K, Ca and Sr varied about one order of magnitude,
Pinewood Sites. N.D. ¼ not determined. * Only one sample measured. If data for an
Pinewood
Deer (WB) Duck(WB)
Wild Grass Wild Grass Pine Tree (Trunk)
0.031 ± 0.010 0.028 * <0.45e215 <0.41e1.28 2.1 *<0.00059e0.00068
<0.00017 0.019 ± 0.020 0.18 ± 0.24 0.00027 ± 0.00007
0.008 ± 0.007 0.0025 * 0.03 ± 0.04 0.3 ± 0.4 <0.0043N.D. N.D. N.D. N.D. N.D.0.19 ± 0.04 0.040 * 0.4 ± 0.3 0.3 ± 0.4 0.0011 ± 0.0003<0.00082e0.0012
<0.00071 0.025 ± 0.026 0.3 ± 0.4 <0.0013
30 ± 8 6.4 * 9 ± 9 1.4 ± 1.4 0.088 ± 0.0250.17 ± 0.03 0.045 * 1.7 ± 1.4 1.3 ± 1.4 0.45 ± 0.220.007 ± 0.004 0.0034 * 0.09 ± 0.08 0.23 ± 0.21 0.009 ± 0.004
0 0.10 ± 0.14 0.048 * 0.13 ± 0.17 0.25 ± 0.18 0.030 ± 0.0130.006 ± 0.004 0.0020 * 0.03 ± 0.03 0.15 ± 0.19 0.0018 ± 0.00180.7 ± 0.4 0.37 * 2.0 ± 1.8 1.1 ± 0.6 0.35 ± 0.040.017 ± 0.013 0.020 * 0.04 ± 0.05 0.17 ± 0.18 0.0018 ± 0.00060.053 ± 0.007 0.080 * 0.6 ± 0.7 0.5 ± 0.3 0.019 ± 0.0040.54 ± 0.04 0.22 * 3.2 ± 2.8 0.27 ± 0.19 0.022 ± 0.005
0 0.0047 ± 0.0019 <0.00023 0.021 ± 0.021 0.16 ± 0.20 0.0004 ± 0.0003
0.54 ± 0.08 0.13 * 2.1 ± 1.6 0.9 ± 0.7 0.15 ± 0.040.0030 ± 0.0015 0.0045 * 1.1 ± 0.7 0.45 ± 0.12 0.017 ± 0.004<0.64 <0.63 0.8 ± 0.7 1.3 ± 1.0 <0.330.78 ± 0.20 0.26 * 0.25 ± 0.20 0.3 ± 0.3 0.0068 ± 0.00190.18 ± 0.19 0.017 * 0.4 ± 0.3 0.30 ± 0.18 0.018 ± 0.01047 ± 9 15 * 7 ± 7 1.6 ± 1.4 0.26 ± 0.210.012 ± 0.009 0.18 * 0.04 ± 0.05 0.2 ± 0.3 0.0021 ± 0.00070.114 ± 0.024 0.064 * 0.6 ± 0.6 0.12 ± 0.07 0.0035 ± 0.0011N.D. N.D. N.D. N.D. N.D.0.069 ± 0.008 0.20 * 0.09 ± 0.06 0.32 ± 0.21 <0.0650.92 ± 0.26 0.37 * 2.0 ± 1.7 0.4 ± 0.3 0.016 ± 0.0060.050 ± 0.012 0.012 * 0.008 ± 0.008 0.18 ± 0.23 0.00030 ± 0.000160.010 ± 0.009 0.0050 * 0.05 ± 0.06 0.13 ± 0.17 0.004 ± 0.0040.000086e0.00032
0.00052* <0.0060e0.041
<0.0052e0.018
<0.029
0.0013 ± 0.0007 0.0014 * 0.02 ± 0.03 0.17 ± 0.20 0.00056 *1.8 ± 1.2 0.39 * 2.0 ± 1.6 0.8 ± 0.4 0.14 ± 0.08
r ICRP's Reference Animals and Plants in a terrestrial Mediterraneanrg/10.1016/j.jenvrad.2017.06.024

J. Guill�en et al. / Journal of Environmental Radioactivity xxx (2017) 1e1410
whereas that for Cs showed 1e2 order of magnitude variations.Phosphorus generally presented the highest CRwo value of all
analysed elements for all the RAPs considered. It is one of the mainnutrients and form part of adenosine triphosphate (ATP), involvedin intracellular energy transfer. Deer and Bee presented the highestP CRwo value, followed by Rat, Frog and Duck, and then by WildGrass, Earthworm and Pine Tree. Phosphorous concentrations inbone were higher than in other tissues. Fig. 6 shows the ratio ofCRwo for other essential andmacro nutrients (Ca and K) with that ofP, calculated for individual whole-body concentrations. It can beobserved that the ratio CRwo Ca/CRwo P was highest for Wild Grassin the two sites, followed by vertebrate RAPs (Rat, Deer, Frog andDuck) and Pine Tree. Invertebrate RAPs presented the lower valuesof the ratios, by a factor about 0.2. The ratio CRwo K/CRwo P was thesame order of magnitude for all animal RAPs, but about one order ofmagnitude higher for vegetative RAPs (Pine Tree and Wild Grass).Earthworm andWild Grass presented iodine CRwo values one orderof magnitude higher than all the other RAPs (see Table 6). Withinthe ERICA Tool P concentrations in organisms are currently esti-mated using the P concentration in air (Beresford et al., 2008b). Thisapproach has not been justified and the CRwo-soil values reportedhere are amongst the first available and may lead to modelreparameterisation.
For comparative purposes, a selection of alkali (K, Rb, and Cs),alkaline earth (Ca, Sr and Ba) and heavy metal (Cd, Pb and U) ele-ments, together with Fe, I and P have been used. Figs. 7 and 8 showsthe comparison of CRwo values for these elements in this work andthe range of those reported in a temperate UK coniferous forest(Barnett et al., 2013, 2014) and in the international online WildlifeTransfer Database (WTD) (Copplestone et al., 2013). The WTD wasused for the calculation of CRwo values for RAPs in ICRP Publication114 (ICRP, 2009). In this paper an updated version of this database(as described by Brown et al., 2016) was used (last accessed on 20th
Fig. 6. Arithmetic mean value and SD of CRwo Ca/CRwo P and CRwo K/CRwo P ratios calculateWild Grass. (D) and (P) are for Wild Grass collected at the Dehesa and Pinewood sites.
Please cite this article in press as: Guill�en, J., et al., Transfer parameters foecosystem, Journal of Environmental Radioactivity (2017), http://dx.doi.o
April 2015). Although the UK database (Barnett et al., 2013, 2014) isincluded in the WTD database, we will use it for comparison pur-poses because it was a study conducted using the same protocol(including target taxa) as that described in this paper.
Comparing CRwo values for Wild Grass and Pine Tree, it can beobserved that the values for Pine Tree were usually 1e2 orders ofmagnitude lower than for Wild Grass. It is also observed that whenconsidering elements from the same group in the periodic table,alkali (K, Rb and Cs) or alkaline earth (Ca, Sr and Ba), the CRwovalues decrease with increasing atomic number for all RAPs (seeFigs. 7 and 8). Similar trends can be seen in reported CRwo rangesfor Earthworm, Bee, Deer in the UK (Barnett et al., 2013).Whilst thispaper and Barnett et al. report CRwo values for stable elements andthe WTD also contains data for radionuclides it is assumed thatstable elements are suitable proxies for radionuclides (i.e. at steadystate the bioavailabilities of radionuclides and stable elements issimilar).
3.3.1. EarthwormThe Rb, Sr, K, Cd, Fe and U values were within the ranges of the
WTD values (see Fig. 7a). The Ca value was higher than in the UKand WTD, while Cs and Ba were lower, but the same order ofmagnitude.
3.3.2. BeeBee CRwo values were generally 1e2 orders of magnitude higher
than those reported for the UK and WTD database (see Fig. 7b)(note the WTD bee CRwo values comprise only the UK data and oneNorth American study). This difference may be related to a highertransfer to plants at the Spanish site, as suggested by the results forWild Grass and Pine Tree, or to the food species available.
d for the different individuals of Rat, Deer, Frog, Duck, Earthworm, Bee, Pine Tree and
r ICRP's Reference Animals and Plants in a terrestrial Mediterraneanrg/10.1016/j.jenvrad.2017.06.024

Fig. 7. Arithmetic mean value and standard deviation of CRwo values for K, Rb, Cs, Ca, Sr, Ba, Cd, Fe, Pb and U in Spain, and ranges reported in UK (Barnett et al., 2013, 2014) and anonline database, WTD (Copplestone et al., 2013), for animal RAPs: a) Earthworm, b) Bee, c) Rat, d) Frog, e) Deer and f) Duck.
J. Guill�en et al. / Journal of Environmental Radioactivity xxx (2017) 1e14 11
Please cite this article in press as: Guill�en, J., et al., Transfer parameters for ICRP's Reference Animals and Plants in a terrestrial Mediterraneanecosystem, Journal of Environmental Radioactivity (2017), http://dx.doi.org/10.1016/j.jenvrad.2017.06.024

Fig. 8. Arithmetic mean value and standard deviation of CRwo values for K, Rb, Cs, Ca, Sr, Ba, Cd, Fe, Pb and U in Spain, and ranges reported in UK (Barnett et al., 2013, 2014) and anonline database, WTD (Copplestone et al., 2013), for vegetal RAPs: a) Wild grass (Dehesa; b) Wild Grass (Pine Wood) and c) Pine Tree.
J. Guill�en et al. / Journal of Environmental Radioactivity xxx (2017) 1e1412
3.3.3. FrogReported CRwo values for Frog for the selected elements were
limited to Cs, Sr and Pb inWTD database (see Fig. 7c). The Sr and Pbvalues from the Spanish site were within the range reported in theWTD, and the Cs was lower, though in the same order of magnitudeas the lower end of the WTD range.
3.3.4. RatThe Rb, Ca, Sr and Pb CRwo values were within the ranges re-
ported in the WTD (see Fig. 7d); the K, Ba and Fe values werehigher. The Cs mean value was slightly higher than the UK range,but within the WTD range; no Rat CRwo value was reported for Cdor U in the other databases.
3.3.5. DeerThe Cs, Ca, Sr, Ba and Cd CRwo values were similar to those re-
ported in the UK and WTD database (see Fig. 7e). The K, Rb and Pbvalues were about one order of magnitude higher than the UKrange, but within WTD range. The Fe mean value was one order ofmagnitude higher than WTD range. The Cs CRwo value at theDehesa site was one order of magnitude lower than the 137Cs CRworange reported in UK (0.01e0.12), but higher than for stable Cs
Please cite this article in press as: Guill�en, J., et al., Transfer parameters foecosystem, Journal of Environmental Radioactivity (2017), http://dx.doi.o
(0.001e0.0069) (Barnett et al., 2014). Given the apparently highertransfer to Wild Grass at the Spanish sites, some of these obser-vation are perhaps unexpected.
3.3.6. DuckCRwo values for K, Cs, and Sr for Duckwere reported inWTD (see
Fig. 7f). The K and Sr values were within the reported range, and Cswas about one order of magnitude lower. It should be noted thatonly one duck was sampled.
3.3.7. Wild grassFig. 8a and b shows the Wild grass CRwo values from the Dehesa
and Pinewood sampling sites. The K, Rb, Ca and Sr values wereapproximately one order of magnitude higher in the Dehesa; whileCs, Fe, Pb and U were about one order of magnitude higher in thePinewood site. The Ca, Sr and Ba values (for both sites) were oneorder of magnitude higher than the UK range, and only Sr waswithin the WTD range. For Ca, this may be attributed to a lower Caconcentration in Spanish soils. The Cd, Fe, Pb and U values wereabout two orders of magnitude higher than the UK range, butwithin the WTD range (though not for Fe at Pinewood, which wasabout one order of magnitude higher). The Cs CRwo value for the
r ICRP's Reference Animals and Plants in a terrestrial Mediterraneanrg/10.1016/j.jenvrad.2017.06.024
J. Guill�en et al. / Journal of Environmental Radioactivity xxx (2017) 1e14 13
Dehesa sitewaswithin stable Cs range reported in theWTD, and forthe UK site.
3.3.8. Pine tree (trunk)The Rb, Ca, Fe and Pb CRwo values were within the ranges re-
ported for the UK site and theWTD (see Fig. 8c). The K and Sr valueswere slightly above and below, respectively, the UK range, butwithin the range reported in WTD. The Cd values were above theWTD range but within the same order of magnitude; while Bavalues were about 1e2 orders of magnitude lower. The stable CsCRwo values were above the DL (<2.7$10�4) reported in the UK(Barnett et al., 2013) for stable Cs, but within the UK site 137Cs CRworange (1.0e1.4) � 10�3 (Barnett et al., 2014).
4. Conclusions
The databases used to derive transfer parameters for commonlyused assessment approaches have some short-comings: a) there isa lack of CRwo data for many RAP-element combination; and b)there is geographical and climate bias, since data are mostly fromtemperate and artic ecosystems. In this paper, soil and elementalconcentrations and the corresponding CRwo values were reportedfor species representative of the ICRP RAPs (Earthworm, Bee, Rat,Frog, Deer, Duck, Wild Grass and Pine Tree) collected in two Med-iterranean ecosystems (Dehesa and Pinewood).
� CRwo data for 30 elements and 8 terrestrial RAPs in Mediterra-nean ecosystems were presented, including amongst the firstCRwo values available for I and P for terrestrial RAPs.
� The CRwo values for K and Ca in the selected ecosystems weregenerally above (or at least in the upper section of the range)those reported in the Wildlife Transfer Database (WTD)(Copplestone et al., 2013), and the UK site (Barnett et al., 2014).In the case of Ca, it may be due to low Ca content in soil.
� The CRwo values for Bee were systematically higher than thosereported in the WTD. It may be related to plant concentrationsor food species availability, but further research is needed.
� The CRwo values for Wild Grass can be considered to be sitespecific (Dehesa and Pinewood), as they presented variationsover one order of magnitude for the same element. The valueswere also generally higher than those reported in theWTD. Thismay be attributed to a higher dry mass content than wild grasscollected in other sites.
� Some RAPs (Rat, Deer, Wild Grass and Pine Tree) were collectedin different seasons, and for some elements, there is an infer-ence of seasonality. A possible seasonal variation of about 1e2orders of magnitude in CRwo was observed for Cs and Sr.
� Regarding some alkali (K, Rb and Cs) and alkali earth (Ca, Sr andBa) elements, the CRwo show a decreasing trend with increasingatomic number. The comparison of elements, e.g. by periodictable grouping, as presented above (see Figs. 5 and 6) mayprovide a useful input to the development of alternative ‘iono-mic’ approaches of estimating the activity concentrations ofradionuclides in organisms (see discussionin Beresford et al.(2016)).
� Inconsistent relationships between CRwo values from theSpanish site and those reported in the WTDmay be due, in part,to the variable source and quantity of data in the WTD fordifferent element-organism combinations.
Acknowledgement
This study was partially funded by the project TREE project (NE/L000318/1). (http://www.ceh.ac.uk/tree) (funded by the UK NERC,Environment Agency and RadioactiveWasteManagement Ltd.) and
Please cite this article in press as: Guill�en, J., et al., Transfer parameters foecosystem, Journal of Environmental Radioactivity (2017), http://dx.doi.o
facilitated through the COMET project (Fission-2012-3.4.1-604794)(www.comet-radioecology.org/). We are also grateful to theAutonomous Government of Extremadura (Junta de Extremadura)for the financial support to the LARUEX research group (FQM001),and also to the Consejería de Educaci�on y Empleo of Junta deExtremadura for the mobility grant MOV15B006.
References
Barnett, C.L., Beresford, N.A., Walker, L.A., Baxter, M., Wells, C., Copplestone, D.,2013. Element and radionuclide concentrations in representative species of theICRP's reference animals and plants and associated soils from a forest in north-west England. NERC-Environ Inf. Data Cent. http://dx.doi.org/10.5285/e40b53d4-6699-4557-bd55-10d196ece9ea.
Barnett, C.L., Beresford, N.A., Walker, L.A., Baxter, M., Wells, C., Copplestone, D.,2014. Transfer parameters for ICRP reference animals and plants collected froma forest ecosystem. Radiat. Environ. Biophys. 53, 125e149.
Beresford, N.A., Barnett, C.L., Brown, J., Cheng, J.-J., Copplestone, D., Filistovic, V.,Hosseini, A., Howard, B.J., Jones, S.R., Kamboj, S., Kryshev, A., Nedveckaite, T.,Olyslaegers, G., Sax�en, R., Sazykina, T., Vives i Batlle, J., Vives-Lynch, S.,Yankovich, T., Yu, C., 2008a. Inter-comparison of models to estimate radionu-clide activity concentrations in non-human biota. Radiat. Environ. Biophys. 47,491e514.
Beresford, N.A., Barnett, C.L., Howard, B.J., Scott, W.A., Brown, J.E., Copplestone, D.,2008b. Derivation of transfer parameters for use within the ERICA Tool and thedefault concentration ratios for terrestrial biota. J. Environ. Radioact. 99,1393e1407.
Beresford, N.A., Yankovich, T.L., Wood, M.D., Fesenko, S., Andersson, P., Muikku, M.,Willey, N.J., 2013. A new approach to predicting environmental transfer of ra-dionuclides to wildlife taking account of inter-site variation using ResidualMaximum Likelihood mixed-model regression: a demonstration for freshwaterfish and caesium. Sci. Total Environ. 463e464, 284e292.
Beresford, N.A., Wood, M.D., Vives I Batlle, J., Yankovich, T.L., Bradshaw, C.,Willey, N., 2016. Making the most of what we have: application of extrapolationapproaches in radioecological wildlife transfer models. J. Environ. Radioact. 151,373e386.
BOE, 170, de 14 de julio de 2010. Boletín Oficial del Estado (BOE). Real Decreto 865/2010, de 2 de julio, sobre sustratos de cultivo, Madrid. (in Spanish).
Brown, J.E., Alfonso, B., Avila, R., Beresford, N.A., Copplestone, D., Pr€ohl, G.,Ulanovsky, A., 2008. The ERICA tool. J. Environ. Radioact. 99, 1371e1383.
Brown, J.E., Alfonso, B., Avila, R., Beresford, N.A., Copplestone, D., Hosseini, A., 2016.A new version of the ERICA tool to facilitate impact assessments of radioactivityon wild plants and animals. J. Environ. Radioact. 2016 (153), 141e148.
Copplestone, D., Bielby, S., Jones, S.R., Patton, D., Daniel, P., Gize, I., 2001. ImpactAssessment of Ionising Radiation on Wildlife. R&D Publication 128. Environ-ment Agency, Bristol.
Copplestone, D., Wood, M.D., Bielby, S., Jones, S.R., Vives i Batlle, J., Beresford, N.A.,2003. Habitat Regulations for Stage 3 Assessments: Radioactive SubstancesAuthorisations. R&D Technical Report P3-101/Sp1a. Environment Agency,Bristol.
Copplestone, D.C., Beresford, N.A., Brown, J., Yankovich, T., 2013. An Internationaldatabase of radionuclide concentration ratios for wildlife: development anduses. J. Environ. Radioact. 126, 288e298.
Guill�en, J., Beresford, N.A., Baeza, A., Wood, M.D., Salas, A., Izquierdo, M., Mu~noz-Serrano, A., Young, S., Corrales-V�azquez, J.M., Mu~noz-Mu~noz, J.G., 2016. Sea-sonal variation of concentration ratios ICRP's Reference Animals and Plants interrestrial Mediterranean ecosystems. In: P�oster Presentation at II InternationalConference on Radiological Contentration Processess (50 Years Later), 6th - 9thNovember 2016 (Seville, Spain).
Guill�en, J., Izquierdo, M., Young, S., Barnett, C.L., Wells, C., Beresford, N.A., Baeza, A.,Salas, A., Mu~n�oz-Serrano, A., Corrales-V�azquez, J.M., Mu~noz-Mu~noz, J.G.,Tovar, E., Chaplow, J.S., 2017. Elemental concentrations in representative speciesof the ICRP's Reference Animals and Plants and associated soils in terrestrialMediterranean ecosystems in Spain. NERC Environ. Inf. Data Cent. https://doi.org/10.5285/a1ab8c79-3426-43a4-ab42-6d1b218d1cc6.
Guti�errez, M., Molero, R., Gaju, M., van der Steen, J., Porrini, C., Ruiz, J.A., 2015.Assessment of heavy metal pollution in C�ordoba (Spain) by biomonitoringforaging honeybee. Environ. Monit. Assess. 187, 651.
Hirth, G.A., Johansen, M.P., Carpenter, J.G., Bollh€ofer, A., Beresford, N.A., 2017.Whole-organism concentration ratios in wildlife inhabiting Australian uraniummining environments. J. Environ. Radioact. https://doi.org/10.1016/j.jenvrad.2017.04.007.
Howard, B.J., Beresford, N.A., Copplestone, D., Telleria, D., Proehl, G., Fesenko, S.,Jeffree, R., Yankovich, T., Brown, J., Higley, K., Johansen, M., Mulye, H.,Vandenhove, H., Gashchak, S., Wood, M.D., Takata, H., Andersson, P., Dale, P.,Ryan, J., Bollh€ofer, A., Doering, C., Barnett, C.L., Wells, C., 2013. The IAEAhandbook on radionuclide transfer to wildlife. J. Environ. Radioact. 121, 55e74.
IAEA, 2014. Handbook of Parameter Values for the Prediction of RadionuclideTransfer to Wildlife. Technical Report Series 476. IAEA, Viena.
ICRP, 1997. Recommendations of the International Commission on RadiologicalProtection. ICRP Publication 26. Annals of the ICRP 1(3).
ICRP, 1991. The 1990 Recommendations of the International Commission on
r ICRP's Reference Animals and Plants in a terrestrial Mediterraneanrg/10.1016/j.jenvrad.2017.06.024

J. Guill�en et al. / Journal of Environmental Radioactivity xxx (2017) 1e1414
Radiological Protection. ICRP Publication 60. Annals of the ICRP 21(1e3).ICRP, 2008a. Nuclear Decay Data for Dosimetric Calculations. ICRP Publication 107.
Annals of the ICRP 38(3).ICRP, 2008b. Environmental Protection - the Concept and Use of Reference Animals
and Plants. ICRP Publication 108. Annals of the ICRP 38 (4e6).ICRP, 2009. Environmental protection: transfer parameters for reference animals
and plants. Strand, P., Beresford, N.A., Copplestone, D., Godoy, J., Jianguo, L.,Sax�en, R., Yankovich, T., Brown J. Ann. ICRP Publ. 114 (39), 6.
IGN (Instituto Geogr�afico Nacional), 1994. Mapa Provincial C�aceres 1:200.000.Ministerio de Obras Públicas, Transportes y Medio Ambiente, Madrid.
Johansen, M.P., Barnett, C.L., Beresford, N.A., Brown, J.E., Cerne, M., Howard, B.J.,Kamboj, S., Keum, D.-K., Smodi�s, B., Twining, J.R., Vandenhove, H., Vives iBatlle, J., Wood, M.D., Yu, C., 2012. Assessing doses to terrestrial wildlife at aradioactive waste disposal site: inter-comparison of modelling approaches. Sci.Tot. Environ. 427e428, 238e246.
Kottek, M., Grieser, J., Beck, C., Rudolf, B., Rubel, F., 2006. World map of the K€oppen-Geiger climate classification updated. Meteorol. Z. 15 (3), 259e263.
Please cite this article in press as: Guill�en, J., et al., Transfer parameters foecosystem, Journal of Environmental Radioactivity (2017), http://dx.doi.o
T�oth, G., Hermann, T., Da Silva, M.R., Montanarella, L., 2016. Heavy metals in agri-cultural soils of the European Union with implications for food safety. Environ.Int. 88, 299e309.
USDoE, United States Department of Energy, 2002. A Graded Approach for Evalu-ating Radiation Doses to Aquatic and Terrestrial Biota. DOE-STD-1153e2002.Dept. Energy, Washington, D.C.
van der Steen, J.J.M., de Kraker, J., Grotenhuis, T., 2012. Spatial and temporal vari-ation of metal concentrations in adult honeybees (Apis mellifera L.). Environ.Monit. Assess. 184, 4119e4126.
Wood, M.D., Beresford, N.A., Barnett, C.L., Copplestone, D., Leah, R.T., 2009.Assessing radiation impact at a protected coastal sand dune site: an inter-comparison of models for estimating the radiological exposure of non-humanbiota. J. Environ. Radioact. 100, 1034e1052.
Wood, M.D., Beresford, N.A., Howard, B.J., Copplestone, D., 2013. Evaluating sum-marised radionuclide concentration ratio datasets for wildlife. J. Environ.Radioact. 126, 314e325.
r ICRP's Reference Animals and Plants in a terrestrial Mediterraneanrg/10.1016/j.jenvrad.2017.06.024