~transform and grow~1st quarter financial results fy
TRANSCRIPT

~Transform and Grow~
1st Quarter Financial Results
FY Ending March 2022
August 3, 2021
Mitsui & Co., Ltd.
This material contains statements (including figures) regarding Mitsui & Co., Ltd. (“Mitsui”)’s corporate strategies,
objectives, and views of future developments that are forward-looking in nature and are not simply reiterations of
historical facts. These statements are presented to inform stakeholders of the views of Mitsui’s management but
should not be relied on solely in making investment and other decisions. You should be aware that a number of
known or unknown risks, uncertainties and other factors could lead to outcomes that differ materially from those
presented in such forward-looking statements.
A Cautionary Note on Forward-Looking Statements:
These risks, uncertainties and other factors referred to above include, but are not limited to, those contained in
Mitsui’s latest Annual Securities Report and Quarterly Securities Report, and Mitsui undertakes no obligation to
publicly update or revise any forward-looking statements.

COPYRIGHT © MITSUI & CO., LTD. ALL RIGHTS RESERVED.
Contents
Review of Medium-term Management Plan
Operating Results
Supplementary Information
Segment Data
1
2
3
4
1

COPYRIGHT © MITSUI & CO., LTD. ALL RIGHTS RESERVED.
Review of Medium-term Management Plan
1
2

COPYRIGHT © MITSUI & CO., LTD. ALL RIGHTS RESERVED.3
FY Mar/2021Q1
FY Mar/2022Q1
ChangeFY Mar/2022Business Plan
Progress
Core Operating Cash Flow* 110.8 269.9 +159.1 680.0 40%
Profit for the year/period 62.6 191.3 +128.7 460.0 42%
◼ Achieved significant increase in profit YoY and higher progress against annual planby steadily capturing economic recovery in each business base where we haveglobal strengths
◼ Results driven by strong iron ore business, automobiles, and trading, etc.◼ Upwardly revised yearly forecasts, reflecting strong commodity prices
(Unit: ¥billion)
Summary of Operating Results
* Cash flow from operating activities (FY Mar/2022 Q1: ¥179.3bn) minus cash flow from changes in working capital (FY Mar/2022 Q1: -¥103.9bn)
minus outflows for repayment of lease liability (FY Mar/2022 Q1: ¥13.3bn)
Revised yearly forecasts as follows
◼ Core Operating Cash Flow ¥900.0bn (+¥220.0bn compared to initial plan)
◼ Profit for the year ¥640.0bn (+¥180.0bn compared to initial plan)
◼ Upwardly revised forecasts for Mineral & Metal Resources and Energy segments
Resolved to implement share buyback of up to ¥50.0bn (August to October 2021)
COPYRIGHT © MITSUI & CO., LTD. ALL RIGHTS RESERVED.
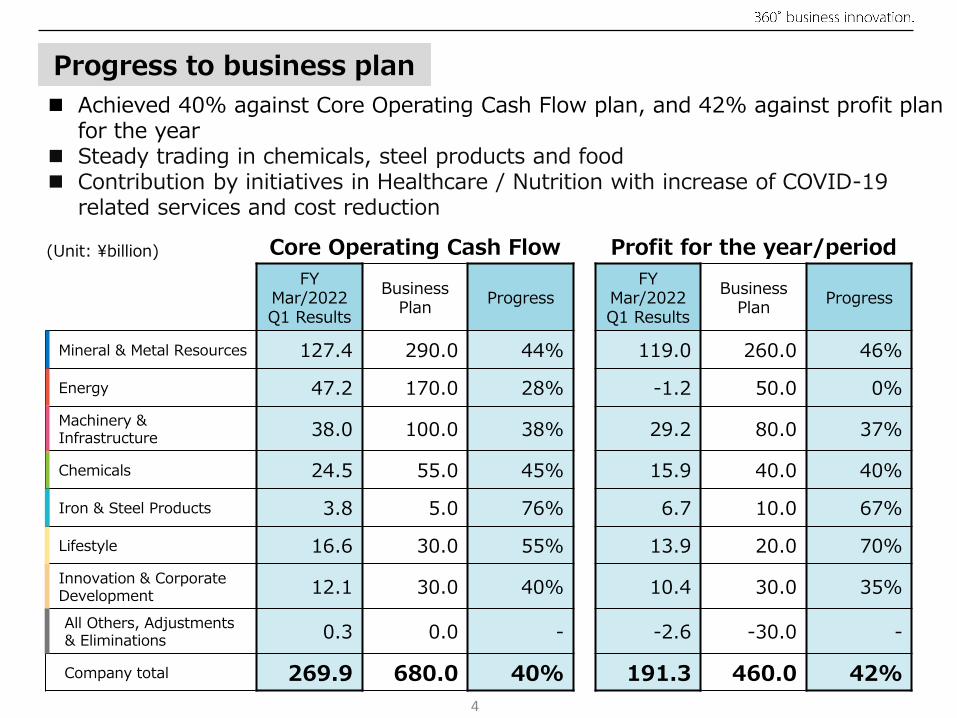
Core Operating Cash Flow Profit for the year/period
FY Mar/2022Q1 Results
Business Plan
ProgressFY
Mar/2022Q1 Results
Business Plan
Progress
Mineral & Metal Resources 127.4 290.0 44% 119.0 260.0 46%
Energy 47.2 170.0 28% -1.2 50.0 0%
Machinery & Infrastructure 38.0 100.0 38% 29.2 80.0 37%
Chemicals 24.5 55.0 45% 15.9 40.0 40%
Iron & Steel Products 3.8 5.0 76% 6.7 10.0 67%
Lifestyle 16.6 30.0 55% 13.9 20.0 70%
Innovation & Corporate Development 12.1 30.0 40% 10.4 30.0 35%
All Others, Adjustments & Eliminations 0.3 0.0 - -2.6 -30.0 -
Company total 269.9 680.0 40% 191.3 460.0 42%
Progress to business plan
◼ Achieved 40% against Core Operating Cash Flow plan, and 42% against profit plan for the year
◼ Steady trading in chemicals, steel products and food ◼ Contribution by initiatives in Healthcare / Nutrition with increase of COVID-19
related services and cost reduction
(Unit: ¥billion)
4

COPYRIGHT © MITSUI & CO., LTD. ALL RIGHTS RESERVED.
Establish strong business base
Capturing global recovery demand
Improving profitability /Strengthening
resilience against downward pressure
Continued measures to improve profitability of existing businesses and to strengthencost competitiveness
Steady advancement of projects✓ Australian Iron Ore / launched South Flank operations, acquired new interest
in Western Ridge✓ Execution of loan agreement for Waitsia gas field
Progress in portfolio reorganization, business restructuring✓ Implementation of sale of Moatize, investment restructuring of Collahuasi✓ Completion of tender offer for Honshu Chemical Industry and consolidation of
European agrochemical company, Belchim
◼ Steady business performance by capturing trends in global economic recoveryfrom COVID-19 downturn
◼ Expansion of stable business clusters by strengthening competitiveness andresilience against downward pressure in existing businesses
Strong commodity prices (iron ore, copper, crude oil) due to increase of demand forindustrial materials, primarily in China
Strong business for automotive and commercial vehicle, primarily in North America Materials-related trading business (chemicals, steel products, food) in response to
surging global demand Contribution by recovery of hospital and healthcare business from COVID-19
downturn and COVID-19-related products and services
5
Progress in Q1

COPYRIGHT © MITSUI & CO., LTD. ALL RIGHTS RESERVED.
6
Amount Main projects
Cash-In
Core Operating Cash Flow 270.0 -
Asset Recycling*1 90.0Mineral & Metal Resources: Loan collection in the copper business
Cash-Out
Investment and Loans*1 -145.0
Lifestyle/Innovation & Corporate Development: Subscription of convertible bonds issued by the holding company of CT Corp*2
Energy: LNG project under development, oil and gas projectsMineral & Metal Resources: Iron ore and coal operations in Australia
Share Buybacks -75.0*3 -
*1: Excludes changes in time deposits
*2: A subscription of convertible bonds issued by PT CT Corpora, the holding company for CT Corp, for ¥67.0 billion (Net amount of ¥100.0 billion for subscription of
convertiable bonds and ¥33.0 billion from redemption of corporate bonds)
*3: Share buybacks of ¥25.0bn in April 2021 and ¥50.0bn in May and June 2021
Results of cash flow allocation, asset recycling, and investment and loans
Cash flow allocation
(Unit: ¥billion)
COPYRIGHT © MITSUI & CO., LTD. ALL RIGHTS RESERVED.
8.7
4.4
0.34.8
4.8
3.2
0.2
8.3
4.6
4.7
3.04.2
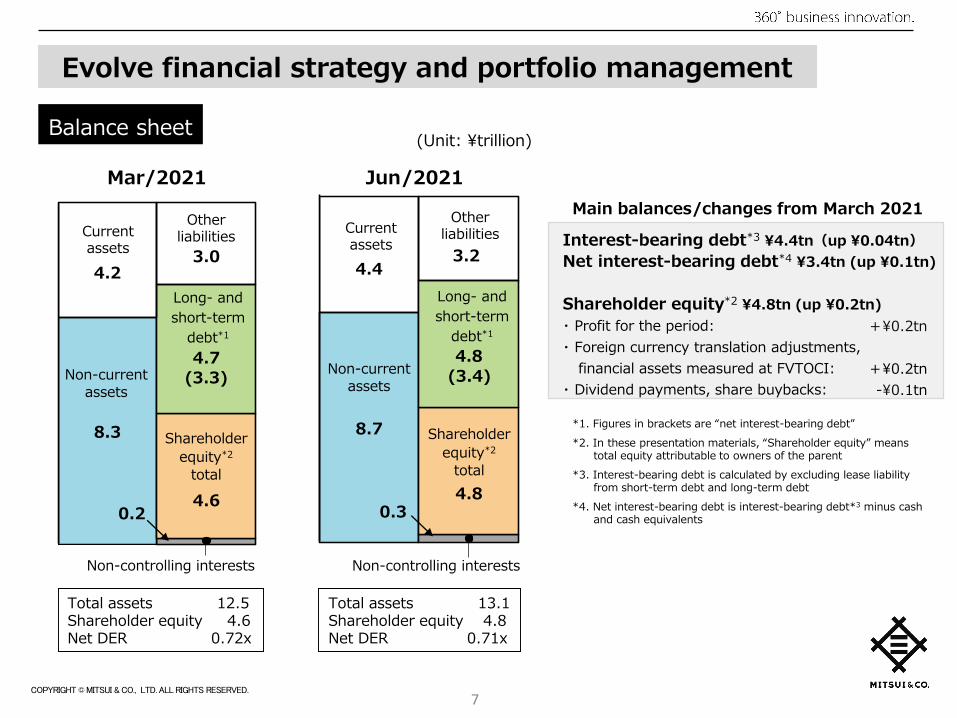
Balance sheet
7
(Unit: ¥trillion)
Current assets
Other liabilities
Long- and
short-term
debt*1
Non-current assets
Shareholder
equity*2
total
Non-controlling interests
Total assets 12.5Shareholder equity 4.6Net DER 0.72x
Jun/2021Mar/2021
(3.3)
Current assets
Other liabilities
Long- and
short-term
debt*1
Shareholder
equity*2
total
Non-controlling interests
Non-current assets
(3.4)
Total assets 13.1Shareholder equity 4.8Net DER 0.71x
Main balances/changes from March 2021
Interest-bearing debt*3 ¥4.4tn(up ¥0.04tn)
Net interest-bearing debt*4 ¥3.4tn (up ¥0.1tn)
Shareholder equity*2 ¥4.8tn (up ¥0.2tn)
・ Profit for the period:
・ Foreign currency translation adjustments,
financial assets measured at FVTOCI:
・ Dividend payments, share buybacks:
+¥0.2tn
+¥0.2tn
-¥0.1tn
*1. Figures in brackets are “net interest-bearing debt”
*2. In these presentation materials, “Shareholder equity” meanstotal equity attributable to owners of the parent
*3. Interest-bearing debt is calculated by excluding lease liabilityfrom short-term debt and long-term debt
*4. Net interest-bearing debt is interest-bearing debt*3 minus cashand cash equivalents
Evolve financial strategy and portfolio management
COPYRIGHT © MITSUI & CO., LTD. ALL RIGHTS RESERVED.
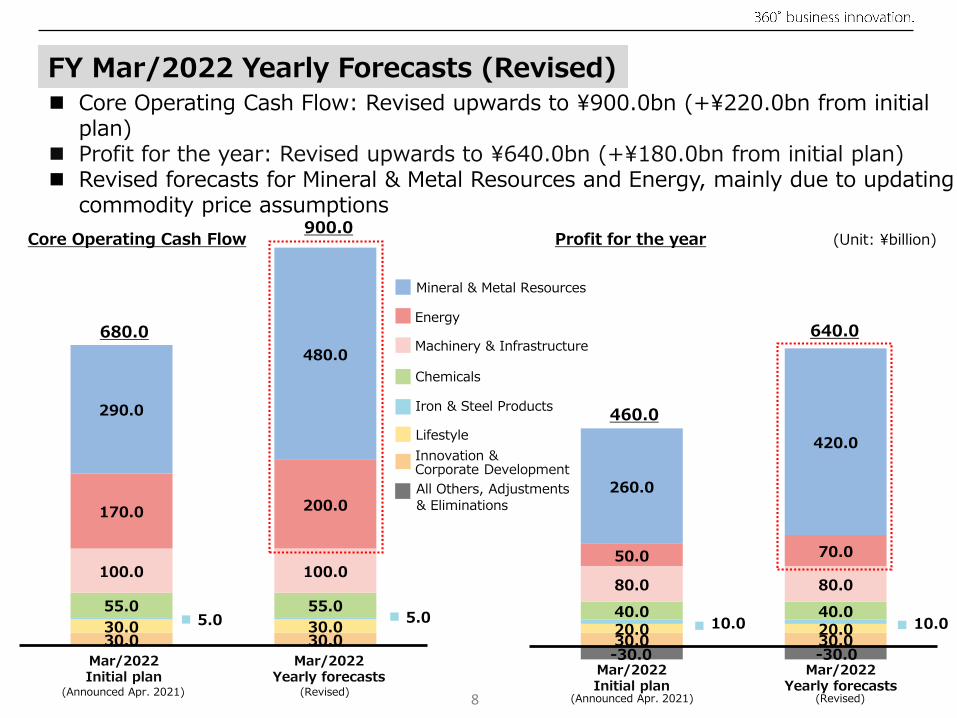
-30.0 -30.030.0 30.020.0 20.010.0 10.040.0 40.0
80.0 80.0
50.0 70.0
260.0
420.0
30.0 30.030.0 30.05.0 5.055.0 55.0
100.0 100.0
170.0 200.0
290.0
480.0
680.0
900.0
8
460.0
640.0
Chemicals
All Others, Adjustments & Eliminations
Machinery & Infrastructure
Lifestyle
Mineral & Metal Resources
Energy
Innovation & Corporate Development
Iron & Steel Products
Core Operating Cash Flow Profit for the year (Unit: ¥billion)
◼ Core Operating Cash Flow: Revised upwards to ¥900.0bn (+¥220.0bn from initialplan)
◼ Profit for the year: Revised upwards to ¥640.0bn (+¥180.0bn from initial plan)◼ Revised forecasts for Mineral & Metal Resources and Energy, mainly due to updating
commodity price assumptions
FY Mar/2022 Yearly Forecasts (Revised)
Mar/2022Initial plan
(Announced Apr. 2021)
Mar/2022Yearly forecasts
(Revised)
Mar/2022Initial plan
(Announced Apr. 2021)
Mar/2022Yearly forecasts
(Revised)

COPYRIGHT © MITSUI & CO., LTD. ALL RIGHTS RESERVED.
Operating Results2
9
COPYRIGHT © MITSUI & CO., LTD. ALL RIGHTS RESERVED.
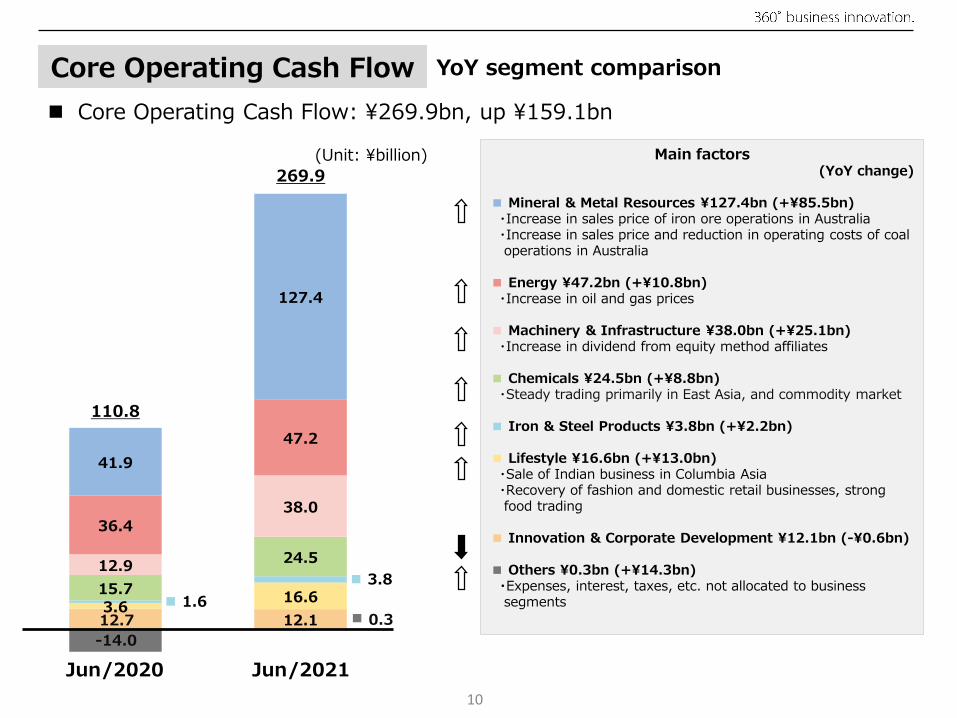
-14.0
0.312.7 12.13.6
16.61.6
3.815.7
24.512.9
38.0
36.4
47.2
41.9
127.4
YoY segment comparisonCore Operating Cash Flow
Main factors(YoY change)
■ Mineral & Metal Resources ¥127.4bn (+¥85.5bn)・Increase in sales price of iron ore operations in Australia・Increase in sales price and reduction in operating costs of coal operations in Australia
■ Energy ¥47.2bn (+¥10.8bn)・Increase in oil and gas prices
■ Machinery & Infrastructure ¥38.0bn (+¥25.1bn)・Increase in dividend from equity method affiliates
■ Chemicals ¥24.5bn (+¥8.8bn)・Steady trading primarily in East Asia, and commodity market
■ Iron & Steel Products ¥3.8bn (+¥2.2bn)
■ Lifestyle ¥16.6bn (+¥13.0bn)・Sale of Indian business in Columbia Asia・Recovery of fashion and domestic retail businesses, strong food trading
■ Innovation & Corporate Development ¥12.1bn (-¥0.6bn)
■ Others ¥0.3bn (+¥14.3bn)・Expenses, interest, taxes, etc. not allocated to businesssegments
110.8
◼ Core Operating Cash Flow: ¥269.9bn, up ¥159.1bn
(Unit: ¥billion)
10
269.9
Jun/2021Jun/2020
COPYRIGHT © MITSUI & CO., LTD. ALL RIGHTS RESERVED.
-1.5 -2.6
10.5 10.4
-5.6
13.9
-1.3
6.7
6.3
15.9
18.5
29.2
3.5
-1.2
32.2
119.0
Main factors(YoY change)
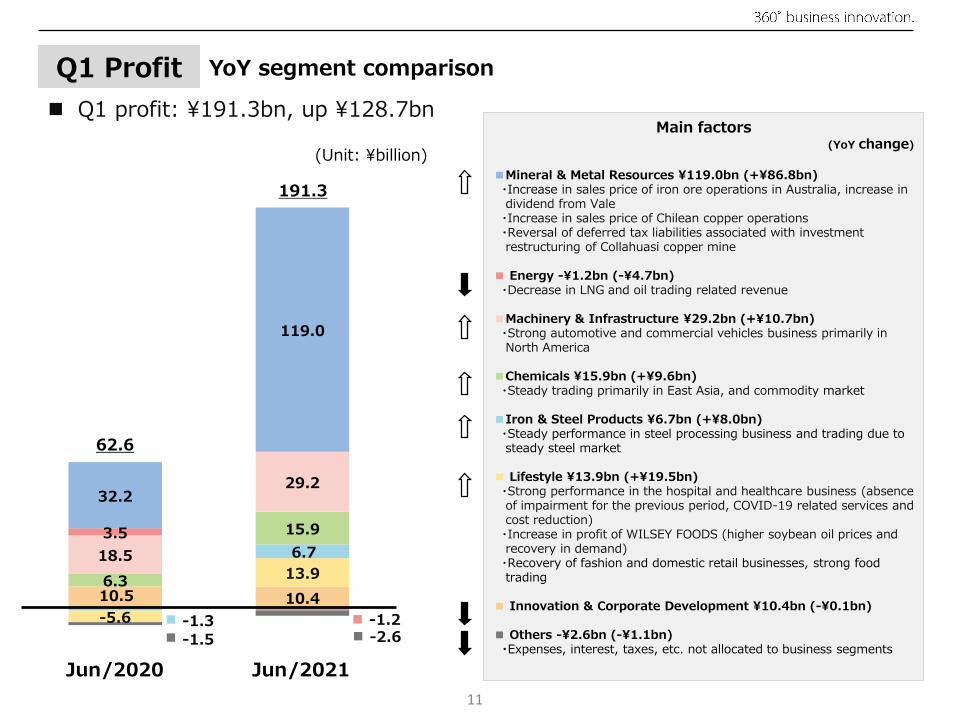
■Mineral & Metal Resources ¥119.0bn (+¥86.8bn)・Increase in sales price of iron ore operations in Australia, increase individend from Vale・Increase in sales price of Chilean copper operations・Reversal of deferred tax liabilities associated with investmentrestructuring of Collahuasi copper mine
■ Energy -¥1.2bn (-¥4.7bn)・Decrease in LNG and oil trading related revenue
■Machinery & Infrastructure ¥29.2bn (+¥10.7bn)・Strong automotive and commercial vehicles business primarily inNorth America
■Chemicals ¥15.9bn (+¥9.6bn)・Steady trading primarily in East Asia, and commodity market
■Iron & Steel Products ¥6.7bn (+¥8.0bn)・Steady performance in steel processing business and trading due tosteady steel market
■ Lifestyle ¥13.9bn (+¥19.5bn)・Strong performance in the hospital and healthcare business (absenceof impairment for the previous period, COVID-19 related services andcost reduction)・Increase in profit of WILSEY FOODS (higher soybean oil prices andrecovery in demand)・Recovery of fashion and domestic retail businesses, strong foodtrading
■ Innovation & Corporate Development ¥10.4bn (-¥0.1bn)
■ Others -¥2.6bn (-¥1.1bn)・Expenses, interest, taxes, etc. not allocated to business segments
YoY segment comparisonQ1 Profit
Jun/2021
◼ Q1 profit: ¥191.3bn, up ¥128.7bn
62.6
Jun/2020
11
191.3
(Unit: ¥billion)

COPYRIGHT © MITSUI & CO., LTD. ALL RIGHTS RESERVED.
YoY factor comparison
Resource-relatedcosts/volume
Commodityprices/Forex
Base profitValuationgain/loss
Asset recycling
(Unit: ¥billion)
Jun/2020
62.6
Asset recycling
Commodity prices/Forex
Resource-related
costs/volumeBase profit
+9.0
-3.0
+61.0
+65.0
Valuation gain/loss
special factors
Jun/2021
191.3
-3.0
12
<Positive factors>・Iron ore dividend・Machinery &
Infrastructure・Lifestyle・Chemicals・Iron & Steel
ProductsEtc.
<Negative factors>・Energy
Etc.
・CostsMin. & Metal
Iron oreCoalCopper, other
Energy
・VolumeMin. & Metal
Iron oreCoalCopper, other
Energy
0.0-3.0-4.0
+1.00.0
+3.0
-3.0-2.0-2.00.00.0
-1.0
・Min. & MetalIron oreCoalCopper, other
・Oil, gas
・Forex
+57.0+48.0+2.0+7.0
+5.0
-1.0
・Absence of factors from previous Q1
・Total currentperiod
・Absence of factorsfrom previous Q1
・Total currentperiod
+7.0
+2.0
-5.0
+2.0
Forex breakdown
・Min. & Metal Resources :
・Energy :
・Other :
-1.0
-2.0
2.0
Yen vs. Functional Currency
Functional Currency vs. Revenue Currencies
12.0
0.0
2.0
-13.0
-2.0
0.0
Q1 Profit
+16.0+16.0+12.0
+8.0
-9.0
(Yen vs. Functionalcurrency
(Functional currency vs. revenue currencies
+14.0)
-15.0)

COPYRIGHT © MITSUI & CO., LTD. ALL RIGHTS RESERVED.
Supplementary Information3
13

COPYRIGHT © MITSUI & CO., LTD. ALL RIGHTS RESERVED.
(*1) As the crude oil price affects our consolidated results with a 0-6 month time lag, the effect of crude oil prices on consolidated results is estimated as the Consolidated oil price, which reflects this lag. For the year ending March 2022, we have assumed that there is a 4-6 month lag for approx. 35%, a 1-3 month lag for approx. 60%, and no lag for approx. 5%. The above sensitivities show the annual impact of changes in the consolidated oil price.
(*2) U.S. gas results figures for the year ended March 2021 and the year ending March 2022 1Q are the Henry Hub Natural Gas Futures average daily prompt month closing prices traded on NYMEX during January to December 2020 and January to March 2021 respectively.
(*3) As Mitsui has very limited exposure to U.S. natural gas sold at Henry Hub (HH), the above sensitivities show the annual impact of changes in the weighted average sale price.
(*4) Iron ore results figures for the year ended March 2021 and the year ending March 2022 1Q are the daily average (reference price) spot indicated price (Fe 62% CFR North China) recorded in several industry trade magazines from April 2020 to March 2021 and from April to June 2021 respectively.
(*5) The effect of dividend income from Vale has not been included.
(*6) Iron ore and coal price assumptions are not disclosed.
(*7) Coal results figures for the year ended March 2021 and for the year ending March 2022 1Q are the quarterly average prices of representative coal brands in Japan (US$/MT).
(*8) Copper results figures for the year ended March 2021 and the year ending March 2022 1Q are the averages of the LME monthly average cash settlement prices for the period from January to December 2020 and from January to March 2021 respectively.
(*9) As the copper price affects our consolidated results with a 3-month time lag, the above sensitivities show the annual impact of US$100/ton change in averages of the LME monthly average cash settlement prices for the period from March to December 2021.
(*10) The above sensitivities show the impact of currency fluctuations on reported profit for the year of overseas subsidiaries and equity accounted investees denominated intheir respective functional currencies and the impact of dividends received from major foreign investees. Depreciation of the yen has the effect of increasing profit forthe year through the conversion of profit (denominated in functional currencies) into yen. In the overseas subsidiaries and equity accounted investees where the salescontract is in USD, the impact of currency fluctuations between USD and the functional currencies (AUD and BRL) and the impact of currency hedging are not included.
FY Mar/2021 Full year (Results)
Effects of price changes on profits for FY Mar/2022(Announced April 2021)
FY Mar/2022 Full year
(Announced April 2021)
43
Comm-odities
Crude oil/JCC ― 61
46 Consolidated oil price (*1) ¥2.5 bn (US$1/barrel) 59
2.13(*2) U.S. gas (*3) ¥1.1 bn (US$0.1/mmBtu) 2.74
128(*4) Iron ore (*5) ¥2.2 bn (US$1/ton) (*6)
119(*7)Coal
Coking ¥0.4 bn (US$1/ton) (*6)
69(*7) Thermal ¥0.1 bn (US$1/ton) (*6)
6,169(*8) Copper(*9) ¥0.7 bn (US$100/ton) 7,650
105.94
Forex(*10)
USD ¥2.6 bn (¥1/US$) 105.00
76.71 AUD ¥2.4 bn (¥1/Australian$) 80.00
19.46 BRL ¥0.2 bn (¥1/Brazilian real) 19.00
FY Mar/2022 1Q
(Results)
67
56
2.73(*2)
199(*4)
117(*7)
110(*7)
8,479(*8)
109.76
84.15
21.24
Assumptions and Sensitivities
14
COPYRIGHT © MITSUI & CO., LTD. ALL RIGHTS RESERVED.
ProductionFY Mar/2021 FY Mar/2022
Q1 Q2 Q3 Q4 Total Q1
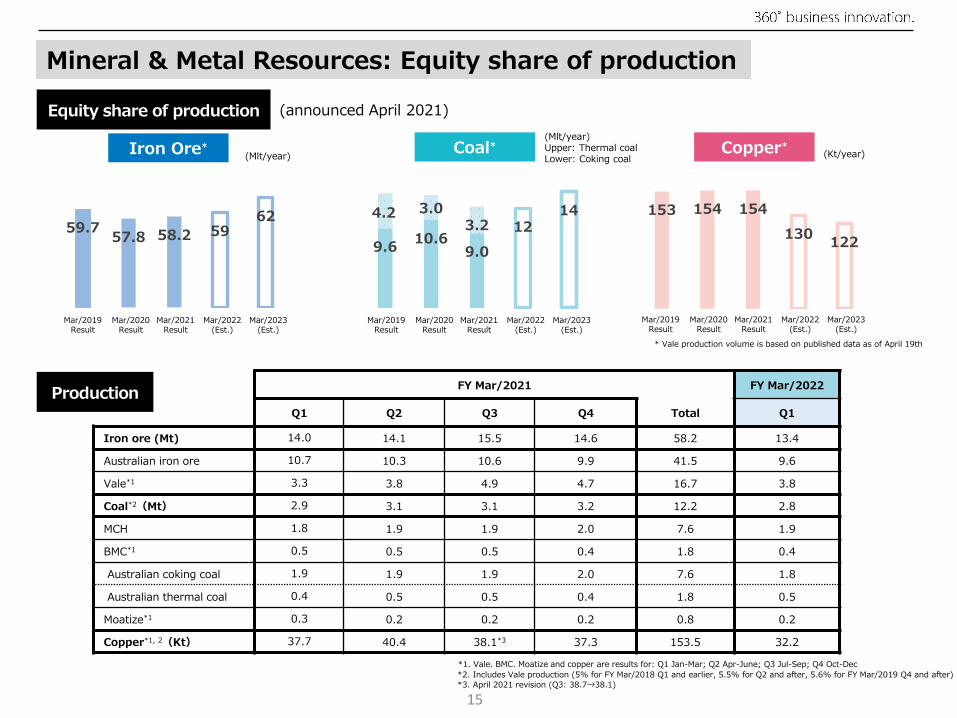
Iron ore (Mt) 14.0 14.1 15.5 14.6 58.2 13.4
Australian iron ore 10.7 10.3 10.6 9.9 41.5 9.6
Vale*1 3.3 3.8 4.9 4.7 16.7 3.8
Coal*2(Mt) 2.9 3.1 3.1 3.2 12.2 2.8
MCH 1.8 1.9 1.9 2.0 7.6 1.9
BMC*1 0.5 0.5 0.5 0.4 1.8 0.4
Australian coking coal 1.9 1.9 1.9 2.0 7.6 1.8
Australian thermal coal 0.4 0.5 0.5 0.4 1.8 0.5
Moatize*1 0.3 0.2 0.2 0.2 0.8 0.2
Copper*1, 2(Kt) 37.7 40.4 38.1*3 37.3 153.5 32.2
Mineral & Metal Resources: Equity share of production
15
Equity share of production (announced April 2021)
153 154 154
1301229.6
10.69.0
12144.2 3.0
3.2
Iron Ore*(Mlt/year)
Coal* Copper*(Kt/year)
59.757.8 58.2 59
62
(Mlt/year)Upper: Thermal coalLower: Coking coal
* Vale production volume is based on published data as of April 19th
Mar/2020Result
Mar/2021Result
Mar/2022(Est.)
Mar/2023(Est.)
Mar/2019Result
Mar/2020Result
Mar/2021Result
Mar/2022(Est.)
Mar/2023(Est.)
Mar/2019Result
Mar/2020Result
Mar/2021Result
Mar/2022(Est.)
Mar/2023(Est.)
Mar/2019Result
*1. Vale、BMC、Moatize and copper are results for: Q1 Jan-Mar; Q2 Apr-June; Q3 Jul-Sep; Q4 Oct-Dec
*2. Includes Vale production (5% for FY Mar/2018 Q1 and earlier, 5.5% for Q2 and after, 5.6% for FY Mar/2019 Q4 and after)
*3. April 2021 revision (Q3: 38.7→38.1)
COPYRIGHT © MITSUI & CO., LTD. ALL RIGHTS RESERVED.
16
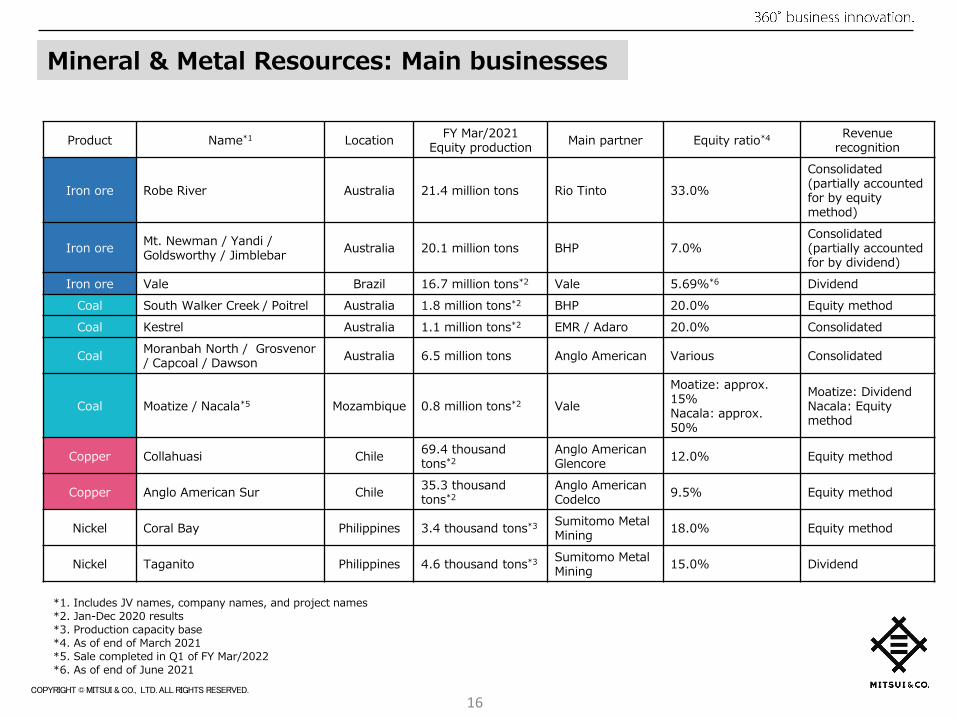
Mineral & Metal Resources: Main businesses
Product Name*1 LocationFY Mar/2021
Equity productionMain partner Equity ratio*4 Revenue
recognition
Iron ore Robe River Australia 21.4 million tons Rio Tinto 33.0%
Consolidated (partially accounted for by equity method)
Iron oreMt. Newman / Yandi / Goldsworthy / Jimblebar
Australia 20.1 million tons BHP 7.0%Consolidated (partially accounted for by dividend)
Iron ore Vale Brazil 16.7 million tons*2 Vale 5.69%*6 Dividend
Coal South Walker Creek / Poitrel Australia 1.8 million tons*2 BHP 20.0% Equity method
Coal Kestrel Australia 1.1 million tons*2 EMR / Adaro 20.0% Consolidated
CoalMoranbah North / Grosvenor/ Capcoal / Dawson
Australia 6.5 million tons Anglo American Various Consolidated
Coal Moatize / Nacala*5 Mozambique 0.8 million tons*2 Vale
Moatize: approx. 15%Nacala: approx. 50%
Moatize: Dividend Nacala: Equity method
Copper Collahuasi Chile69.4 thousandtons*2
Anglo AmericanGlencore
12.0% Equity method
Copper Anglo American Sur Chile35.3 thousandtons*2
Anglo AmericanCodelco
9.5% Equity method
Nickel Coral Bay Philippines 3.4 thousand tons*3 Sumitomo Metal Mining
18.0% Equity method
Nickel Taganito Philippines 4.6 thousand tons*3 Sumitomo Metal Mining
15.0% Dividend
*1. Includes JV names, company names, and project names
*2. Jan-Dec 2020 results
*3. Production capacity base
*4. As of end of March 2021
*5. Sale completed in Q1 of FY Mar/2022
*6. As of end of June 2021

COPYRIGHT © MITSUI & CO., LTD. ALL RIGHTS RESERVED.
71 67 6877 72
83
173 185 189 169 173 139
244 252 257 246 245
(100m barrels)(KBOE/day)
(announced August 2021*4)
Energy: Crude oil & gas – Equity share of production & reserves
*1. Oil equivalentMitsui’s equity share of interests of consolidated subsidiaries, affiliates, and general investments
*2. Mitsui’s share of sales is applied to certain projects
*3. According to Mitsui’s assessment standards
*4. Updates to Mar/2021 numbers only
2.9 2.8 2.8
6.6 6.0
9.9
9.52228.8
17
12.7
Gas
Crude Oil
Gas
Crude Oil
(announced October 2020)Production*1*2 Reserves*1*3
Mar/2018 Result
Mar/2019 Result
Mar/2020 Result
Mar/2021 Result
Mar/2022 (Est.)
Mar/2023 (Est.)
Mar/2018 Result
Mar/2019 Result
Mar/2020 Result
COPYRIGHT © MITSUI & CO., LTD. ALL RIGHTS RESERVED.
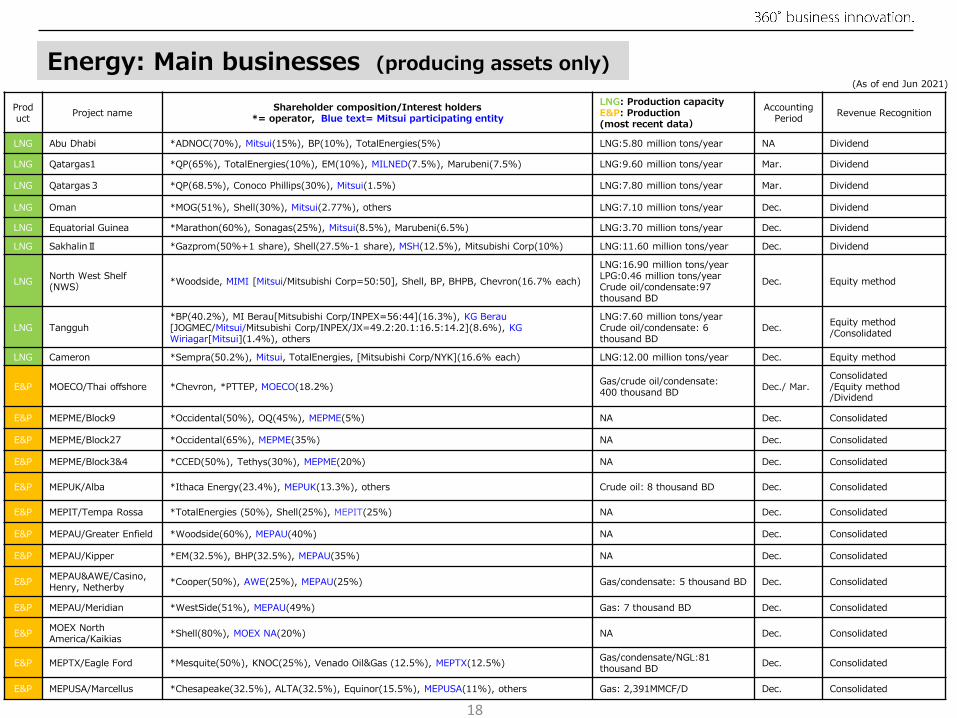
Energy: Main businesses (producing assets only)
18
Product
Project nameShareholder composition/Interest holders
*= operator, Blue text= Mitsui participating entity
LNG: Production capacityE&P: Production (most recent data)
Accounting Period
Revenue Recognition
LNG Abu Dhabi *ADNOC(70%), Mitsui(15%), BP(10%), TotalEnergies(5%) LNG:5.80 million tons/year NA Dividend
LNG Qatargas1 *QP(65%), TotalEnergies(10%), EM(10%), MILNED(7.5%), Marubeni(7.5%) LNG:9.60 million tons/year Mar. Dividend
LNG Qatargas3 *QP(68.5%), Conoco Phillips(30%), Mitsui(1.5%) LNG:7.80 million tons/year Mar. Dividend
LNG Oman *MOG(51%), Shell(30%), Mitsui(2.77%), others LNG:7.10 million tons/year Dec. Dividend
LNG Equatorial Guinea *Marathon(60%), Sonagas(25%), Mitsui(8.5%), Marubeni(6.5%) LNG:3.70 million tons/year Dec. Dividend
LNG SakhalinⅡ *Gazprom(50%+1 share), Shell(27.5%-1 share), MSH(12.5%), Mitsubishi Corp(10%) LNG:11.60 million tons/year Dec. Dividend
LNGNorth West Shelf(NWS)
*Woodside, MIMI [Mitsui/Mitsubishi Corp=50:50], Shell, BP, BHPB, Chevron(16.7% each)
LNG:16.90 million tons/yearLPG:0.46 million tons/yearCrude oil/condensate:97thousand BD
Dec. Equity method
LNG Tangguh*BP(40.2%), MI Berau[Mitsubishi Corp/INPEX=56:44](16.3%), KG Berau [JOGMEC/Mitsui/Mitsubishi Corp/INPEX/JX=49.2:20.1:16.5:14.2](8.6%), KG Wiriagar[Mitsui](1.4%), others
LNG:7.60 million tons/yearCrude oil/condensate: 6thousand BD
Dec.Equity method/Consolidated
LNG Cameron *Sempra(50.2%), Mitsui, TotalEnergies, [Mitsubishi Corp/NYK](16.6% each) LNG:12.00 million tons/year Dec. Equity method
E&P MOECO/Thai offshore *Chevron, *PTTEP, MOECO(18.2%)Gas/crude oil/condensate:400 thousand BD
Dec./ Mar.Consolidated/Equity method/Dividend
E&P MEPME/Block9 *Occidental(50%), OQ(45%), MEPME(5%) NA Dec. Consolidated
E&P MEPME/Block27 *Occidental(65%), MEPME(35%) NA Dec. Consolidated
E&P MEPME/Block3&4 *CCED(50%), Tethys(30%), MEPME(20%) NA Dec. Consolidated
E&P MEPUK/Alba *Ithaca Energy(23.4%), MEPUK(13.3%), others Crude oil: 8 thousand BD Dec. Consolidated
E&P MEPIT/Tempa Rossa *TotalEnergies (50%), Shell(25%), MEPIT(25%) NA Dec. Consolidated
E&P MEPAU/Greater Enfield *Woodside(60%), MEPAU(40%) NA Dec. Consolidated
E&P MEPAU/Kipper *EM(32.5%), BHP(32.5%), MEPAU(35%) NA Dec. Consolidated
E&PMEPAU&AWE/Casino, Henry, Netherby
*Cooper(50%), AWE(25%), MEPAU(25%) Gas/condensate: 5 thousand BD Dec. Consolidated
E&P MEPAU/Meridian *WestSide(51%), MEPAU(49%) Gas: 7 thousand BD Dec. Consolidated
E&PMOEX North America/Kaikias
*Shell(80%), MOEX NA(20%) NA Dec. Consolidated
E&P MEPTX/Eagle Ford *Mesquite(50%), KNOC(25%), Venado Oil&Gas (12.5%), MEPTX(12.5%)Gas/condensate/NGL:81 thousand BD
Dec. Consolidated
E&P MEPUSA/Marcellus *Chesapeake(32.5%), ALTA(32.5%), Equinor(15.5%), MEPUSA(11%), others Gas: 2,391MMCF/D Dec. Consolidated
(As of end Jun 2021)
COPYRIGHT © MITSUI & CO., LTD. ALL RIGHTS RESERVED.
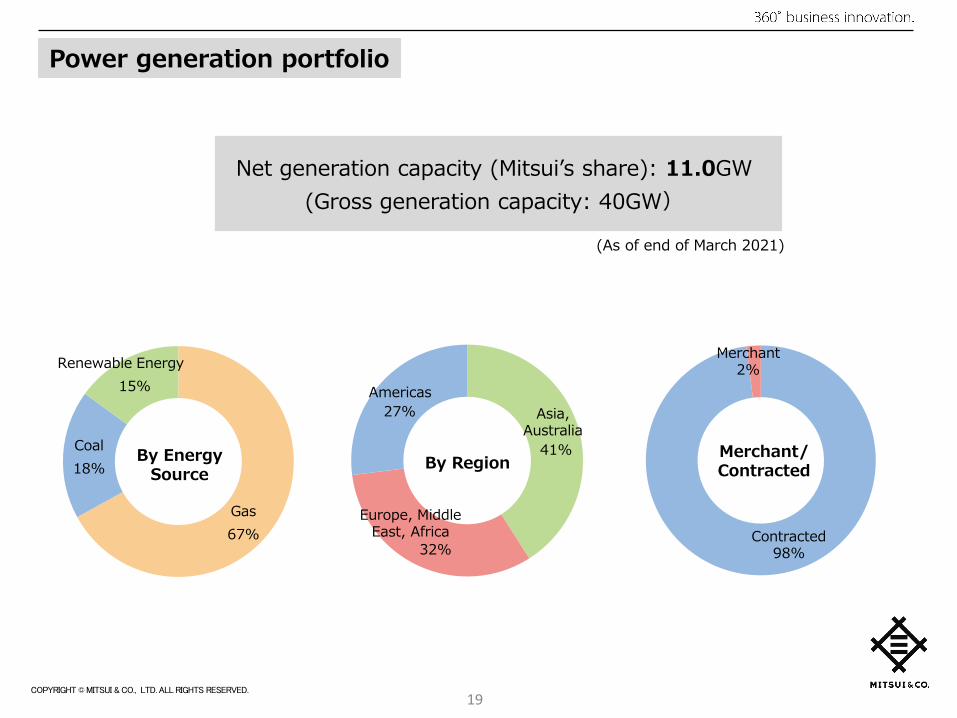
Power generation portfolio
Gas
67%
Coal
18%
Renewable Energy
15%
Net generation capacity (Mitsui’s share): 11.0GW
(Gross generation capacity: 40GW)
41%
32%
27%
Americas
Asia, Australia
By Region
Europe, Middle East, Africa
Merchant/Contracted
Contracted98%
Merchant2%
(As of end of March 2021)
By Energy Source
19

COPYRIGHT © MITSUI & CO., LTD. ALL RIGHTS RESERVED.
FY Mar/2021 Q1 Q2 Q3 Q4 Full year
Mineral & Metal Resources
Moatize/Nacala impairment -4.1 -15.6 -39.1 -58.9
Others -1.7 -2.9 -0.3 -4.9
Total -4.1 -17.3 -42.0 -0.3 -63.7
Energy
DTA from U.S. subsidiary restructuring 39.0 39.0
MEPIT/Tempa Rossaimpairment -23.4 5.9 -17.5
MEPAU impairment etc. -11.5 -11.5
Others -1.2 -1.0 0.0 -1.3 -3.5
Total -1.2 -1.0 15.6 -6.9 6.5
Machinery & Infrastructure
IPP related MtM -0.4 -0.7 0.7 0.4 0.0
Rolling stock lease business impairment -4.9 -4.2 0.2 -8.9
Moatize/Nacala impairment -1.0 -3.9 -9.8 -14.7
UK passenger transportation business losses -11.0 -11.0
Others -0.5 -3.1 -3.9 -7.5
Total -1.4 -10.0 -16.4 -14.3 -42.1
Chemicals
Others 1.9 0.6 6.0 0.8 9.3
Total 1.9 0.6 6.0 0.8 9.3
Iron & Steel Products
Others 0.2 -0.1 0.2 0.3
Total 0.0 0.2 -0.1 0.2 0.3
Lifestyle
IHH ops in India: goodwill impairment -2.5 -2.5
Fashion business/valuation loss, DTA reversal -1.4 -1.4
Others 0.8 -0.8 2.7 2.7
Total -1.7 0.0 -0.8 1.3 -1.2
Innovation & Corporate Development
Reversal of impairment loss on land 4.3 4.3
Reversal of land-holding related tax liabilities 1.9 1.9
Others -1.2 -1.2
Total 0.0 0.0 5.0 0.0 5.0
20
Breakdown of Valuation gain/loss special factorsFY Mar/2022 Q1 Q2 Q3 Q4 Full year
Mineral & Metal Resources
Collahuasi restructuring 6.2 6.2
Others -0.5 -0.5
Total 5.7 5.7
Energy
Others -3.2 -3.2
Total -3.2 -3.2
Machinery & Infrastructure
IPP related MtM -0.4 -0.4
Others -0.2 -0.2
Total -0.6 -0.6
Chemicals
Others
Total 0.0 0.0
Iron & Steel Products
Others
Total 0.0 0.0
Lifestyle
Others 0.2 0.2
Total 0.2 0.2
Innovation & Corporate Development
Others -1.3 -1.3
Total -1.3 -1.3
(Unit: ¥billion)
COPYRIGHT © MITSUI & CO., LTD. ALL RIGHTS RESERVED.
Segment Data4
21

COPYRIGHT © MITSUI & CO., LTD. ALL RIGHTS RESERVED.
41.9
127.455.3
108.0
102.9
352.6
■Q1 ■Q2 ■Q3 ■Q4 Forecast
FY Mar/21
Q1
FY Mar/22
Q1Change Contributing factors
Revised FY Mar/22 yearly
forecastsProgress*2 FY Mar/22
initial planFY
Mar/21
Core operating CF 41.9 127.4 +85.5↑Iron ore in Australia (increase in
sales price)480.0 27% 290.0 308.1
Q1 profit(Valuation gain/loss
special factors)
32.2(-4.1)
119.0(5.7)
+86.8(+9.8)
420.0 28% 260.0179.9
(-63.7)
Gross profit 50.3 106.8 +56.5 ↑Iron ore in Australia (increase in sales price) 251.2
Profit (Loss) from equity investments
13.4 31.8 +18.4↑Iron ore in Australia (increase in sales price)↑Collahuasi copper mine(increase in sales price)
70.4
Dividend income 2.5 21.7 +19.2 ↑Vale, Iron ore in Australia (increased dividend) 59.8
Selling, general and administrative expenses
-10.4 -7.4 +3.0 -72.3
Others -23.6 -33.9 -10.3 -129.2
Total assets 2,684.8 +118.3*1 2,566.5
32.2
119.039.15.6
103.0
301.0
■Q1 ■Q2 ■Q3 ■Q4 Forecast
Quarterly trends
Results
Mineral & Metal Resources
Results of main affiliated companies
179.9
420.0
*1. Change since the end of FY Mar/21*2. Progress against the revised full-year earnings forecast*3. A portion of profit/loss was accounted for by the equity method*4. Sold in FY Mar/22 Q1
Company nameFY Mar/21
Q1FY Mar/22
Q1Change FY Mar/21
Consolid
ate
d
Iron ore operations in Australia*3 41.1 92.0 +50.9 224.2
Coal operations in Australia*3 -2.0 0.7 +2.7 -5.8
Equity
-meth
od
Moatize coal business and infrastructure projects*4 -6.7 - +6.7 -77.9
Oriente Copper Netherlands -1.2 2.5 +3.7 -1.5
Japan Collahuasi Resources 2.1 12.2 +10.1 14.7
Inner Mongolia Erdos Electric Power & Metallurgical
0.8 2.3 +1.5 7.4
Profit for the year
308.1
480.0
22
COCF, PAT revised upwards mainly due to strong iron ore prices
Main investments and recycling(IN) Loan collection in the copper business
+57.6(OUT) Iron ore operations in Australia -13.1
Coal operations in Australia
-67.1
-17.1 -18.8
16.8 3.2
60.6
FY Mar/2021
FY Mar/2021
Q1
FY Mar/2022
Q1
■IN■OUT
FY Mar/2021
FY Mar/2022
FY Mar/2021
FY Mar/2022
(Unit: billion yen)Investment CF
Core operating CF
COPYRIGHT © MITSUI & CO., LTD. ALL RIGHTS RESERVED.
FY Mar/21
Q1
FY Mar/22
Q1Change Contributing factors
Revised FY Mar/22 yearly
forecastsProgress*2 FY Mar/22
initial planFY
Mar/21
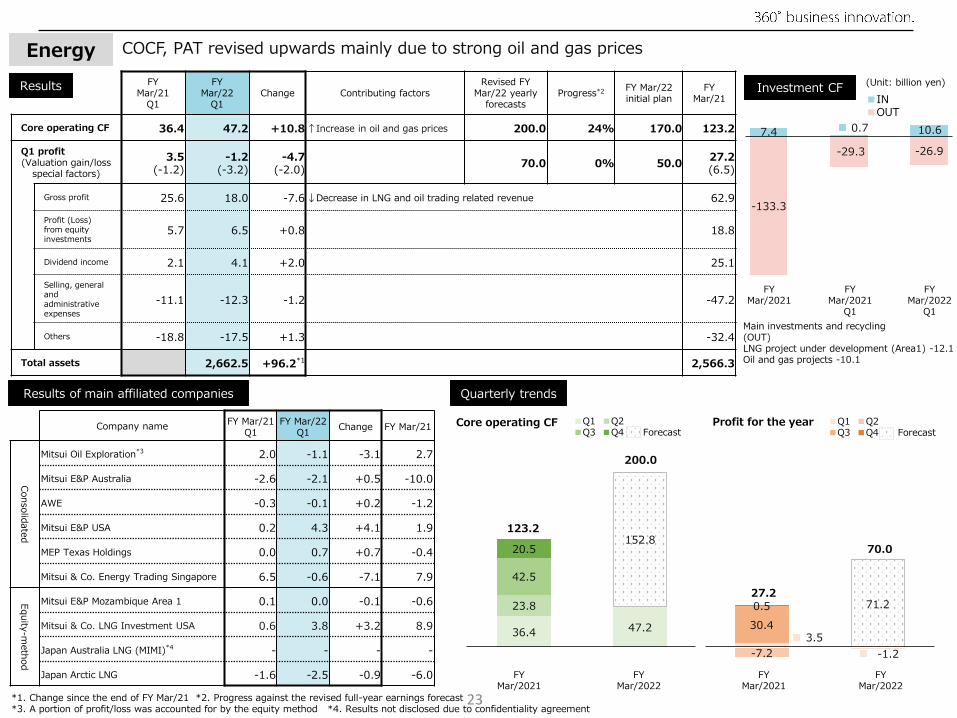
Core operating CF 36.4 47.2 +10.8 ↑Increase in oil and gas prices 200.0 24% 170.0 123.2
Q1 profit(Valuation gain/loss
special factors)
3.5(-1.2)
-1.2(-3.2)
-4.7(-2.0)
70.0 0% 50.027.2(6.5)
Gross profit 25.6 18.0 -7.6 ↓Decrease in LNG and oil trading related revenue 62.9
Profit (Loss) from equity investments
5.7 6.5 +0.8 18.8
Dividend income 2.1 4.1 +2.0 25.1
Selling, general and administrative expenses
-11.1 -12.3 -1.2 -47.2
Others -18.8 -17.5 +1.3 -32.4
Total assets 2,662.5 +96.2*1 2,566.3
36.4 47.2
23.8
42.5
20.5152.8
Main investments and recycling(OUT) LNG project under development (Area1) -12.1Oil and gas projects -10.1
3.5
-1.2-7.2
30.4
0.5 71.2
-133.3
-29.3 -26.9
7.4 0.7 10.6
27.2
123.2
200.0
Company nameFY Mar/21
Q1FY Mar/22
Q1Change FY Mar/21
Consolid
ate
d
Mitsui Oil Exploration*3 2.0 -1.1 -3.1 2.7
Mitsui E&P Australia -2.6 -2.1 +0.5 -10.0
AWE -0.3 -0.1 +0.2 -1.2
Mitsui E&P USA 0.2 4.3 +4.1 1.9
MEP Texas Holdings 0.0 0.7 +0.7 -0.4
Mitsui & Co. Energy Trading Singapore 6.5 -0.6 -7.1 7.9
Equity
-meth
od
Mitsui E&P Mozambique Area 1 0.1 0.0 -0.1 -0.6
Mitsui & Co. LNG Investment USA 0.6 3.8 +3.2 8.9
Japan Australia LNG (MIMI)*4 - - - -
Japan Arctic LNG -1.6 -2.5 -0.9 -6.0
*1. Change since the end of FY Mar/21 *2. Progress against the revised full-year earnings forecast *3. A portion of profit/loss was accounted for by the equity method *4. Results not disclosed due to confidentiality agreement
FY Mar/2021
FY Mar/2021
Q1
FY Mar/2022
Q1
FY Mar/2021
FY Mar/2022
FY Mar/2021
FY Mar/2022
70.0
COCF, PAT revised upwards mainly due to strong oil and gas prices
23
Energy
Quarterly trends
Results
Results of main affiliated companies
■IN■OUT
(Unit: billion yen)Investment CF
■Q1 ■Q2 ■Q3 ■Q4 Forecast
■Q1 ■Q2 ■Q3 ■Q4 Forecast
Profit for the yearCore operating CF

COPYRIGHT © MITSUI & CO., LTD. ALL RIGHTS RESERVED.
FY Mar/21
Q1
FY Mar/22
Q1Change Contributing factors
Revised FY Mar/22 yearly
forecastsProgress*2 FY Mar/22
initial planFY
Mar/21
Core operating CF 12.9 38.0 +25.1↑Increase in dividend from equity
method affiliates100.0 38% 100.0 78.7
Q1 profit(Valuation gain/loss
special factors)
18.5(-1.4)
29.2(-0.6)
+10.7(+0.8)
80.0 37% 80.045.9
(-42.1)
Gross profit 26.7 32.0 +5.3 ↑Increase in profit mainly at automotive related subsidiaries 107.7
Profit (Loss) from equity investments
17.3 28.7 +11.4↑Strong performance in automotive and commercial vehicle business primarily in
North America95.3
Dividend income 1.6 1.4 -0.2 3.9
Selling, general and administrative expenses
-29.2 -31.2 -2.0 -132.9
Others +2.1 -1.7 -3.8 -28.1
Total assets 2,339.2 +47.9*1 2,291.3
Main investments and recycling
-
18.529.2
4.9
11.8
10.7
50.8
-53.0
-8.8 -8.9
42.324.0
10.3
45.9
80.0
12.9
38.013.4
38.2
14.2 62.0
78.7
100.0
Company nameFY Mar/21
Q1FY Mar/22
Q1Change FY Mar/21
Consolid
ate
d
Mitsui & Co. Plant Systems 0.2 0.5 +0.3 2.2
Rolling stock leasing businesses*3 0.0 0.6 +0.6 -9.2
Construction & industrial machinery businesses*3 2.4 2.8 +0.4 7.7
Equity
-meth
od
IPP businesses 2.2 5.0 +2.8 27.7
FPSO/FSO leasing businesses 2.0 2.0 0.0 7.1
Gas distribution companies 1.1 1.8 +0.7 6.8
Penske Automotive Group 0.9 3.3 +2.4 9.5
MBK USA Commercial Vehicles 0.5 3.6 +3.1 10.7
Asian motor vehicle businesses 1.7 2.2 +0.5 3.6
VLI -0.4 -2.8 -2.4 0.0
24
FY Mar/2021
FY Mar/2021
Q1
FY Mar/2022
Q1
FY Mar/2021
FY Mar/2022
FY Mar/2021
FY Mar/2022
*1. Change since the end of FY Mar/21 *2. Progress against the revised full-year earnings forecast *3. . A portion of profit/loss was accounted for by the equity method
Machinery & Infrastructure
Quarterly trends
Results
Results of main affiliated companies
■IN■OUT
(Unit: billion yen)Investment CF
■Q1 ■Q2 ■Q3 ■Q4 Forecast
■Q1 ■Q2 ■Q3 ■Q4 Forecast
Profit for the yearCore operating CF
COPYRIGHT © MITSUI & CO., LTD. ALL RIGHTS RESERVED.
FY Mar/21
Q1
FY Mar/22
Q1Change Contributing factors
Revised FY Mar/22 yearly
forecastsProgress*2 FY Mar/22
initial planFY
Mar/21
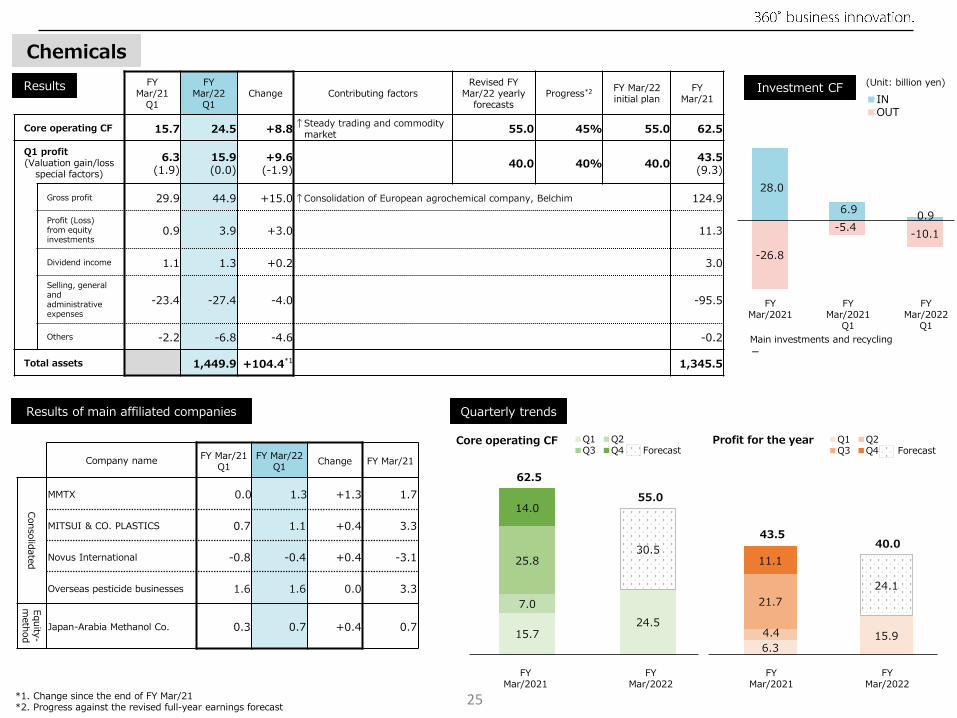
Core operating CF 15.7 24.5 +8.8↑Steady trading and commodity
market55.0 45% 55.0 62.5
Q1 profit(Valuation gain/loss
special factors)
6.3(1.9)
15.9(0.0)
+9.6(-1.9)
40.0 40% 40.043.5(9.3)
Gross profit 29.9 44.9 +15.0 ↑Consolidation of European agrochemical company, Belchim 124.9
Profit (Loss) from equity investments
0.9 3.9 +3.0 11.3
Dividend income 1.1 1.3 +0.2 3.0
Selling, general and administrative expenses
-23.4 -27.4 -4.0 -95.5
Others -2.2 -6.8 -4.6 -0.2
Total assets 1,449.9 +104.4*1 1,345.5
Main investments and recycling
-
6.315.94.4
21.7
11.1
24.1
-26.8
-5.4-10.1
28.0
6.90.9
43.540.0
15.724.5
7.0
25.8
14.0
30.5
62.5
55.0
Chemicals
Company nameFY Mar/21
Q1FY Mar/22
Q1Change FY Mar/21
Conso
lidate
d
MMTX 0.0 1.3 +1.3 1.7
MITSUI & CO. PLASTICS 0.7 1.1 +0.4 3.3
Novus International -0.8 -0.4 +0.4 -3.1
Overseas pesticide businesses 1.6 1.6 0.0 3.3
Equity
-m
eth
od
Japan-Arabia Methanol Co. 0.3 0.7 +0.4 0.7
25
FY Mar/2021
FY Mar/2021
Q1
FY Mar/2022
Q1
FY Mar/2021
FY Mar/2022
FY Mar/2021
FY Mar/2022
*1. Change since the end of FY Mar/21 *2. Progress against the revised full-year earnings forecast
Quarterly trends
Results
Results of main affiliated companies
■IN■OUT
(Unit: billion yen)Investment CF
■Q1 ■Q2 ■Q3 ■Q4 Forecast
■Q1 ■Q2 ■Q3 ■Q4 Forecast
Profit for the yearCore operating CF
COPYRIGHT © MITSUI & CO., LTD. ALL RIGHTS RESERVED.
FY Mar/21
Q1
FY Mar/22
Q1Change Contributing factors
Revised FY Mar/22 yearly
forecastsProgress*2 FY Mar/22
initial planFY
Mar/21
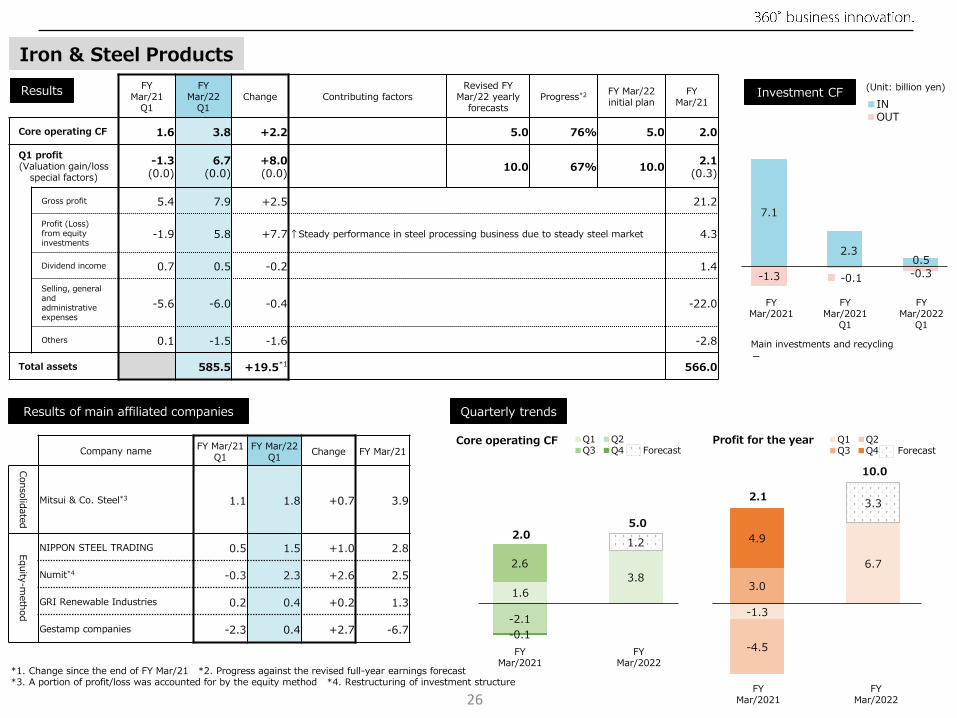
Core operating CF 1.6 3.8 +2.2 5.0 76% 5.0 2.0
Q1 profit(Valuation gain/loss
special factors)
-1.3(0.0)
6.7(0.0)
+8.0(0.0)
10.0 67% 10.02.1
(0.3)
Gross profit 5.4 7.9 +2.5 21.2
Profit (Loss) from equity investments
-1.9 5.8 +7.7 ↑Steady performance in steel processing business due to steady steel market 4.3
Dividend income 0.7 0.5 -0.2 1.4
Selling, general and administrative expenses
-5.6 -6.0 -0.4 -22.0
Others 0.1 -1.5 -1.6 -2.8
Total assets 585.5 +19.5*1 566.0
-1.3
6.7
-4.5
3.0
4.9
3.3
Main investments and recycling
-
-1.3 -0.1 -0.3
7.1
2.30.5
2.1
10.0
1.6
3.8
-2.1
2.6
-0.1
1.22.0
Iron & Steel Products
Company nameFY Mar/21
Q1FY Mar/22
Q1Change FY Mar/21
Consolid
ate
d
Mitsui & Co. Steel*3 1.1 1.8 +0.7 3.9
Equity
-meth
od
NIPPON STEEL TRADING 0.5 1.5 +1.0 2.8
Numit*4 -0.3 2.3 +2.6 2.5
GRI Renewable Industries 0.2 0.4 +0.2 1.3
Gestamp companies -2.3 0.4 +2.7 -6.7
FY Mar/2021
FY Mar/2021
Q1
FY Mar/2022
Q1
FY Mar/2021
FY Mar/2022
FY Mar/2021
FY Mar/2022
*1. Change since the end of FY Mar/21 *2. Progress against the revised full-year earnings forecast*3. A portion of profit/loss was accounted for by the equity method *4. Restructuring of investment structure
5.0
26
Quarterly trends
Results
Results of main affiliated companies
■IN■OUT
(Unit: billion yen)Investment CF
■Q1 ■Q2 ■Q3 ■Q4 Forecast
■Q1 ■Q2 ■Q3 ■Q4 Forecast
Profit for the yearCore operating CF

COPYRIGHT © MITSUI & CO., LTD. ALL RIGHTS RESERVED.
-5.6
13.9
-6.3
11.5
13.16.1
FY Mar/2022
*1. Change since the end of FY Mar/21 *2. Progress against the revised full-year earnings forecast*3. Business results undisclosed as the earnings of listed companies not yet announced, or results not disclosed due to confidentiality agreement *4. Change due to business integration
■Q1 ■Q2 ■Q3 ■Q4 Forecast
3.6
16.6
-2.3
10.0
8.5
13.4
FY Mar/21
Q1
FY Mar/22
Q1Change Contributing factors
Revised FY Mar/22 yearly
forecastsProgress*2 FY Mar/22
initial planFY
Mar/21
Core operating CF 3.6 16.6 +13.0 ↑Sale of Indian hospital business 30.0 55% 30.0 19.8
Q1 profit(Valuation gain/loss
special factors)
-5.6(-1.7)
13.9(0.2)
+19.5(+1.9)
20.0 70% 20.012.7
(-1.2)
Gross profit 27.8 34.6 +6.8 133.8
Profit (Loss) from equity investments
-3.8 13.9 +17.7
↑Increase in profit of WILSEY FOODS (higher soybean oil prices and recovery in demand for food service)
↑Strong performance in the hospital and healthcare business (absence of impairment in Q1 FY Mar/2021, COVID-19 related services and cost reduction)
↑Absence of impairment on goodwill at Indian IHH subsidiary in Q1 FY Mar/2021
13.4
Dividend income 2.2 2.2 0.0 5.6
Selling, general and administrative expenses
-31.7 -32.1 -0.4 -129.4
Others -0.1 -4.7 -4.6 -10.7
Total assets 2,130.6 +121.3*1 2,009.3
Main investments and recycling(OUT) Subscription of convertible bonds
issued by the holding company of CT Corp
-23.0
-5.0
-30.3
21.5
1.2 2.7
Lifestyle
Company nameFY Mar/21
Q1FY Mar/22
Q1Change FY Mar/21
Consolid
at
ed
Domestic food & retail management businesses
-0.1 0.6 +0.7 4.2
Fashion businesses -1.8 0.3 +2.1 0.0
Equity
-meth
od
Mitsui DM Sugar Holdings*3, 4 0.4 - - 0.6
WILSEY FOODS -0.3 3.3 +3.6 2.8
IHH Healthcare -2.2 2.9 +5.1 1.6
PHC Holdings*3 - - - -
AIM SERVICES -0.3 0.3 +0.6 0.9
Mit-Salmon Chile -1.1 0.3 +1.4 -2.8
FY Mar/2021
FY Mar/2021
Q1
FY Mar/2022
Q1
12.7
20.019.8
30.0
FY Mar/2021
FY Mar/2021
FY Mar/2022
Quarterly trends
Results
Results of main affiliated companies
■IN■OUT
(Unit: billion yen)Investment CF
■Q1 ■Q2 ■Q3 ■Q4 Forecast
Profit for the yearCore operating CF
27
COPYRIGHT © MITSUI & CO., LTD. ALL RIGHTS RESERVED.
FY Mar/21
Q1
FY Mar/22
Q1Change Contributing factors
Revised FY Mar/22 yearly
forecastsProgress*2 FY Mar/22
initial planFY
Mar/21
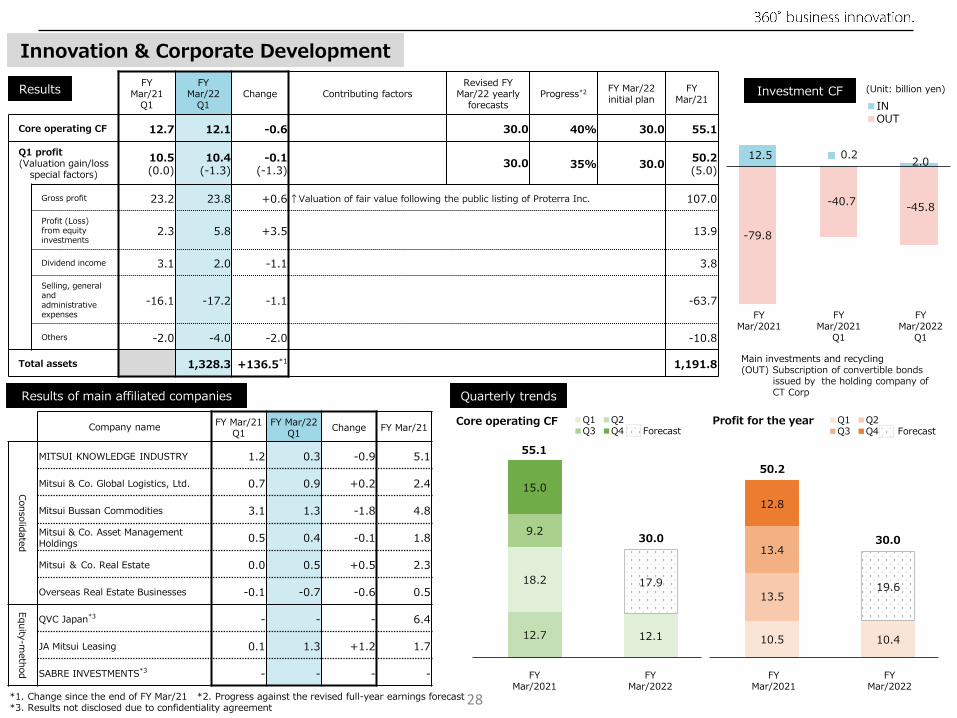
Core operating CF 12.7 12.1 -0.6 30.0 40% 30.0 55.1
Q1 profit(Valuation gain/loss
special factors)
10.5(0.0)
10.4(-1.3)
-0.1(-1.3)
30.0 35% 30.050.2(5.0)
Gross profit 23.2 23.8 +0.6 ↑Valuation of fair value following the public listing of Proterra Inc. 107.0
Profit (Loss) from equity investments
2.3 5.8 +3.5 13.9
Dividend income 3.1 2.0 -1.1 3.8
Selling, general and administrative expenses
-16.1 -17.2 -1.1 -63.7
Others -2.0 -4.0 -2.0 -10.8
Total assets 1,328.3 +136.5*1 1,191.8
-79.8
-40.7-45.8
12.5 0.22.0
Innovation & Corporate Development
Company nameFY Mar/21
Q1FY Mar/22
Q1Change FY Mar/21
Consolid
ate
d
MITSUI KNOWLEDGE INDUSTRY 1.2 0.3 -0.9 5.1
Mitsui & Co. Global Logistics, Ltd. 0.7 0.9 +0.2 2.4
Mitsui Bussan Commodities 3.1 1.3 -1.8 4.8
Mitsui & Co. Asset Management Holdings
0.5 0.4 -0.1 1.8
Mitsui & Co. Real Estate 0.0 0.5 +0.5 2.3
Overseas Real Estate Businesses -0.1 -0.7 -0.6 0.5
Equity
-meth
od
QVC Japan*3 - - - 6.4
JA Mitsui Leasing 0.1 1.3 +1.2 1.7
SABRE INVESTMENTS*3 - - - -
28*1. Change since the end of FY Mar/21 *2. Progress against the revised full-year earnings forecast*3. Results not disclosed due to confidentiality agreement
FY Mar/2021
FY Mar/2021
Q1
FY Mar/2022
Q1
10.5 10.4
13.5
13.4
12.8
19.6
50.2
30.0
12.7 12.1
18.2
9.2
15.0
17.9
55.1
30.0
FY Mar/2021
FY Mar/2022
FY Mar/2021
FY Mar/2022
Main investments and recycling(OUT) Subscription of convertible bonds
issued by the holding company of CT CorpQuarterly trends
Results
Results of main affiliated companies
■IN■OUT
(Unit: billion yen)Investment CF
■Q1 ■Q2 ■Q3 ■Q4 Forecast
Profit for the yearCore operating CF ■Q1 ■Q2 ■Q3 ■Q4 Forecast
