transform - intel · transform your code intel® parallel studio xe 2015 launches optimizing for...
TRANSCRIPT

Issue
192014
TRANSFORMyour codeIntel® Parallel Studio XE 2015 Launches
Optimizing For Performance
Designing For Scalability
Issue
192014
TRANSFORMyour codeIntel® Parallel Studio XE 2015 Launches
Optimizing for Performance
Designing for Scalability
TRANSFORM YOUR CODEIntel® Parallel Studio XE 2015 Deliver top application performance and reliability.
• Composer Edition: Includes industry-leading compilers and libraries that are optimized for creating fast parallel code.
• Professional Edition: Everything in Composer Edition, plus the best-in-class analysis tool Intel® VTune™ Amplifier XE, advanced memory and thread error checking and tuning capability.
• Cluster Edition: Everything in Professional Edition, plus an MPI cluster communications library, along with MPI error checking and tuning.
Try the Software:intel.com/software/products
For more information regarding performance and optimization choices in Intel® software products, visit http://software.intel.com/en-us/articles/optimization-notice.
© 2014, Intel Corporation. All rights reserved. Intel and the Intel logo are trademarks of Intel Corporation in the U.S. and/or other countries. *Other names and brands may be claimed as the property of others.
Explore our full range of development tools—from technical and embedded to media, HTML5, and cross-platform.
Web Apps and HTML5 Development Software
Intel®XDK
Embedded Systems/Devices Development Software
Intel®System Studio
Gaming and Media Development Software
Intel®Media Server Studio
Native App Development Software
Intel®Integrated NativeDeveloper Experience(Intel® INDE)
Technical Computing, Enterprise, and HPC Software
Intel®Parallel Studio XE

CONTENTS
© 2014, Intel Corporation. All rights reserved. Intel, the Intel logo, Cilk, VTune, Xeon, and Xeon Phi are trademarks of Intel Corporation in the U.S. and/or other countries. *Other names and brands may be claimed as the property of others.Open CL and the OpenCL logo are trademarks of Apple, Inc. used by permission by Kronos.
Share with a friendSign up for future issues
FEAT
URE
How to Design for Scalable Performance—from Multicore to Many-core 16 Intel® Advisor XE 2015 creates a framework for software architects to model their design and predict performance scaling and synchronization issues. Here we see how Intel Advisor XE 2015 extends modeling capabilities to support Intel® Xeon Phi™ coprocessors.
Optimization Reports: Increase Performance with Intel® Compilers 5Compiler optimization reports available in Intel® Parallel Studio XE 2015 can be used to tune code and increase performance. This article covers the types of report data available and how to apply this insight to your applications.
Additional Intel® Advanced Vector Extensions 512 (Intel® AVX-512) 23A concise look at new instructions that enrich the operations available with Intel AVX-512. These include a group of byte and word (8- and 16-bit) operations known as Byte and Word Instructions, which enhance integer operations. An additional orthogonal capability, known as Vector Length Extensions, enables most AVX-512 instructions to operate on 128 or 256 bits.
Letter from the Editor 4 Software-as-a-KeyBy James Reinders
Digimarc Takes Embedded Digital Watermarking to the Next Level 26 A case study reveals how Digimarc optimized code and used vectorization to upgrade its SDKs. The results include meeting aggressive performance and time-to-market goals, while continuing to make its mark in digital watermark innovation.
High Performance Parallelism Pearls 31 The latest book compiled by parallel programming evangelists and expert Intel engineers James Reinders and Jim Jeffers distills the experience of 69 experts into a 28-chapter “cookbook” on the inventive ways to get the most from Intel® multicore and many-core processors.
llllllllllllllllllllllllllllllllll

Share with a friendSign up for future issuesFor more information regarding performance and optimization choices in Intel® software products, visit software.intel.com/en-us/articles/optimization-notice.
LETTER FROM THE EDITORJames Reinders, Director of Parallel Programming Evangelism at Intel Corporation, is coauthor of an exciting new book, Multithreading for Visual Effects (2014). His other book credits include Intel® Xeon Phi™ Coprocessor High Performance Programming (2013), Structured Parallel Programming (2012), Intel® Threading Building Blocks: Outfitting C++ for Multicore Processor Parallelism, and VTune™ Performance Analyzer Essentials (Intel Press, 2005).
Software-as-a-KeyIt’s no secret that the full capability and capacity of today’s hardware is not being tapped. Using software to unlock hardware features is the stealth advantage of many of today’s most innovative application developers—from game designers to big data analysts.
Intel has bundled its latest feature releases into three editions of Intel® Parallel Studio XE 2015, targeted to developer requirements. In this issue, we explore a few of those features to demonstrate the impact of getting faster code to market faster.
Our feature article, Optimization Reports: Increase Performance with Intel® Compilers, brings a new level of insight to tuning and performance enhancements. It looks at the depth and types of report data now available and techniques for applying this information to your development process.
How to Design for Scalable Performance—from Multicore to Many-core tackles scalability on the Intel® Xeon Phi™ coprocessor. It includes coverage of analysis tools that automatically predict whether Intel Xeon Phi coprocessor performance levels can exceed the Intel Xeon processor performance peaks for a given workload.
In Additional Intel® Advanced Vector Extensions 512 (Intel® AVX-512), I provide a brief overview of new instructions supported by the Intel Xeon Phi coprocessor and future Intel® Xeon® processors. The new capabilities and support, as well as the value for compiler vectorization, are worth considering.
Next, we share an industry case study which shows the impact of ″hardware plus software″ optimization in the field.
Digimarc Takes Embedded Digital Watermarking to the Next Level shows how Intel® software tools allowed Digimarc to upgrade its SDKs to meet aggressive performance and time-to-market goals, while continuing to make its mark in digital watermark innovation.
In short, there are new tools to try and new opportunities to capitalize on. We hope you’ll find the key to your own coding challenges right here.
James ReindersSeptember 2014
4The Parallel Universe
llllllllllllllllllllllllllllllllll

Share with a friendSign up for future issuesFor more information regarding performance and optimization choices in Intel® software products, visit software.intel.com/en-us/articles/optimization-notice.
5The Parallel Universe
By Martyn Corden, Technical Consulting Engineer, Developer Products Division, Intel
Optimization Reports: Increase Performance with Intel® Compilers
Even when you are compiling an application for optimization, you can get enhanced performance improvement by utilizing optimization reports. Fortunately, this has become much easier with the latest compilers from Intel.
Modern optimizing compilers can transform code in ways that greatly improve performance, but the results may depend on how the original code was written and how much information is available to the compiler. The Intel® compiler optimization report tells the programmer which optimizations were performed and why others were not performed. This feedback can be used to tune code, enabling additional compiler optimizations and further enhancing application performance.
Prior Intel compiler versions provided potentially valuable information scattered through a series of different reports. But those messages were not logically ordered and were sometimes cryptic or confusing, especially in the presence of inlining or multiple, compiler-generated loop versions. Some of the information was not actionable or immediately useful. The single report stream could be hard to navigate, hard for other tools to access, and was unsuited to the parallel builds that are increasingly used to reduce build times on modern, multicore processors.
llllllllllllllllllllllllllllllllll

Share with a friendSign up for future issuesFor more information regarding performance and optimization choices in Intel® software products, visit software.intel.com/en-us/articles/optimization-notice.
6The Parallel Universe
With the new 15.0 compiler version in Intel® Parallel Studio XE 2015, the optimization report has been comprehensively redesigned to integrate all individual reports into a single, user-friendly report and to address the limitations described above. Here, we’ll cover new optimization report features, and how to use them to understand what optimizations the compiler did or did not perform, and to guide further application tuning.
Enabling and Controlling the ReportThe command line switches for enabling the optimization report and high-level control are listed in Figure 1 for the Intel compilers for Windows*, Linux* and OS X*. In most cases, the version of a switch for Linux or OS X starts with -q and the corresponding version for Windows starts with /Q. The switches are the same for C/C++ and Fortran compilers.
Linux* and OS X* Windows* Functionality
-qopt-report[=N] /Qopt-report[:N] Enables the report; N=1-5 specifies an increasing level of detail (default N=2)
-qopt-report-file=stdout | stderr | filename
/Qopt-report-file:stdout | stderr | filename
Controls where the report is written (default is to file with extension .optrpt)
/Qopt-report-format:vs Report is formatted to enable display in Microsoft Visual Studio*
-qopt-report-routine= fn1[,fn2,…]
/Qopt-report-routine: fn1[,fn2,…]
Emit report only for functions whose name contains fn1 [or fn2…] as a substring
-qopt-report-filter= “filename,ln1-ln2”
/Qopt-report-filter= “filename,ln1-ln2”
Emit report only for lines ln1 - ln2 of file filename
-qopt-report-phase=phase1[,phase2,…]
/Qopt-report-phase:phase1[,phase2,…]
Optimization information is provided only for the specified optimization phases
Optimization Phase Description
vec Automatic and explicit vectorization using SIMD instructions
par Automatic parallelization by the compiler
loop Memory, cache usage, and other loop optimizations
openmp Explicit threading using OpenMP directives
ipo Inter-procedural optimization, including inlining
pgo Profile guided optimization (using runtime feedback)
cg Optimizations during code generation
offload Offload and data transfer to Intel® Xeon Phi™ coprocessors
all Reports on all optimization phases (default)
1a
1b
llllllllllllllllllllllllllllllllll

Share with a friendSign up for future issuesFor more information regarding performance and optimization choices in Intel® software products, visit software.intel.com/en-us/articles/optimization-notice.
7The Parallel Universe
Report OutputThe report is disabled by default and may be enabled by the switch -qopt-report. By default, for compatibility with parallel builds, a separate report corresponding to each object file is created with file extension .optrpt in the same directory as the object file. The report output may be redirected to a different, named file, or to stderr or stdout, using the switch -qopt-report-file.
For debug builds with -g on Linux or OS X, /Zi on Windows, some loop optimization information is embedded in the assembly code and in the object file. This makes the loop structure in the assembly code easier to understand, and makes optimization information from the compiler available for use by other software tools.
Optimization reports can sometimes be very large. They may be restricted to functions of interest using the switch -qopt-report-routine, or to a particular range of line numbers within a source file using the switch -qopt-report-filter.
Layout of Loop-Related ReportsMessages relating to the optimization of nested loops are displayed in a hierarchical manner, as illustrated in Figure 2. The compiler generates a ″LOOP BEGIN″ message for each loop in the compiler-generated code, along with the initial source line and column number, and a corresponding ″LOOP END″ message. Indenting is used to make clear the nesting structure. There may be multiple compiler-generated loops for a single source loop and the nesting structure may differ from that of the source code. A loop may be ″distributed″ (split) into two or more sub-loops. The partial report displayed in Figure 2 shows that the outer loop at line 6 of the source code has become two inner loops in the optimized generated code.
1 double a[1000][1000],b[1000][1000],c [1000][1000];
2
3 void foo() {
4 int i,j,k;
5
6 for( i=0; i<1000; i++) {
7 for( j=0; j< 1000; j++) {
8 c[j][i] = 0.0;
9 for( k=0; k<1000; k++) {
10 c[j][i] = c[j][i] + a[k][i]* b[j][k];
11 }
12 }
13 }
14 }
2
LOOP BEGIN at ...\mydir\dev\test.c(7,5) Distributed chunk2 ... Loopnest interchanged : (1 2 3) → (2 3 1) ... LOOP BEGIN at ...\mydir\dev\test.c(9,7) Distributed chunk2 ... LOOP BEGIN at ...\mydir\dev\test.c(6,3) ... LOOP END LOOP BEGIN at ...\mydir\dev\test.c(6,3) ... REMAINDER LOOP WAS VECTORIZED LOOP END LOOP ENDLOOP END
source location
report contents
loop nesting
header info
llllllllllllllllllllllllllllllllll

Share with a friendSign up for future issuesFor more information regarding performance and optimization choices in Intel® software products, visit software.intel.com/en-us/articles/optimization-notice.
8The Parallel Universe
This hierarchical display allows compiler optimizations to be associated directly with the particular loop in the generated code to which they apply.
SIMD load instructions in a vectorized loop are most efficient when the data to be loaded are aligned to a memory address that is a multiple of the SIMD register width. To achieve this, the compiler may ″peel″ off a few initial iterations, so that the vectorized kernel can operate on data that are better aligned. Any small number of leftover iterations after the vectorized kernel may be optimized as a separate ″remainder″ loop. Figure 3 shows how such peel and remainder loops are identified in the optimization report.
LOOP BEGIN at ggF.cc(124,5) inlined into ggF.cc(56,7)
remark #15018: loop was not vectorized: not inner loop
LOOP BEGIN at ggF.cc(138,5) inlined into ggF.cc(60,15)
Peeled remark #25460: Loop was not optimized
LOOP END
LOOP BEGIN at ggF.cc(138,5) inlined into ggF.cc(60,15)
remark #15145: vectorization support: unroll factor set to 4
remark #15002: LOOP WAS VECTORIZED
LOOP END
LOOP BEGIN at ggF.cc(138,5) inlined into ggF.cc(60,15)
Remainder remark #15003: REMAINDER LOOP WAS VECTORIZED
LOOP END
LOOP END
3
Vectorized with Peeling and Remainder
Using the Loop and Vectorization ReportsThe goal of the new optimization report is not just to help you understand what the compiler did, but to help you understand the obstacles that it encountered, so you can help it perform better. We will illustrate this with the simple C example in Figure 4 (the report and its interpretation are very similar for both C++ and Fortran). The function foo() loops over the input array theta, does a calculation involving a math function, and returns the result in the array sth.
llllllllllllllllllllllllllllllllll

Share with a friendSign up for future issuesFor more information regarding performance and optimization choices in Intel® software products, visit software.intel.com/en-us/articles/optimization-notice.
9The Parallel Universe
The report shows that the compiler generated two loop versions corresponding to a single loop in the source code (this is known as multiversioning), and explains that this is because of data dependence. The compiler does not know at compile time whether the pointer arguments theta and sth might be aliased, i.e., the data they point to might overlap in a way that would make vectorization unsafe. Therefore, the compiler creates two versions of the loop, one vectorized and one not. The compiler inserts a runtime test for data overlap so that the vectorized loop is executed if it is safe to do so; otherwise, the non-vectorized loop version is executed.
If the programmer knows that the two pointer arguments are not aliased, he or she can communicate that to the compiler, either using the command line option -fargument-noalias (Linux or OS X) or /Qalias-args- (Windows), or the restrict keyword along with -restrict (Linux or OS X) or /Qrestrict (Windows). Alternatively, the compiler can be told directly that it is safe to vectorize the loop, using #pragma ivdep or #pragma omp simd (this latter requires the -qopenmp or -qopenmp-simd switch). In each of these cases, only the vectorized version
4
#include <math.h>
void foo (float * theta, float * sth) {
int i;
for (i = 0; i < 128; i++)
sth[i] = sin(theta[i]+3.1415927);
}
$ icc -c -qopt-report=2 -qopt-report-phase=loop,vec -qopt-report-file=stderr foo.c
Begin optimization report for: foo(float *, float *)
Report from: Loop nest & Vector optimizations [loop, vec]
LOOP BEGIN at foo.c(4,3)
<Multiversioned v1>
remark #25228: Loop multiversioned for Data Dependence
remark #15399: vectorization support: unroll factor set to 2
remark #15300: LOOP WAS VECTORIZED
LOOP END
LOOP BEGIN at foo.c(4,3)
<Multiversioned v2>
remark #15304: loop was not vectorized: non-vectorizable loop instance from multiversioning
LOOP END
llllllllllllllllllllllllllllllllll

Share with a friendSign up for future issuesFor more information regarding performance and optimization choices in Intel® software products, visit software.intel.com/en-us/articles/optimization-notice.
10The Parallel Universe
of the loop is generated, and the compiler does not need to generate any runtime tests for data overlap. In our example, we use the command line switch and increase the level of detail in the report as in Figure 5.
$ icc -c -fargument-noalias -qopt-report=4 -qopt-report-phase=loop,vec -qopt-report-file=stderr foo.c
Begin optimization report for: foo(float *, float *)
Report from: Loop nest & Vector optimizations [loop, vec]
LOOP BEGIN at foo.c(4,3)
remark #15389: vectorization support: reference theta has unaligned access [ foo.c(5,14) ]
remark #15389: vectorization support: reference sth has unaligned access [ foo.c(5,5) ]
remark #15381: vectorization support: unaligned access used inside loop body [ foo.c(5,5) ]
remark #15399: vectorization support: unroll factor set to 2
remark #15417: vectorization support: number of FP up converts: single precision to double precision 1
[ foo.c(5,14) ]
remark #15418: vectorization support: number of FP down converts: double precision to single precision 1
[ foo.c(5,5) ]
remark #15300: LOOP WAS VECTORIZED
remark #15450: unmasked unaligned unit stride loads: 1
remark #15451: unmasked unaligned unit stride stores: 1
remark #15475: --- begin vector loop cost summary ---
remark #15476: scalar loop cost: 114
remark #15477: vector loop cost: 40.750
remark #15478: estimated potential speedup: 2.790
remark #15479: lightweight vector operations: 9
remark #15480: medium-overhead vector operations: 1
remark #15481: heavy-overhead vector operations: 1
remark #15482: vectorized math library calls: 1
remark #15487: type converts: 2
remark #15488: --- end vector loop cost summary ---
remark #25015: Estimate of max trip count of loop=64
LOOP END
5
llllllllllllllllllllllllllllllllll
Share with a friendSign up for future issuesFor more information regarding performance and optimization choices in Intel® software products, visit software.intel.com/en-us/articles/optimization-notice.
11The Parallel Universe
The report shows that only a single loop version was generated. The cost summary shows that the estimated speedup from vectorization is about 2.79. Not bad, but we can do better. We note the remarks 15417 and 15418 about conversions between single- and double-precision at columns 14 and 5 of line 5, and the presence of 2 type converts in the summary. Checking the source code, we see that the array theta is single-precision, but the literal constant 3.1415927 defaults to double-precision. The result of the addition is double-precision. So, the double-precision version of the sine function is called, only for the result to be converted back to single-precision for storage into sth.
This impacts performance in two ways: it takes longer to calculate a sine function to higher precision; and because a double takes twice the space of a float in the SIMD register, the vector instructions can only operate on half as many elements at a time. If we modify the source code by making the literal constant and/or the sine function explicitly single precision,
sth[i] = sinf(theta[i]+3.1415927f);
then the warnings about precision conversions go away, and the estimated speedup almost doubles, to 5.4. This is because most of the time goes in the vectorized math library call (remark #15482), and rather little in the more lightweight vector operations (remark #15479).
Next, we notice that the estimated maximum trip count of the vectorized loop is 64, (remark #25015), compared to the original loop iteration count of 256. So each vector operation is acting on 4 floats, that is, 16 bytes. This is because, by default, we are compiling for Intel® Streaming SIMD Extensions, (Intel® SSE), for which the vector width is 16 bytes. If we have an Intel® processor with support for Intel® Advanced Vector Instructions (Intel® AVX), which have a vector width of 32 bytes, we can target these with the compiler option -xavx. This causes the following changes in the report:
remark #15477: vector loop cost: 11.620remark #15478: estimated potential speedup: 9.440…remark #25015: Estimate of max trip count of loop=32
If we had targeted an Intel® Xeon Phi™ coprocessor, the maximum trip count would have been 16 and the vector width would have been 16 floats or 64 bytes.
We now look at the messages relating to alignment. Accesses to memory that are aligned to a 32 byte boundary for Intel AVX (16 bytes for Intel SSE, 64 bytes for Intel Xeon Phi coprocessors) are typically more efficient than memory accesses that are not so aligned. Remark #15381 is a general warning that an unaligned memory access was detected somewhere within the loop. Remarks #15389, 15450, and 15451 tell us that when the compiler generates loads of theta and stores to sth it assumes that the data are unaligned. Since theta and sth are passed in as arguments, the compiler does not know their alignment. Data may be aligned where they are
llllllllllllllllllllllllllllllllll

Share with a friendSign up for future issuesFor more information regarding performance and optimization choices in Intel® software products, visit software.intel.com/en-us/articles/optimization-notice.
12The Parallel Universe
declared by using __declspec(align(32)) (Windows) or __attribute__((align(32))) (Linux or OS X), or where they are allocated, for example, by using _mm_malloc() or Posix memalign(). If the arguments to function foo() are known to be aligned, the keyword __assume_aligned() may be used to inform the compiler:
__assume_aligned(theta,32);
__assume_aligned(sth,32);
These keywords should only be used if you are sure that the pointer arguments of the function will always point to aligned data. There is no runtime check. After recompiling with the __assume_aligned keyword, only aligned memory accesses are reported, for example:
remark #15388: vectorization support: reference theta has aligned access
The estimated speedup due to vectorization increases by about 20%:
remark #15477: vector loop cost: 9.870
remark #15478: estimated potential speedup: 11.130
Now that sth is aligned, the compiler has the possibility of generating streaming stores (also known as non-temporal stores) directly to memory. This may be worthwhile if the stored data are unlikely to be accessed again in the near future, (i.e., before being evicted from cache). This avoids a ″read-for-ownership″ of the cache line, which may be beneficial for applications that read and write a lot of data and whose performance is limited by the available memory bandwidth. It also frees up cache for more productive uses. The compiler finds it worthwhile to generate streaming stores automatically only for amounts of data much larger than in this example, typically several megabytes. If the iteration count is increased to 2000000, or if #pragma vector nontemporal is placed before the loop, the compiler generates streaming store instructions and the following additional messages appear in the optimization report:
remark #15467: unmasked aligned streaming stores: 1
remark #15412: vectorization support: streaming store was generated for sth
Even for such a tiny function, the optimization report can be a rich source of information.
llllllllllllllllllllllllllllllllll

Share with a friendSign up for future issuesFor more information regarding performance and optimization choices in Intel® software products, visit software.intel.com/en-us/articles/optimization-notice.
13The Parallel Universe
Example of the IPO Report on InliningThe IPO report gives information about optimizations across function boundaries. Here, we will focus on inlining.
3 static void bar (float a[N], float b[N]) {
… // large body
11 }
12
13 static void foo(float a[N], float b[N]) {
… // small body
21 bar(a, b);
22 }
23
24 extern int main() {
26 float a[N];
27 float b[N];
…
35 foo(a, b);
36 foo(a, b);
37 printf(“result %d %d\n”,b[0], b[N-1]]);
38 }
icc -qopt-report=3 -qopt-report-phase=ipo sm.c
INLINING OPTION VALUES:
-inline-factor: 100
...
INLINE REPORT: (main) [1] sm.c(24,19)
-> INLINE: [35] foo()
-> [21] bar()
- > INLINE: [36] foo()
-> [21] bar()
- >EXTERN: [37] printf
INLINE REPORT: (bar) [2] sm.c(3,42)
DEAD STATIC FUNCTION: (foo) sm.c(13,42)
6
llllllllllllllllllllllllllllllllll

Share with a friendSign up for future issuesFor more information regarding performance and optimization choices in Intel® software products, visit software.intel.com/en-us/articles/optimization-notice.
14The Parallel Universe
Figure 6 shows schematically a main program that twice calls a small, static function foo(), and then calls printf to print a final result. foo() calls a large static function bar(). Each live function gets its own inlining report. Thus main(), whose body starts at line 24, column 19, gets foo() inlined at line 35 and at line 36. foo() in turn gets bar() inlined at line 21. main() also calls printf() at line 37; printf is marked as external, because its content is not visible to the compiler. bar(), whose body starts at line 3, column 42, does not contain any function calls. The static function foo(), whose body starts at line 13, column 42, is marked as dead because all of the calls to it within the source file are inlined; since it can’t be called externally, the compiler does not need to generate a standalone version of the function.
Any indirect function calls would also be shown at report level 3, marked ″INDIRECT.″ At higher levels, the sizes of all called functions visible to the compiler are displayed, along with the increase in size of the calling function when they are inlined.
At the start of the inlining phase of the optimization report is a list of the inlining parameters' values that were used, next to the compiler switches that can be used to modify them. These can be used to control the amount of inlining, based on the information in the report. For example, changing the argument of -inline-factor (/Qinline-factor on Windows) from 100 to 200 doubles all the size limits used to control what may be inlined. Inlining of individual functions can be requested or inhibited using pragmas such as inline, noinline, and forceinline, or by the corresponding function attributes using __attribute__ or __declspec keywords. For more details, see the Intel® Compiler User and Reference Guides.
Other Report Phases-qopt-report-phase=par: Reports on automatic parallelization (threading) by the compiler, structured similarly and integrated with the vectorization and loop reports.
-qopt-report-phase=openmp: Reports on threading constructs resulting from OpenMP* pragmas or directives.
-qopt-report-phase=pgo: Reports on profile-guided optimization, including which functions had useful profiles.
-qopt-report-phase=cg: Reports on optimizations during code generation, such as intrinsic function lowering (conversion to lower level constructs).
-qopt-report-phase=loop: Reports on additional loop and memory optimizations, such as cache blocking, prefetching, loop interchange, loop fusion, etc.
-qopt-report-phase=offload: Summarizes data scheduled for transfer to and from an Intel Xeon Phi coprocessor.
llllllllllllllllllllllllllllllllll

Share with a friendSign up for future issuesFor more information regarding performance and optimization choices in Intel® software products, visit software.intel.com/en-us/articles/optimization-notice.
15The Parallel Universe
SummaryThe new, consolidated optimization report in the Intel® C/C++ and Fortran compilers 15.0 provides a wealth of information in a readily accessible format. This includes reportage on which optimizations could not be performed, as well as those that were performed. These reports can provide valuable guidance on further tuning that could improve application performance.
For more information, see the Intel® Parallel Studio XE 2015 Composer Edition Compiler User Guide and Compiler Reference Guide.
*Other names and brands may be claimed as the property of others.
INFORMATION IN THIS DOCUMENT IS PROVIDED “AS IS”. NO LICENSE, EXPRESS OR IMPLIED, BY ESTOPPEL OR OTHERWISE, TO ANY INTELLECTUAL PROPERTY RIGHTS IS GRANTED BY THIS DOCUMENT. INTEL ASSUMES NO LIABILITY WHATSOEVER AND INTEL DISCLAIMS ANY EXPRESS OR IMPLIED WARRANTY, RELATING TO THIS INFORMATION INCLUDING LIABILITY OR WARRANTIES RELATING TO FITNESS FOR A PARTICULAR PURPOSE, MERCHANTABILITY, OR INFRINGEMENT OF ANY PATENT, COPYRIGHT OR OTHER INTELLECTUAL PROPERTY RIGHT.
Software and workloads used in performance tests may have been optimized for performance only on Intel microprocessors. Performance tests, such as SYSmark and MobileMark, are measured using specific computer systems, components, software, operations and functions. Any change to any of those factors may cause the results to vary. You should consult other information and performance tests to assist you in fully evaluating your contemplated purchases, including the performance of that product when combined with other products.
Optimization Notice
Intel’s compilers may or may not optimize to the same degree for non-Intel microprocessors for optimizations that are not unique to Intel microprocessors. These optimizations include SSE2, SSE3, and SSSE3 instruction sets and other optimizations. Intel does not guarantee the availability, functionality, or effectiveness of any optimization on microprocessors not manufactured by Intel. Microprocessor-dependent optimizations in this product are intended for use with Intel microprocessors. Certain optimizations not specific to Intel microarchitecture are reserved for Intel microprocessors. Please refer to the applicable product User and Reference Guides for more information regarding the specific instruction sets covered by this notice.
Notice revision #20110804
Try Intel® Compilers Available in these software tools:Intel® Parallel Studio XE 2015 Composer, Professional, and Cluster Editions >
llllllllllllllllllllllllllllllllll

Share with a friendSign up for future issuesFor more information regarding performance and optimization choices in Intel® software products, visit software.intel.com/en-us/articles/optimization-notice.
16The Parallel Universe
By Ekaterina Antakova, Software Engineer, Developer Products Division, Intel
Have you ever threaded an application but seen little performance gain? Have you hit a “scalability ceiling” where performance gains level off as you add more cores? Implementing a parallel algorithm can be a lot of effort. Wouldn’t it be great to explore a couple of different implementation schemes and see which is best, before investing in the heavy lifting of full implementation? This is the problem that Intel® Advisor XE 2015 is designed to solve. It creates a framework for software architects to model their design and predict the performance scaling and synchronization issues. Here, we will see how Intel Advisor XE 2015 extends this modeling to support Intel® Xeon Phi™ coprocessors.
Part of the Intel® Parallel Studio XE 2015 family, Intel Advisor XE 2015 helps to assess the opportunities for parallelism in serial code, pinpoint the parts that are ready to benefit from using Intel Xeon Phi coprocessors, and identify the key limiters when parts are not ready to scale. Intel Advisor XE is available at http://intel.ly/advisor-xe.
How to Design for Scalable Performance—from Multicore to Many-core
llllllllllllllllllllllllllllllllll

Share with a friendSign up for future issuesFor more information regarding performance and optimization choices in Intel® software products, visit software.intel.com/en-us/articles/optimization-notice.
17The Parallel Universe
To enable moving to new CPUs and coprocessors effectively and to ease programmer efforts, Intel provides tools to help identify the best spots to utilize parallel programming to accelerate an application. For example, Intel Xeon Phi coprocessor capabilities can be used effectively on highly parallel workloads. In order to achieve this goal, the programmer has to learn what “highly parallel” actually means in terms of their application. This is the problem which the Intel Advisor XE helps attack with the exciting new features now available.
These features help the programmer to automatically compare Intel Xeon Phi coprocessor performance limits with Intel® Xeon® processor peak performance for a given workload to make informed decisions on which parts of code are ready for porting to the coprocessor. Another new capability is the ability to predict parallel scalability for bigger datasets to help understand how to increase parallel efficiency on modern multicore and many-core hardware.
These modeling capabilities aim to answer three main questions about the analyzed application:
1. Is the Intel Xeon Phi coprocessor the right fit for this workload? Intel Advisor suitability analysis automatically predicts if Intel Xeon Phi coprocessor performance levels can exceed the Intel Xeon processor performance peaks for a given workload. It also helps determine if the current application structure does not scale well on the coprocessor early in the development cycle.
Figures 1 and 2 show the predicted performance gain of a potential parallel version of two test loops executing different stages of an image processing algorithm. The green zone shows gain levels which are considered ready for running this workload on the Intel Xeon Phi coprocessor. Examining color-coded zones, it is easy to determine that the first loop shown in Figure 1 scales quite well and looks like a good candidate for porting to the coprocessor. According to this prediction, it should achieve appropriate speedups on 128 coprocessor threads and more, if ported to the coprocessor. Another loop shown in Figure 2 can’t be considered “highly parallel,” as its predicted maximum gain becomes flat after 128 coprocessor threads. So this one does not seem to be a good candidate for running on the coprocessor, unless the algorithm can be modified to be more highly parallel.
1 2
llllllllllllllllllllllllllllllllll

Share with a friendSign up for future issuesFor more information regarding performance and optimization choices in Intel® software products, visit software.intel.com/en-us/articles/optimization-notice.
18The Parallel Universe
2. What are the main factors limiting parallel performance and scalability in this application? For efficient parallelization of serial code, it is essential to understand the main obstacles to desired performance and scalability. A high-level breakdown of parallelism performance losses caused by imbalance in parallel jobs, lock contention, or parallel runtime overheads is provided by Intel Advisor suitability analysis.
Figure 3 shows a loop which has good potential. The three markers show the range of performance pos-sible by changing lock overhead, task chunking, parallel framework, etc. The middle circle moves as the user selects different runtime modeling options. All three markers can move when the user changes the task modeling options. Maximum predicted performance (shown by the upper white rectangles) grows well with the increasing number of CPUs in Figure 3. However, the current performance gain of this loop (shown by the white circles) does not scale well after 64 CPUs according to the Intel Advisor prediction. The reasons for this include too much overhead of parallel runtimes: ~30s in total compared with total parallel execution time predicted for this code of ~165s and significant imbalance between parallel tasks causing waits of around 29s. This is an indication of issues with parallel task granularity and breakdown in this loop. Significant runtime overhead prediction shows that parallel tasks are too fine-grained for this workload, and that creation of every task is done too often, causing too much overhead.
3
llllllllllllllllllllllllllllllllll
Share with a friendSign up for future issuesFor more information regarding performance and optimization choices in Intel® software products, visit software.intel.com/en-us/articles/optimization-notice.
19The Parallel Universe
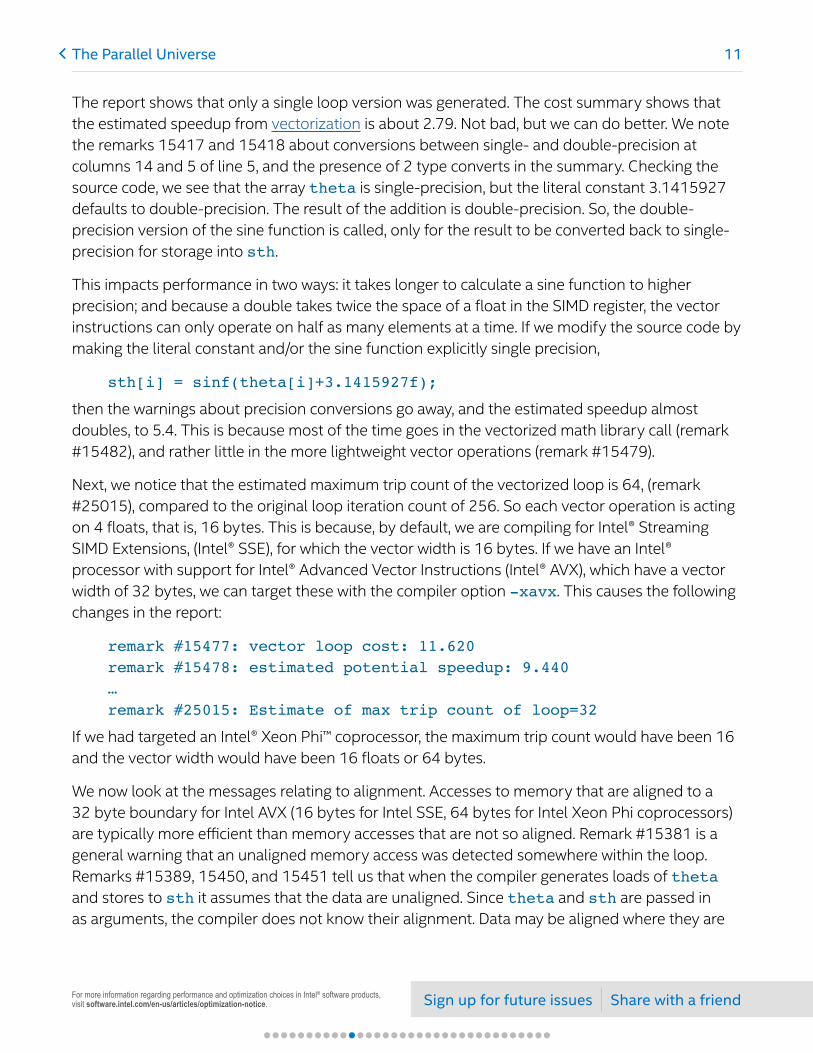
3. What happens to parallel scalability as the workload size scales up? Suitability Iteration Space modeling aims to predict what happens when workload size increases. It models more iterations in loops, longer execution of iterations, or both at the same time. Run a smaller sample and analyze how the performance will change if dataset size and computation amount increase. Determine a sufficient dataset size to get the most from modern, highly parallel multicore CPUs and coprocessors.
Figure 4 shows a scalability prediction for a model of a future parallel loop on a smaller test workload and the user interface for modeling bigger data size processing. The current prediction shows quite limited scalability of this workload on 32 and more CPUs.
But will it scale better with bigger input data? Based on the nature of the analyzed loop and the bigger data to be processed, let’s make an assumption that the iteration number should increase about 125 times, and the duration of each iteration should increase a bit less than this, about 25 times more than the current duration.
4
llllllllllllllllllllllllllllllllll

Share with a friendSign up for future issuesFor more information regarding performance and optimization choices in Intel® software products, visit software.intel.com/en-us/articles/optimization-notice.
20The Parallel Universe
Figure 5 shows the updated performance prediction for this loop model with the new data size parameters. In this case, increasing input data—modeled by increased number of iterations and longer iteration durations—leads to better scalability for this loop, making it an appropriate candidate for executing on the Intel Xeon Phi coprocessor.
New modeling capabilities of the Intel Advisor tool are based on measuring CPU-bound work, task granularity (chunking and scheduling), load balancing, lock contention, and overheads of the selected parallel framework. To analyze predicted performance and gains for Intel Xeon Phi coprocessor applicability evaluation, the Intel Advisor model includes CPU frequency parameters, coprocessor-specific runtime overheads, and data transfer overhead for specified data size when modeling offload execution.
Here is what a graphics processing company, an early Beta evaluator, said about the practical benefit of the new workload scaling feature: “Intel Advisor XE 2015 Beta demonstrates a useful ability to estimate dataset size that is essential for choosing policy when chunking big images for multiple renders.”
By modeling the scalability of future parallel code on different numbers of CPUs and on the Intel Xeon Phi coprocessor, Intel Advisor helps identify the most performance-profitable parts of your application. Development efforts can then focus on these code locations. Experimenting with bigger workloads is useful to understand the optimal workload sizes sufficient to saturate many cores on a given target platform. This allows you to explore how an application workload scales under different conditions and discover whether you can get more performance benefits from running on a coprocessor.
5
llllllllllllllllllllllllllllllllll

Share with a friendSign up for future issuesFor more information regarding performance and optimization choices in Intel® software products, visit software.intel.com/en-us/articles/optimization-notice.
21The Parallel Universe
Intel Advisor XE Predicts Scalable Performance on Intel Xeon Phi CoprocessorsIntel Advisor XE modeling is a tremendous tool for understanding algorithm scalability in your applications, acquiring a realistic view of the scalability of your program as implemented, and getting feedback on what the limiters are in your code. This is enormously useful. Unfortunately, no tool is available to tell you if there is a radically different approach or algorithm to get the same work done while scaling better. However, with Intel Advisor XE you can determine if you need or want more scalability, and evaluate multiple approaches quickly and easily. This will let you find the best methods available to scale, and identify which applications have enough scaling to use highly parallel systems such as Intel Xeon Phi coprocessors.
Try Intel® Advisor XE Available in these software tools:Intel® Parallel Studio XE 2015 Professional and Cluster Editions >
llllllllllllllllllllllllllllllllll

Share with a friendSign up for future issuesFor more information regarding performance and optimization choices in Intel® software products, visit software.intel.com/en-us/articles/optimization-notice.
22The Parallel Universe
BLOG HIGHLIGHTS
More
New book: Multithreading for Visual EffectsBY JAMES REINDERS »
Several authors from DreamWorks Animation, Pixar, Side Effects, AMD, and Intel got together to write a book based on the SIGGRAPH 2013 course, Multithreading in Visual Effects. The material in the book is greatly expanded and updated from the course material and includes an additional chapter on OpenSubdiv, authored by Manuel Kraemer of Pixar. Ron Henderson received a Technical Achievement Award earlier this year (Feb 2014) for the development of the FLUX gas simulation system (Chapter 5 in our book).
Chapter and Author List > Multithreading Introduction and Overview James Reinders, Intel Corporation
> Houdini: Multithreading Existing Software Jeff Lait, Side Effects Software, Inc.
> The Presto Execution System: Designing for Multithreading George ElKoura, Pixar Animation Studios
> LibEE: Parallel Evaluation of Character Rigs Martin Watt, DreamWorks Animation
> Fluids: Simulation on the CPU Ron Henderson, DreamWorks Animation
> Bullet Physics: Simulation with OpenCL™ Erwin Coumans, Advanced Micro Devices, Inc.
> OpenSubdiv: Interoperating GPU Compute and Drawing Manuel Kraemer, Pixar
llllllllllllllllllllllllllllllllll

Share with a friendSign up for future issuesFor more information regarding performance and optimization choices in Intel® software products, visit software.intel.com/en-us/articles/optimization-notice.
23The Parallel Universe
By James Reinders, Director of Parallel Programming Evangelism, Intel
Additional Intel® Advanced Vector Extensions 512 (Intel® AVX-512)
The Intel® Architecture Instruction Set Extensions Programming Reference includes the definition of additional Intel® Advanced Vector Extensions 512 (Intel® AVX-512) instructions.
As I discussed in my first blog about Intel AVX-512 last year, Intel AVX-512 will be first implemented in the future Intel® Xeon Phi™ processor and coprocessor known by the codename Knights Landing.
We had committed that Intel AVX-512 would also be supported by some future Intel® Xeon® processors scheduled to be introduced after Knights Landing. These additional documented instructions will now appear in such processors, along with most Intel AVX-512 instructions published previously.
The new instructions enrich the operations available as part of Intel AVX-512. These are provided in two groups. A group of byte and word (8- and 16-bit) operations known as Byte and Word Instructions, indicated by the AVX512BW CPUID flag, enhance integer operations. It is notable that these do make use of all 64 bits in the mask registers. A group of doubleword and quadword (32- and 64-bit) operations known as Doubleword and Quadword Instructions, indicated by the AVX512DQ CPUID flag, enhance integer and floating-point operations.
llllllllllllllllllllllllllllllllll

Share with a friendSign up for future issuesFor more information regarding performance and optimization choices in Intel® software products, visit software.intel.com/en-us/articles/optimization-notice.
24The Parallel Universe
An additional orthogonal capability known as Vector Length Extensions provide for most AVX-512 instructions to operate on 128 or 256 bits, instead of only 512. Vector Length Extensions can currently be applied to most Foundation Instructions and the Conflict Detection Instructions, as well as the new Byte, Word, Doubleword, and Quadword instructions. The AVX-512 Vector Length Extensions are indicated by the AVX512VL CPUID flag. The use of Vector Length Extensions extends most AVX-512 operations to also operate on XMM (128-bit, SSE) registers and YMM (256-bit, AVX) registers. The use of Vector Length Extensions allows the capabilities of EVEX encodings, including the use of mask registers and access to registers 16..31, to be applied to XMM and YMM registers, instead of only to ZMM registers.
Emulation for Testing, Prior to ProductIn order to help with testing of support, the Intel® Software Development Emulator has been extended to include these new Intel AVX-512 instructions and is available at: http://www.intel.com/software/sde.
Intel AVX-512 Family of InstructionsIntel AVX-512 Foundation Instructions will be included in all implementations of Intel AVX-512. While the Intel AVX-512 Conflict Detection Instructions are documented as optional extensions, the value for compiler vectorization has proven strong enough that they will be included in Intel Xeon processors that support Intel AVX-512. This makes Foundation Instructions and Conflict Detection Instructions both part of all Intel AVX-512 support for both future Intel Xeon Phi coprocessors and processors and future Intel Xeon processors.
Knights Landing will support Intel AVX-512 Exponential and Reciprocal Instructions and Intel AVX-512 Prefetch Instructions, while the first Intel Xeon processors with Intel AVX-512 will support Intel AVX-512 Doubleword and Quadword Instructions, Intel AVX-512 Byte and Word Instructions, and Intel AVX-512 Vector Length Extensions. Future Intel Xeon Phi coprocessors and processors (after Knights Landing) may offer additional Intel AVX-512 instructions, but should maintain a level of support at least comparable to Knights Landing (Foundation Instructions, Conflict Detection Instructions, Exponential and Reciprocal Instructions, and Prefetch Instructions). Likewise, the level of Intel AVX-512 support in the Intel Xeon processor family should include at least Foundation Instructions, Conflict Detection Instructions, Byte and Word Instructions, Doubleword and Quadword Instructions, and Vector Length Extensions whenever Intel AVX-512 instructions are supported. Assuming these baselines in each family simplifies compiler designs and should be done.
llllllllllllllllllllllllllllllllll

Share with a friendSign up for future issuesFor more information regarding performance and optimization choices in Intel® software products, visit software.intel.com/en-us/articles/optimization-notice.
25The Parallel Universe
Intel AVX-512 SupportRelease of detailed information on these additional Intel AVX-512 instructions helps enable support for tools, applications, and operating systems by the time products appear. We are working with open source projects, application providers, and tool vendors to help incorporate support. The Intel® compilers, libraries, and analysis tools have strong support for Intel AVX-512 today. Updates, planned for November 2014, will provide support for these additional instructions as well.
Intel AVX-512 DocumentationThe Intel AVX-512 instructions are documented in the Intel® Architecture Instruction Set Extensions Programming Reference. Intel AVX-512 is detailed in Chapters 2–7.
For more complete information about compiler optimizations, see our Optimization Notice.
Try Intel® Compilers Available in these software tools:Intel® Parallel Studio XE 2015 Composer, Professional, and Cluster Editions >
llllllllllllllllllllllllllllllllll
Share with a friendSign up for future issuesFor more information regarding performance and optimization choices in Intel® software products, visit software.intel.com/en-us/articles/optimization-notice.
26The Parallel Universe
OverviewDigimarc’s core technology is the robust embedding of digital information in all forms of media. Its digital watermarking technology allows users to embed digital information into audio, images, video, and printed materials in a way that is persistent, imperceptible, and easily detected by computers and digital devices. Digimarc technology helps companies and inspectors who need to verify that content is genuine and from an authorized source, as well as confirm that it has not been altered or falsified. The presence and continuity of a digital watermark can quickly help determine whether or not the content has been altered. In addition, digital watermarks add yet another layer of security to encrypted content in order to protect assets and help identify the source of leaks.
Digimarc’s software development kits (SDK) and accompanying support allow partners and developers worldwide to integrate its solutions into their product offerings. Digimarc wanted to update its SDKs to accelerate performance and take advantage of the latest hardware capabilities.
SDKs for Developers Worldwide Get an Upgrade with Intel® Software Tools
Digimarc Takes Embedded Digital Watermarking to the Next Level
llllllllllllllllllllllllllllllllll

Share with a friendSign up for future issuesFor more information regarding performance and optimization choices in Intel® software products, visit software.intel.com/en-us/articles/optimization-notice.
27The Parallel Universe
The ChallengeDigimarc wanted to utilize the full power of multicore processors to improve performance of the math-intensive image processing library that is integral to its SDKs. The previous library version targeted processors from early 2000 and was unable to take advantage of SIMD vector instructions and multicore processing power.
Migration to multicore required a complete rewrite of the code. And the application needed to run on multiple operating systems.
The Solution Digimarc explored other solutions, but only the Intel® software tools gave it the ability to vectorize application code with minimal effort—and without resorting to low-level programming techniques. Without vectorization, it would not have been possible to fully utilize processor resources.
The Digimarc application is well-suited for SIMD instructions, and having a single compiler that worked on multiple platforms was highly beneficial. Says Digimarc Software Engineer Goran Negovetic, ″We realized that to achieve good parallelism we needed lock-free algorithm design, which means that there is no data sharing between threads. Although it was a big effort, we achieved almost perfect scalability and are well-positioned for modern and future processors, and an increasing number of processor cores.″
Being able to develop a solution that could be ported across platforms was key. The tools enabled Digimarc to focus code optimization on a single platform and then replicate results on other OS platforms without any code changes. Digimarc’s engineers developed and tuned the code on Windows*, but also compiled and released on OS X*. They are in the process of targeting an embedded Linux* platform using the same codebase.
“Intel® Threading Building Blocks (Intel® TBB) provided an easy way to parallelize the code. We relied heavily on Intel® VTune™ Amplifier to measure performance, and we used Intel® Inspector to check for threading errors.” – Goran Negovetic, Software Engineer, Digimarc
llllllllllllllllllllllllllllllllll

Share with a friendSign up for future issuesFor more information regarding performance and optimization choices in Intel® software products, visit software.intel.com/en-us/articles/optimization-notice.
28The Parallel Universe
Intel software tools helped Digimarc meet its very aggressive performance target. The new codebase uses more advanced algorithms and is fully parallelizable for maximum scalability. It achieves great performance when run on multicore processors. However, the code also had to perform with legacy code on a single core. To meet that goal, it exploited data parallelism by using SIMD vector instructions.
Digimarc used the Intel toolset across its development process. Says Goran, ″Intel® Threading Building Blocks (Intel® TBB) provided an easy way to parallelize the code. We relied heavily on Intel® VTune™ Amplifier to measure performance, and we used Intel® Inspector to check for threading errors.″
Intel support was extremely valuable, from providing training on tools to helping with actual code vectorization. Goran adds, ″Intel helped with tools training and support, code optimization and vectorization, support with new language features (C++ 11), and support with the OS X compiler. It was a great resource to have throughout the project.″
Results Intel software tools offered better performance and ease of use, less invasive pragmas, and auto-vectorization with minimal code changes. They outperformed competitive toolsets, allowing Digimarc to realize productivity gains and reduce overall development costs.
“We realized that to achieve good parallelism we needed lock-free algorithm design, which means that there is no data sharing between threads. Although it was a big effort, we achieved almost perfect scalability and are well-positioned for modern and future processors, and an increasing number of processor cores.” – Goran Negovetic, Software Engineer, Digimarc
llllllllllllllllllllllllllllllllll

Share with a friendSign up for future issuesFor more information regarding performance and optimization choices in Intel® software products, visit software.intel.com/en-us/articles/optimization-notice.
29The Parallel Universe
Per module performance comparison
1 2 3 4 5 6 7 8 9 10 11 12 13
Intel (US)
CompetitorTools (US)
120,000
100,000
80,000
60,000
40,000
20,000
0
Intel® software tools contributed to significant performance increases for Digimarc, and outperformed competitor products.
MODULE INTEL (US) COMPETITOR TOOLS (US)
1 98632 87138
2 8634 62013
3 338 8208
4 1350 1173
5 29810 32457
6 9641 13470
7 724 690
8 7010 5951
9 7997 22493
10 3955 13019
11 744 882
12 1547 2356
13 13826 22105
Total 184208 271955
CONFIGURATION SPECIFICATIONS
Operating System Microsoft Windows Server* 2008 R2; Standard Service Pack 1 (6.1.7601); 171 HotFixes (latest: KB982018)
Processor Intel® Core™ i7-3770 CPU @ 3.40GHz
Speed 3401 MHz
Memory 8134 MB
RESULTS GAINS
Performance Gains ~1.6x single-core speedup
Productivity Single compiler used for optimization across multiple platforms (Windows*, OS X*)
Auto-vectorization saved time, reducing time-consuming and tedious low-level programming techniques
Forward-Scaling and Cross-Platorm Development
One codebase supported multiple processor targets
Customer Satisfaction Met customer performance and timeline requirements and improved customer satisfaction
Development Costs Accelerated time to market and reduced development costs
llllllllllllllllllllllllllllllllll

Share with a friendSign up for future issuesFor more information regarding performance and optimization choices in Intel® software products, visit software.intel.com/en-us/articles/optimization-notice.
30The Parallel Universe
Conclusion Digimarc’s focus on innovation in a complex industry and breadth of customer segments means taking advantage of the latest hardware capabilities, and developing for cross-platform usage models are strategic, as well as engineering priorities. Intel software tools allowed Digimarc to upgrade its SDKs to meet aggressive performance and time-to-market goals, while continuing to make its mark in digital watermark innovation.
About DigimarcBased in Beaverton, Oregon, Digimarc enables businesses and governments worldwide to enrich everyday living with the means to identify all forms of content, including audio, video, and imagery. We develop solutions, license intellectual property, and provide development services to business partners across a wide range of industries. Digimarc industries include packaging and retail, audio, magazines, books, newspapers, direct mail, and finance. Company products include Digimarc Discover*, Digimarc Guardian*, and SDKs.
Learn more: www.digimarc.com
About Intel® Software Development ToolsIntel has been providing standards-driven tools for developers in the high performance computing industry for more than 25 years. Its industry-leading tools include Fortran, C, and C++ Compilers, as well as performance profiling and analysis tools such as Intel® VTune™ Amplifier XE, Intel® Inspector XE, and Intel® Trace Analyzer and Collector. Performance libraries and programming models such as Intel® MPI library, Intel® Math Kernel Library, Intel® Cilk™ Plus, and Intel® Threading Building Blocks provide developers the tools needed to build applications for today and scale forward to tomorrow.
Learn more: http://intel.ly/perf-tools
Learn more about Intel® software development tools at http://intel.ly/perf-tools.
Try Intel® Software Development Tools >
llllllllllllllllllllllllllllllllll

Share with a friendSign up for future issuesFor more information regarding performance and optimization choices in Intel® software products, visit software.intel.com/en-us/articles/optimization-notice.
31The Parallel Universe
Running code on the massive parallelism of the Intel® Xeon Phi™ family of co-processors is easy, so you can quickly focus on optimization and achieving high performance. Fine-tuning for parallelism takes your applications from correct to correct and efficient.
The latest book compiled by parallel programming evangelists and expert Intel engineers James Reinders and Jim Jeffers provides a wealth of actual examples from contributors who have found inventive ways to get the most from Intel® multicore and many-core processors.
The experience of 69 experts, distilled into a 28-chapter 'cookbook'
Best and practical methods to use parallelism for performance
High Performance Parallelism Pearls
llllllllllllllllllllllllllllllllll

Share with a friendSign up for future issuesFor more information regarding performance and optimization choices in Intel® software products, visit software.intel.com/en-us/articles/optimization-notice.
32The Parallel Universe
What’s InsideHigh Performance Parallelism Pearls shows you:
> The most effective ways to tap the computational potential of systems with Intel Xeon Phi coprocessors and Intel® Xeon™ processors or other multicore processors
> Examples of successful programming efforts drawn from across industries and domains such as chemistry, engineering, and environmental science
> Dozens of success stories that demonstrate not just the features of these powerful systems but also how to take best advantage of parallelism across these heterogeneous systems
In each chapter, you’ll find detailed technical information you can use, including: > Proven results from 69 technical experts across multiple vertical domains
> Practical techniques and explanations for optimizations that help processors and coprocessors
> Actual source code, with highlights published in the book and complete source code available for download
Get Your Copy TodayHigh Performance Parallelism Pearls: Multicore and Many-core Programming Approaches (ISBN 978-0128021187) is available from the Elsevier Store and Amazon. Published by Morgan Kaufmann
Find out more, read reviews, and read the unabridged first chapter – lotsofcores.com
“The newest book by James Reinders and Jim Jeffers, High Performance Parallelism Pearls, distills the experience of 69 HPC experts into 28 chapters designed to teach the world about the performance capabilities of the massively parallel Intel® Xeon Phi™ family of products.” – Rob Farber, Teaching the World About Intel Xeon Phi, TechEnablement, September 30, 2014
llllllllllllllllllllllllllllllllll

Share with a friendSign up for future issuesFor more information regarding performance and optimization choices in Intel® software products, visit software.intel.com/en-us/articles/optimization-notice.
33The Parallel Universe
llllllllllllllllllllllllllllllllll
BLOG HIGHLIGHTS
More
Intel® Memory Protection Extensions (Intel® MPX) support in the GNU ToolchainBY IGOR ZAMYATIN »
The invalid memory access problem is commonly found in many C/C++ programs and leads to time-consuming debugging, program instability, and vulnerability. Many attacks exploit software bugs related to inappropriate memory accesses caused by buffer overflow (or buffer overruns). The existing set of techniques and tools to find such memory bugs in the programs and defend them from the attacks are software-only solutions, which result in poor performance of the protected code.
Intel is introducing a new ISA extension called Intel® Memory Protection Extensions (Intel® MPX) to be used for memory protection in applications with low performance overhead. To take advantage of this new extension, changes are required in the OS kernel, binutils, compiler, and system libraries support.
Intel MPX introduces new registers, called ″bound registers,″ to hold bounds for a pointer and instructions to manipulate those registers (for details see the Programming Reference). Therefore, the first step is to implement support for new hardware features in binutils and the GCC.
This paper describes changes in GNU Binutils, GCC, and Glibc to support Intel MPX.

© 2014, Intel Corporation. All rights reserved. Intel, the Intel logo, Intel Core, Cilk, VTune, Xeon, and Xeon Phi are trademarks of Intel Corporation in the U.S. and/or other countries.
*Other names and brands may be claimed as the property of others.Open CL and the OpenCL logo are trademarks of Apple, Inc. used by permission by Kronos.