transformation in action - faurecia
TRANSCRIPT
CAPITAL MARKETS DAY
Paris – November 26, 2019
Transformation in action

Agenda
Capital Markets Day - November 26, 2019 2
Accelerating transition to Clean Mobility Solutions
Faurecia transformation overview 1
Cockpit of the Future enabled by Faurecia Clarion Electronics 2
3
Growth and Resilience 4
Conclusion & Q&A 5
Transformation in action
Patrick Koller Chief Executive Officer

MOBILITY INDUSTRY
AT A TURNING POINT
Mobility industry at the heart of major transformations
Individualism & freedom Rising Asia
Income disparities
Aging population
Environmental issues Women empowerment
Growing urbanization
Millennials aspirations
CARBON NEUTRAL
Connected Autonomous Ride-sharing Electrified
Capital Markets Day - November 26, 2019
GLO
BA
L D
EV
ELO
PM
EN
T C
HA
LLEN
GES
EV
OLV
ING
STR
UC
TUR
E
OF S
OC
IETY
TECHNOLOGY DISRUPTIONS
New energy sources Digitalization & data
science Connected objects
Human & bio-inspired science
4

Main impacts of key trends on Faurecia’s transformation strategy
New products
Accelerate development of innovation for powertrain
electrification and invest in zero emission solutions
Focus on short time-to-market technology bricks for the
Cockpit of the Future adaptable to autonomous driving
New functionalities through integrated electronics
New clients
Rising Asian OEMs and influence of Chinese consumers
Pure EV players
Mobility operators, fleets and cities
New business models
Increased role of personalized user experiences
including direct access to consumer
Upgradeability, retrofit and connected services
Cybersecurity of connected products
CONNECTED
AUTONOMOUS
RIDE-SHARING
ELECTRIFIED
Capital Markets Day - November 26, 2019 5

Faurecia combining strategic transformation and operational excellence
Transformation
& carbon
neutrality
Resilience & execution
Capital Markets Day - November 26, 2019 6
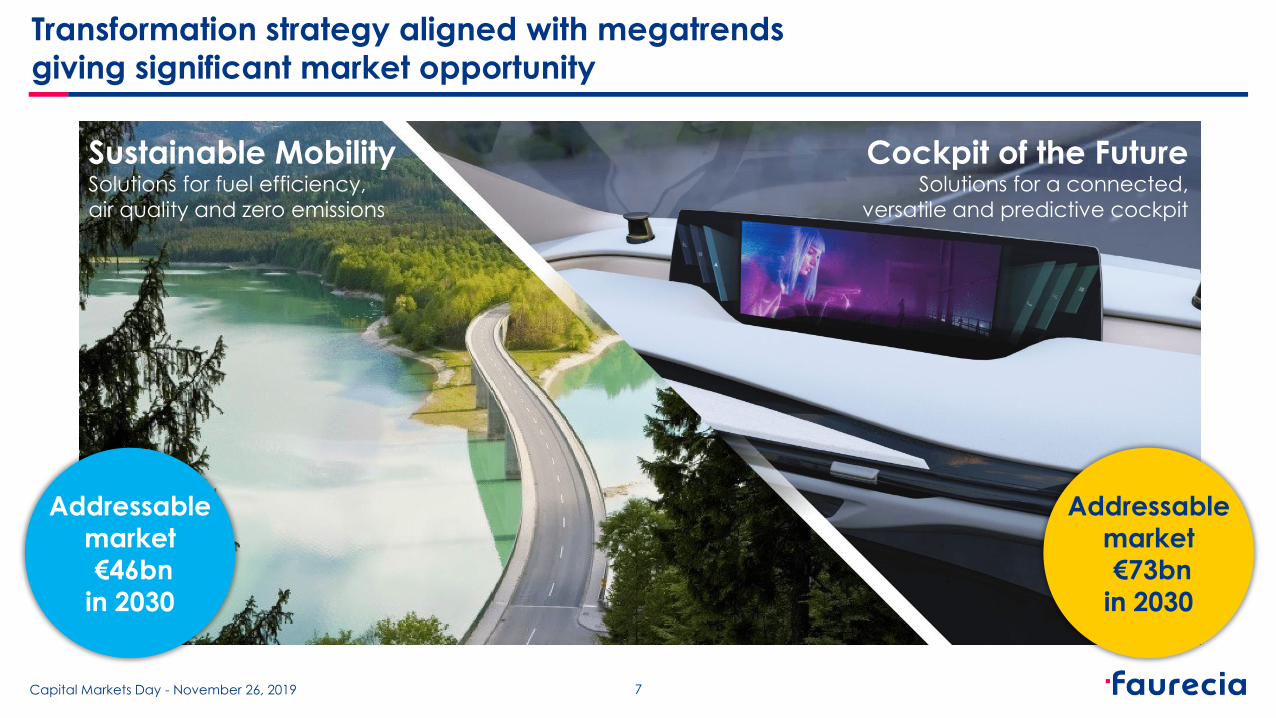
Sustainable Mobility Solutions for fuel efficiency,
air quality and zero emissions
Cockpit of the Future Solutions for a connected,
versatile and predictive cockpit
Transformation strategy aligned with megatrends
giving significant market opportunity
Capital Markets Day - November 26, 2019
Addressable market
€46bn
in 2030
Addressable market
€73bn
in 2030
7
Accelerated investment in broad ecosystem and new competences
SUSTAINABLE MOBILITY
Partnership with Michelin
for fuel cell systems
COCKPIT OF THE FUTURE
Acquisitions of Clarion, Creo Dynamics
and Covatech
Project to acquire SAS
Partnerships with Microsoft,
Aptoide, Devialet and Allwinner
CYBERSECURITY
Investment in Guardknox
and technology platform in Tel Aviv
SINCE MAY 2018 INVESTOR DAY
Capital Markets Day - November 26, 2019 8

SUSTAINABLE MOBILITY COCKPIT OF THE FUTURE
COMMERCIAL VEHICLES
& HIGH HORSEPOWER
PASSENGER
VEHICLES
FUEL CELL ELECTRIC
VEHICLES
DUAL POWER ELECTRIC
VEHICLES
ADAS SMART MATERIALS
COMPLETE SEATS COMFORT
& WELLNESS SOLUTIONS
COVERS
& FOAM SOLUTIONS SEAT STRUCTURE SYSTEMS
INTERIOR MODULES
DECORATION
& INTERIOR LIGHTING
INSTRUMENT PANELS ACOUSTIC
SYSTEMS
COCKPIT DOMAIN
CONTROLLER IMMERSIVE EXPERIENCES
DISPLAY
TECHNOLOGIES
DOOR PANELS
& CENTER CONSOLES
Capital Markets Day - November 26, 2019
Expanded product line offer for Sustainable Mobility and Cockpit of the Future
9 Faurecia Clarion Electronics perimeter

Broader and more diversified customer portfolio
PREMIUM OEMS CHINESE OEMS NEW ENTRANTS MASS MARKET OEMS CV & HHP
Capital Markets Day - November 26, 2019 10

Global approach to Total Customer Satisfaction
Capital Markets Day - November 26, 2019 11
Active listening to understand
Relentless problem resolution
& program excellence
Five-Star experience culture,
demonstrating our customer
commitments
Finance Purchasing Program
Management Plants Sales Engineering HR
PERFORMANCE PERCEPTION
TOTAL CUSTOMER SATISFACTION: EVERYONE, EVERYWHERE, EVERYTIME
Flawless launches
No surprises
Commercial & after sales
"Faurecia Signature"
100% on-time
End-to-end secured capacity
Build in quality
Zero defects at source
Technological edge

> €20.5bn
2019e 2020e 2021e 2022e
Awarded
> €17.5bn Targeted
Current
2014-2016 2015-2017 2016-2018 2017-2019e 2018 2019e
€62bn €63bn €68bn
22% 12%
Traditional
NVS
Expected record 2017-2019 order intake
reflecting continuous market share gains
New Value Spaces order intake
at 22% in 2019 vs. 12% in 2018
Commercial Vehicles and HHP
order intake at > €1.5bn
2 awards for fuel cell tanks and systems
Strong acceleration in FCE order intake
in 2019
Strong profitability of order intake
China expected to resume growth
as from 2020 and remains at the core
of Faurecia's strategy development
CAGR
+5%
€53bn
Record order intake leading to sales of > €20.5bn in 2022
Increasing share for New Value Spaces*
lifetime sales three-year rolling
ORDER INTAKE NVS ORDER INTAKE
Opportunity
12 Capital Markets Day - November 26, 2019 * NVS = 100% FCE + Comfort & Wellness/Advanced safety
for Seating + CV/HHP/Zero emission for Clean Mobility

Delivering on financial targets despite headwinds
through resilience initiatives and cost management
SALES
FY 2019 sales at constant
currencies should outperform
worldwide automotive production
between 150 and 350bps
PROFITABILITY
FY 2019 operating income
should increase in value
and operating margin
should be at least 7% of sales
NET CASH FLOW
FY 2019 net cash flow
should be at least €500m
(including Clarion consolidation
as from April 1) (excluding Clarion consolidation) (including Clarion consolidation
as from April 1)
All financial targets met in 2018 despite headwinds in H2
2019 targets confirmed despite market deterioration throughout the year:
currently estimated at c. -6% versus c. -1% estimated in February
Capital Markets Day - November 26, 2019 13
Currency assumptions: USD/€ @ 1.13 and CNY/€ @ 7.71, on average

Strong Convictions are the basis of our CSR approach
WE ARE CONVINCED THAT
Environmental
issues pose a serious challenge for humanity
Companies must
have a positive impact on society
The world is in a
state of permanent disruption
Power must
have a counterbalance
Diversity is a strength
Short-term thinking
jeopardizes future generations
"As a company, we believe that acting responsibly is key to ensure the sustainable development of our ecosystem for the future generations.
By acting responsibly,
we create long-term value
for all our stakeholders
and ensure the
sustainability of our business and the planet.
This is the reason
why we have defined
our Convictions"
14
Capital Markets Day - November 26, 2019

Carbon Neutral by 2030
Faurecia Foundation for mobility, education and environment
Strategic innovation for Sustainable Mobility and Cockpit of the Future
Inclusive Culture to attract, develop and retain diverse talents
Total Customer Satisfaction for long term partnerships
Learning Organization to anticipate
future disruption
Companies
must have
a positive impact
on society
The world
is in a state
of permanent
disruption
Power
must have a
counterbalance
Diversity
is a strength
Short-term
thinking
jeopardizes
future
generations
Capital Markets Day - November 26, 2019
Six transversal initiatives to respond to our Convictions
and to anticipate the next disruption
15
Environmental
issues pose a
serious challenge
for humanity

PSA has been an active and supportive shareholder for Faurecia over the years
The combination of PSA and FCA would create the #1 customer for Faurecia,
similar in size to VW Group, providing new opportunities for value through
platforms, innovation and footprint
Faurecia would benefit from an enhanced market profile, based on a larger
free float, increased liquidity and higher visibility
Faurecia continues to focus on deploying its strategy
Capital Markets Day - November 26, 2019 16
Implications of PSA-FCA merger project
Targets will be achieved despite significantly lower than expected market volumes:
2022 volumes forecasted at a lower level than 2020 volumes estimated in May 2018
Market assumptions: 2020 volume slightly negative vs. 2019 and c. +1% in 2021 and 2022
Record targets for sales, profitability and cash generation in 2022
Capital Markets Day - November 26, 2019 17
2022 FINANCIAL TARGETS
NET CASH FLOW
4% of sales
OPERATING
MARGIN
8% of sales
SALES
> €20.5bn

Takeaways
Faurecia strategy for the Cockpit of the Future and Sustainable Mobility
is relevant and is being deployed at a sustained pace
Maintaining a good balance between execution and transformation allows
Faurecia to deliver its financial targets even in a difficult environment
Faurecia is ready for the next chapter in its development
Capital Markets Day - November 26, 2019 18
Cockpit of the Future
enabled by Faurecia
Clarion Electronics
Mathieu Devillard SVP Cockpit of the Future

Cockpit of the Future Vision
20 Capital Markets Day - November 26, 2019

FAURECIA LEADING POSITION IN SEATING…

… AND INTERIORS

Advanced safety
Perceived quality
& seamless integration
Comfort
Acoustics
& sound management
Thermal management
Ambient lighting
Smart surfaces
COMPETENCES

CREATION OF FAURECIA CLARION ELECTRONICS

Electronics & software
Sensors & computer vision
Artificial Intelligence
& connected solutions
Systems integration
Display integration
COMPETENCES

PROJECT TO ACQUIRE SAS

Full interior systems
architecture
Expanded systems
integration offer
for all interior modules
Expanded network
of just-in-time and
just-in-sequence delivery
COMPETENCES

STRONG INNOVATION ECOSYSTEM

5acXjzUk 29
… TO ENABLE THE COCKPIT OF THE FUTURE VISION

Cockpit of the Future
enabled by Faurecia
Clarion Electronics
Jean-Paul Michel Deputy EVP Faurecia Clarion Electronics
Frantz Lohier CTO Faurecia Clarion Electronics

Faurecia Clarion Electronics integrates recent acquisitions
of Clarion, Parrot, Coagent, Covatech and Creo Dynamics
Mexico
France
Hungary
Sweden
India
China Japan
Thailand
Malaysia R&D Center
Manufacturing in development
US
NORTH AMERICA
19% of sales
1,600 people
EUROPE
11% of sales
800 people
JAPAN AND REST OF ASIA
47% of sales
2,400 people
CHINA
23% of sales
2,300 people
31 Capital Markets Day - November 26, 2019
Best-in-class global manufacturing and engineering footprint
100m+ vehicles equipped worldwide
Over 10 years of experience with
Embedded Android
1,600 engineers 7,100 employees o/w 70% in LCC
€1bn sales
(proforma* 2019e)
*April to Dec. 2019 sales + additional estimated 3 months sales
Four product lines aligned with Cockpit of the Future and Sustainable Mobility
32 Capital Markets Day - November 26, 2019
No legacy business and key positioning on high-growth segments
DISPLAY
TECHNOLOGIES
COCKPIT DOMAIN
CONTROLLER
IMMERSIVE
EXPERIENCES ADAS
Small & Medium
Displays
Large & Multiple Display
Modules
e-Mirror & Surround
View Systems
Automated
& Autonomous
Parking Systems
Advanced Driving
Systems
In-Vehicle Infotainment
Rear Seat Entertainment
Systems
Universal/Remote Tuner
Apps Store
Sound Systems
& Branded Audio
Occupant Monitoring
Systems
Personalized Cockpit
Experiences
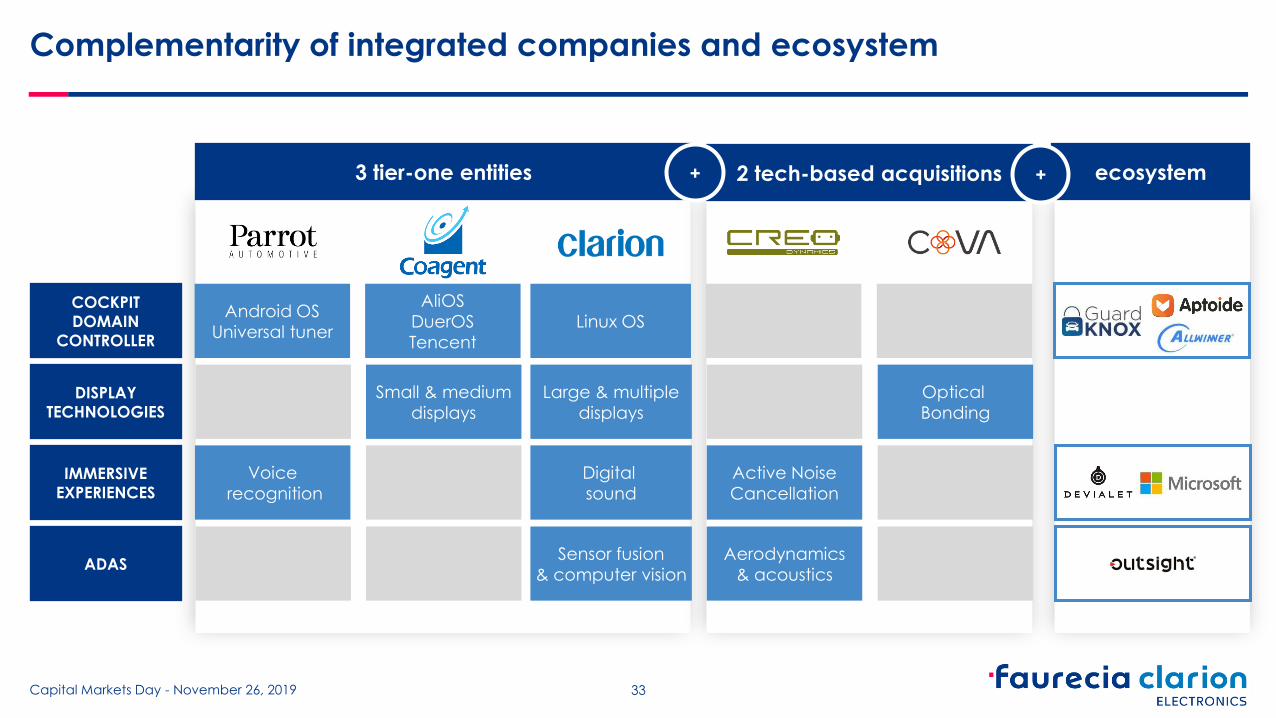
Complementarity of integrated companies and ecosystem
3 tier-one entities 2 tech-based acquisitions ecosystem + +
33 Capital Markets Day - November 26, 2019
COCKPIT
DOMAIN
CONTROLLER
IMMERSIVE
EXPERIENCES
ADAS
DISPLAY
TECHNOLOGIES
AliOS
DuerOS
Tencent
Linux OS Android OS
Universal tuner
Digital
sound
Active Noise
Cancellation
Sensor fusion
& computer vision
Aerodynamics
& acoustics
Small & medium
displays
Optical
Bonding
Large & multiple
displays
Voice
recognition

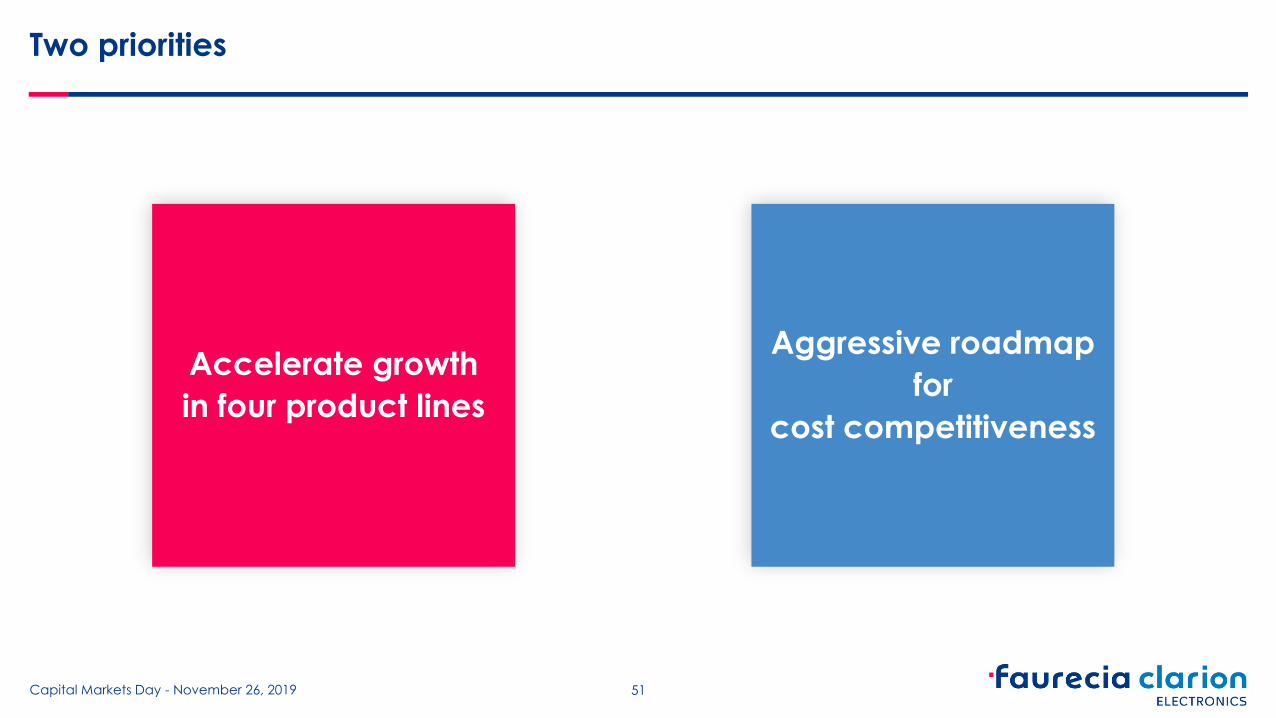
Two priorities
34 Capital Markets Day - November 26, 2019
Accelerate growth
in four product lines
Aggressive roadmap
for
cost competitiveness
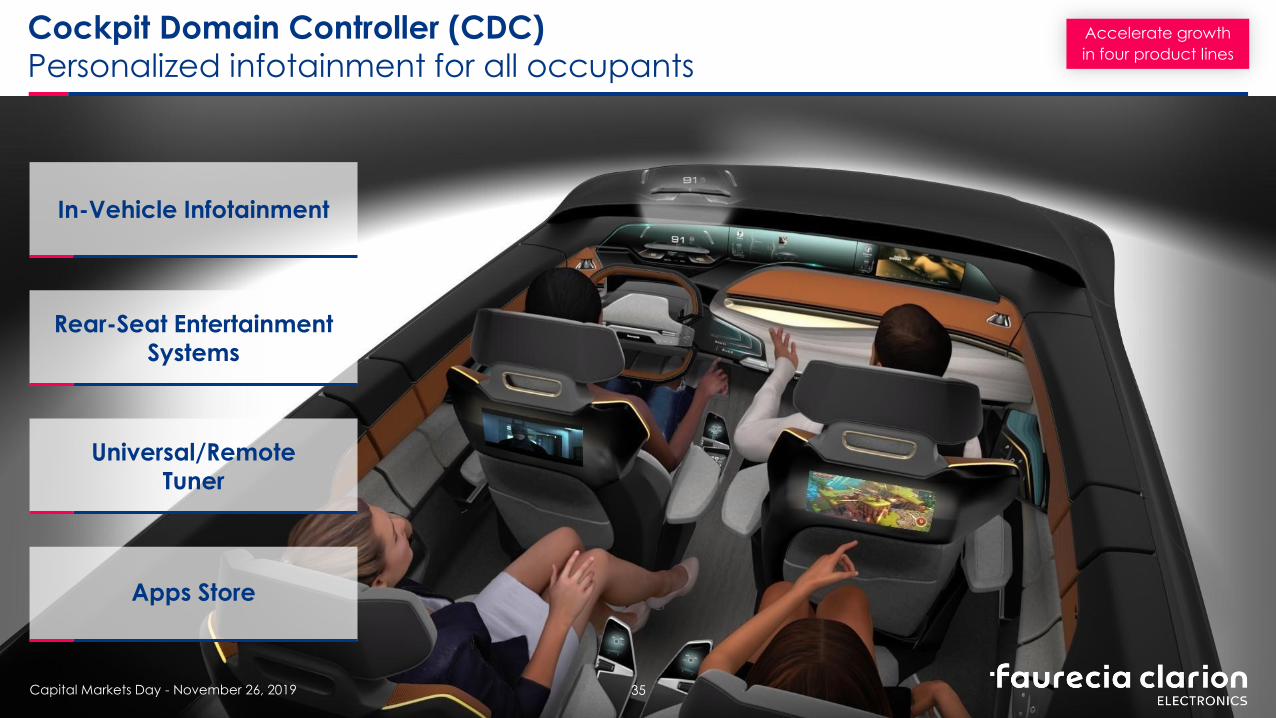
Cockpit Domain Controller (CDC)
Personalized infotainment for all occupants
In-Vehicle Infotainment
Rear-Seat Entertainment
Systems
Universal/Remote
Tuner
Apps Store
35 Capital Markets Day - November 26, 2019
Accelerate growth
in four product lines

Cockpit Domain Controller (CDC)
Market Segments & Portfolio M
AR
KET
TREN
DS
PR
OD
UC
T D
ESC
RIP
TIO
N
MARKET SIZE 2025
3 primary segments:
Premium: IVI & Cluster powered
by single hardware managing
several displays
Mid-range: embedded
navigation system
Entry range: display audio
for smartphone mirroring only
Dedicated infotainment ECU
and displays for rear seats
Radio ECU with universal
support standard (FM, DAB,
HD radio, etc.)
Stand-alone product
for reduced system cost
through cabling optimization
Base of downloadable apps
allowing new revenue streams
shared between OEMs, app
creators and app store
Payment infrastructure
for monetization
of pay-as-you-go use cases
CAGR 20-25
Increase in Android penetration
from 24% in 2019 to 42%
in 2025
HW/SW unbundling, with entry
of EMS players on build-to-print
Mostly option market for large
& premium vehicles segment
Increasing computing
capabilities creating
opportunities for apps
and games
Increase in penetration
from 3% in 2019 to 12% in 2025
driven by OEM’s desire to:
- Simplify CDC evolutions (tuning
system more stable over time)
- Simplify antenna management
Increase in Android penetration
from 24% in 2019 to 42%
in 2025
28% of vehicles equipped
with apps store in 2025
(premium and mid-range IVI)
+4% +3% +27% +18% €17,100m €300m €600m €300m
36 Capital Markets Day - November 26, 2019
IN-VEHICLE
INFOTAINMENT (IVI)
REAR-SEAT
ENTERTAINMENT SYSTEMS
UNIVERSAL/
REMOTE TUNER
APPS
STORE
Accelerate growth
in four product lines
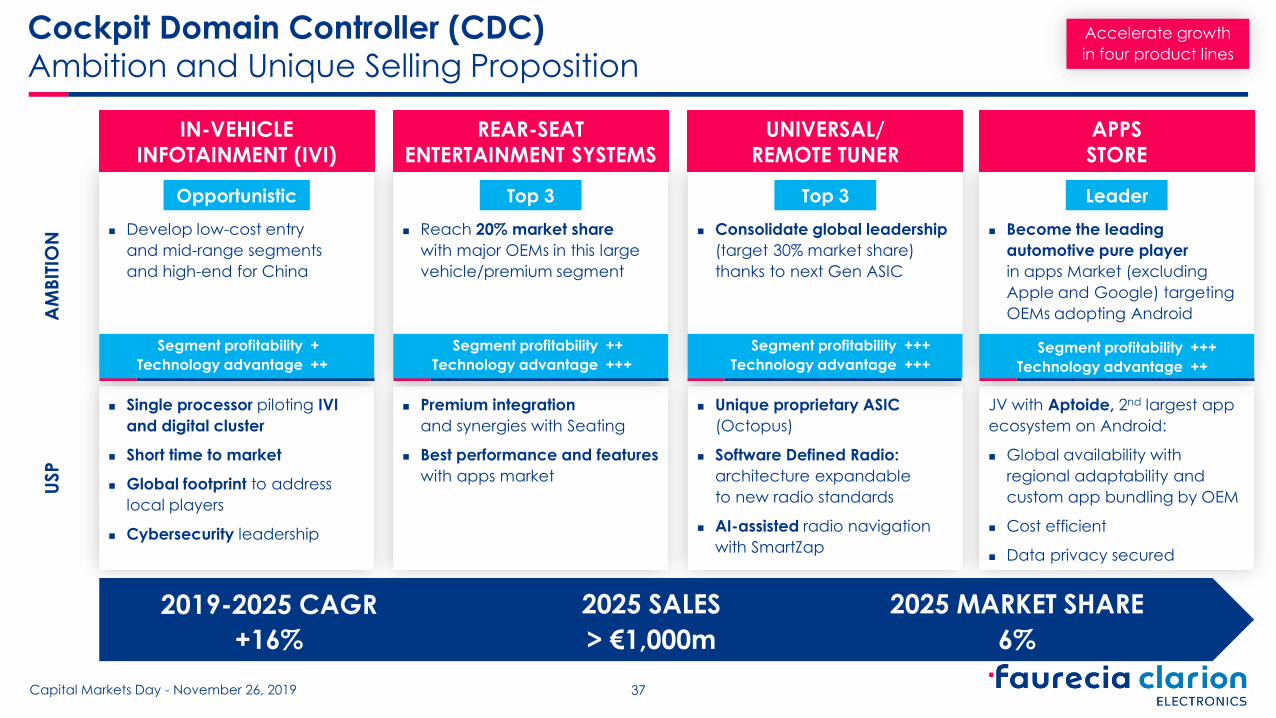
Cockpit Domain Controller (CDC)
Ambition and Unique Selling Proposition U
SP
A
MB
ITIO
N
Develop low-cost entry
and mid-range segments
and high-end for China
Reach 20% market share
with major OEMs in this large
vehicle/premium segment
Consolidate global leadership
(target 30% market share)
thanks to next Gen ASIC
Become the leading
automotive pure player
in apps Market (excluding
Apple and Google) targeting
OEMs adopting Android
+16%
Opportunistic Top 3 Top 3
Single processor piloting IVI
and digital cluster
Short time to market
Global footprint to address
local players
Cybersecurity leadership
Premium integration
and synergies with Seating
Best performance and features
with apps market
Unique proprietary ASIC
(Octopus)
Software Defined Radio:
architecture expandable
to new radio standards
AI-assisted radio navigation
with SmartZap
JV with Aptoide, 2nd largest app
ecosystem on Android:
Global availability with
regional adaptability and
custom app bundling by OEM
Cost efficient
Data privacy secured
2019-2025 CAGR
37 Capital Markets Day - November 26, 2019
Leader
IN-VEHICLE
INFOTAINMENT (IVI)
UNIVERSAL/
REMOTE TUNER
APPS
STORE
+
++
++
+++
+++
+++
+++
++
> €1,000m
2025 SALES
6%
2025 MARKET SHARE
REAR-SEAT
ENTERTAINMENT SYSTEMS
Segment profitability
Technology advantage
Segment profitability
Technology advantage
Segment profitability
Technology advantage Segment profitability
Technology advantage
Accelerate growth
in four product lines

Display Technologies
Highly customizable advanced display solutions
38 Capital Markets Day - November 26, 2019
Small & Medium
Displays
Large & Multiple Display
Modules
Accelerate growth
in four product lines
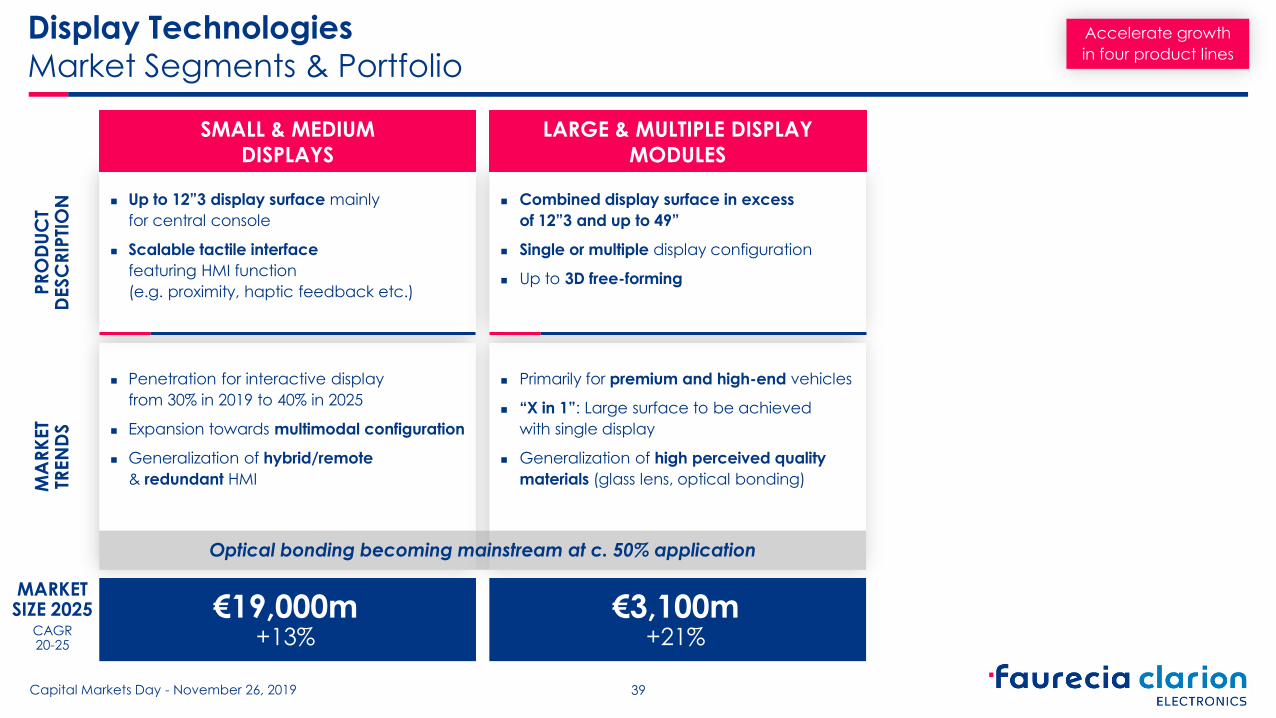
Display Technologies
Market Segments & Portfolio P
RO
DU
CT
DESC
RIP
TIO
N
MARKET SIZE 2025
CAGR 20-25
Up to 12”3 display surface mainly
for central console
Scalable tactile interface
featuring HMI function
(e.g. proximity, haptic feedback etc.)
Penetration for interactive display
from 30% in 2019 to 40% in 2025
Expansion towards multimodal configuration
Generalization of hybrid/remote
& redundant HMI
+13% €19,000m
Combined display surface in excess
of 12”3 and up to 49”
Single or multiple display configuration
Up to 3D free-forming
Primarily for premium and high-end vehicles
“X in 1”: Large surface to be achieved
with single display
Generalization of high perceived quality
materials (glass lens, optical bonding)
+21% €3,100m
Optical bonding becoming mainstream at c. 50% application
39 Capital Markets Day - November 26, 2019
MA
RK
ET
TREN
DS
SMALL & MEDIUM
DISPLAYS
LARGE & MULTIPLE DISPLAY
MODULES
Accelerate growth
in four product lines

Display Technologies
Ambition and Unique Selling Proposition
Focus on integration capabilities
and key-accounts
Enhanced features: high dynamic range
displays, invisible borders, shape on glass,
transparent substrate
Leader in large and 3D-Shaped display
configurations (XL & “X in 1”)
First pillar-to-pillar XL Display in SOP
Enhanced features: multi-radius XL cover
lens, 3D shape bonding, multi-functional
structural parts
USP
A
MB
ITIO
N
40 Capital Markets Day - November 26, 2019
SMALL & MEDIUM
DISPLAYS
LARGE & MULTIPLE DISPLAY
MODULES
Opportunistic Top 3
* Mainly for large & multiple display modules
Leadership position in optical bonding,
investment in glass forming
and advanced backlighting
Comprehensive integration
and materials expertise with Interiors
and Seating for structural,
mechanical and safety constraints
Capacity to develop differentiated
designs for brand specific
visual experience/immersion
DIFFERENTIATING TECHNOLOGY
& INTEGRATION EXPERTISE
Segment profitability
Technology advantage
+
+
Segment profitability
Technology advantage
+++
+++
+34%
2019-2025 CAGR
€500m
2025 SALES
>10%*
2025 MARKET SHARE
Accelerate growth
in four product lines

Immersive eXPeriences (IXP)
Improved and individualized in-car experience
41 Capital Markets Day - November 26, 2019
Sound Systems
& Branded Audio
Occupant Monitoring
Systems
Personalized Cockpit
Experiences
Accelerate growth
in four product lines

Immersive eXPeriences (IXP)
Market Segments and Portfolio P
RO
DU
CT
DESC
RIP
TIO
N
MA
RK
ET
TREN
DS
42 Capital Markets Day - November 26, 2019
OCCUPANT MONITORING
SYSTEMS
PERSONALIZED COCKPIT
EXPERIENCES
Sensor data fusion and artificial intelligence
for cockpit experiences including:
Thermal management
Comfort & well-being
Ambient lighting
Immersive entertainment
Advanced safety
Advanced functions by 2025
Consumer demand for increased
personalization
Combination of functions driving
individualized experiences enabled by AI
Camera-based measure of driver
drowsiness and distraction, recognition,
gesture control
High-frequency radar for child presence
detection
Other sensors (near infrared, biometrics…)
for data fusion
Safety regulations: e.g. Euro NCAP
from 2022/2024, US in 2023
Advanced personalization functionalities
for high-end segments by 2025
Business take-off
from 2025 +50% €2,700m
MARKET SIZE 2025
CAGR 20-25
SOUND SYSTEMS
& BRANDED AUDIO
Active Noise Cancellation (ANC)
for engine and road noise
Local ANC, IP & telephony for smart headrests
Exciters for sound surfaces, replacing
or supplementing traditional speakers
High-end bundled solutions (transducers,
dedicated ECU, sound IP & brand licenses)
ANC Penetration from 19% to 48% in 2025
Sound zoning to start on premium vehicles
before 2025
FCE to pioneer exciters market from 2021,
penetration could reach 50% by 2030
High market growth in China
for bundled solutions
+4% €6,000m
Accelerate growth
in four product lines

Immersive eXPeriences (IXP)
Ambition and Unique Selling Proposition
43 Capital Markets Day - November 26, 2019
USP
A
MB
ITIO
N
* For sound systems (excl. branded audio – market size
estimated at €5.3 bn) and occupant monitoring systems
Leader in camera-based occupant
monitoring system
Interior radar for child detection
Best-in-class low-cost recognition software
Compact, cost-competitive, fully
integrated cameras
Cockpit sensor integration based on
Interiors and Seating experience
Original application software
for child detection
Leader in user experiences
for Cockpit of the Future
with full systems integration
Personalization algorithms based on
self-learning/AI
Breakthrough comfort personalization
leveraging Interiors and Seating expertise
Leader Leader
Segment profitability
Technology advantage
+++
+++
Segment profitability
Technology advantage
++
+++
OCCUPANT MONITORING
SYSTEMS
PERSONALIZED COCKPIT
EXPERIENCES
Leader smart headrest and ANC algorithms
First sound surface solution available
from 2021
Develop a portfolio of audio brands
ANC expertise for all cockpit
configurations
Interiors and Seating integration capability
First automotive grade exciters
with integrated speakers
(30-40% cost and space benefit)
Devialet partnership for premium audio
brand
Niche
Segment profitability
Technology advantage
++
++
SOUND SYSTEMS
& BRANDED AUDIO
+28%
2019-2025 CAGR
€330m
2025 SALES
>10%*
2025 MARKET SHARE
Accelerate growth
in four product lines

Advanced Driver Assistance Systems (ADAS)
Enhanced safety & convenience
44 Capital Markets Day - November 26, 2019
e-Mirror
& Surround View Systems
Automated & Autonomous
Parking Systems
Advanced Driving
Systems
Accelerate growth
in four product lines

ADVANCED DRIVING
SYSTEMS
Advanced Driver Assistance Systems (ADAS)
Market Segments and Portfolio P
RO
DU
CT
DESC
RIP
TIO
N
MARKET SIZE 2025
CAGR 20-25
E-MIRROR & SURROUND VIEW
SYSTEMS
AUTOMATED & AUTONOMOUS
PARKING SYSTEMS
45 Capital Markets Day - November 26, 2019
MA
RK
ET
TREN
DS
+3% €2,000m
+66% €1,500m
e-Mirrors driven by a favorable evolution
of regulation, CO2 and fuel economy
(up to 3% for large commercial vehicles) ;
take-off as from 2023
Cameras to progressively switch from analog
to digital with better image quality
Autoparking penetration reaching 24%
in 2025 with increasing development
of camera-based solutions
Autonomous pickup recently introduced
Expansion into luxury/premium segments
in the coming years
Increasing end customer appetence
and regulatory push
e-Mirrors
Surround view systems, based on
4-6 cameras per vehicle
Rear view system, based on 1 camera
Sensor cleaning systems for cameras,
radars, lidars
Automated parking: camera-based
system enabling to park the car
in all configurations
Autonomous pickup: camera-based
system enabling the car to pick up
the driver on a parking lot
High-performance ECU and advanced
software unlocking safety & comfort L2+
functions; notably:
Adaptive cruise control,
Automatic lane change,
Pedal misapplication mitigation
Blind spot detection
Ambition to be
defined in Q1 2020
Accelerate growth
in four product lines

Advanced Driver Assistance Systems (ADAS)
Ambition and Unique Selling Proposition
Be an innovator in the camera market
Lead the e-mirror business, leveraging
FCE and Interiors competences
Be one of the leaders leveraging computer
vision and sensor fusion technologies
Co-development with specific customers
to start soon
46 Capital Markets Day - November 26, 2019
USP
A
MB
ITIO
N Top 3 Ambition to be defined in Q1 2020 Top 3
Camera: best image quality & cleaning
(e.g. definition, lenses selection), integration
(e.g. small form factor, flexible connectivity)
and competitive pricing
e-Mirror: early entry, track record
in Surround View, integration into cockpit
Performance and features ahead
of competition: 3D vision, Surround View
for trailer solution
Performance and features ahead
of competition:
geolocation, speed and accuracy,
all parking types and vehicle direction
ADVANCED DRIVING
SYSTEMS
E-MIRROR & SURROUND VIEW
SYSTEMS
AUTOMATED & AUTONOMOUS
PARKING SYSTEMS
Computer vision and sensor fusion expertise
developed for Low-speed ADAS solutions
(e.g. Surround View & Autoparking)
Faurecia AI capabilities for
moving object/pedestrian detection
behavior prediction
vehicle control & multi-path planning
Segment profitability
Technology advantage
++
+++
Segment profitability
Technology advantage
++
+++
+17%
2019-2025 CAGR
€420m
2025 SALES
>10%*
2025 MARKET SHARE
* For e-mirror & surround view systems
and automated & autonomous parking systems
Accelerate growth
in four product lines

FCE leverages a pioneer position in Surround View
47 Capital Markets Day - November 26, 2019
LEADING PERFORMANCE IN AUTOPARKING
Nissan Motor Co., Ltd. will introduce the
world's first Around View Monitor, which
offers the driver a bird’s eye view of the
vehicle and its surroundings in real-time. In
Japan, the Around View Monitor will debut
in the new Elgrand, scheduled for
introduction at the end of this month. The
technology will also be offered to the U.S
market on the all new Infiniti EX35
scheduled for launch this December.
The Around View Monitor system
synthesizes a bird’s eye image of the
vehicle and its surrounding from four
ultrawide-angle (180-degree) high-
resolution cameras mounted on the front,
sides and rear of the vehicle. The Around
View Monitor is particularly helpful when
parking, enabling the driver to steer easily
and precisely into a parking space…
Vehicle 1 Vehicle 2 Vehicle 3 Vehicle 4 Nissan
Leaf (FCE)
Detection sucess rate 20% 30% 30% 40% 75%
Manoeuver success rate 10% 35% 66% 80% 80%
Detection x Manoeuver
success rate 2% 11% 20% 32% 60%
Parallel parking time 1 – 2 minutes 35 – 45 seconds
Perpendicular parking time > 3 minutes 60 – 90 seconds
Driver intervention Yes No
NISSAN TO INTRODUCE WORLD'S FIRST AROUND VIEW MONITOR NISSAN TOKYO (Oct. 12, 2007)
Accelerate growth
in four product lines

Techno-bricks enabling the Cockpit of the Future
REAR SEAT
ENTERTAINMENT
REMOTE TUNER
COCKPIT
DOMAIN
CONTROLLER
SOFTWARE
SOLUTIONS
& SERVICES
SMART HEADREST
SOUND DOMAIN
CONTROLLER
AUTONOMOUS
PARKING ECU
COCKPIT
AUDIO SYSTEMS
DISPLAYS
E-MIRROR
Cockpit Domain Controller
Displays
Immersive Experiences
ADAS
CAMERA - RADAR
SYSTEMS & SOLUTIONS
48 Capital Markets Day - November 26, 2019
Accelerate growth
in four product lines

2019 PF 2022 2025
Strong growth in sales with selective management of order intake
Capital Markets Day - November 26, 2019
Non-OEM*
ADAS
CDC
Sales in € bn
CAGR +16%
49
2.5
1.6
IXP
Displays
*Non-OEM business represents audio and surround view business for buses,
fleets, trucks and off-highway in Japan, and global EMS business
2019
1.9
2020
2.1
2021
2.3
Targeted order intake
compared to accessible RFQs
Accessible RFQs Order intake
1.0
Strong order intake in 2019
demonstrates FCE capacity
to accelerate growth
Targeted order intake in 2020
and 2021:
Very achievable given
increase in accessible RFQs
Securing €1.6 bn of sales in 2022
Selectivity in order intake
to protect cash and manage
R&D expenses
Accelerate growth
in four product lines

Expansion in customer portfolio and increased content
per vehicle drive growth of addressable market
50 Capital Markets Day - November 26, 2019
72%
13%
15%
2019PF sales €1bn
45%
37%
2025 sales
€2.5bn
18%
C-OEM
J-OEM
I-OEM
Increased accessible market from 30m
vehicles in 2019 to 75m vehicles in 2025
through enlarged customer portfolio,
from primarily Japanese OEMs to all
international OEMs
2019 2025
€260
€520
x 2
DIVERSIFICATION OF CUSTOMER PORTFOLIO
INCREASE IN CONTENT PER VEHICLE Faurecia content per vehicle
increase mainly driven by expansion
in fast-growing market segments
such as large and multiple displays,
e-mirrors, surround view and automated
parking
Accelerate growth
in four product lines
Two priorities
Accelerate growth
in four product lines
Aggressive roadmap
for
cost competitiveness
51 Capital Markets Day - November 26, 2019
IDENTIFICATION
OF COMPETITIVE
GAP
QUICK WINS MINDSET
TRANSFORMATION
MID-TERM
PROFITABILITY
IMPROVEMENT
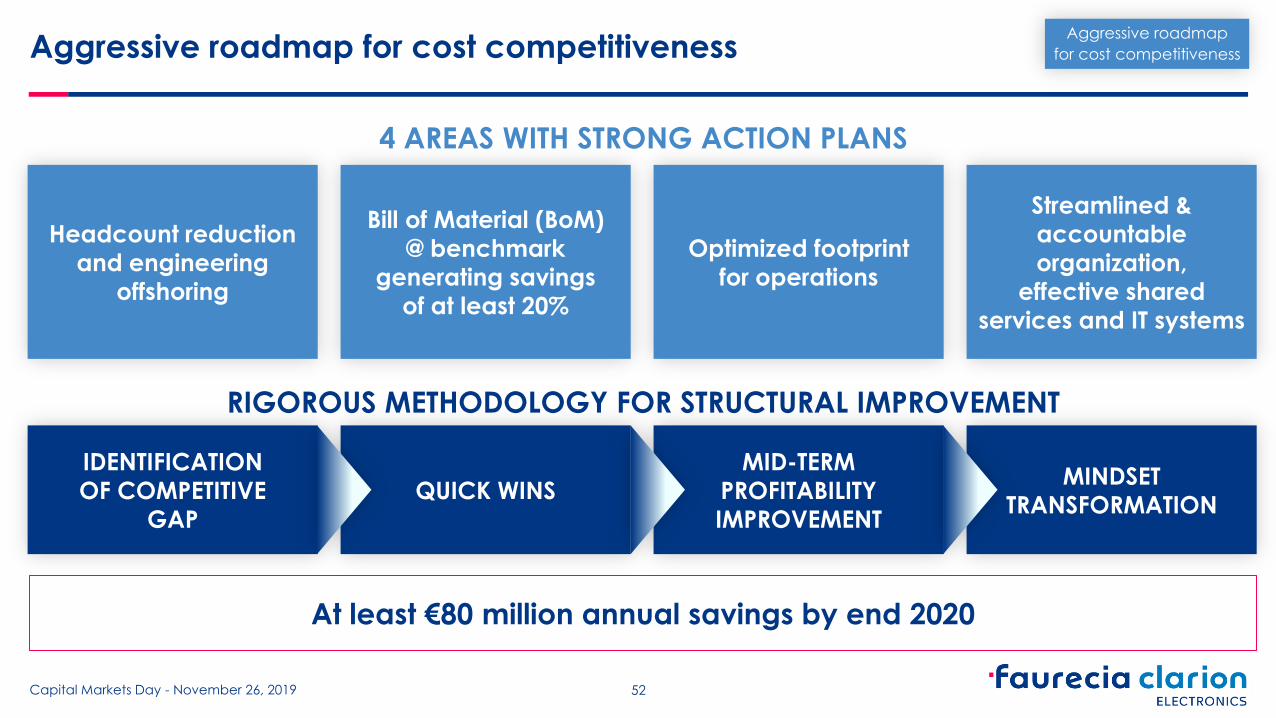
Aggressive roadmap for cost competitiveness
52 Capital Markets Day - November 26, 2019
Headcount reduction
and engineering
offshoring
Bill of Material (BoM)
@ benchmark
generating savings
of at least 20%
Streamlined &
accountable
organization,
effective shared
services and IT systems
Optimized footprint
for operations
4 AREAS WITH STRONG ACTION PLANS
RIGOROUS METHODOLOGY FOR STRUCTURAL IMPROVEMENT
At least €80 million annual savings by end 2020
Aggressive roadmap
for cost competitiveness
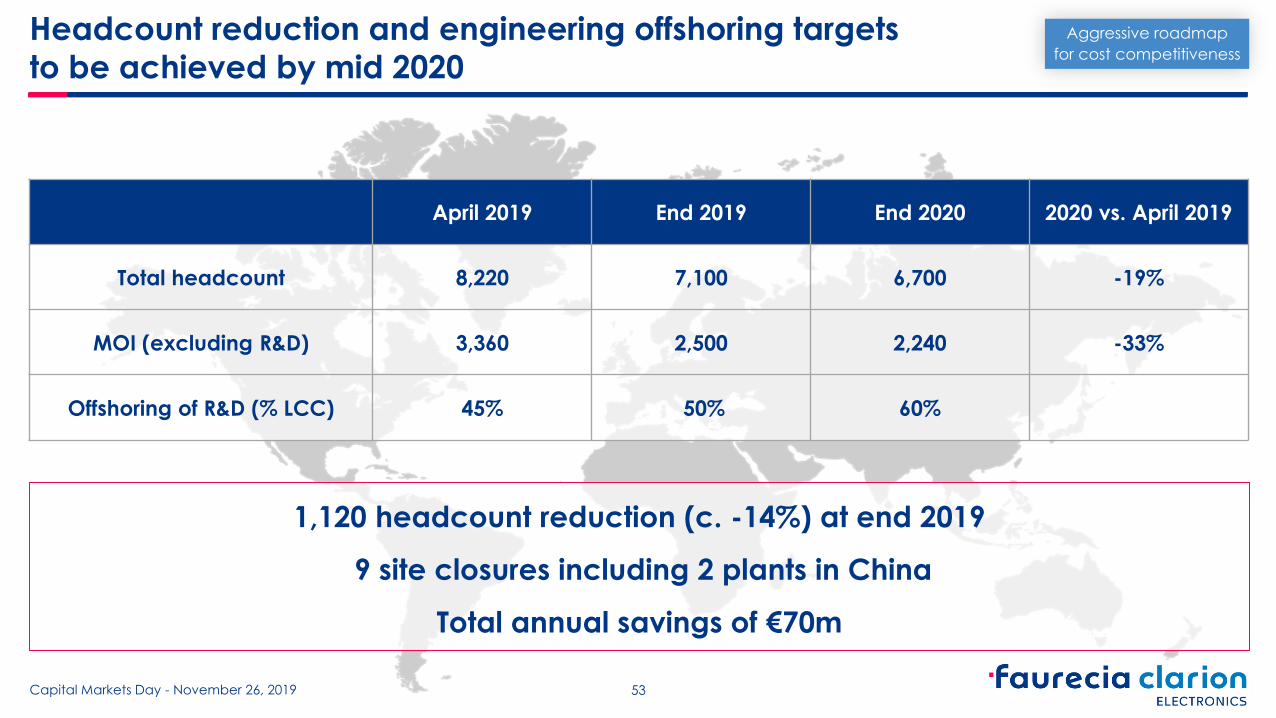
53 Capital Markets Day - November 26, 2019
Headcount reduction and engineering offshoring targets
to be achieved by mid 2020
April 2019 End 2019 End 2020 2020 vs. April 2019
Total headcount 8,220 7,100 6,700 -19%
MOI (excluding R&D) 3,360 2,500 2,240 -33%
Offshoring of R&D (% LCC) 45% 50% 60%
1,120 headcount reduction (c. -14%) at end 2019
9 site closures including 2 plants in China
Total annual savings of €70m
Aggressive roadmap
for cost competitiveness
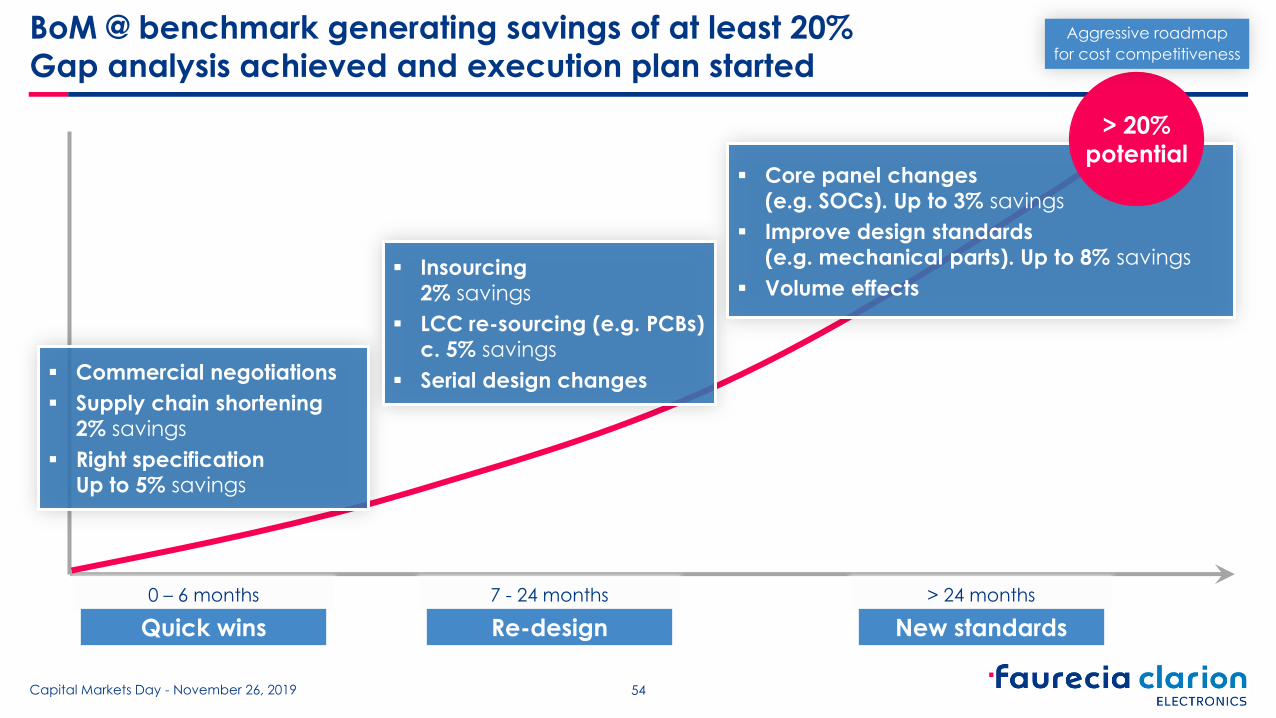
BoM @ benchmark generating savings of at least 20%
Gap analysis achieved and execution plan started
0 – 6 months 7 - 24 months > 24 months
Quick wins Re-design New standards
54 Capital Markets Day - November 26, 2019
Commercial negotiations
Supply chain shortening
2% savings
Right specification Up to 5% savings
Insourcing
2% savings
LCC re-sourcing (e.g. PCBs)
c. 5% savings
Serial design changes
Core panel changes
(e.g. SOCs). Up to 3% savings
Improve design standards
(e.g. mechanical parts). Up to 8% savings
Volume effects
> 20%
potential
Aggressive roadmap
for cost competitiveness

France
Mexico
China
Hungary
Thailand
India
Japan
Malaysia
55 Capital Markets Day - November 26, 2019
Optimized footprint for operations underway
Fully leverage global footprint
to produce close to customers
and simplify the supply chain
Concentrate regional SMT lines
in single LCC plant per region
(20% cost saving, 50% safety
stock reduction)
Drive economies of scale
through massification
Consolidate global component
production (e.g. cameras) in single
LCC plant (up to 30% VA reduction)
Productivity @ benchmark
More than €10m annual savings expected
Aggressive roadmap
for cost competitiveness

Streamlined and accountable organization,
effective shared services and IT systems
4 global product lines to lead the strategy definition
Define global product roadmaps
Understand market trends and technology landscape
4 regional divisions to drive execution
Provide focus on customer intimacy and order intake
Attract local talents
Manage operations close to customers
Global R&D for cost-efficient development
Leverage Faurecia shared services and systems
to provide efficient backbone
56 Capital Markets Day - November 26, 2019
Clear accountability and performance mindset
Regional
divisions
Global
product
lines
P&L and
cash
P&L and
cash
Aggressive roadmap
for cost competitiveness

Robust roadmap for profitable growth through selective order intake,
aggressive cost competitiveness and strong cash management
In €m 2019PF 2022 2025
Sales 1,000 1,600 2,500
CAGR vs. 2019PF +17% +16%
EBIT as % of sales ≥ 2% ≥ 6% 8%
Net cash flow Neutral Neutral ≥ 100
(4% of sales)
57 Capital Markets Day - November 26, 2019

Takeaways
FCE is aligned with strategy for the Cockpit of the Future and Sustainable Mobility.
The unique combination of FCE and CoF will drive strong profitable growth
Sales growth driven by enlarged customer portfolio and increased content per vehicle
2019-2022: Resume growth in sales with managed selective order intake
2022-2025: Profitable growth boosted by new fast-growing market segments
and differentiating technology
Profitability secured through realistic volume growth and aggressive cost
competitiveness plan (at least €80m annual savings by end 2020)
Our two priorities enable FCE to reach €2.5 billion of sales and 8% profitability in 2025
58 Capital Markets Day - November 26, 2019
Accelerating transition
to Clean Mobility
Solutions
Mathias Miedreich EVP Faurecia Clean Mobility
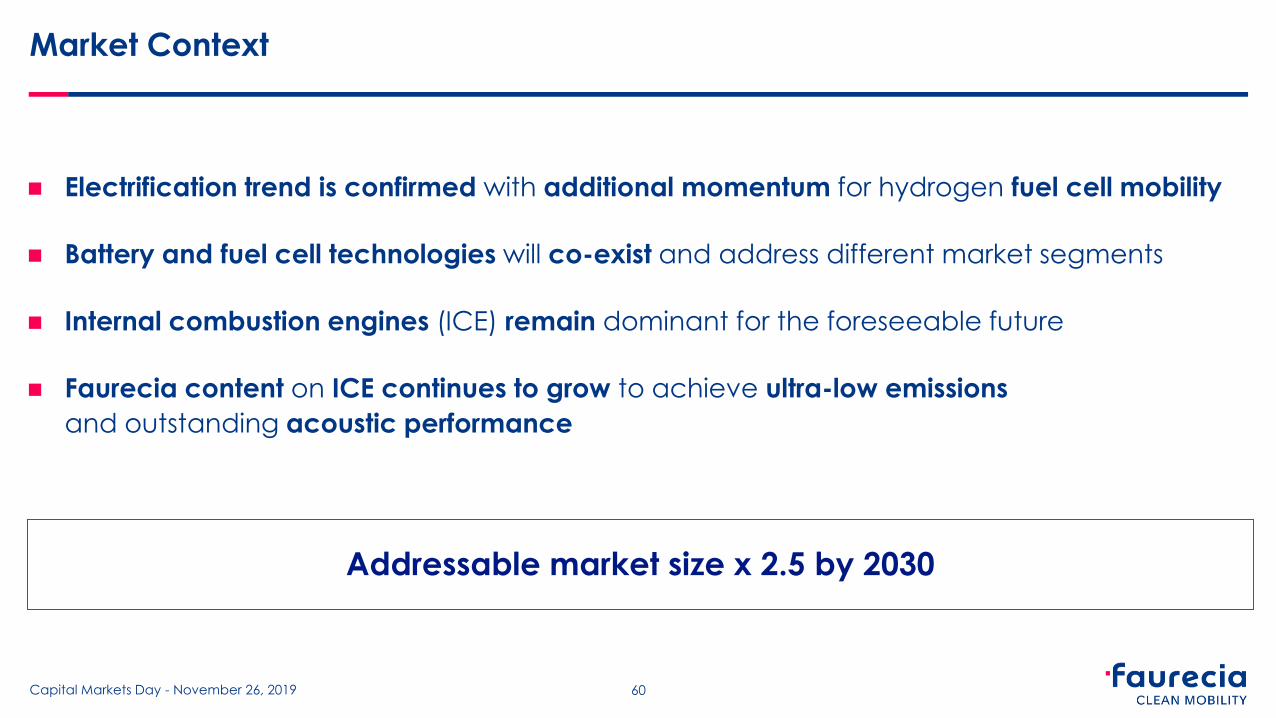
Market Context
Electrification trend is confirmed with additional momentum for hydrogen fuel cell mobility
Battery and fuel cell technologies will co-exist and address different market segments
Internal combustion engines (ICE) remain dominant for the foreseeable future
Faurecia content on ICE continues to grow to achieve ultra-low emissions
and outstanding acoustic performance
Addressable market size x 2.5 by 2030
60 Capital Markets Day - November 26, 2019

Light Vehicle Powertrain Mix Scenarii Rise of EV and resistance of ICE confirmed under all considered scenarii
LIGHT VEHICLES: GLOBAL POWERTRAIN MIX TO 2030
IHS
2020 2025 2030
10%
37%
40%
13%
2020 2025 2030 2020 2025 2030
BCG
Faurecia Fast Electrification
ICE diesel ICE Hybrid Battery EV Fuel Cell EV ICE gasoline
5%
47%
34%
14% 5%
25%
34%
29%
7%
61 Capital Markets Day - November 26, 2019
2020 2025 2030 2020 2025 2030 2020 2025 2030
Citigroup
McKinsey Baseline
McKinsey Fast Electrification
ICE & Mild Hybrid Plug-in Hybrid Full Hybrid EV
78%
8%
10%
4%
72%
5%
6%
17% 26%
10%
6%
58%
2020 2025 2030
Faurecia Baseline
2%
13%
41%
36%
8%

Light Vehicle Regulatory Drivers Regulatory pressure (CO2 and pollutants) forces the move to ultra-clean ICE and EV
0.08 0.08
0.03
0.36
0.11
0.03
Euro 6b 2015 Euro 6d 2020 Euro 7 2025
x4.5
x1.43
x1
Homologation cycle
Real-driving emissions
Strong CO2 challenges for Europe & China
Still unclear for North America
130
95
80
59
2015 2020 2025 2030
95
75
160
180
116
90
108
Proposed
Enacted
Europe
China
US
Note: Data converted to NEDC equivalent
62 Capital Markets Day - November 26, 2019
Euro-7 will complete the process of making ICE virtually
pollutant-free even in city-driving conditions
CO2 EMISSIONS REGULATION (g/km) POLLUTANT EMISSIONS REGULATION (g/km)
Commercial vehicle following similar trend in Europe:
-15% CO2 in 2025 and -30% in 2030 vs. 2019

CO2 and Cost Drivers FCEV competitive against BEV with improved range and fast refilling
Hybrid best in class with global energy mix
FCEV at par with BEV with green energy mix
Post 2025, FCEV TCO on par with BEV TCO
for Light-duty Vehicle
CRADLE-TO-GRAVE CO2 FOOTPRINT OPERATING AND POWERTRAIN COST (k€)
Source: IEA 2019 & Faurecia estimates for BEV & FCEV Green (Renewable Energy) / *Global energy mix
Mid-size global average car
0
5
10
15
20
25
30
35
40
45
FCEV ICE
T-CO2 eq
PHEV BEV 400km* BEV Green FCEV Green
Vehicle usage
Variability relative to vehicle size
Vehicle cycle
Assembly, disposal, recycling…
Battery production & recycling
Energy production & distribution
63 Capital Markets Day - November 26, 2019
2020 2025 2030
40
20
0
100
60
80
120
140
FCEV
ICE
BEV
Assumptions
LCV Segment
EU region
Max range 500 km
90,000 km/year
3 years ownership
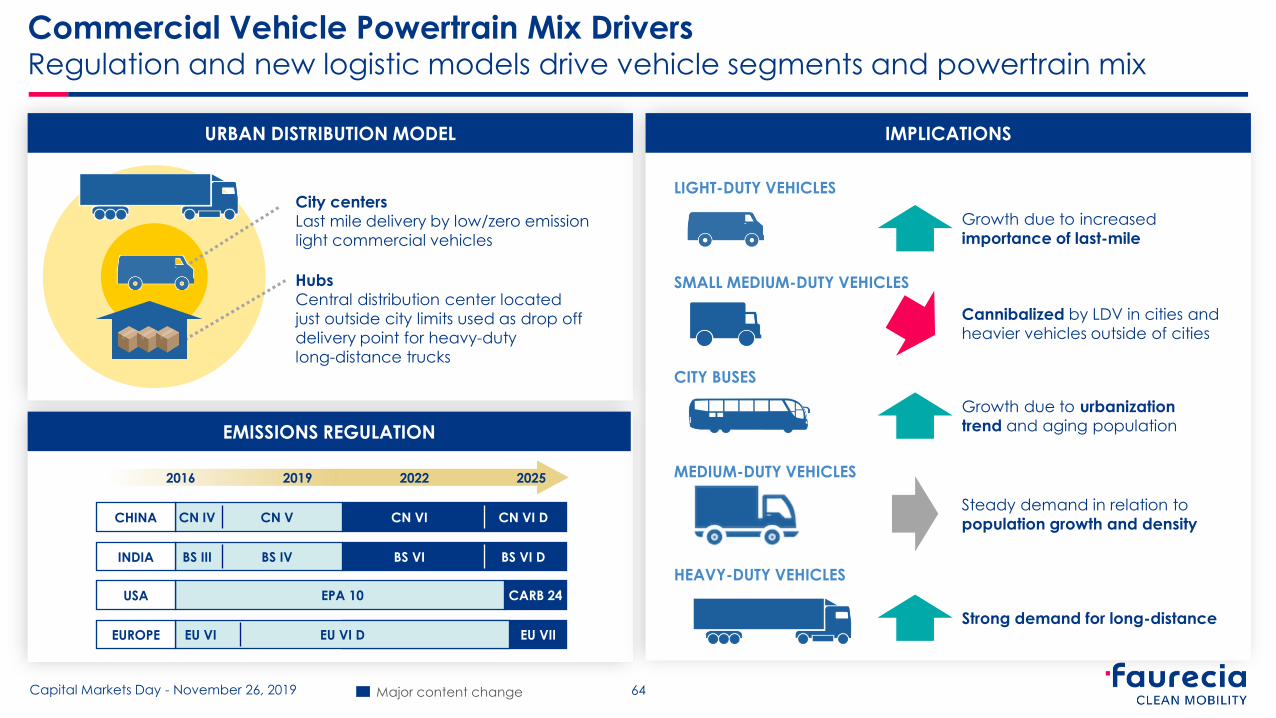
Commercial Vehicle Powertrain Mix Drivers Regulation and new logistic models drive vehicle segments and powertrain mix
Hubs
Central distribution center located
just outside city limits used as drop off
delivery point for heavy-duty
long-distance trucks
City centers
Last mile delivery by low/zero emission
light commercial vehicles
URBAN DISTRIBUTION MODEL
EMISSIONS REGULATION
IMPLICATIONS
Growth due to increased
importance of last-mile
Cannibalized by LDV in cities and
heavier vehicles outside of cities
Growth due to urbanization
trend and aging population
Steady demand in relation to
population growth and density
Strong demand for long-distance
LIGHT-DUTY VEHICLES
SMALL MEDIUM-DUTY VEHICLES
CITY BUSES
MEDIUM-DUTY VEHICLES
HEAVY-DUTY VEHICLES
2022 2016 2025 2019
CHINA CN IV CN V CN VI CN VI D
INDIA BS III BS IV BS VI BS VI D
USA EPA 10
EUROPE EU VI D EU VII EU VI
CARB 24
64 Capital Markets Day - November 26, 2019 Major content change

2030 FAURECIA ELECTRIFICATION SCENARII
Commercial Vehicle (CV) Powertrain Mix Scenarii Strong resistance of Diesel; Fuel Cell as the prime path for heavy trucks electrification
WEIGHT IN THE MIX ELECTRIFICATION % DOMINANT TECHNOLOGY
11-16%
7-10%
32-38%
1-5%
5-10% H2
H2
H2
H2
COMMERCIAL VEHICLES: GLOBAL POWERTRAIN MIX TO 2030
2020 2025 2030
ICE diesel
Battery EV Fuel Cell EV
Other ICE (including hybrid)
76%
10% 5%
9%
Faurecia baseline
65 Capital Markets Day - November 26, 2019
22%
11%
20%
15%
32%
H2
LIGHT-DUTY VEHICLES
SMALL MEDIUM-DUTY VEHICLES
CITY BUSES & COACHES
MEDIUM-DUTY VEHICLES
HEAVY-DUTY VEHICLES 2020 2025 2030
67%
13%
10%
10%
Faurecia aggressive
electrification

Faurecia is addressing all major segments in ICE and EV
EV
ICE
COMMERCIAL VEHICLE LIGHT VEHICLE HIGH HORSEPOWER
66 Capital Markets Day - November 26, 2019
1 2 3
4 5 Under
review
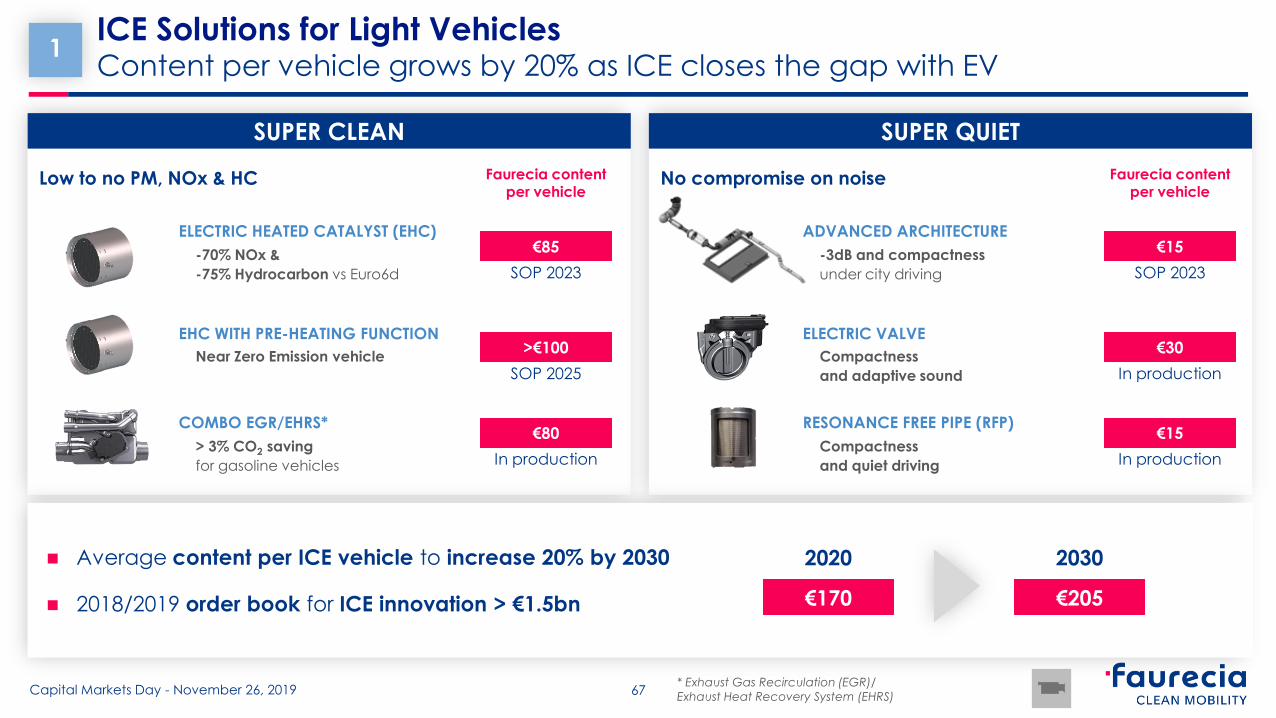
ICE Solutions for Light Vehicles Content per vehicle grows by 20% as ICE closes the gap with EV
1
SUPER CLEAN SUPER QUIET
No compromise on noise Low to no PM, NOx & HC
€85
SOP 2023
ELECTRIC HEATED CATALYST (EHC)
-70% NOx &
-75% Hydrocarbon vs Euro6d
EHC WITH PRE-HEATING FUNCTION
COMBO EGR/EHRS*
> 3% CO2 saving
for gasoline vehicles
Near Zero Emission vehicle
Faurecia content per vehicle
>€100
SOP 2025
€80
In production
€15
SOP 2023
ADVANCED ARCHITECTURE
-3dB and compactness
under city driving
ELECTRIC VALVE
RESONANCE FREE PIPE (RFP)
Compactness
and quiet driving
Compactness
and adaptive sound
Faurecia content per vehicle
€30
In production
€15
In production
* Exhaust Gas Recirculation (EGR)/
Exhaust Heat Recovery System (EHRS) 67 Capital Markets Day - November 26, 2019
Average content per ICE vehicle to increase 20% by 2030
2018/2019 order book for ICE innovation > €1.5bn
2030 2020
€170 €205
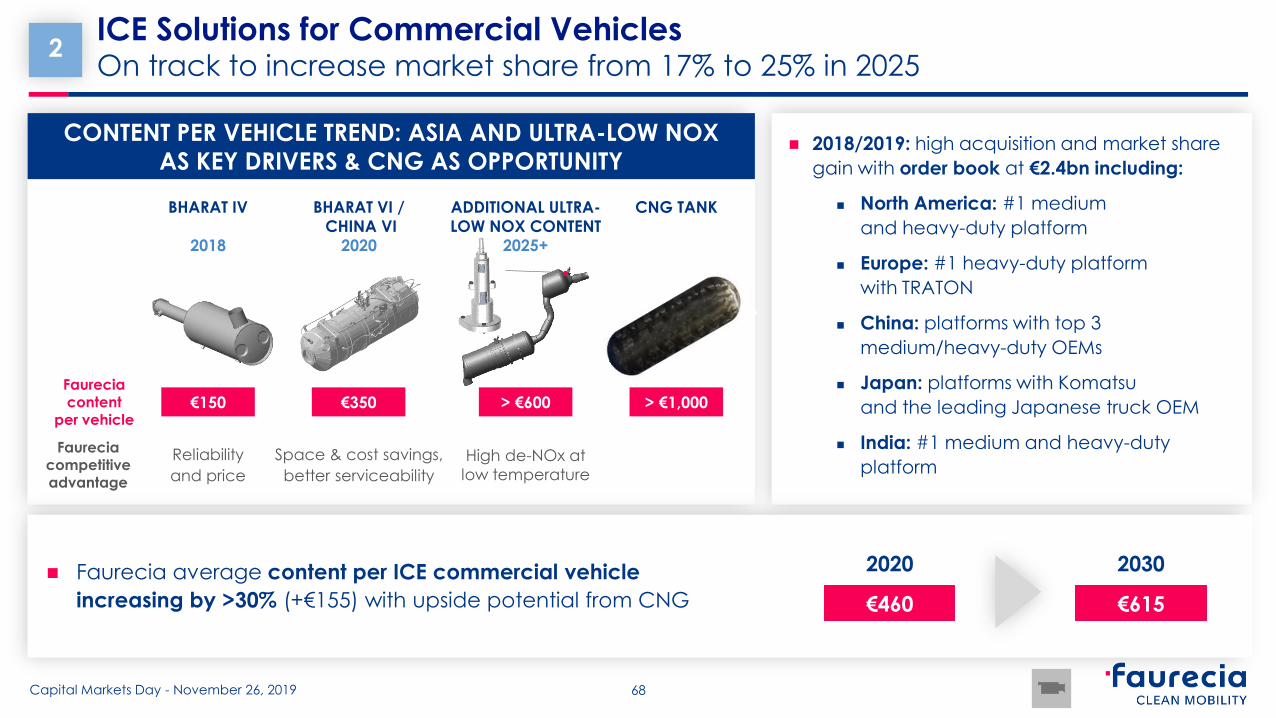
ICE Solutions for Commercial Vehicles On track to increase market share from 17% to 25% in 2025
2
2018/2019: high acquisition and market share
gain with order book at €2.4bn including:
North America: #1 medium
and heavy-duty platform
Europe: #1 heavy-duty platform
with TRATON
China: platforms with top 3
medium/heavy-duty OEMs
Japan: platforms with Komatsu
and the leading Japanese truck OEM
India: #1 medium and heavy-duty
platform
CONTENT PER VEHICLE TREND: ASIA AND ULTRA-LOW NOX
AS KEY DRIVERS & CNG AS OPPORTUNITY
BHARAT IV
2018
BHARAT VI /
CHINA VI
2020
ADDITIONAL ULTRA-
LOW NOX CONTENT
2025+
€350 > €600
Space & cost savings,
better serviceability
Reliability
and price
High de-NOx at
low temperature
€150
CNG TANK
> €1,000
68 Capital Markets Day - November 26, 2019
Faurecia average content per ICE commercial vehicle
increasing by >30% (+€155) with upside potential from CNG
Faurecia content
per vehicle
Faurecia competitive advantage
2030 2020
€460 €615

EPA Tier4 (2017)
Local Regulations
(CARB, NESHAP...)
IMO III for Sea Going
vessels
(2016, extended to
smaller boat in 2021)
EPA Tier4 for Inland
Going vessels
(2017)
Marine
Stationary
NORTH AMERICA
Local Regulations
(ie. BlmSchV in Germany
– 2019, upgrade in 2025)
Stage V (2021) Stationary
Marine
IMO III for Sea Going
vessels (2021)
Stage V for Inland Going
vessels (2021)
CHINA & ASIA PACIFIC
Local Regulations
(at country or city level,
increased pressure)
India CPCB (2021) Stationary
Marine
China National DECA
Yangtze delta (2022)
HIGH HORSEPOWER REGULATIONS HIGHLIGHTS
Global emissionization rate increasing from 10% in 2019 to 60% in 2030
69 Capital Markets Day - November 26, 2019
ICE Solutions For High Horsepower Market Positive regulation dynamic, paving the road for mid and long-term growth
3
EUROPE
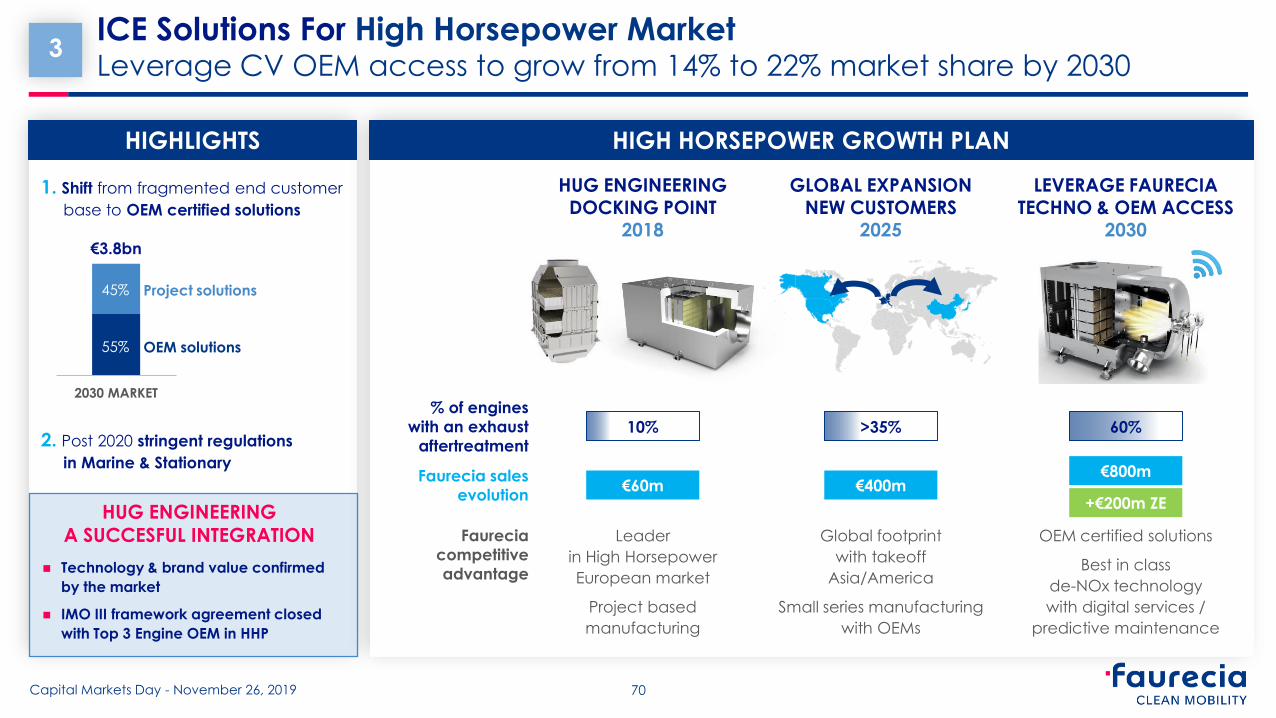
HUG ENGINEERING DOCKING POINT
2018
GLOBAL EXPANSION NEW CUSTOMERS
2025
LEVERAGE FAURECIA TECHNO & OEM ACCESS
2030
€400m €800m
Global footprint
with takeoff
Asia/America
Small series manufacturing
with OEMs
Leader
in High Horsepower
European market
Project based
manufacturing
€60m Faurecia sales
evolution
Faurecia
competitive
advantage
% of engines
with an exhaust
aftertreatment 10% >35% 60%
OEM certified solutions
Best in class
de-NOx technology
with digital services /
predictive maintenance
1. Shift from fragmented end customer
base to OEM certified solutions
2030 MARKET
2. Post 2020 stringent regulations
in Marine & Stationary
€3.8bn
ICE Solutions For High Horsepower Market Leverage CV OEM access to grow from 14% to 22% market share by 2030
3
70 Capital Markets Day - November 26, 2019
HIGHLIGHTS HIGH HORSEPOWER GROWTH PLAN
+€200m ZE
OEM solutions
Project solutions
55%
45%
HUG ENGINEERING
A SUCCESFUL INTEGRATION
Technology & brand value confirmed
by the market
IMO III framework agreement closed
with Top 3 Engine OEM in HHP

Faurecia captures up to €15/kWh on a battery electric or dual power vehicle
Unique selling points:
Increased cost effectiveness: compact and light
solution easy to assemble and integrate including
with fuel cell system (dual power model)
Increased safety: 100% fire containment
+ crash performance
Increased battery performance: superior thermal
management
OEMs recognize the value of Faurecia’s global footprint
and status as a major global tier 1 supplier
4 LV program awards: with EV OEMs in North America
and China, and premium German OEM.
SOPs: 2021
71 Capital Markets Day - November 26, 2019
EV Solutions For Light Vehicles: Battery Housing and Dual Power Faurecia technology addresses pain points of BEV and dual power FCEV/BEV
4
PHEV
€200
Faurecia content
per vehicle
BEV / Dual Power
€350-800
BEV
Architecture Dual-Power
Architecture
Share
control
unit

72
1400km
>500km
>300km
100km
Gross Vehicle Weight (tons)
Ma
xim
um
Ra
ng
e (
Av
era
ge
)
1T 2T 6T 12T >12T
Medium-duty
truck
Heavy-duty
truck
Light commercial
vehicles
Small cars
Large / SUV
cars
Bus
Medium cars
Fuel cell more suitable for SUV, LCV, CV
Superior TCO potential versus BEV
Increased convenience: longer range,
short refueling time
China announced 1m FCEV by 2030
Major players take position in fuel cell market
HYUNDAI to develop and commercialize
FC Electric powertrains
CNH/IVECO to produce trucks in EU
in partnership with Nikola
BOSCH licensed Powercell technology
CUMMINS acquired Hydrogenics
72 Capital Markets Day - November 26, 2019
EV Solutions For Light and Commercial Vehicles: Fuel Cell Fuel cell attractiveness is confirmed for larger vehicles with long range
4/5
BEV
FCEV
FCEV VS. BEV: CO-EXISTENCE DRIVEN BY USE-CASE
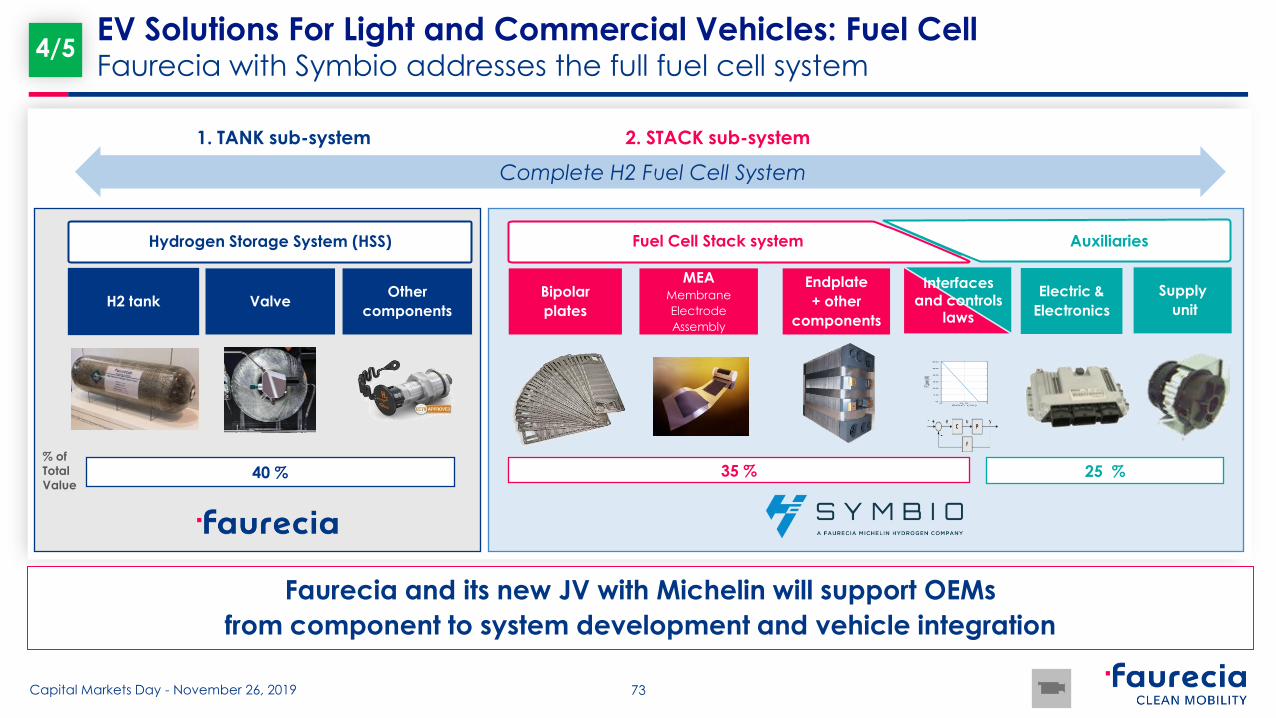
Faurecia and its new JV with Michelin will support OEMs
from component to system development and vehicle integration
2. STACK sub-system
Supply
unit
Electric &
Electronics
Fuel Cell Stack system
MEA Membrane
Electrode
Assembly
Endplate
+ other
components
Bipolar
plates
1. TANK sub-system
35 % 25 %
Auxiliaries
Interfaces and controls
laws
Complete H2 Fuel Cell System
73 Capital Markets Day - November 26, 2019
EV Solutions For Light and Commercial Vehicles: Fuel Cell Faurecia with Symbio addresses the full fuel cell system
4/5
Hydrogen Storage System (HSS)
Valve H2 tank Other
components
40 % % of
Total
Value

HYDROGEN STORAGE SYSTEMS
Increased autonomy
(more H2 at iso weight)
Reduced cost
(-20 % Carbon Fiber)
Reliability
(anti collapse system)
STACK
Best-in-class power density
Compactness
System integration
capability
HOMOLOGATION
350 & 700 bar H2
EC79 homologated
tank
BUSINESS AWARDS
One LCV - SOP 01/21
One CV - SOP 07/21
High-horsepower
applications under
development
2.0
0.3
0.3
2025 2030
1.6
0.4 Commercial Vehicles
Light Vehicles
Faurecia CPV for fuel cell vehicle in 2025 is up to €40k in CV and €8k in LV
74 Capital Markets Day - November 26, 2019
EV Solutions For Light and Commercial Vehicles: Fuel Cell Increasing content per vehicle and value confirmed by business awards
FUEL-CELL VEHICLE MARKET Millions of vehicles
UNIQUE SELLING
POINTS
KEY
ACHIEVEMENTS
2025 Faurecia content per vehicle
HSS €4k
Stack System €4k
HSS €30k
Stack System €10k
4/5

Addressable Market Size under Faurecia baseline scenario ICE remains a large value pool, EV drives growth after 2025
1.6 0.7
2030
2.5
14.5
3.5
28.8
2.5
2020
18.3
1.8 5.2
16.7
2025
5.5
12.9
3.8
6.1 20.4
46.6
7%
10%
High Horsepower +18%
Commercial Vehicles +6%
Light Vehicles +2.5%
CAGR 20-30
Battery Solutions +13%
Fuel Cell Systems +101% +25%
+9%
ICE
EV
FCM MARKET In €bn
75 Capital Markets Day - November 26, 2019

Faurecia market share is increasing in all markets
including fast-growing EV segments (baseline scenario)
EV
COMMERCIAL
VEHICLE
LIGHT
VEHICLE
HIGH
HORSEPOWER
76 Capital Markets Day - November 26, 2019
Total market is growing from €20bn in 2020 to €46bn in 2030 (+9% CAGR)
Total Faurecia sales are growing from €4.7bn in 2020 to €12.1bn in 2030 (+10% CAGR)
Up to €200m
sales opportunity in 2030
27
%
2020 in €bn
14.5
30
%
18.3
2030 in €bn
+2.4%
Market
CAGR
16
%
2020 in €bn
3.5
28
%
6.1
2030 in €bn
+5.7%
Market
CAGR
13
%
2020 in €bn
0.7
21
%
3.8
2030 in €bn
+18%
Market
CAGR
2020 in €bn
1.4
23
%
10.9
2030 in €bn
+23%
Market
CAGR
1%
2020 in €bn
0.2
24
%
7.5
2030 in €bn
+42%
Market
CAGR
ICE

FAURECIA SALES In €bn
Faurecia Sales and Market Share Faurecia growth outperforms the market (baseline scenario)
Faurecia Clean Mobility sales x 2.6 by 2030
2019 achievements (business awards, technical milestones) confirm topline ambition
1.7 0.6
5.5
2019e
0.1 0.5
4.0
0.4
0.8 0.3
1.2
1.0
4.9
2025
3.2
2030
4.6
7.3
12.1
+9%
+11%
CAGR 20-30
High Horsepower +25% 18% 24%
Commercial Vehicles +11% 16% 28%
Light Vehicles +3% 27 % 30%
5,3
3,8
Battery Solutions +64% N/A 17%
Fuel Cell Systems +75% N/A 25%
ICE
EV
Market Share 20-30
72%
14%
77 Capital Markets Day - November 26, 2019
Including Symbio JV sales (100%)

Faurecia sales under fast electrification scenario Aggressive electrification increases Faurecia rate of growth
Faurecia high content per EV means that faster electrification
is an opportunity
Battery EV
Fuel Cell EV
ICE Hybrid
ICE Diesel
ICE Gasoline ICE
EV
High Horsepower
Commercial Vehicles
Light Vehicles
Battery Solutions
Fuel Cell Systems
0.5
2030
0.4
0.1 0.5
4.0
2019e
0.8
1.2
5.5
4.6
2025
1.7
1.7
0.8
4.5
4.6
7.4
14.2
7%
29%
34%
25%
5%
2020 2025 2030
78 Capital Markets Day - November 26, 2019
FAURECIA FAST LV ELECTRIFICATION FAURECIA SALES In €bn
Including Symbio JV sales (100%)

Faurecia Clean Mobility Financial Performance Benchmark performance confirmed despite investment in EV solutions
In €m 2019e 2022 2025
Sales 4,600 5,200 7,300
Of which Light Vehicles 4,000 4,200 5,500
Of which Commercial Vehicles 540
850
1,400
Of which HHP 60 150 400
EBIT as % of sales c. 11% ≥ 12% > 13%
79 Capital Markets Day - November 26, 2019
Takeaways
Electrification is accelerating in all segments driven by regulation
and public pressure
Increased ICE content per vehicle fully offsets any loss of ICE passenger vehicle
volumes under the fast electrification scenario (30% EV in 2030)
Market share gains and technology enable a doubling of revenues
for CV/HHP ICE solutions by 2025
Our differentiating EV power solutions, especially our fuel cell full system offer,
will secure our future profitable growth
80 Capital Markets Day - November 26, 2019
Electrification is a significant opportunity for Faurecia

Growth and Resilience
Michel Favre Chief Financial Officer
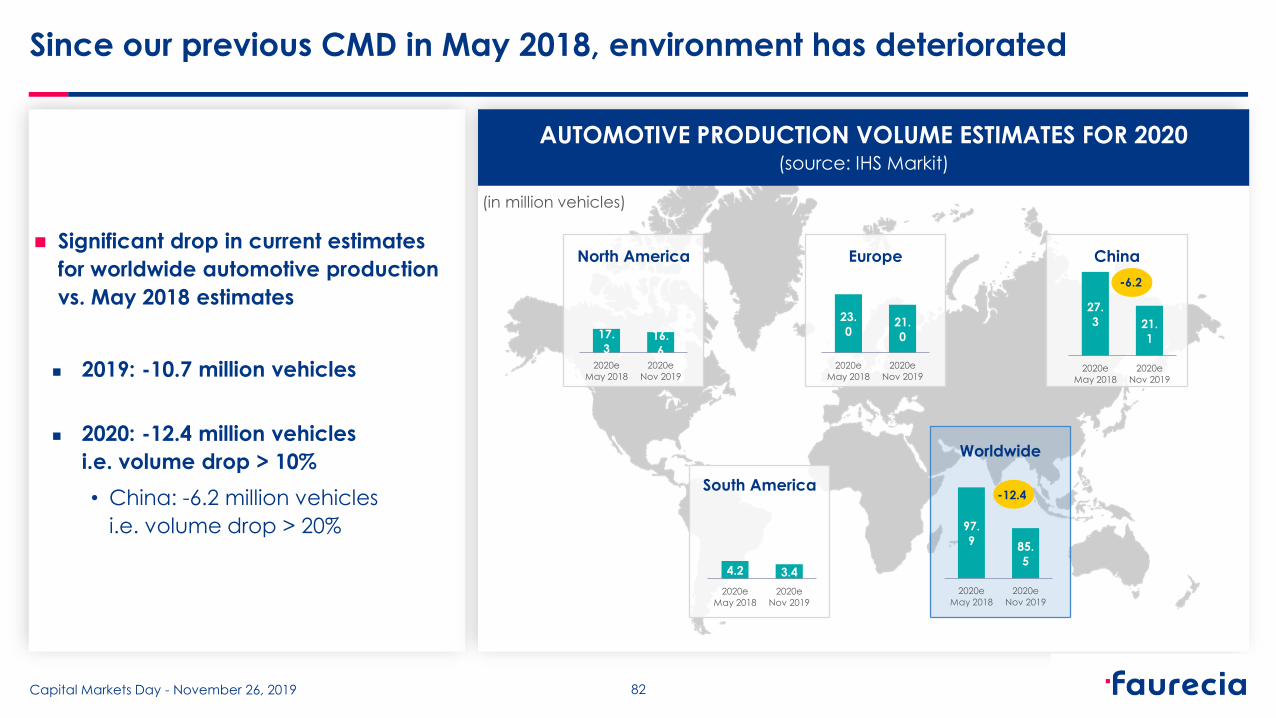
Since our previous CMD in May 2018, environment has deteriorated
Significant drop in current estimates
for worldwide automotive production
vs. May 2018 estimates
2019: -10.7 million vehicles
2020: -12.4 million vehicles
i.e. volume drop > 10%
• China: -6.2 million vehicles
i.e. volume drop > 20%
North America Europe China
South America
17.
3 16.
6 2020e
May 2018
2020e
Nov 2019
23.
0 21.
0
2020e
May 2018
2020e
Nov 2019
27.
3 21.
1
2020e
May 2018
2020e
Nov 2019
-6.2
4.2 3.4
2020e
May 2018
2020e
Nov 2019
97.
9 85.
5
2020e
May 2018
2020e
Nov 2019
Worldwide
-12.4
(in million vehicles)
AUTOMOTIVE PRODUCTION VOLUME ESTIMATES FOR 2020 (source: IHS Markit)
82 Capital Markets Day - November 26, 2019

In this environment, our performance is resilient
In 2018, despite headwinds as from H2, we met all our financial targets and achieved record results
For 2019, we confirm all our financial targets announced in February, despite deterioration
of worldwide automotive production :
In February, volume expected to drop by c. -1% year-on-year
Now expected to drop by c. -6% year-on-year
SALES
FY 2019 sales at constant
currencies should outperform
worldwide automotive production
between 150 and 350bps
PROFITABILITY
FY 2019 operating income
should increase in value
and operating margin
should be at least 7% of sales
NET CASH FLOW
FY 2019 net cash flow
should be at least €500m
(including Clarion consolidation as from April 1) (excluding Clarion consolidation) (including Clarion consolidation as from April 1)
Currency assumptions: USD/€ @ 1.13 and CNY/€ @ 7.71, on average
83 Capital Markets Day - November 26, 2019

Our resilience is based on 3 pillars
GLOBAL INITIATIVES STRUCTURAL ACTIONS
& COST FLEXIBILIZATION
GOVERNANCE
& MANAGEMENT FOCUS
Monthly Operations Reviews
with Business Groups
Annual stress case scenarii
with specific actions plans
Sponsorship of an Executive
Committee member for each key
country/sub-region
Monthly Risk Management Reviews
for plants and programs
Total Customer Satisfaction
Three Global cost optimization
programs launched in 2018:
“Operations Execution and Digital
Transformation” for increasing
industrial efficiency
“Global Business Services”
for a leaner cost structure
“Global R&D Power” for improving
engineering efficiency
Convert to Cash
Enhanced efficiency
& leaner cost structure
High anticipation
& responsiveness
Increased agility
& resilience
Rationalization/Optimization
of industrial footprint
Tight management of direct
and indirect headcount
Use of temporary staff
SG&A cost-cutting measures
84
Capital Markets Day - November 26, 2019

Our three global cost optimization programs are on track (1/3)
PROGRESS TO DATE NEXT STEPS
Integration of FCE and SAS
Accelerated deployment of AI
(Process variability reduction
& automatic quality inspection)
2020-2022 cumulated savings
of c. €175m in digital transformation
(before additional savings from FCE
and SAS under review)
Plant ranking and program/plant risk
assessment and management
Acceleration in digital transformation
Implementation of Process Control
Towers
2018-2020 cumulated savings
of c. €280m and FY 2020 savings
of c. €150m vs. 2017
Risk management has almost
eliminated program launch and
manufacturing risks
+1,100 robots & AGVs
deployed in 2018 and 2019
Deployment of standard digital tools
for optimized material flow,
manufacturing automation
and process variability control
OPERATIONS EXECUTION & TRANSFORMATION
PROGRAM OBJECTIVES presented in May 2018
85 Capital Markets Day - November 26, 2019

Our three global cost optimization programs are on track (2/3)
PROGRESS TO DATE NEXT STEPS
Integration of FCE and SAS
Acceleration in digitalization
and automation of processes
2020-2022 cumulated savings
of c. €20m (before additional savings
from FCE and SAS under review)
From 34 locations to 5 main regional
operations centers in low-cost
countries
100% SAP implementation
at Group level
2018-2020 cumulated savings
of c. €120m and FY 2020 savings
of c. €50m vs. 2017
Migration to 5 centers achieved
+ Pune (India) innovation center
Significant headcount reduction
on track (down 20% vs. end 2017)
and important gains in flexibility
New integration opportunities:
central procurement for indirect
purchasing, digital reporting
and controlling support platform
GLOBAL BUSINESS SERVICES
PROGRAM OBJECTIVES presented in May 2018
86 Capital Markets Day - November 26, 2019

Our three global cost optimization programs are on track (3/3)
PROGRAM OBJECTIVES presented in May 2018
PROGRESS TO DATE NEXT STEPS
Integration of FCE and SAS
Deployment of a common tool
for Product Lifecycle Management
(Enovia)
Development cycle time
and program management reduced
to an average of 20 months
2020-2022 cumulated savings
of c. €60m (before additional savings
from FCE and SAS under review)
Targeting €50 R&D hourly rate
in 2020 (vs. €70 in 2016)
Best shoring with more than
1,200 engineers in India in 2020
2018-2020 cumulated savings
of c. €100m and FY 2020 savings
of c. €50m vs. 2017
2020 R&D hourly rate target already
reached for two Business Groups
c. 2,000 engineers in India
Savings to finance innovation
GLOBAL R&D POWER
87 Capital Markets Day - November 26, 2019

Our Convert2Cash (C2C) program is delivering on targets
PROGRESS TO DATE NEXT STEPS PROGRAM OBJECTIVES
presented in May 2018
Accelerate overdue collection
(< 0.5% of sales)
Inventories converging to benchmark
(down 1 day every year)
Increase volume per supplier
against improved payment terms
Secure D&D/Tooling financing
Capex optimized by 10% by 2020
(standardization, utilization & re-use)
Overdues down 25% vs. end 2017
Inventories adjusted to volume drop
Reverse factoring in place
in all regions
Capex down 7% mainly thanks
to equipment re-use
Integration of FCE and SAS
Just Needed Inventory (JNI) processes
and Material Planning (MPTS)
centralization to reduce inventories
to 8 days by 2022
Targeting > 50% D&D/Tooling paid
at SOP
Systematic Make-or-Buy review to get
a 15% reduction in Capex by 2022
2019 NCF target > €500m (> 2.8% of sales)
2019 NCF > 2018 NCF despite higher restructuring
and higher financing costs
thanks to better cash conversion cycle
88
Target to increase NCF as % of sales by c. 150bps between 2017 and 2020
2022 NCF target of 4% of sales
Capital Markets Day - November 26, 2019

Faurecia’s medium-term market assumptions
North America
Flat
Worldwide
c. +1%
Worldwide automotive production now expected at c. 87 million vehicles in 2022
AUTOMOTIVE PRODUCTION GROWTH
2020 vs. 2019
AUTOMOTIVE PRODUCTION GROWTH
2020-2022 CAGR
Europe
Flat
China
c. +3%
South America
c. +4%
North America
Slightly down
(low single-digit)
Europe
Slightly down
(low single-digit)
China
Slightly up
(low single-digit)
South America
Flat
Worldwide
slightly negative
89 Capital Markets Day - November 26, 2019
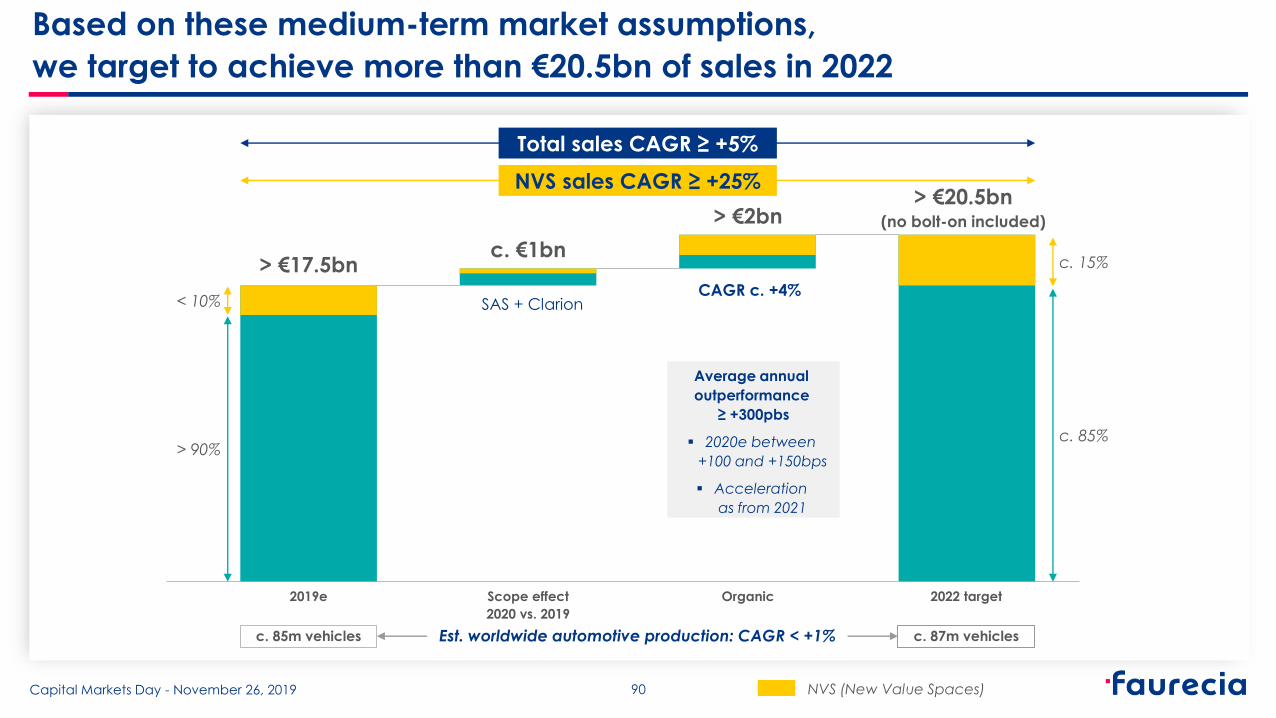
Based on these medium-term market assumptions,
we target to achieve more than €20.5bn of sales in 2022
Total sales CAGR ≥ +5%
2019e
> €17.5bn
2022 target
c. €1bn
> €2bn > €20.5bn
(no bolt-on included)
Scope effect
2020 vs. 2019
Organic
> 90%
< 10%
c. 85%
c. 15%
SAS + Clarion CAGR c. +4%
NVS (New Value Spaces)
NVS sales CAGR ≥ +25%
c. 85m vehicles c. 87m vehicles Est. worldwide automotive production: CAGR < +1%
Average annual
outperformance
≥ +300pbs
2020e between
+100 and +150bps
Acceleration
as from 2021
90 Capital Markets Day - November 26, 2019
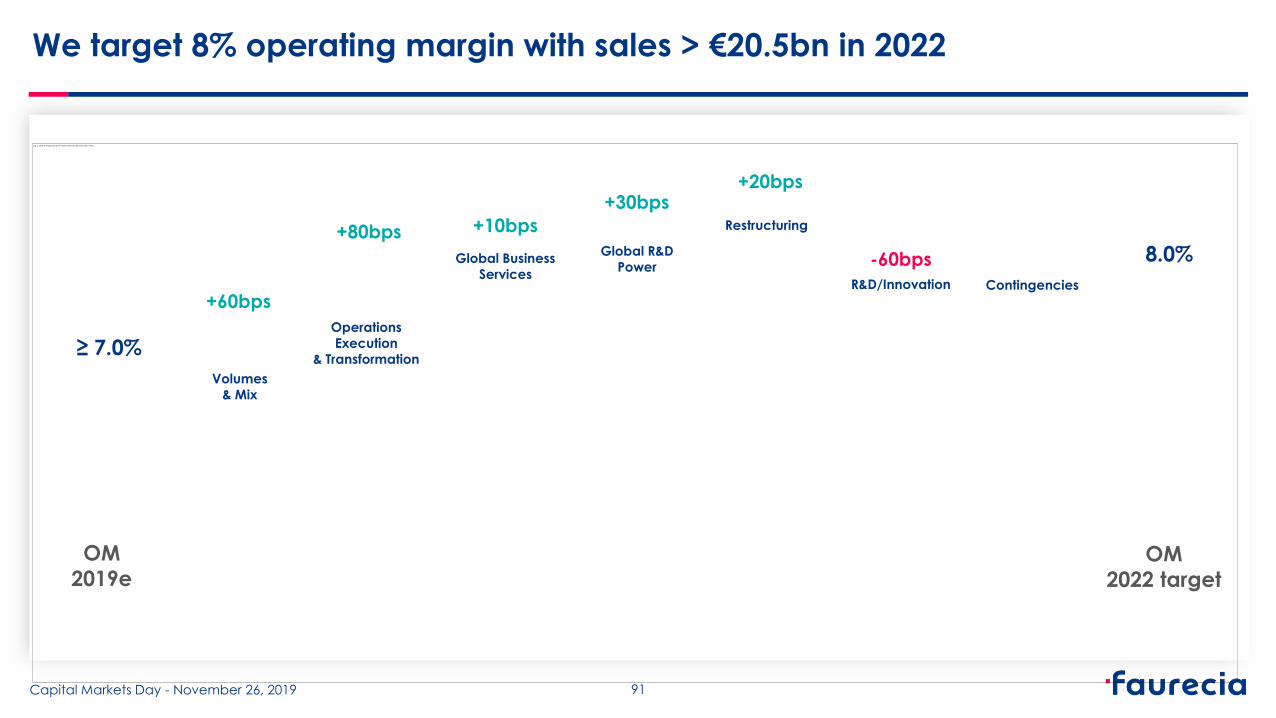
We target 8% operating margin with sales > €20.5bn in 2022
OM
2019e OM
2022 target
Operations
Execution
& Transformation
Global Business
Services R&D/Innovation
Restructuring
Global R&D
Power
Volumes
& Mix
≥ 7.0%
8.0%
Contingencies
+60bps
+80bps +10bps
+30bps
-60bps
+20bps
91 Capital Markets Day - November 26, 2019

39% of Group sales OM ≥ 6% of sales
2019e 2022 target (no bolt-on included)
> €17.5bn of sales
> €20.5bn of sales
˂ 10% of Group sales
c. 5% of Group sales
c. 30% of Group sales
c. 40% of Group sales > 35% of Group sales
c. 30% of Group sales
c. 25% of Group sales
c. 25% of Group sales
CAGR
≥ +5%
OM ≥ 7.0% of sales
OM = 8% of sales
OM ≥ 2% of sales
OM ≥ 6% of sales
OM ≥ 6% of sales
OM c. 11% of sales
OM ≥ 6% of sales
OM ≥ 7% of sales
OM ≥ 7% of sales
OM ≥ 12% of sales
FCE FCM FIS FAS
CAGR
c. +4%
(incl. SAS scope effect)
(acceleration in 2021 onwards)
CAGR
c. +6%
CAGR
c. +4%
Sales growth and improved operating margin in all Business Groups
x2
92 Capital Markets Day - November 26, 2019
We target Net Cash Flow of 4% of sales in 2022
> 2.8%
NCF
2019e
NCF
2022 target
Restructuring
normalized
Investment
in NVS
Capex
optimization
4.0%
Miscellaneous
> €500m EBITDA
increase
Conversion
cycle
acceleration > €800m WCR
from sales
growth
-55bps
+50bps
+50bps
+80bps
+30bps -55bps
93
+50bps
Financial costs
and tax variation
Capital Markets Day - November 26, 2019

Secured financing and sound financial structure
Senior Notes Schuldschein and other bank loans
Constant optimization of debt cost and maturity
Successful financing of recent acquisitions:
• Clarion financing achieved @ 2.6% average cost
• SAS financing achieved through €250 million additional
Senior Notes due 2026, issued at a yield of 2.39%
Successful pricing of €700m bonds due 2027 @ 2.375% and
anticipated repayment of €700m 3.625% bonds due 2023
Average cost of LT debt < 2.5%
No significant LT debt repayment before June 2025
Strong flexibility through €1.2bn undrawn credit
facility (maturity in June 2024)
Net-debt-to-EBITDA ratio (incl. IFRS16 impact of 0.3x)
2019 estimated at between 1x and 1.1x
2022 estimated at 0.7x
Policy to maintain ratio below 1x
Credit rating
Continuous improvement since 2014
Targeting investment grade status
LONG-TERM DEBT MATURITY PROFILE (€m)
0
100
200
300
400
500
600
700
800
900
1000
2020 2021 2022 2023 2024 2025 2026 2027
2.375% 2.625% 3.125% 3.625%
94 Capital Markets Day - November 26, 2019

NET CASH FLOW ALLOCATION STRATEGY
Cash allocation strategy remains focused on bolt-on acquisitions
and fair shareholder remuneration
Self-financed bolt-on strategy
In line with strategic priority of accelerating
NVS and increasing presence in Asian markets
Consistent with net debt reduction policy
Dividend policy
Fair shareholder remuneration through
increase in dividend along with increase
in profits and cash generation
Dividends & share
repurchases*
c. 40%
Bolt-ons &
deleveraging
c. 60%
* Share repurchases are mainly allocated to performance share plans
(no dilution for shareholders)
95 Capital Markets Day - November 26, 2019

TOTAL SHAREHOLDER RETURN > 10%
Strong ROCE and TSR for shareholder value creation
5-year annualized TSR = +12.7%
Share price
Nov. 22, 2014
Share price
Nov. 22, 2016
Dividend
paid 2015
Dividend
paid 2016
Dividend
paid 2017
Dividend
paid 2018
Dividend
paid 2019
€0.35
€0.65
€0.90
€1.10 €1.25
3-year annualized TSR = +14.1%
Share price
Nov. 22, 2019
€46.14
€27.93
€33.38
PRE-TAX ROCE @ 20% in 2022 (including IFRS 16 impact)
2019e 2022e
18%
20%
96 Capital Markets Day - November 26, 2019
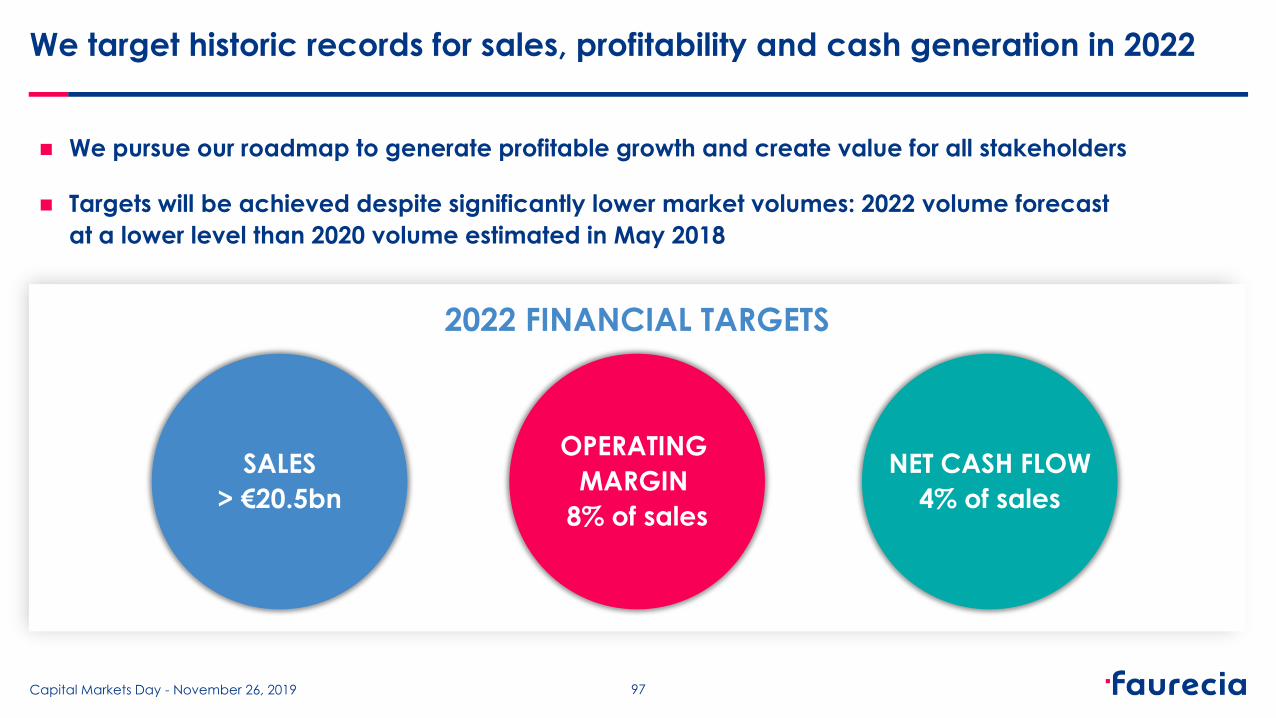
We pursue our roadmap to generate profitable growth and create value for all stakeholders
Targets will be achieved despite significantly lower market volumes: 2022 volume forecast
at a lower level than 2020 volume estimated in May 2018
We target historic records for sales, profitability and cash generation in 2022
2022 FINANCIAL TARGETS
NET CASH FLOW
4% of sales
OPERATING
MARGIN
8% of sales
SALES
> €20.5bn
97 Capital Markets Day - November 26, 2019

Strong sales and operating margin targets in tougher market conditions reflect robustness and resilience of our business model
2020 target
May 2018 CMD
2022 target
Nov. 2019 CMD
Market volume
impact
c. €0.2bn > €20bn > €20.5bn c. €1.6bn
c. €0.7bn
(c. €2bn) Perimeter
impact
Currency
impact
Improved sales performance
SALES
2020 target
May 2018 CMD
2022 target
Nov. 2019 CMD
Market volume
impact
8%
c. -5bps
c. +140bps c. -134bps
Perimeter
impact
Resilience
actions
OPERATING MARGIN
8%
98
with est. volumes of c. 97m vehicles
with est. volumes of c. 87m vehicles
with est.volumes of c. 97m vehicles
with est. volumes of c. 87m vehicles
Capital Markets Day - November 26, 2019

Takeaways
Proven resilience in challenging times
Record sales, profitability and cash generation targeted in 2022
supported by robust action plans
Pursuing our track record of improved performance year after year,
with focus on cash generation for continued investment in transformation
and strong shareholder return
99 Capital Markets Day - November 26, 2019
Conclusion
Patrick Koller Chief Executive Officer

Faurecia combining strategic transformation and operational excellence
Transformation
& carbon
neutrality
Resilience & execution
Capital Markets Day - November 26, 2019 101
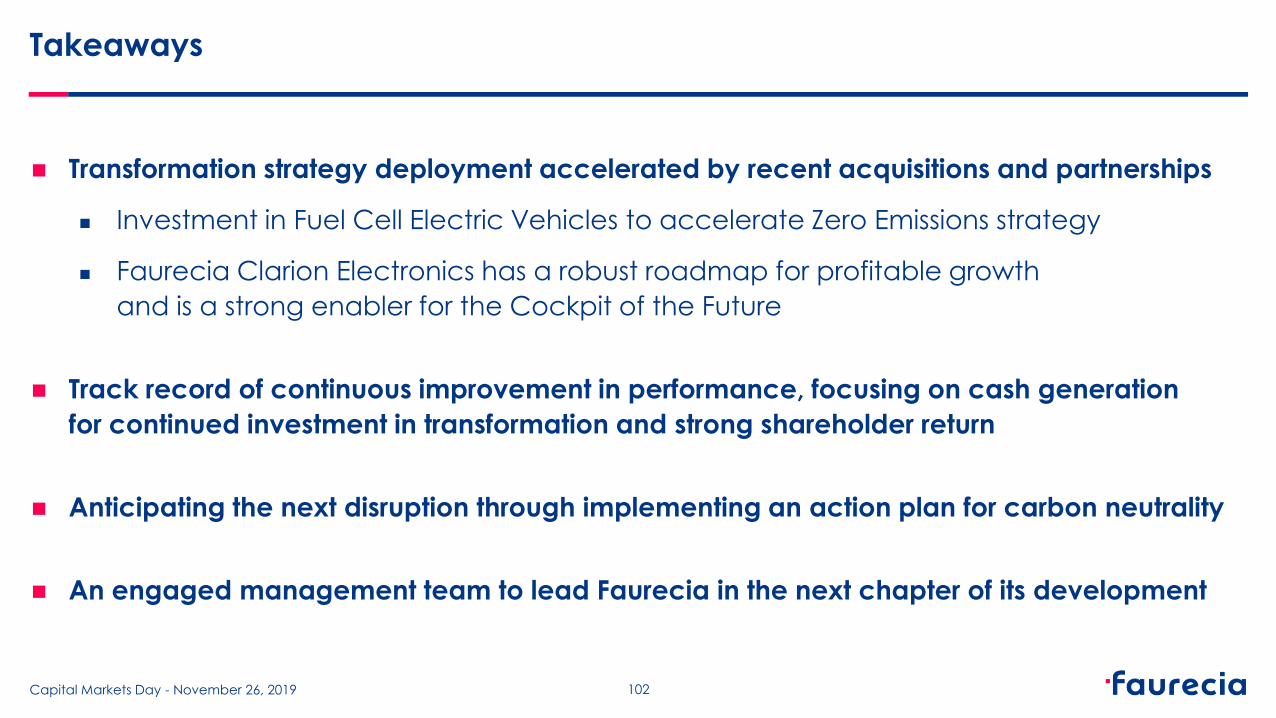
Takeaways
Transformation strategy deployment accelerated by recent acquisitions and partnerships
Investment in Fuel Cell Electric Vehicles to accelerate Zero Emissions strategy
Faurecia Clarion Electronics has a robust roadmap for profitable growth
and is a strong enabler for the Cockpit of the Future
Track record of continuous improvement in performance, focusing on cash generation
for continued investment in transformation and strong shareholder return
Anticipating the next disruption through implementing an action plan for carbon neutrality
An engaged management team to lead Faurecia in the next chapter of its development
Capital Markets Day - November 26, 2019 102

Disclaimer
Important information concerning forward looking statements This presentation contains certain forward-looking statements concerning Faurecia. Such forward-looking statements represent trends or objectives and cannot be construed as constituting forecasts regarding the future Faurecia’s results or any other performance indicator. In some cases, you can identify these forward-looking statements by forward-looking words, such as "estimate," "expect," "anticipate," "project," "plan," "intend," "objective", "believe," "forecast," "foresee," "likely," "may," "should," "goal," "target," "might,"
"would,", “will”, "could,", "predict," "continue," "convinced," and "confident," the negative or plural of these words and other comparable terminology. Forward looking statements in this document include, but are not limited to, financial projections and estimates and their underlying assumptions, expectations and statements regarding Faurecia's operation of its business, and the future operation, direction and success of Faurecia's business. Although Faurecia believes its expectations are based on reasonable assumptions, investors are cautioned that these forward-looking statements are subject to numerous various risks, whether known or unknown, and uncertainties and other factors, which may be
beyond the control of Faurecia and which could cause actual results to differ materially from those anticipated in these forward-looking statements. For a detailed description of these risks and uncertainties and other factors, please refer to public filings made with the Autorité des Marchés Financiers (“AMF”), press releases, presentations and, in particular, to those described in the section 2."Risk Factor" section of Faurecia's 2018 Registration Document filed with the AMF on 26 April 2019 under number D.19-0415 (a version of which is available on www.faurecia.com). Subject to regulatory requirements, Faurecia does not undertake to publicly update or revise any of these forward-looking statements
whether as a result of new information, future events, or otherwise. Any information relating to past performance contained herein is not a guarantee of future performance. Nothing herein should be construed as an investment recommendation or as legal, tax, investment or accounting advice. This presentation does not constitute and should not be construed as an offer to sell or a solicitation of an offer to buy Faurecia securities.
Capital Markets Day - November 26, 2019 103