transformation of surface oxides during vacuum heat...
TRANSCRIPT
Transformation of Surface Oxides during Vacuum Heat Treatment of a Powder
Metallurgical Hot Work Tool Steel
by
Sebastian Brust
Diploma work No. 109/2013 at Department of Materials and Manufacturing Technology
CHALMERS UNIVERSITY OF TECHNOLOGY Gothenburg, Sweden
Diploma work in the master program Materials Engineering Performed at: Department of Materials and Manufacturing Technology Chalmers University of Technology, SE - 412 96 Gothenburg Examiner and Supervisor: Assoc. Professor Eduard Hryha Department of Materials and Manufacturing Technology
Chalmers University of Technology, SE - 412 96 Gothenburg

Transformation of Surface Oxides during Vacuum Heat Treatment of a Powder Metallurgical Hot Work Tool Steel © Sebastian Brust, 2013. Diploma work no 109/2013 Department of Materials and Manufacturing Technology Chalmers University of Technology SE-412 96 Gothenburg Sweden CHALMERS Reproservice Gothenburg, Sweden 2013
Transformation of Surface Oxides during Vacuum Heat Treatment of a Powder Metallurgical Hot Work Tool Steel Sebastian Brust Department of Materials and Manufacturing Technology Chalmers University of Technology SUMMARY Characteristics of surface oxide in case of gas atomized Hot Work Tool Steel powder X40CrMoV5-1 in as-atomized condition and after heat treatment at different temperatures in vacuum conditions are discussed. Reduction of surface oxides on steel powder prior to consolidation is mandatory to achieve strong inter-particle connections in the final product. The efficient reduction requires knowledge concerning processes of the surface chemistry changes during heat treatment and sintering. Changes in powder surface composition was studied by X-ray Photoelectron Spectroscopy (XPS) for different temperatures after the heat treatment performed in a furnace attached to the XPS system in ultra-high vacuum (UHV). Morphology, chemistry and distribution of oxides on the powder particle surface were additionally analyzed by Scanning Electron Microscopy (SEM) combined with Energy Dispersive X Ray Analysis (EDX). The results show the presence of a heterogeneous oxide layer on the as-received powder surface, formed by a homogeneous iron oxide layer with a thickness of ~7 nm and particulate oxides rich in chromium, manganese, silicon and vanadium. The iron oxide layer is almost completely reduced after heat treatment at 600 °C. However, this leads to growth of Cr-, Mn-, Si- and V-rich oxides and segregation of sulfides on the powder surface. The reduction of chromium oxides starts around 700 °C, but further enrichment in Mn, Si and V is observed. Considerable decrease in the oxygen signal was found after heat treatment at 800 °C, indicating significant reduction in oxide amount. An almost fully oxide-free powder surface was detected after heat treatment at 900 °C. Only some vanadium compounds and sulfides were still observed on the powder particle surface. The amount of sulfides increases with increasing annealing temperature. The results indicate that high temperature vacuum annealing of the X40CrMoV5-1 powder before consolidation seems to be feasible to reduce surface oxides and thus improve the inter-particle bonding between the powder particles during further consolidation. Keywords: Hot Work Tool Steel, Surface Oxides, Powder Metallurgy, Vacuum Annealing, Surface Analysis

Contents
NOMENCLATURE ............................................................................................................................................... I
ABSTRACT ......................................................................................................................................................... III
1. INTRODUCTION ....................................................................................................................................... 1
2 THEORETICAL BACKGROUND ........................................................................................................... 3
2.1 HOT WORK TOOL STEELS ......................................................................................................................... 3
2.2 POWDER METALLURGY ............................................................................................................................. 4
2.2.1 Steel powder production .................................................................................................................. 4
2.2.2 Sintering and Hot Isostatic Pressing ............................................................................................... 6
2.3 OXIDES ON POWDER SURFACES ................................................................................................................. 8
2.3.1 Thermodynamic description of oxide reduction .............................................................................. 9
2.3.2 Previous investigations on X40CrMoV5-1 .................................................................................... 12
2.4 MATERIAL AND EXPERIMENTAL TECHNIQUES ......................................................................................... 13
2.4.1 Material and sieve analysis ........................................................................................................... 13
2.4.2 X-ray Photoelectron Spectroscopy ................................................................................................ 13
2.4.3 Scanning Electron Microscopy ..................................................................................................... 18
2.4.4 Thermogravimetry Analysis .......................................................................................................... 20
2.4.5 Residual Gas Analysis ................................................................................................................... 21
2.4.6 Differential Thermal Analysis ....................................................................................................... 22
2.4.7 Dilatometry ................................................................................................................................... 23
2.4.8 Thermodynamic calculations ........................................................................................................ 23
3 RESULTS ................................................................................................................................................... 26
3.1 ANALYSIS OF THE AS-RECEIVED STATE ................................................................................................... 26
3.1.1 Scanning Electron Microscopy ..................................................................................................... 26
3.1.2 X-ray Photoelectron Spectroscopy ................................................................................................ 31
3.2 ANALYSIS AFTER HEAT TREATMENT ........................................................................................................ 42
3.2.1 Scanning Electron Microscopy ..................................................................................................... 42
3.2.2 X-ray Photoelectron Spectroscopy ................................................................................................ 52
3.3 THERMOANALYTICAL INVESTIGATIONS ................................................................................................... 65
3.3.1 Thermogravimetry Analysis .......................................................................................................... 65
3.3.2 Residual Gas Analysis ................................................................................................................... 66
3.3.3 Differential Thermal Analysis ....................................................................................................... 67
3.3.4 Dilatometry ................................................................................................................................... 68
3.3.5 Calculation of phase transformations ........................................................................................... 69
4 DISCUSSION ............................................................................................................................................. 70

5 CONCLUSION AND FUTURE WORK ................................................................................................. 79
REFERENCES .................................................................................................................................................... 81
APPENDIX .......................................................................................................................................................... 87
Nomenclature
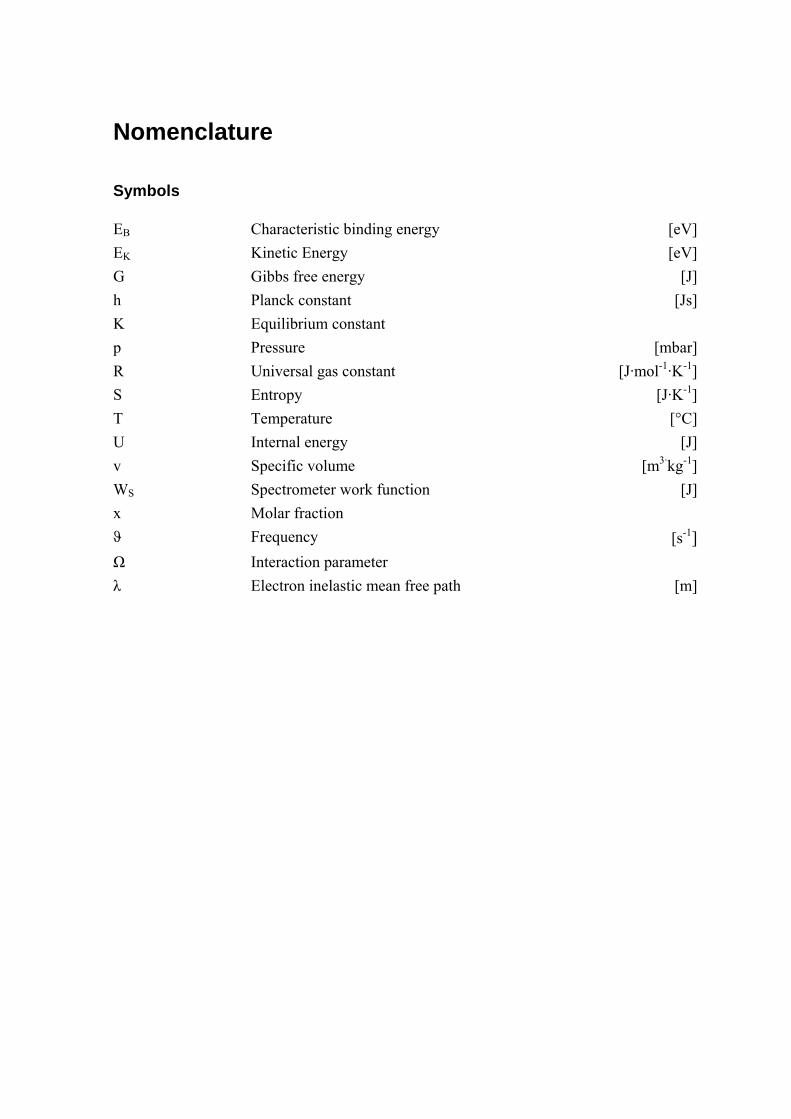
Symbols
EB Characteristic binding energy [eV]
EK Kinetic Energy [eV]
G Gibbs free energy [J]
h Planck constant [Js]
K Equilibrium constant
p Pressure [mbar]
R Universal gas constant [J·mol-1·K-1]
S Entropy [J·K-1]
T Temperature [°C]
U Internal energy [J]
v Specific volume [m3·kg-1]
WS Spectrometer work function [J]
x Molar fraction
ϑ Frequency [s-1]
Ω Interaction parameter
λ Electron inelastic mean free path [m]
II Nomenclature
Acronyms
bcc body-centered cubic
BE Backscattered Electrons
CALPHAD CALculations of PHase Diagrams
CWS Cold Work Tool Steel
DIL Dilatometry
DTA Differential Thermal Analysis
DTG Differential Thermal Gravimetry
EDX Energy Dispersive X-ray spectroscopy
ESCA Electron Spectroscopy for Chemical Analysis
fcc face-centered cubic
FEG Field Emission Gun
HIP Hot Isostatic Pressing
HSS High Speed Tool Steel
HWS Hot Work Tool Steel
Wt.-% Weight percentage
OPS Oxide Polishing Suspension
PE Primary Electrons
PM Powder Metallurgy
RGA Residual Gas Analysis
SE Secondary Electrons
SEM Scanning Electron Microscopy
TGA Thermogravimetry Analysis
UHV Ultra-High Vacuum
Vol.-% Volume percentage
XPS X-ray Photoelectron Spectroscopy
X32 X32CrMoCo3-3-3 (1.2885)
X40 X40CrMoV5-1 (1.2344)
Abstract
The main advantage of Powder Metallurgy (PM) compared to conventional metallurgy for
tool steels is increased mechanical properties by fine dispersion of hard phases, smaller
grain sizes and prevention of macro segregations. However, for Hot Work Tool Steels
(HWS) toughness is a major concern as the materials are subjected to thermal shock during
service. But toughness of PM steels can be reduced by thermodynamically stable oxide
phases present on the powder particle surface. These oxides are formed by alloying
elements with high oxygen affinity such as chromium, vanadium and manganese which
can create a network of oxides in the compact.
This thesis deals with surface analysis of gas atomized HWS powder X40CrMoV5-1 after
heat treatment at different temperatures in vacuum conditions. Efficient reduction of
surface oxides requires knowledge concerning processes of the surface chemistry changes
during heat treatment and sintering. Therefore, X-ray Photoelectron Spectroscopy (XPS)
was used to analyze the changes of the surface composition for different heat treatments.
The heat treatment was performed in a furnace attached to the XPS system in ultra-high
vacuum (UHV) conditions. Afterwards the samples were analyzed by Scanning Electron
Microscopy (SEM) combined with Energy Dispersive X Ray Analysis (EDX) to
investigate morphology, chemistry and distribution of oxides on the powder particle
surface. Additionally, thermoanalytical techniques were used to study the interaction with
the surrounding vacuum.
The results show the presence of a heterogeneous oxide layer on the as-received powder
surface, formed by a homogeneous iron oxide layer and particulate oxides rich in
chromium, manganese, silicon and vanadium. The iron oxide layer is almost completely
reduced after heat treatment at 700 °C. However, this leads to growth of Cr-, Mn-, Si- and
V-rich oxides and segregation of sulfides on the powder surface. The reduction of
chromium oxides starts around 700 °C but further enrichment in Mn, Si and V is observed.
Considerable decrease in the oxygen signal was found after heat treatment at 800 °C,
indicating significant reduction in oxide amount. An almost fully oxide-free powder
surface was detected after heat treatment at 900 °C. Only some vanadium compounds and
sulfides were observed on the powder particle surface. The amount of sulfides increases
with increasing annealing temperature.
The results indicate that high temperature vacuum annealing of the X40CrMoV5-1 powder
before consolidation seems to be feasible to reduce surface oxides and thus improve the
metallic bonding between the powder particles during further consolidation.

IV
1. Introduction
This thesis deals with investigations of oxide phases on a Hot Work Tool Steel (HWS)
powder. HWS are basically used for the hot-forming of work pieces made of metal. For
high performance applications Powder Metallurgy (PM) is often chosen as the way of
production for tool steels. As it is an established way of production for Cold Work Tool
Steels (CWS) and High Speed Tool Steels (HSS), it is not yet a developed method for
HWS [1, 2].
The main benefits of PM for tool steels, compared to conventional metallurgy, are
increased mechanical properties by fine dispersion of hard phases, smaller grain size and
prevention of macro segregations [3]. However, in opposite to CWS and HSS, Hot Work
tool Steels do contain very low amounts of hard phases and toughness is a major concern
as the materials are subjected to thermal shock during service [4]. But toughness of PM
steels can be reduced by oxide phases and further contaminations on the powder particles
due to the presence of alloying elements with high oxygen affinity such as chromium,
vanadium and manganese. Thermodynamically stable oxide phases, present on the particle
surface, reduce the sintering activity since they act as diffusion barriers [5]. Furthermore,
they weaken the inter-particle connections developed as they create a network of oxides
after sintering which reduces the toughness similar to networks of carbides on grain
boundaries in wrought steels [1, 2].
Thus, it is believed that if a proper way to reduce surface oxides before the HIP process
can be found, the metallic bonding between the particles will increase and so toughness
will be enhanced and PM production of HWS could be established. One solution to
implement such a reduction process into the HIP process could be to perform vacuum
annealing of the powder in the HIP capsule before it is sealed.
The aim of this thesis is to analyze the surface of the X40CrMoV5-1 HWS powder and the
processes that take place on the surface during vacuum sintering. This knowledge can be
used to better understand possible ways of controlling the surface chemistry by heat
treatment of the powder in vacuum before HIP and how this process has to be designed to
remove the surface oxides and hence, improve the metallic bonding between the powder
particles.
High resolution techniques, such as X-ray Photoelectron Spectroscopy (XPS) and
Scanning Electron Microscopy (SEM) combined with Energy Dispersive X-ray
Spectroscopy (EDX), are used to investigate the chemical composition and state of the
powder surface and the morphology, distribution and composition of contaminants. To

2 1 Introduction
observe the change in the surface chemistry by annealing, a furnace attached to the XPS
vacuum system is used for heat treatments. Furthermore, thermal analyzing techniques
such as Dilatometry (DIL), Differential Thermal Analysis (DTA), Residual Gas Analysis
(RGA) and Thermogravimetry Analysis (TGA) are applied.
Dilatometry is used to compare the sintering behavior of the loose powder mass, whereas
DTA provides information about the phase changes that take place while heating the
powder up. The RGA and TGA measurements give information about the surface
interaction of the powder with the vacuum.
2 Theoretical background
2.1 Hot Work Tool Steels
Tool steels are mostly used to process metals and plastics [4]. According to EN ISO 4957
[6] forgeable tool steels can basically be classified into three groups:
Cold Work Tool Steels (CWS) own the highest hardening capacity among the tool steels
and can contain a high fraction of carbides to improve the wear resistance. They are used
to temperatures up to ~250 °C. In Hot Work Tool Steels (HWS) precipitation hardening is
used to increase the creep resistance as they are used for work piece temperatures from
about 400 to 1200 °C. High Speed Tool Steels (HSS) are a combination of both former
mentioned steels. They contain carbides in a creep-resistant and hardened matrix [4].
The main application field of HWS is the hot-forming of work pieces made of metal. The
group of HWS itself can be divided into three subgroups as well. Steels with low
secondary hardening such as e.g. 56NiCrMoV7 are used for forging dies. The second
group contains steels with a significant secondary hardening. For example, the steel
X40CrMoV5-1 (X40) is used for casting molds and pressure casting dies for aluminum
alloys. Therefore it is quenched and tempered to strengths of about 1450 - 1600 MPa.
HWS of the third group are used for very high temperature applications. It is based on
oxidation resistant austenitic steels and nickel-base alloys. Both are used because they
undergo less diffusion induced creep due to their denser atomic packaging in the face-
centered cubic lattice [4].
The durability of HWS mostly depends on the wear resistance and fracture toughness. The
wear resistance is important to decrease abrasion and depends, amongst other things, on
the hardness and the content and distribution of carbides. Contrary to CWS and HSS, in
Hot Work Tool Steels high fracture toughness is very important as well to delay cracks.
This is due to temperature changes during service. These induce plane stresses by thermal
expansion and contraction of the surface. At non-metallic inclusions and carbides this leads
to micro plastic deformations and that again initiates cracks. By penetration of the work
piece into these cracks, parts of the work piece stick to the tool and thus the cracks can be
driven even deeper into the tool due to the wedge effect and eventually fracture the tool.
The higher the fracture toughness of the tool material, the deeper the crack can penetrate
before breakdown [4, 7].
4 2 Theoretical background
2.2 Powder Metallurgy
Powder Metallurgy (PM) is concerned with the processing of powders into useful
engineering components. The principle of all PM methods is to densify powder material by
using temperatures below the liquidus temperature of the main component and in some
cases additional pressure [5].
There are some key attributes for the use of powder metallurgy:
For high performance applications the main reason to use PM is the possibility to
achieve superior mechanical properties compared to cast products. This is due to lower
grain and carbide sizes, prevention of macro-segregation and isotropic material
properties. This makes powder metallurgy very attractive for tool steels [4, 5].
PM can be used for achieving properties which cannot be achieved by conventional
production techniques at all, like e.g. filtering materials by not completely densifying
the powder [4, 5].
PM enables the economical production of complex parts, like components for the
automotive industry, e.g. valve seat, shock absorber components, etc. This area is
dominated by concerns over productivity, tolerances and automation [5]. With choosing
powder metallurgy as a way of production, a large production volume can be achieved
with a near net shape. Hence, production steps are reduced and exploitation of raw
material is increased to about 95% [8].
PM enables the production of materials which would be hard or impossible to produce
by other technique such as hard and high-temperature materials, ceramics, etc. [5].
2.2.1 Steel powder production
There is a close correlation between the quality of the powder and the properties of the
finished product which gives the powder production a big weight in the whole PM
production procedure. There are several ways to produce powders. It can be done
mechanically without phase change like milling, or mechanically with phase change like
atomization processes with water or gas. Other possibilities are to produce powder by
electrolysis or reduction processes of e.g. oxides [8]. The powder investigated in this thesis
was produced by atomization, thus this method will be explained in more details.
The production of metal powders by disintegration of molten material is generally regarded
as the most economical method for alloys. Size, form and structure of the produced
particles vary over a very broad range. These attributes depend on the amount of energy
applied to the melt, the temperature and viscosity of the melt, the surface tension and the
cooling rate. These factors also influence each other – for example, with increasing
2.2 Powder Metallurgy 5
temperature the viscosity decreases, etc. In general it can be said that with decreasing
viscosity the particles become more spherical [8].
The solidification time of the metal droplets depends on their size and lies between 1 and
50 ms. This is equal to a cooling rate of 103 to 104 Ks-1. Such high cooling rates inhibit
strong segregations of elements in an alloy. So, it is enough to keep even those elements in
solution in the matrix phase which otherwise would form coarse structural phases such as
carbides in HSS. Even meta-stable states can appear in certain alloys. There are two
methods that can reach such high cooling rates. One technique is the so called “splat
quenching”. In this technique melt droplets impact on a cooled metal target. This leads
mostly to flake-shaped powders. The other technique is the atomization by water or gas
impact and cooling of the droplets by accelerated convection in gases or water. This is the
most often used method in practice for prealloyed steels [8].
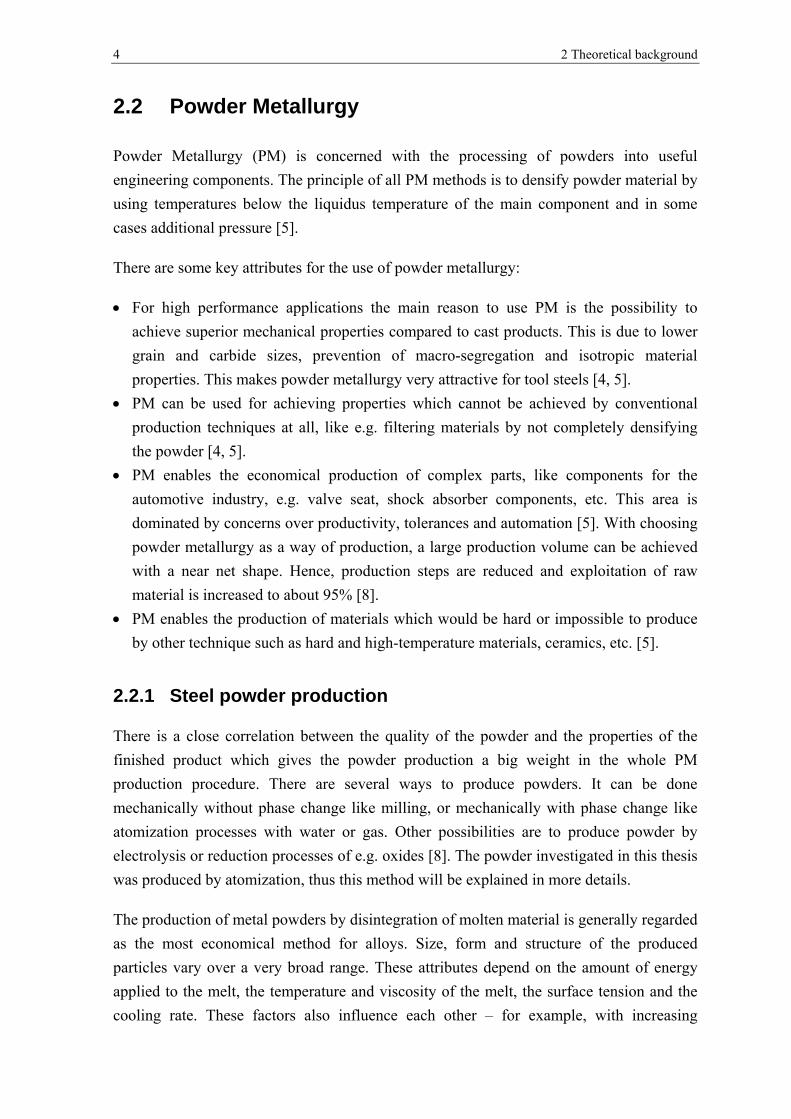
Figure 1: Schematic drawing of the atomization process of prealloyed powder; redrawn from [8]; 1.) Prealloyed melt; 2.) Gathering cup; 3.) Nozzles; 4.) Container
The principle of this technique is shown in figure 1. High pressure water or gas jets impact
on the molten metal stream and disintegrate it into droplets which then solidify rapidly.
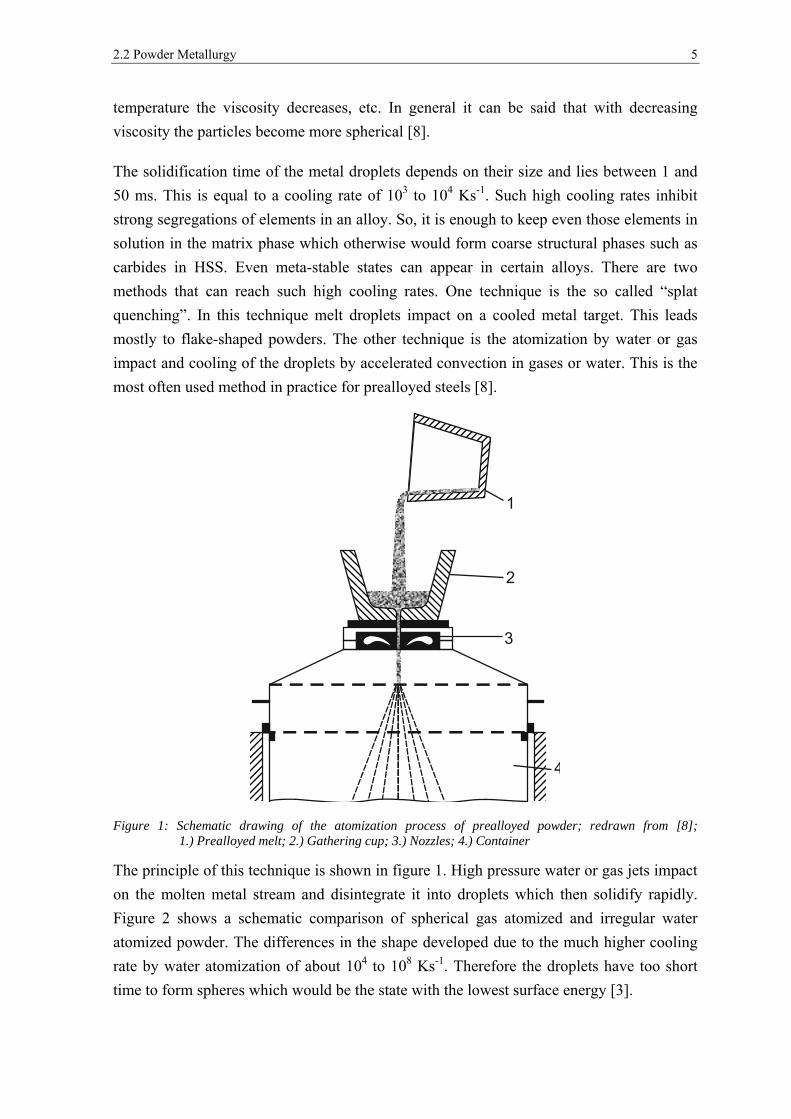
Figure 2 shows a schematic comparison of spherical gas atomized and irregular water
atomized powder. The differences in the shape developed due to the much higher cooling
rate by water atomization of about 104 to 108 Ks-1. Therefore the droplets have too short
time to form spheres which would be the state with the lowest surface energy [3].
1
2
3
4
6 2 Theoretical background
Figure 2: Schematic comparison of gas (spherical) and water (irregular) atomized steel powder, repainted from [9]
Both techniques, respectively powder shapes, have a few advantages and disadvantages.
The water atomization produces irregular shaped powder and thus leads to a higher surface
area. Therefore, the sintering activity is enhanced as the reduction of surface is the driving
force for sintering (see chapter 2.2.2). Also, the irregular particles are easier to compact
and the green strength is higher compared to spherical powder as the irregular particles
tend to mechanically interlock. On the other hand, the spherical shape of the gas atomized
powder leads to the highest settled apparent density. This is important for high alloyed
steels as they are difficult to compress. In addition the oxide content in water atomized
steels powder is much higher compared to the gas atomized because of the larger surface
and the use of highly oxidizing water. Water atomizing is thus only used for elemental iron
and low alloyed steels as some alloying elements form very stable oxides (see chapter 2.3)
[5]. Hence, for atomization of high alloyed steels inert gases like argon, helium or nitrogen
are used. Besides the low price for nitrogen, its main advantage is that it is soluble in steels
(max. 2.8 wt.-% in pure γ-Fe [10]) contrary to argon and helium which have no solubility
at all. Thus nitrogen gas inclusions from the atomization process can be removed
afterwards, whereas this cannot be done for argon and helium inclusions [8].
2.2.2 Sintering and Hot Isostatic Pressing
In the conventional press and sintering route, previous to sintering the powder is usually
mixed, compacted and shaped [5]. As in this thesis high alloyed powder is used, it cannot
be processed in a conventional sintering route by pressing before sintering due to the high
alloying content in the powder, resulting in high powder hardness and so very low
compressibility. To achieve best possible properties of the tool, the powder is supposed to
be processed by Hot Isostatic Pressing (HIP), which is an advanced technique of sintering.
Therefore it is important to know how these techniques work and which factors are of
importance during respective consolidation.
2.2 Powder Metallurgy 7
Solid state sintering
Sintering is a method to densify a loose or compacted powder by using elevated
temperatures. The temperature reaches about 2/3 to 3/4 of the solidus temperature of the
powder material. The driving force for the consolidation of the loose powder to a solid
body is the reduction of free enthalpy by reducing inner and outer surfaces, such as the
powder particle surfaces, pore channels and walls as well as grain boundaries [11]. The
main parameters to control this process are temperature, time, particle size and the
diffusion coefficient as this is a diffusion controlled process [8]. The emphasis of these
factors depends on the time since they change during sintering [12].
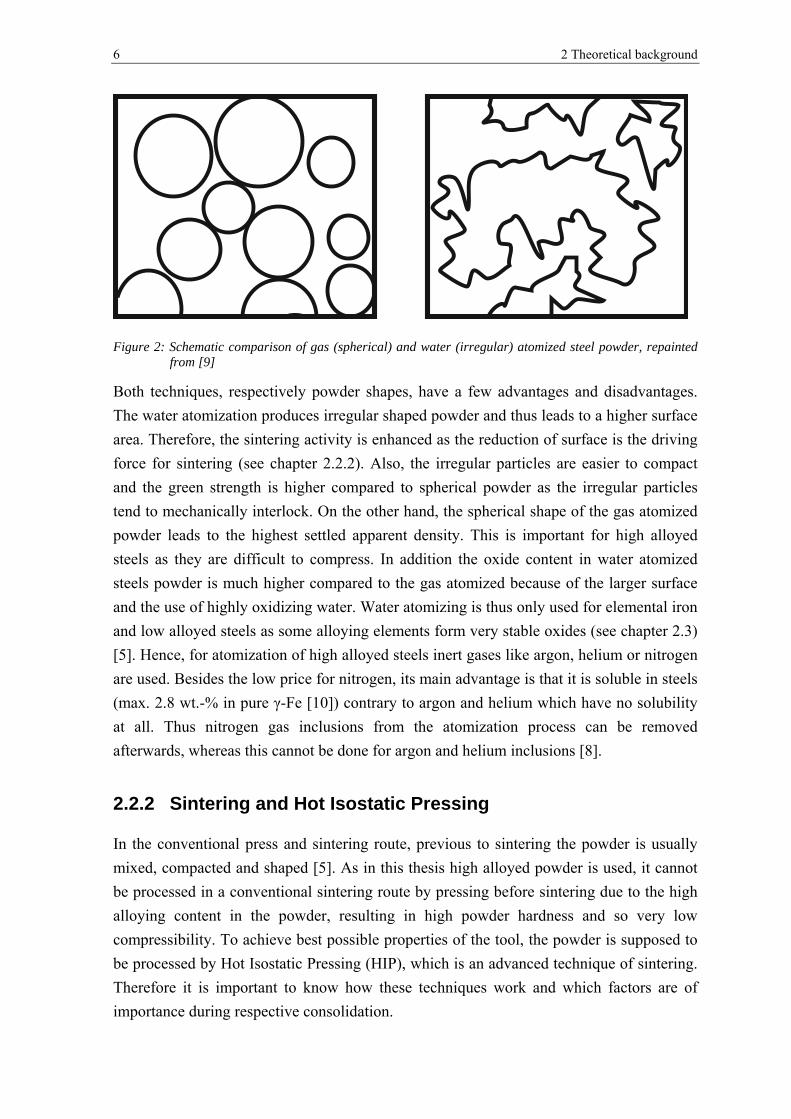
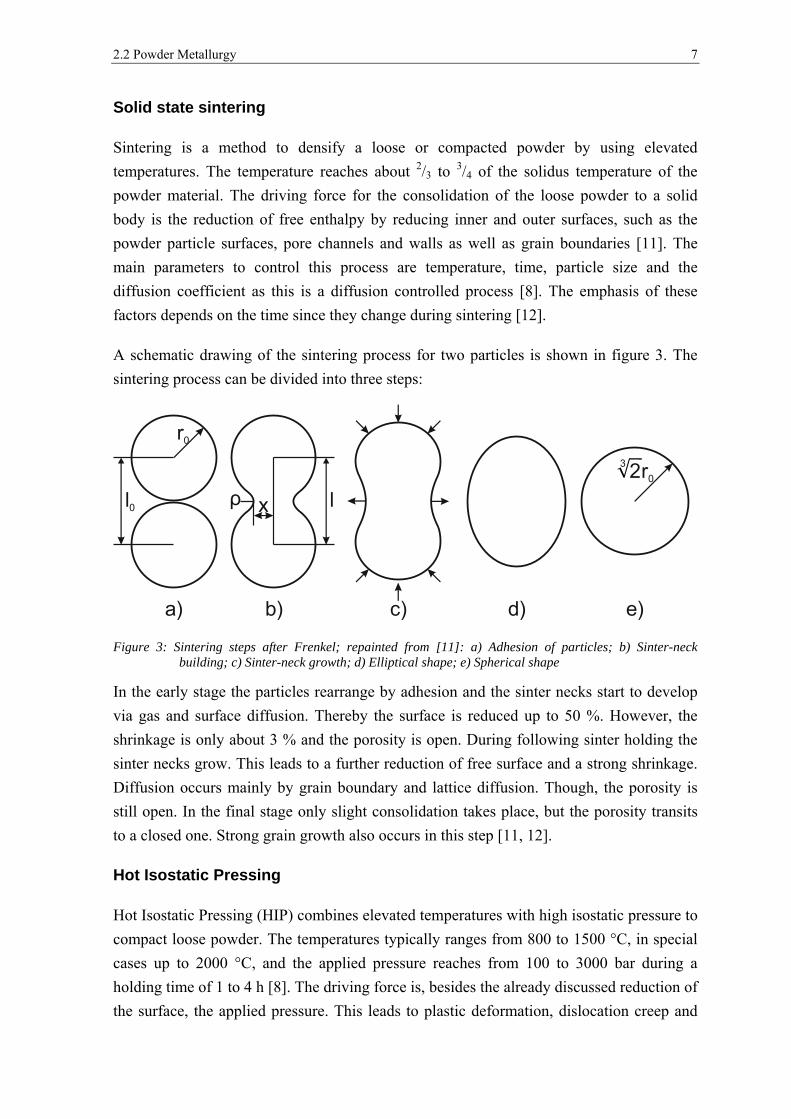
A schematic drawing of the sintering process for two particles is shown in figure 3. The
sintering process can be divided into three steps:
Figure 3: Sintering steps after Frenkel; repainted from [11]: a) Adhesion of particles; b) Sinter-neck building; c) Sinter-neck growth; d) Elliptical shape; e) Spherical shape
In the early stage the particles rearrange by adhesion and the sinter necks start to develop
via gas and surface diffusion. Thereby the surface is reduced up to 50 %. However, the
shrinkage is only about 3 % and the porosity is open. During following sinter holding the
sinter necks grow. This leads to a further reduction of free surface and a strong shrinkage.
Diffusion occurs mainly by grain boundary and lattice diffusion. Though, the porosity is
still open. In the final stage only slight consolidation takes place, but the porosity transits
to a closed one. Strong grain growth also occurs in this step [11, 12].
Hot Isostatic Pressing
Hot Isostatic Pressing (HIP) combines elevated temperatures with high isostatic pressure to
compact loose powder. The temperatures typically ranges from 800 to 1500 °C, in special
cases up to 2000 °C, and the applied pressure reaches from 100 to 3000 bar during a
holding time of 1 to 4 h [8]. The driving force is, besides the already discussed reduction of
the surface, the applied pressure. This leads to plastic deformation, dislocation creep and
r0
l0 ρ x l
3 2r0
a) b) c) d) e)
8 2 Theoretical background
viscous flow. Due to this second driving force, the applied temperature is lower compared
to solid state sintering [5].
In the HIP technique the powder is filled in a capsule and this capsule is vacuum degassed
and sealed. Afterwards the capsule is placed in the vessel. The isostatic pressure is applied
by gas which is usually argon [8].
Compared to ordinary sintering, this method has a few advantages and disadvantages. The
lower temperature leads to lower grain growth and by the use of pressure the densification
increases. Thus, HIP is chosen if very high material properties are needed. Nevertheless,
the whole process requires long cycling times and expensive and sensible molds. The
product shape is also limited due to the encapsulation [8]. As the applied pressure is
isostatic, the shear stresses on the particles are very low. This means that contaminations
present on the particle surface are not going to be destroyed and network-like pattern can
even be seen in the full-density state [5].
2.3 Oxides on powder surfaces
The powder surface is one of the main determining factors for the properties of PM
products as it defines the connection between the powder particles. Therefore, it is
mandatory to know how to control the powder surface chemistry and how it interacts with
the surrounding atmosphere while sintering. There are two basic drawbacks by
contamination of the powder surface. Firstly, the contaminations, e.g. oxide phases, act as
a diffusion barrier due to the low diffusion through them, since they are mostly ceramic
phases. This leads to a slower sintering process [3]. Secondly, the contaminations weaken
the metallic bonding between the particles which leads to worse mechanical properties,
especially ductility and fatigue [2, 7].
Weddeling et al [13] showed for gas atomized, high alloyed Mn-Cr austenitic steel powder
that the surface is covered by a thin iron-oxide layer of about 4 nm thickness. Oxygen
affine elements such as chromium, manganese and silicon form larger oxide particulates
generating island-like pattern on the powder surface. Continuative investigations of
Zumsande et al [14] revealed that removal of main parts of these surface oxides is possible
by annealing in ultra-high vacuum conditions and high temperatures.
Although the X40CrMoV5-1 powder investigated in this work is differently alloyed, both
materials contain considerable amounts of chromium, manganese and silicon and
additionally vanadium in the X40. Thus it is expected that annealing under the same
conditions can also remove main parts of the surface oxides covering the X40 powder.
2.3 Oxides on powder surfaces 9
2.3.1 Thermodynamic description of oxide reduction
Chemical reactions occur spontaneously when the difference in the Gibbs free energy ΔG
of the reaction products and the reactants is negative:
∆ Σ Σ 2.1
Without any reducing agent the removal of oxides occurs by dissociation according to:
2 2 2.2
Me denotes the metal and MexOy its oxide. Taking Formula (2.1) and (2.2) into account the
change of the Gibbs free energy becomes equal to:
∆2 2
2.3
The equilibrium constant K can be defined which indicates the direction of a reaction:
∆ 2.4
with the gas constant R (8.314 J·mol-1·K-1) and the temperature T in Kelvin. The
equilibrium constant K can be determined by dividing the activities of the reaction
products by the activities of the reactants:
∙ 2.5
The activity is a measure of the “effective concentration” of an element in a mixture and is
defined by the ratio of its vapor pressure in the mixture and the vapor pressure of the same
element as a pure solid or liquid under the same environmental conditions. This means that
the activity of an ideal gas is equal to its partial pressure. Therefore equation (2.5) ,
assuming O2 as an ideal gas, can be expressed as:
2.6
10
Cons
deter
[15,
datab
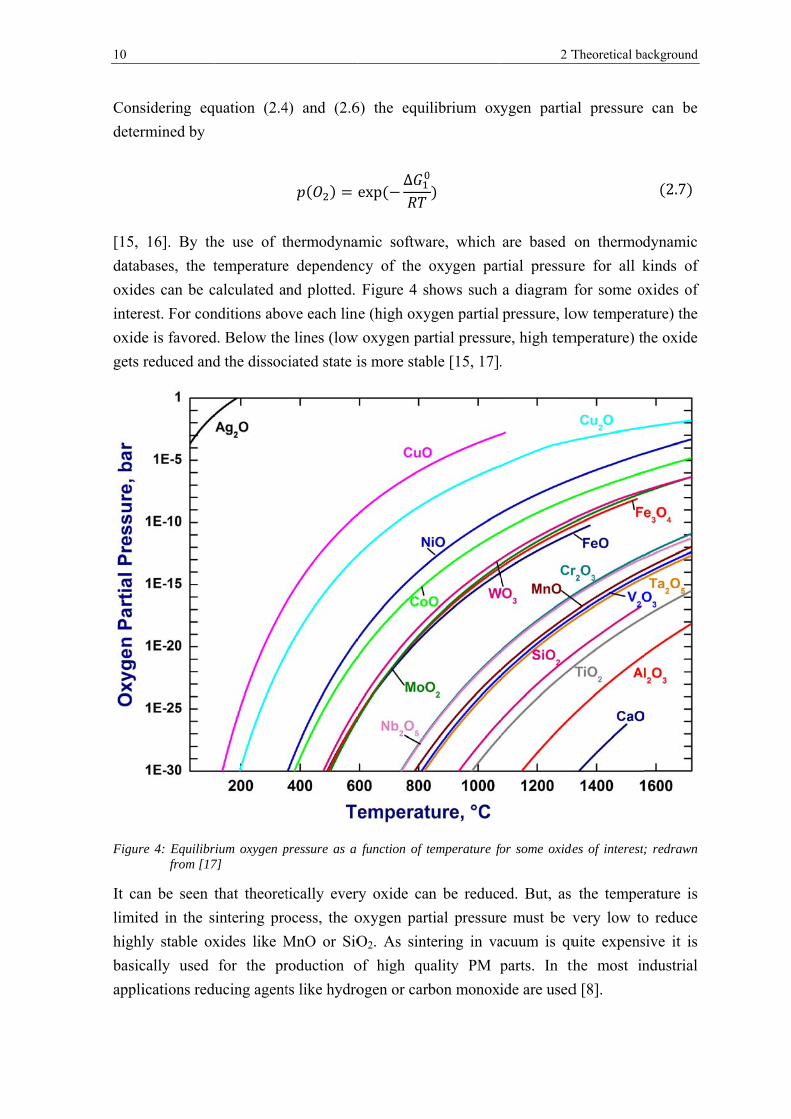
oxide
intere
oxide
gets r
Figur
It ca
limit
highl
basic
appli
sidering eq
rmined by
16]. By th
bases, the t
es can be c
est. For con
e is favored
reduced and
re 4: Equilibrfrom [17
an be seen t
ted in the s
ly stable ox
cally used
ications red
quation (2.4
he use of t
temperature
calculated a
nditions abo
d. Below the
d the dissoc
rium oxygen p7]
that theoret
intering pro
xides like M
for the pr
ducing agent
4) and (2.6
thermodyna
e dependen
nd plotted.
ove each lin
e lines (low
ciated state i
pressure as a
tically ever
ocess, the o
MnO or SiO
roduction o
ts like hydro
6) the equi
exp∆
amic softwa
ncy of the
Figure 4 s
ne (high oxy
w oxygen pa
is more stab
function of t
ry oxide can
oxygen part
O2. As sint
of high qu
ogen or carb
librium ox
are, which
oxygen par
hows such
ygen partial
rtial pressur
ble [15, 17].
temperature fo
n be reduc
tial pressur
tering in va
uality PM
bon monox
2 T
ygen partia
are based
rtial pressur
a diagram
pressure, lo
re, high tem
.
for some oxide
ed. But, as
e must be v
acuum is qu
parts. In th
ide are used
Theoretical ba
al pressure
on thermod
ure for all k
for some o
ow tempera
mperature) th
des of interest
the tempe
very low to
uite expens
the most in
d [8].
ackground
can be
2.7
dynamic
kinds of
oxides of
ature) the
he oxide
; redrawn
rature is
o reduce
sive it is
ndustrial
2.3 Ox
Carb
calle
follo
2
The r
2
This
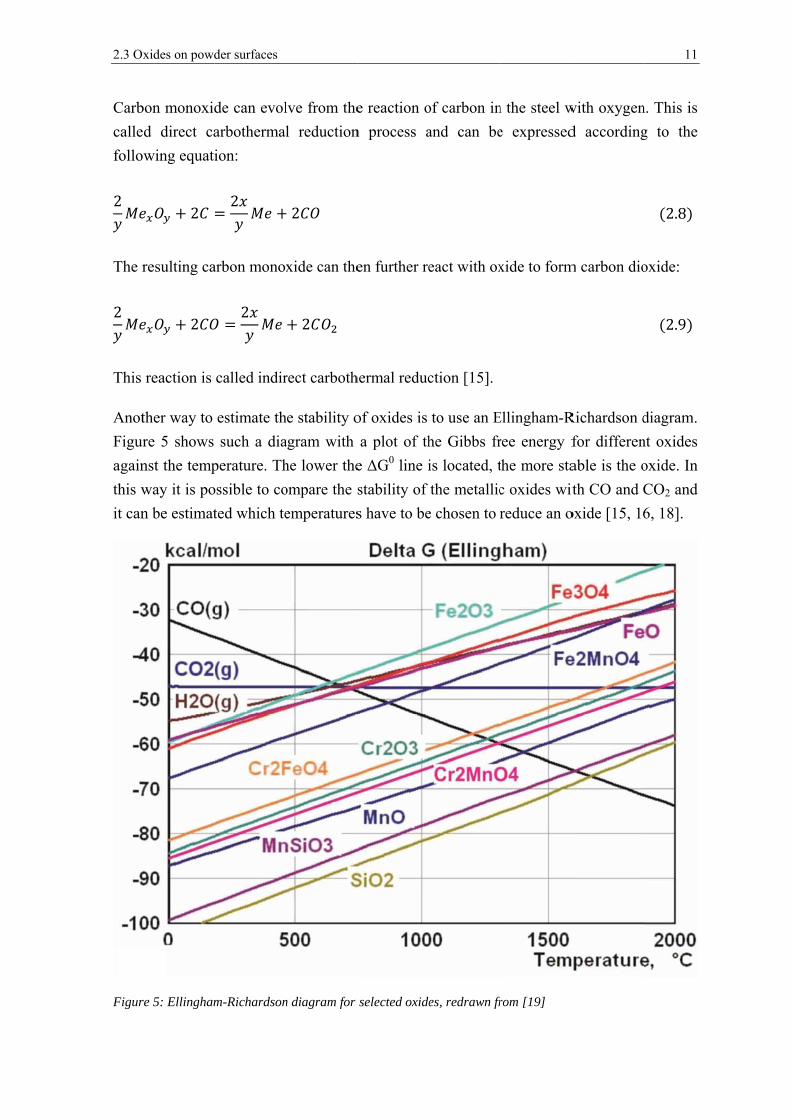
Anot
Figur
again
this w
it can
Figur
xides on powd
bon monoxid
d direct ca
wing equati
2
resulting ca
2
reaction is
ther way to
re 5 shows
nst the temp
way it is po
n be estimat
re 5: Ellingham
der surfaces
de can evol
arbothermal
ion:
2
arbon monox
2
called indir
estimate th
such a dia
perature. Th
ossible to co
ted which te
m-Richardson
lve from the
l reduction
2
xide can the
2
rect carboth
he stability o
agram with
he lower the
ompare the s
emperatures
n diagram for
e reaction o
n process a
en further re
hermal reduc
of oxides is
a plot of th
e ΔG0 line i
stability of
s have to be
selected oxide
of carbon in
and can be
eact with ox
ction [15].
to use an E
he Gibbs fr
is located, t
the metallic
e chosen to r
es, redrawn fr
n the steel w
e expressed
xide to form
Ellingham-R
ree energy f
the more sta
c oxides wit
reduce an o
rom [19]
with oxygen
d according
m carbon dio
Richardson d
for differen
able is the o
th CO and
oxide [15, 16
11
n. This is
g to the
2.8
oxide:
2.9
diagram.
nt oxides
oxide. In
CO2 and
6, 18].
12 2 Theoretical background
Furthermore it can be seen that the Gibbs free energy lines of CO and CO2 do also have an
intersection point. This is due to the so called Boudouard reaction which favors the
stability of CO above 720 °C [15, 16].
2.3.2 Previous investigations on X40CrMoV5-1
First attempts to produce X40CrMoV5-1 (X40) in a PM route by atomizing and HIP
processing were done in the 1980’s [20]. Recent investigation revealed, that HIPed
material of the X40 shows less ductility compared to cast material [1, 2]. Both authors,
Schneiders and Wendl, explain the less contraction of area by fractures along the former
powder particle boundaries, which are probably weakened by residual contamination
layers. This leads to higher localized strain and thus transcrystalline fracture surfaces.
Analogue to the ductility it lowers the impact work [1]. The mechanical properties of the
HIPed material can be improved by hot forming as this destroys the oxide networks, but
this is not economically efficient [2].
A hint that this weakening of the former particle boundaries is due to oxides on the powder
surfaces is given by the diploma thesis of Oppenkowski [21] who analyzed, amongst other
things, the influence of fused tungsten carbides in the X40 powder after HIP. He found out
that the addition of 10 vol.-% of fused tungsten carbides to the X40 powder enhances the
fracture toughness. Even an addition of 30 vol.-% leads to the same fracture toughness as
the X40 alone, although increasing hard phase contents usually lower the fracture
toughness. This is due to the fact that with increasing hard phase content, the distance a
crack has to pass through the ductile matrix from one brittle hard phase to another
decreases [22]. The enhancement in fracture toughness is explained by the binding of
oxygen in the fused tungsten carbides during the HIP process and so the metallic bonding
between the powder particles improves [21].
In [1] some attempts to remove surface contaminations by drying, annealing in hydrogen
containing atmosphere at 550 °C or annealing in medium vacuum conditions (4·10-2 mbar)
of up to 1050 °C were performed, but no pronounced improvement of the mechanical
properties could be achieved. However, no systematical investigation of the effect of
different vacuum annealing conditions prior HIP processing on the contamination layer has
been performed yet.
Therefore, the as-received powder is studied in this work to identify the contaminations
present. Furthermore, different vacuum annealing conditions are applied to observe the
changes in the powder surface chemistry and the interaction with the surrounding
atmosphere. In the end, this knowledge can be used to design a vacuum annealing process
prior to HIP and thus improve the bonding between the former powder particles in the final
product.

2.4 Material and experimental techniques 13
2.4 Material and experimental techniques
A wide range of analytical techniques are used for the powder characterization in this
thesis. Table 1 gives a short overview of those techniques and their use. A detailed
description can be found in the following chapters.
Table 1: Overview of the applied experimental techniques
Experimental technique Use in the investigation
X-ray Photoelectron Spectroscopy (XPS) combined with Ar-ion sputtering
Surface chemical analysis Chemical state identification Depth profiling
Scanning Electron Microscopy (SEM) combined with Energy Dispersive X-ray spectroscopy (EDX)
Morphology of the powder surface Chemical microanalysis Imaging of powder cross sections
Thermogravimetry Analysis (TGA) Extend of weight loss (oxide removal) during heating
Residual Gas Analysis (RGA) Analysis of the emission products composition while heating
Differential Thermal Analysis (DTA) Analysis of phase transformations
Dilatometry (DIL) Analysis of sintering behavior
Calculation of phase transformations (CALPHAD)
Estimation of phase transformations
2.4.1 Material and sieve analysis
The steel powder under investigation in this thesis is the Hot Work Tool Steel
X40CrMoV5-1 (material number: 1.2344, according to DIN EN 10027-1 [23]) which was
atomized with inert gas. The chemical composition according to [1] can be seen in table 2.
The amount of silicon is lower than the limit set in EN ISO 4957 [6].
Table 2: Nominal chemical composition of the investigated steel powder in wt.-%
Material C Cr Mo V Mn Si
X40CrMoV5-1 0.39 5.19 1.36 0.98 0.28 0.24
The sieve analysis has been performed after DIN ISO 4497 [24] and DIN 66165 [25] with
vertically arranged vibratory sieves and mesh sizes of 200, 150, 100, 63, 36 and 25 μm.
2.4.2 X-ray Photoelectron Spectroscopy
The X-ray Photoelectron Spectroscopy (XPS), also known as Electron Spectroscopy for
Chemical Analysis (ESCA), is a surface sensitive method for analyzing chemical
14 2 Theoretical background
compositions and states of solids [26]. Hence, it was used to analyze the surface chemistry
of the powder particle of the steel under investigation in this thesis. Furthermore, combined
with argon-ion etching it gave the possibility for depth profiling.
An XPS-system is basically build of an X-ray source, an electron analyzer and a sample
holding device with attached sample preparation facilities, all kept under an ultra-high
vacuum (UHV). The UHV-vacuum is necessary to avoid interactions of the released
electrons with the molecules in the atmosphere. Common X-ray sources are aluminum
(Kα=1486.6 eV) and magnesium (Kα=1553.6 eV) [26].
The principle of this technique is to irradiate the sample with monochromatic soft X-rays.
This leads to the emission of the electrons due to the photoelectric effect. These electrons
carry characteristic information in the energy level about the emitting atom. By plotting the
number of emitted electrons over their kinetic energy a spectrum can be received. As every
element has its own characteristic spectrum, the obtained spectrum of an alloy is roughly
the sum of elemental spectra of all individual elements [26].
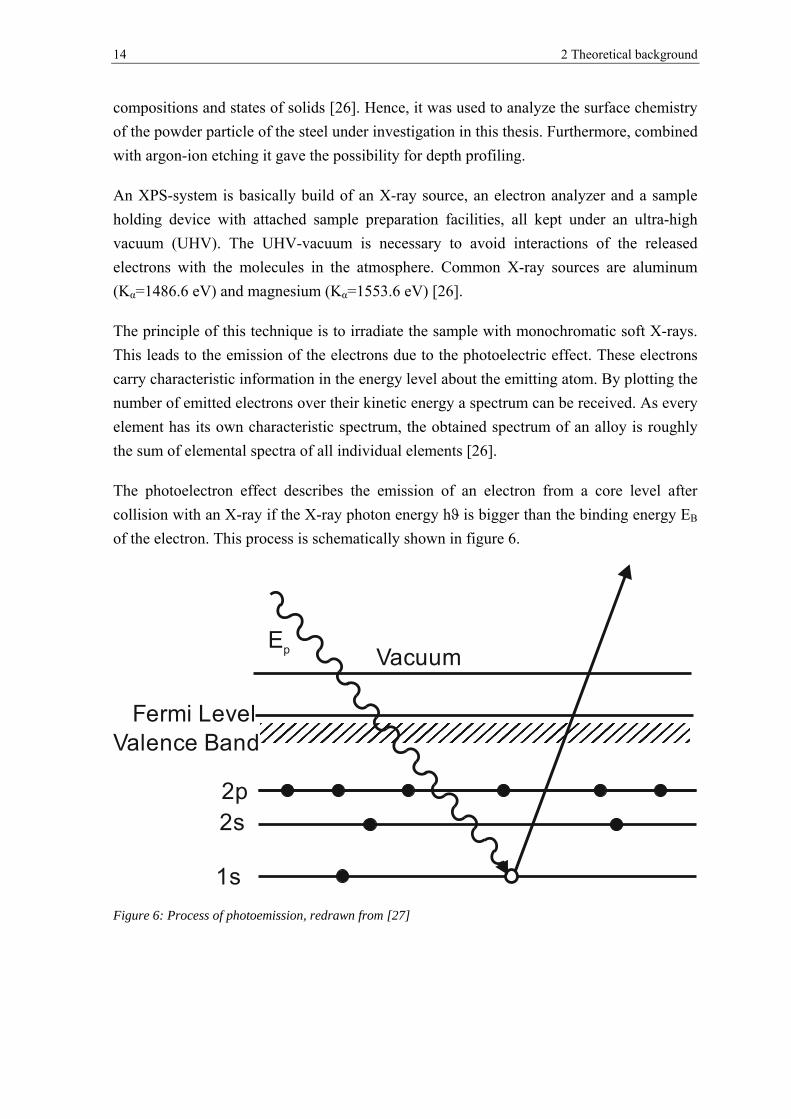
The photoelectron effect describes the emission of an electron from a core level after
collision with an X-ray if the X-ray photon energy hϑ is bigger than the binding energy EB
of the electron. This process is schematically shown in figure 6.
Figure 6: Process of photoemission, redrawn from [27]
1s
2s2p
Vacuum
Valence BandFermi Level
Ep
2.4 Material and experimental techniques 15
The kinetic energy EK of the released electron is described by
2.10
Thus the kinetic energy EK is not a intrinsic material property. The parameter WS is the so
called spectrometer work function which is identified during calibration of the
spectrometer. After rewriting equation (2.10) to
2.11
the binding energy EB can be calculated which allows to identify the element of origin, as
the binding energy is characteristic for each element [27].
Beside the peaks, the spectrum is composed of a background. Ejected electrons can
undergo inelastic scattering on molecules of the specimen or the atmosphere, which leads
to a loss of kinetic energy during the escape and the formation of a background in the
spectrum. Whereas electrons that escape without any scattering and thus without energy
loss form the characteristic peaks. The scattering of electrons on atoms is also the reason
for the high surface sensitivity of XPS, as only electrons from the top tens of angstroms
below the surface have a chance to escape without scattering, even if the ionization depth
is deeper [26]. Therefore the XPS information depth is up to 10 nm. In general, the
information depth depends on the electron mean free path λ, which is a function of the
kinetic electron energy and also depends on the material under investigation [28]. About
65 % of the measured signal will emanate from a depth < λ, 85 % from a depth < 2 λ and
95 % from a depth < 3 λ [27]. For the elements Fe, Mn and Cr and their oxides λ has a
value between 1 and 2 nm [19].
The chemical composition can be derived by the area under each peak. Beside the
chemical composition, the chemical state of the atoms can also be determined by XPS. The
chemical bonding leads to differences in the binding energies of the electrons in the shells.
This in turn leads to a shift of a few electron volts in the XPS spectrum, which can be used
to identify the binding state [28].
To describe the origin of an emitted electron the so called chemists' or spectroscopists
notation formalism is used. It names the photoelectrons on the basis of their quantum
numbers. The peaks observed in the spectra are labeled by the scheme nlj. The n specifies
the principal quantum number which refers to the electron shell. In the periodic table the
shells are labeled by letters, beginning with K along the alphabet. The shell K corresponds
to a quantum number n=1, L to n=2, etc. According to that, n can only have positive
integer values [27].
16 2 Theoretical background
The l describes the orbital angular momentum which determines the shape of the orbital.
Values of l range from 0 to n-1, i.e. in the shell M(n=3) l can have values from 0 to 2. For
XPS usually a letter is used instead of a number which is shown in Table 3.
Table 3: Notation of the quantum numbers [27]
Value of l Usual notation
0 s
1 p
2 d
3 f
Peaks in the spectra that origin from orbitals with an angular momentum number higher
than 0, are usually split into two, due to the interaction of the spin with its orbital angular
momentum. The spin angular momentum s can have either the value of +1/2 or -1/2. The
quantity j can be determined by vector addition of l and s: j=|l+s|. Thus, one electron from
the same shell can have two different values corresponding to the prefix of s. The ratio of
the peak intensities of these double peaks can be looked up in corresponding literature. The
value of the energy difference between those double peaks is a function of the strength of
the spin orbit and the atomic number [27].
Reading the spectrum
The XPS-spectra are plotted as a number of electrons in a certain energy interval against
the electron binding energy. The horizontal axis usually begins with a value of zero with
reference to the Fermi level and increases to the left [27]. For the spectra interpretation the
user has to know which kinds of peaks can occur and where they originate from.
The narrowest lines that can be observed in the spectra are typically the photoelectron
lines. They appear as most intensive and relatively symmetric. These lines are mainly used
for the analysis.
Auger lines show a quite complex pattern. As they are a consequence of the photoemission
process, they carry characteristic information about the elements of origin and can
additionally be evaluated.
By use of non-monochromatic X-rays so called satellite lines occur. This happens as
magnesium and aluminum X-ray source do not only emit Kα1,2 X-rays, but also K1-6 and Kβ
X-rays.
As no anode material is completely pure, impurities lead to the emission of some different
X-rays as well. This could be e.g. magnesium in aluminum or vice versa. These ghost lines
result in small peaks corresponding to the main peak and should not be considered in line
identification.
So called shake-up lines appear in rare cases when an ion is left in an excited state, a few
2.4 Material and experimental techniques 17
electron volts above the ground state. The difference in the electron binding energy leads
to a difference in the kinetic energy and with that to the formation of a satellite peak, a few
electron volts lower than the main peak.
Furthermore, multiplet splitting can cause a photoelectron line to split into asymmetrical
components. Interactions of photoelectrons with other electrons lead to the so called
energy loss lines about 20 - 25 eV above the energy of the parent lines [26].
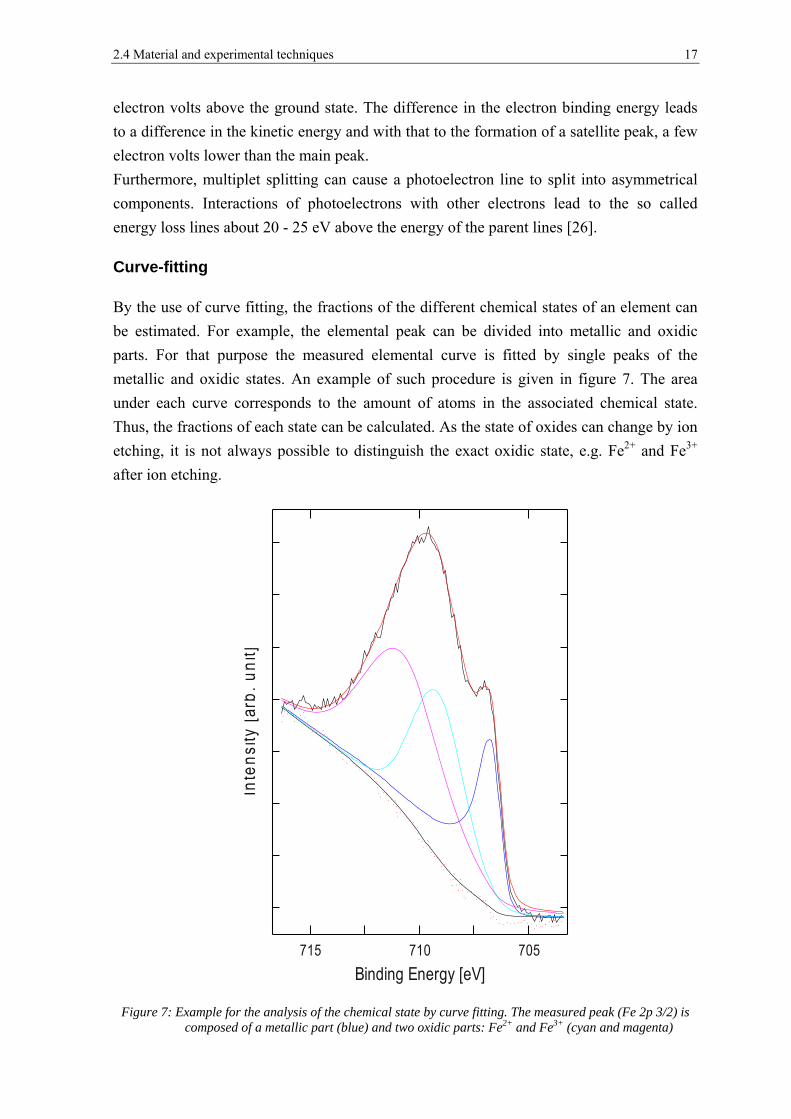
Curve-fitting
By the use of curve fitting, the fractions of the different chemical states of an element can
be estimated. For example, the elemental peak can be divided into metallic and oxidic
parts. For that purpose the measured elemental curve is fitted by single peaks of the
metallic and oxidic states. An example of such procedure is given in figure 7. The area
under each curve corresponds to the amount of atoms in the associated chemical state.
Thus, the fractions of each state can be calculated. As the state of oxides can change by ion
etching, it is not always possible to distinguish the exact oxidic state, e.g. Fe2+ and Fe3+
after ion etching.
Figure 7: Example for the analysis of the chemical state by curve fitting. The measured peak (Fe 2p 3/2) is composed of a metallic part (blue) and two oxidic parts: Fe2+ and Fe3+ (cyan and magenta)
Binding Energy [eV]
Inte
nsi
ty [
arb
. u
nit]
705710715

18 2 Theoretical background
Experimental setting
An instrument PHI 5500 by Physical Electronics was used for measurements in this work.
The analyzed area was about 0.8 mm in diameter. This implies that a large number of
particles were measured at once and thus, the measurements give statistically reliable
average results of the general powder surface composition.
Controlled ion etching was performed by the use of an argon beam with an accelerating
voltage of 2 or 4 kV. The raster area of the argon beam was 4 mm x 5 mm. This
corresponds to an etch rate of about 3 nm·min-1. The calibration of the etch rate was
performed on a flat oxidized tantalum foil.
The heat treatment took place in a furnace attached to the XPS system in ultra-high
vacuum conditions of about 10-7 mbar to avoid exposition to air. The annealing time was
1 h for each heating step. For investigations of the as-received state, the powder was
pressed into aluminium plates or glued on a carbon tape. The risk of contamination from
Al plates is the disadvantage of the pressing on it. On the other hand, mounting on a sticky
carbon tape leads to risk of overestimation of the measured carbon content. The
comparison of both allows estimating how strong the mounting type influences the
measurements. The powders heat treated from 500 to 800 °C were pressed on copper
plates. For those samples heat treated at 900 and 1000 °C the pressing on plates was not
necessary, as the powder starts to sinter during the heat treatment. Hence, the loose powder
mass was placed in a small container made of stainless steel without risking to loos powder
particles within the UHV-system when moving the sample after heat treatment.
2.4.3 Scanning Electron Microscopy
The Scanning Electron Microscope (SEM) is a microscope which uses a focused electron
beam that scans the surface and produces an image of the object by measuring the
interaction of the beam with the material. The use of an electron beam provides a number
of benefits compared to light microscopy. As the wavelength of the electrons is very short
and the parallelism of the beam high, big magnifications of theoretically up to 1,000,000:1
with simultaneous high depth sharpness can be achieved. On the other hand, the images do
not carry any color information. Thus, only a light-dark contrast can be displayed.
In SEM an electron source provides the electrons which are accelerated in an electric field
with common voltage of up to 30 kV. The beam is focused and controlled by magnetic
coils. To avoid interactions between the electron beam and the surrounding atmosphere the
process takes place under high vacuum conditions.
2.4 Material and experimental techniques 19
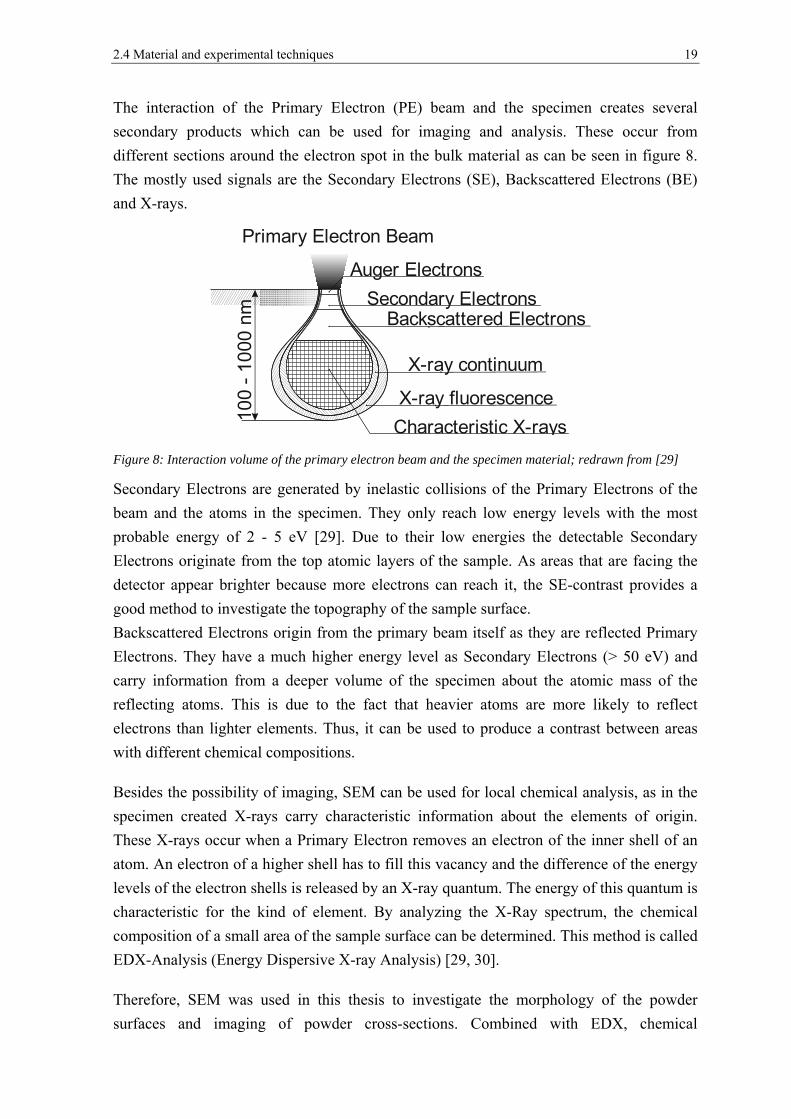
The interaction of the Primary Electron (PE) beam and the specimen creates several
secondary products which can be used for imaging and analysis. These occur from
different sections around the electron spot in the bulk material as can be seen in figure 8.
The mostly used signals are the Secondary Electrons (SE), Backscattered Electrons (BE)
and X-rays.
Figure 8: Interaction volume of the primary electron beam and the specimen material; redrawn from [29]
Secondary Electrons are generated by inelastic collisions of the Primary Electrons of the
beam and the atoms in the specimen. They only reach low energy levels with the most
probable energy of 2 - 5 eV [29]. Due to their low energies the detectable Secondary
Electrons originate from the top atomic layers of the sample. As areas that are facing the
detector appear brighter because more electrons can reach it, the SE-contrast provides a
good method to investigate the topography of the sample surface.
Backscattered Electrons origin from the primary beam itself as they are reflected Primary
Electrons. They have a much higher energy level as Secondary Electrons (> 50 eV) and
carry information from a deeper volume of the specimen about the atomic mass of the
reflecting atoms. This is due to the fact that heavier atoms are more likely to reflect
electrons than lighter elements. Thus, it can be used to produce a contrast between areas
with different chemical compositions.
Besides the possibility of imaging, SEM can be used for local chemical analysis, as in the
specimen created X-rays carry characteristic information about the elements of origin.
These X-rays occur when a Primary Electron removes an electron of the inner shell of an
atom. An electron of a higher shell has to fill this vacancy and the difference of the energy
levels of the electron shells is released by an X-ray quantum. The energy of this quantum is
characteristic for the kind of element. By analyzing the X-Ray spectrum, the chemical
composition of a small area of the sample surface can be determined. This method is called
EDX-Analysis (Energy Dispersive X-ray Analysis) [29, 30].
Therefore, SEM was used in this thesis to investigate the morphology of the powder
surfaces and imaging of powder cross-sections. Combined with EDX, chemical
Auger Electrons
Primary Electron Beam
Secondary ElectronsBackscattered Electrons
Characteristic X-rays
X-ray continuum
X-ray fluorescence
20 2 Theoretical background
microanalysis was performed to investigate individual particulate and selected areas on the
powder surface.
A Scanning Electron Microscope (SEM) type LEO Gemini 1550 with a Field Emission
Gun (FEG) was used. To analyze the powder surface, the InLens SE detector was utilized
with an accelerating voltage of 15 kV, an aperture size of 20 μm and a working distance of
8.5 mm. Observations of cross-sections have been performed by the use of a BE-detector
and an aperture size of 30 μm. EDX studies were performed with an INCA X-sight EDX
system. Before the investigations of the sample started, the system was calibrated with a
cobalt standard.
For analysis of cross-sections the powder was embedded in conductive epoxide resin.
Subsequently, the samples were grinded using SiC paper with a grit size of 1000 and
polished using 6 μm, 3 μm and 1 μm diamond suspensions. The last step was polishing
with Oxide Polishing Suspension (OPS) which contains SiO2-particles with a size of about
0.25 μm and having a pH-value of 9.5.
For SEM investigations of heat treated powder the XPS samples have been used. They
have been exposed to air prior to the SEM investigations. This has to be taken into account
when evaluating the SEM images.
2.4.4 Thermogravimetry Analysis
The Thermogravimetric Analysis (TGA) is a technique in which the change in the sample
mass is measured while the sample is subjected to a temperature change. This is done by
connecting the crucible with the sample to a highly accurate microbalance. While heating
the sample it can either loose mass (e.g. decomposition reactions, evaporation, etc.) or
absorb mass due to chemical reactions (e.g. oxidation, corrosion etc.) which leads to a
change in the sample mass. It is possible to perform the tests in different atmospheres to
analyze the interaction of the sample with the surrounding atmosphere.
Beside the way of plotting the relative mass as a function of temperature or time, also the
rate of mass change can be plotted (Differential Thermogravimetry, DTG). When doing it
this way, different steps in a series of reactions are more obvious and identifiable as
maxima or minima in DTG curves.
Thermogravimetry analysis techniques have been used in metallurgy to study a lot of
phenomena such as oxidation, reduction and corrosion processes. In this study TGA was
used to identify the temperature ranges and the extent of reduction and degassing processes
during heat treatment of the powder [31].
The thermal analyzer STA 449 F1 Jupiter from Netzsch was used for Thermogravimetry
Analysis using TG / DTA sample carrier system with tungsten / rhenium thermocouple.
The loose powder with a mass of about 100 mg was placed in alumina crucibles for
2.4 Material and experimental techniques 21
analysis. An argon atmosphere (99.9999%, purified) with a flow rate of about 50 ml/min
was used. Before the measurements started, the system was evacuated and flushed with
argon three times before experiment. The heating rate was 10 K·min-1 and the specimens
were heated up to 1300 °C. The tests have been performed on the unsieved powder and
sieve fractions of fine (36 - 63 μm) and coarse (100 - 150 μm) powder.
2.4.5 Residual Gas Analysis
Residual Gas Analysis (RGA), also known as Evolved Gas Analysis (EGA), is a technique
to analyze the chemical composition of gases evolved under dynamic vacuum conditions.
In case of this thesis it was used to evaluate the interaction between the sample and the
vacuum during the heat treatment, as the evolving molecules give indications about the
chemical reactions that taking on the surface. The measurement data is given as the partial
pressure of the gases which can be plotted against the temperature or time.
The analyzing process can be separated into three steps: ionization, separation and
collection.
The ionization is made by collision of the gas molecules with electrons produced in a
tungsten filament. Characteristic for a molecule is the ratio of its atomic mass to the
electric charge. This ratio will be called mass number in the following. Due to statistical
distribution, the molecules can be ionized once or twice, but with a larger probability for
the first. For example an N2-molecule can either have the mass number 28 (14+14/1) or 14
(14+14/2). Furthermore, molecules can be fragmented. For example, for a CO-molecule the
mass number 28 (12+16/1) can be detected as well as C- and O-fragments with the mass
numbers 12 and 16.
Via a perforated cathode, the ionized particles are accelerated into a quadrupole which
separates the particles by mass number. To achieve that, the quadrupole is made out of four
electrodes which are coaxially arranged towards the ion beam. Due to the arrangement of
the electric fields only one specific mass number can pass the quadrupole, whereas all the
others get deflected. At defined time intervals the electric field changes so that a different
mass number can pass the quadrupole and the whole mass spectrum can be filtered in
sequences.
For the collection a Faraday-detector is used which catches the discharge of the ions on a
metal plate [31].
An RGA unit of type e-Vision EVS-160-080 from MKS Instruments was attached to the
vacuum system of the dilatometer for the Residual Gas Analysis. The temperature values
were aligned by the time data of RGA- and dilatometer measuring records. The tests were
executed in high vacuum conditions (<10-4 mbar) with a heating rate of 10 K·min-1.The
chamber was flushed with argon and evacuated twice before experiment. To avoid damage

22 2 Theoretical background
of the experimental set-up, the temperature was restricted to 1200 °C. A special crucible
design was used to ensure a good exchange between the vacuum and the sample (see figure
9) [32].
Figure 9: Schematic drawing of the crucible for the RGA measurements; redrawn from [32]
2.4.6 Differential Thermal Analysis
The Differential Thermal Analysis (DTA) is used to detect the characteristic temperatures
of phase transformations in a material. The method is based on the effect that phase
transformations are either endothermic or exothermic reactions. This means that while the
reaction takes place, heat is absorbed (endothermic) or released (exothermic) due to the
difference in the Gibbs energies of the phases.
For the observation of this effect the temperatures at the sample crucible and at a reference
crucible are measured. The reference crucible is either empty or filled with a substance
which does not undergo any phase transformation in the relevant temperature interval.
Both crucibles are subjected to the same controlled temperature program in a furnace
chamber. A phase transformation in the sample leads to a change in the sample
temperature compared to the reference crucible. By plotting the temperature difference of
the sample and the reference crucible against the furnace temperature, the kind of reaction
(exo- or endothermic) and the temperature range of the phase transformation can be
determined. For example melting of a metal requires an input of heat. Thus, this
transformation is endothermic and the peak is downwards in the plot. Solidification
releases heat and therefore it is the other way around [31, 33].
The DTA-measurements were performed by using a test facility type PT1600 L62/432
from Linseis. The powder was filled into an Al2O3-crucible and the reference body was
made of Al2O3 as well. The heating rate was 10 K·min-1 and the atmosphere was helium
with a constant gas flow rate of 12 l·h-1. Before the tests started the chamber was evacuated
to 2·10-2 mbar and flushed with helium afterwards twice.
15
46
1
Sample
2.4 Material and experimental techniques 23
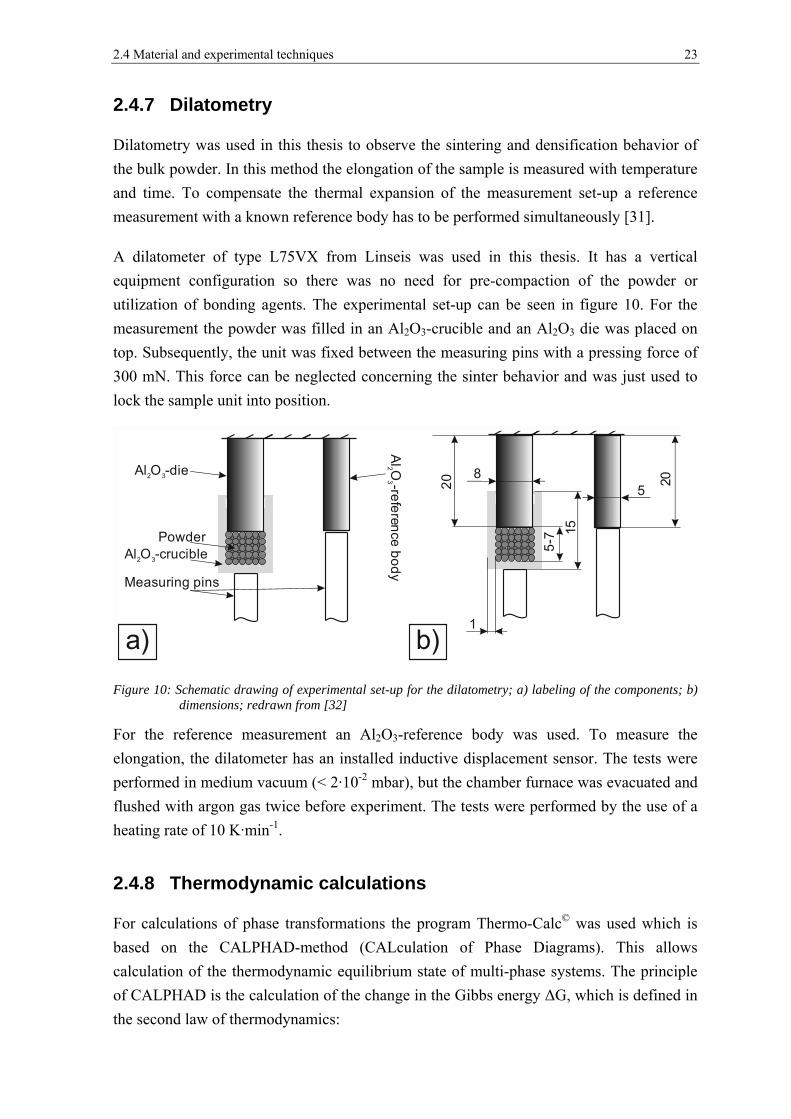
2.4.7 Dilatometry
Dilatometry was used in this thesis to observe the sintering and densification behavior of
the bulk powder. In this method the elongation of the sample is measured with temperature
and time. To compensate the thermal expansion of the measurement set-up a reference
measurement with a known reference body has to be performed simultaneously [31].
A dilatometer of type L75VX from Linseis was used in this thesis. It has a vertical
equipment configuration so there was no need for pre-compaction of the powder or
utilization of bonding agents. The experimental set-up can be seen in figure 10. For the
measurement the powder was filled in an Al2O3-crucible and an Al2O3 die was placed on
top. Subsequently, the unit was fixed between the measuring pins with a pressing force of
300 mN. This force can be neglected concerning the sinter behavior and was just used to
lock the sample unit into position.
Figure 10: Schematic drawing of experimental set-up for the dilatometry; a) labeling of the components; b) dimensions; redrawn from [32]
For the reference measurement an Al2O3-reference body was used. To measure the
elongation, the dilatometer has an installed inductive displacement sensor. The tests were
performed in medium vacuum (< 2·10-2 mbar), but the chamber furnace was evacuated and
flushed with argon gas twice before experiment. The tests were performed by the use of a
heating rate of 10 K·min-1.
2.4.8 Thermodynamic calculations
For calculations of phase transformations the program Thermo-Calc© was used which is
based on the CALPHAD-method (CALculation of Phase Diagrams). This allows
calculation of the thermodynamic equilibrium state of multi-phase systems. The principle
of CALPHAD is the calculation of the change in the Gibbs energy ΔG, which is defined in
the second law of thermodynamics:
Al O -die2 3
Al O -crucible2 3
Powder
Measuring pins
AlO
-refe
rence
bo
dy
23 20
1
58
5-7
20
15
a) b)
24 2 Theoretical background
Δ ∆ ∆ Δ 2.12
The first summand describes the change of the internal energy U and the second one the
change in the specific volume ν multiplied by the pressure p. The third summand takes into
account the entropy S multiplied by the temperature T in Kelvin.
As a thermodynamic system always aims to the lowest energy level, a process in a closed
system takes place spontaneously for ΔG<0. In case of a global minimum of the ΔG-
function a stable equilibrium exists and in the case of a local minimum a metastable
equilibrium exists. The process which sets the equilibrium can be e.g. a chemical reaction
or a phase change [34].
In a multicomponent system the entire enthalpy depends on the enthalpy of each
component and their miscibility. This miscibility is described by the mixing enthalpy Gmix
which correlates to the third term in (2.12) [35]. If there is neither an attractive nor a
repulsive interaction the solution is called ideal. Thus the miscibility enthalpy in a two-
component system can be calculated by
2.13
with the mole fractions xA and xB and the universal gas constant R. However in real
materials there is always an interaction between the components. Therefore, term (2.13)
has to be extended by a non-ideal part . In the simplest solution model is
described by:
Ω. 2.14
Ω is the interaction parameter which is positive for repulsive and negative for attractive
interaction. This means that an attractive interaction leads to the dissolution of B in A and
thereby the Gibbs free energy is reduced. With (2.13) and (2.14) the entire miscibility
enthalpy can be determined by
Ω . 2.15
But in general the -term is more complicated as it has to be extended with the
interaction of each component in an n-component system [35] to
Ω Ω Ω … 2.16
2.4 Material and experimental techniques 25
The backgrounds of CALPHAD-programs are thermodynamic databases of two-, three- or
four-component systems. With such a program systems of higher order can be calculated
and the phase development simulated by e.g. changing temperature or chemical
composition. By setting the boundary conditions such as chemical composition, pressure,
temperature and the amount of substance the CALPHAD-program calculates the
equilibrium of equation (2.12) and the phase diagram can be plotted. However, kinetic
aspects cannot be considered [34].
In conclusion the practical use to predict the material behavior shell be discussed. Due to
the high solidification rate in the atomization process, the material of the powder is far
away from the equilibrium state. Because of that, the equilibrium calculations do not show
the state of the materials for a certain temperature, but the tendency to which equilibrium
state the non-equilibrium material aspires to [32].
For the calculation of phase transformations, thermodynamic software Thermo-Calc©
version 3.0 [36] with the database TCFE6.2 for iron based alloys [37] was used. The
chemical composition as shown in table 2 was used for the calculations.
3 Results
3.1 Analysis of the as-received state
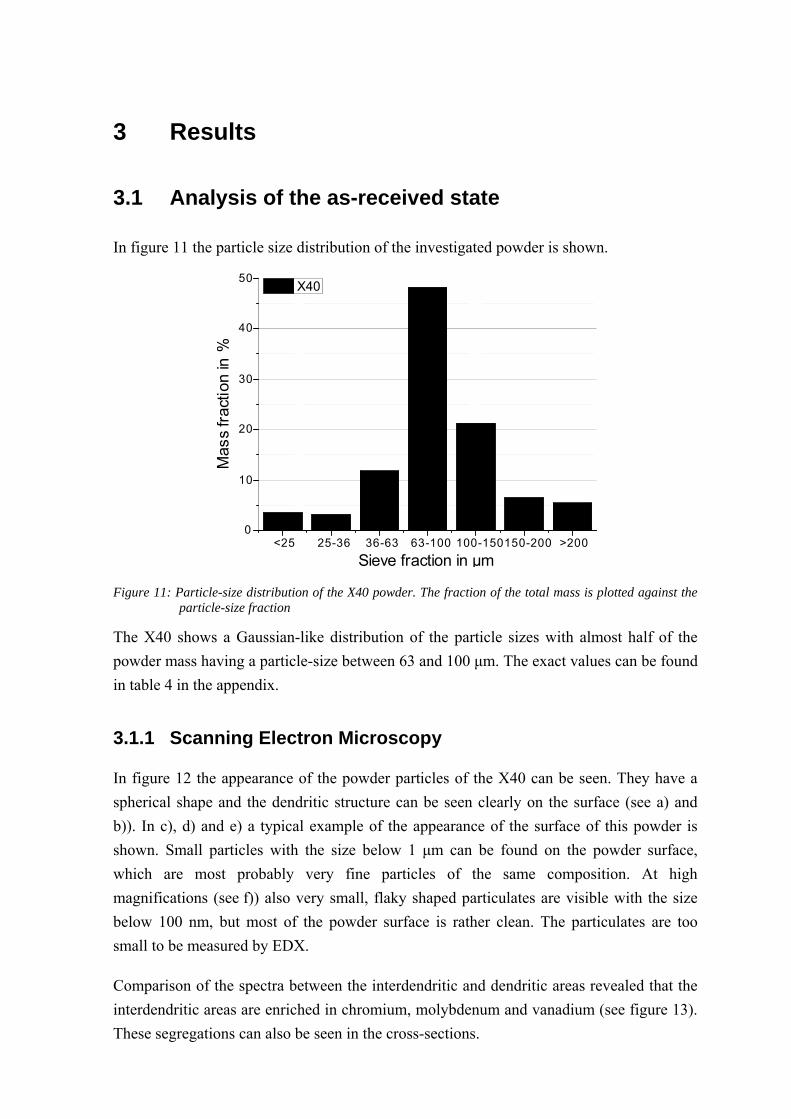
In figure 11 the particle size distribution of the investigated powder is shown.
Figure 11: Particle-size distribution of the X40 powder. The fraction of the total mass is plotted against the particle-size fraction
The X40 shows a Gaussian-like distribution of the particle sizes with almost half of the
powder mass having a particle-size between 63 and 100 μm. The exact values can be found
in table 4 in the appendix.
3.1.1 Scanning Electron Microscopy
In figure 12 the appearance of the powder particles of the X40 can be seen. They have a
spherical shape and the dendritic structure can be seen clearly on the surface (see a) and
b)). In c), d) and e) a typical example of the appearance of the surface of this powder is
shown. Small particles with the size below 1 μm can be found on the powder surface,
which are most probably very fine particles of the same composition. At high
magnifications (see f)) also very small, flaky shaped particulates are visible with the size
below 100 nm, but most of the powder surface is rather clean. The particulates are too
small to be measured by EDX.
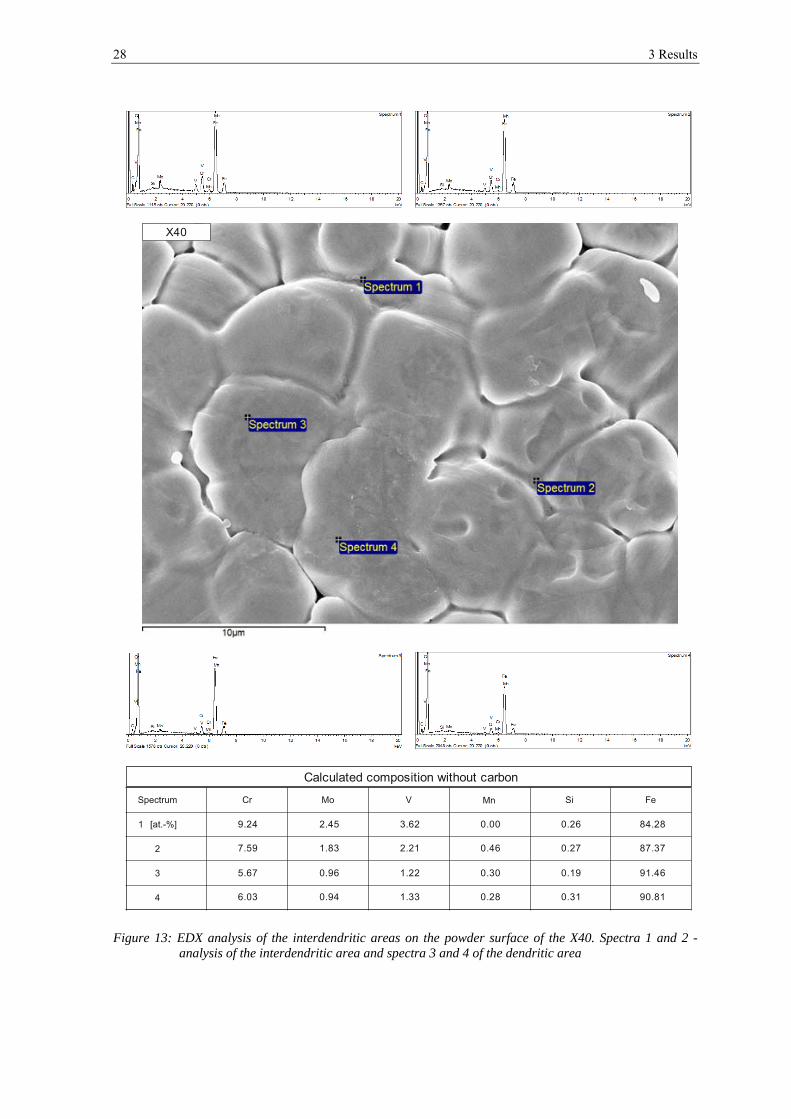
Comparison of the spectra between the interdendritic and dendritic areas revealed that the
interdendritic areas are enriched in chromium, molybdenum and vanadium (see figure 13).
These segregations can also be seen in the cross-sections.
<25 25-36 36-63 63-100 100-150150-200 >2000
10
20
30
40
50
Sieve fraction in µm
Mas
s fr
actio
n in
%
X40

3.1 Analysis of the as-received state 27
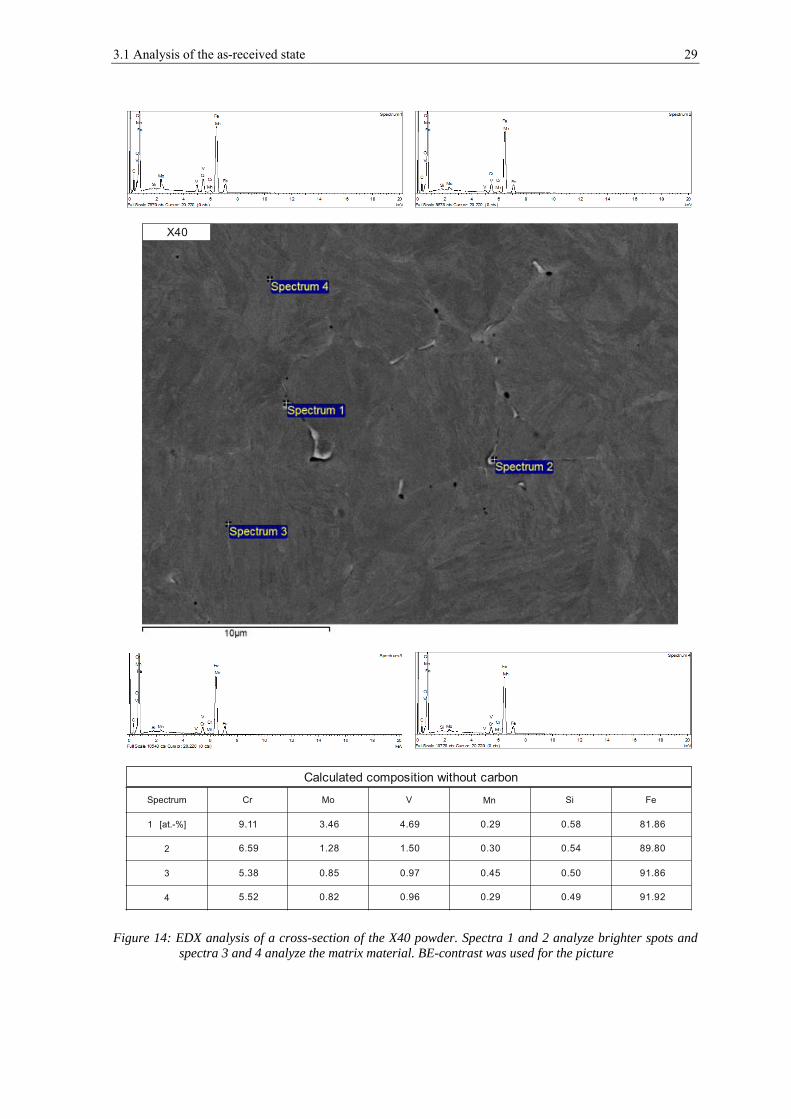
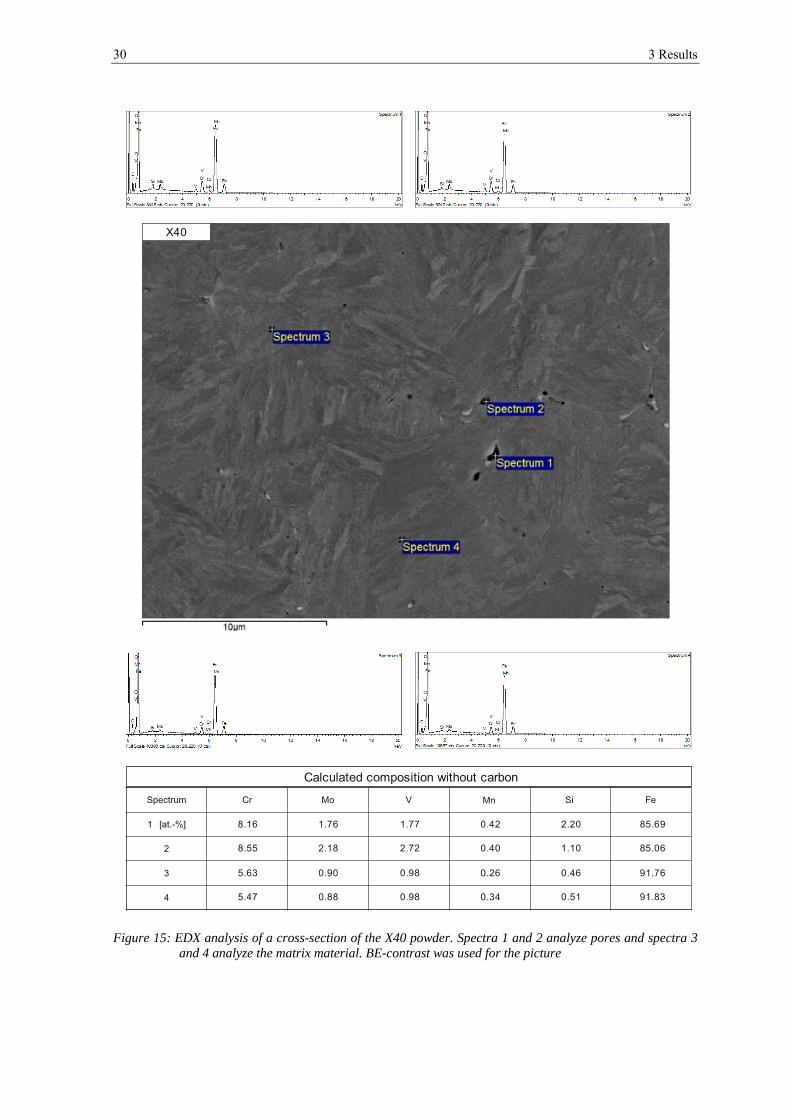
Figure 14 and figure 15 show cross-sections of the X40 after polishing with OPS. In the
microstructure pores and bright particulates of submicron size can be found. Quite often
the pores appear close to the particulates. EDX point-analyzes make clear that the brighter
particulates are enriched in chromium, molybdenum and vanadium (see figure 14),
whereas the pores are also enriched in silicon and manganese (see figure 15). Each SEM
result was confirmed statistically by observation in a number of sites.
Figure 12: Overview of the appearance of the X40 powder studied
a) b)
c) d)
e) f)
28 3 Results
Figure 13: EDX analysis of the interdendritic areas on the powder surface of the X40. Spectra 1 and 2 - analysis of the interdendritic area and spectra 3 and 4 of the dendritic area
X40
Calculated composition without carbon
9.24
7.59
5.67
6.03
2.45
1.83
0.96
0.94
3.62
2.21
1.22
1.33
0.00
0.46
0.30
0.28
0.26
0.27
0.19
0.31
84.28
87.37
91.46
90.81
3.1 Analysis of the as-received state 29
Figure 14: EDX analysis of a cross-section of the X40 powder. Spectra 1 and 2 analyze brighter spots and spectra 3 and 4 analyze the matrix material. BE-contrast was used for the picture
X40
Calculated composition without carbon
9.11
6.59
5.38
5.52
3.46
1.28
0.85
0.82
4.69
1.50
0.97
0.96
0.29
0.30
0.45
0.29
0.58
0.54
0.50
0.49
81.86
89.80
91.86
91.92
30 3 Results
Figure 15: EDX analysis of a cross-section of the X40 powder. Spectra 1 and 2 analyze pores and spectra 3 and 4 analyze the matrix material. BE-contrast was used for the picture
X40
Calculated composition without carbon
8.16
8.55
5.63
5.47
1.76
2.18
0.90
0.88
1.77
2.72
0.98
0.98
0.42
0.40
0.26
0.34
2.20
1.10
0.46
0.51
85.69
85.06
91.76
91.83
3.1 Analysis of the as-received state 31
3.1.2 X-ray Photoelectron Spectroscopy
Chemical composition
For the as-received state, measurements for the powder mounted on an aluminum plate and
a carbon tape were performed. This was done to be able to evaluate the influence from
different powder supports and hence possible contaminations. In figure 16 and figure 17
the development of the element content over the etch depth is shown. The exact values can
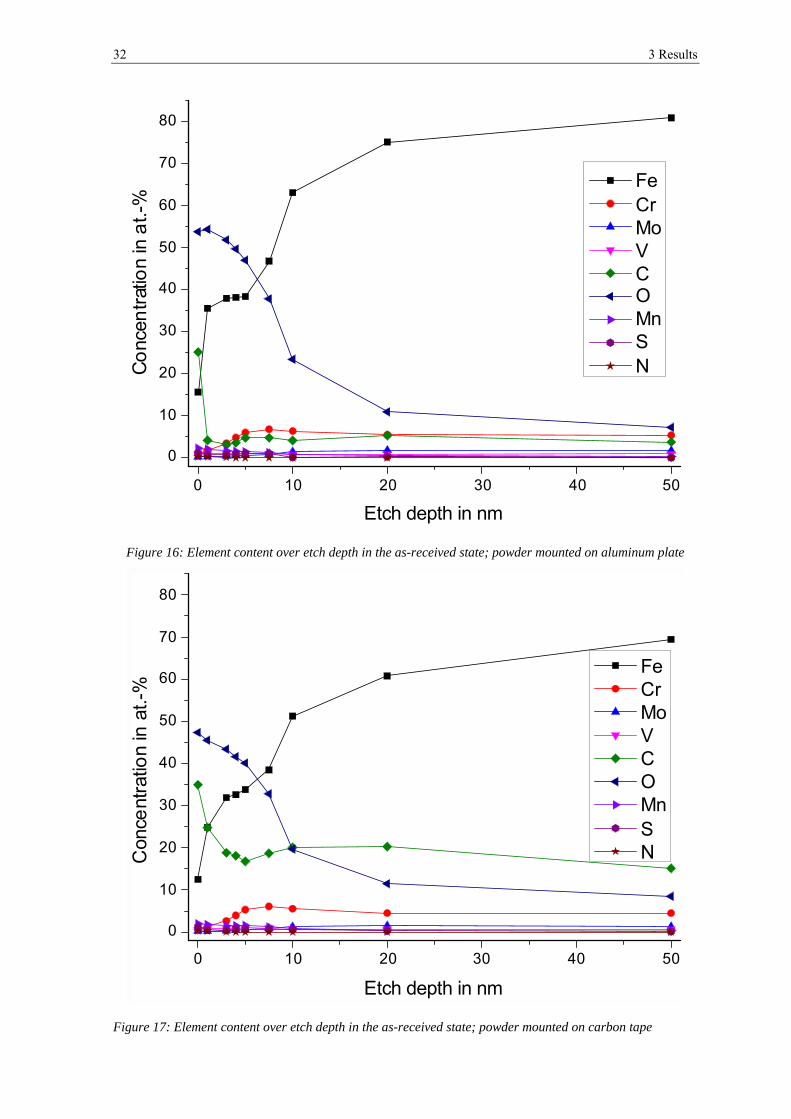
be found in table 5 and table 6 in the appendix.
On the outermost surface there is a strong contamination by carbon. After ion-etching of 1
nm (Al-plate) respectively 3 nm (C-tape) the carbon content decreases strongly and stays
on the same level for the other etching steps. But the measured carbon content is about five
times higher for the powder mounted on carbon tape as for the powder pressed on
aluminum. The developments of all the other elements are the same in both measurements,
but the content of all the other elements is slightly lower in the powder measured on carbon
tape due to the higher percentage of carbon. Therefore, the measurement on the aluminum
plate will be described in more details.
The oxygen content decreases over all etching steps from about 54 at.-% on the outer most
surface to ~7 at.-% after 50 nm of etching. Sulfur is enriched on the top surface showing a
content of ~1 at.-%. Its content decreases with etching and cannot be detected after 10 nm
of etching. Nitrogen can only be detected at the outermost surface below 1 at.-%. Silicon
was not detected at all.
32 3 Results
Figure 16: Element content over etch depth in the as-received state; powder mounted on aluminum plate
Figure 17: Element content over etch depth in the as-received state; powder mounted on carbon tape
0 10 20 30 40 50
0
10
20
30
40
50
60
70
80C
onc
entr
atio
nin
at.-
%
Etch depth in nm
FeCrMoVCOMnSN
0 10 20 30 40 50
0
10
20
30
40
50
60
70
80
Con
cent
ratio
nin
at.-
%
Etch depth in nm
FeCrMoVCOMnSN
3.1 Analysis of the as-received state 33
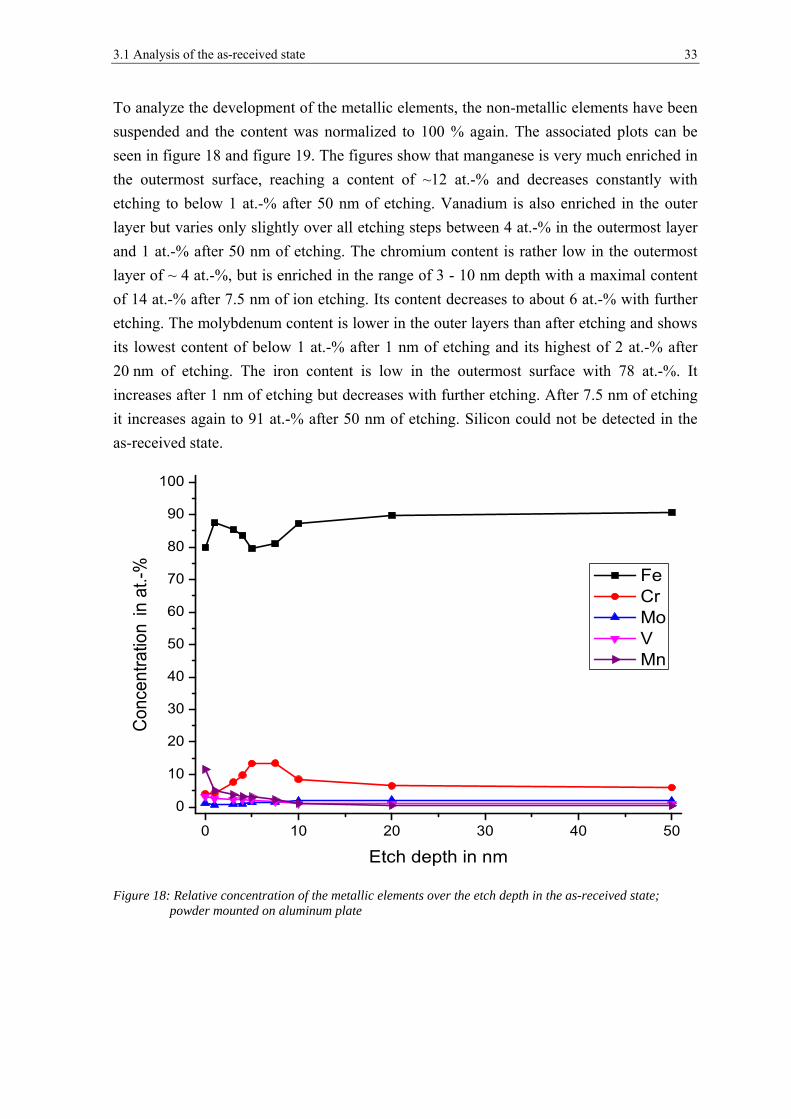
To analyze the development of the metallic elements, the non-metallic elements have been
suspended and the content was normalized to 100 % again. The associated plots can be
seen in figure 18 and figure 19. The figures show that manganese is very much enriched in
the outermost surface, reaching a content of ~12 at.-% and decreases constantly with
etching to below 1 at.-% after 50 nm of etching. Vanadium is also enriched in the outer
layer but varies only slightly over all etching steps between 4 at.-% in the outermost layer
and 1 at.-% after 50 nm of etching. The chromium content is rather low in the outermost
layer of ~ 4 at.-%, but is enriched in the range of 3 - 10 nm depth with a maximal content
of 14 at.-% after 7.5 nm of ion etching. Its content decreases to about 6 at.-% with further
etching. The molybdenum content is lower in the outer layers than after etching and shows
its lowest content of below 1 at.-% after 1 nm of etching and its highest of 2 at.-% after
20 nm of etching. The iron content is low in the outermost surface with 78 at.-%. It
increases after 1 nm of etching but decreases with further etching. After 7.5 nm of etching
it increases again to 91 at.-% after 50 nm of etching. Silicon could not be detected in the
as-received state.
Figure 18: Relative concentration of the metallic elements over the etch depth in the as-received state; powder mounted on aluminum plate
34 3 Results
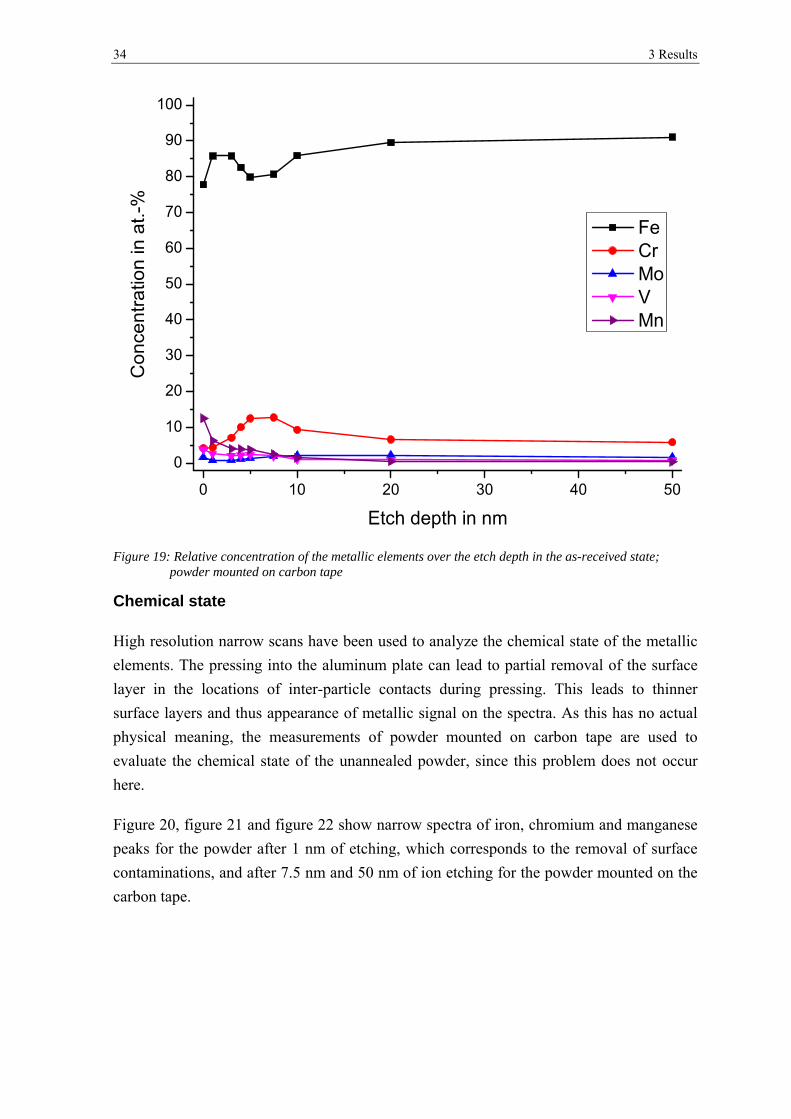
Figure 19: Relative concentration of the metallic elements over the etch depth in the as-received state; powder mounted on carbon tape
Chemical state
High resolution narrow scans have been used to analyze the chemical state of the metallic
elements. The pressing into the aluminum plate can lead to partial removal of the surface
layer in the locations of inter-particle contacts during pressing. This leads to thinner
surface layers and thus appearance of metallic signal on the spectra. As this has no actual
physical meaning, the measurements of powder mounted on carbon tape are used to
evaluate the chemical state of the unannealed powder, since this problem does not occur
here.
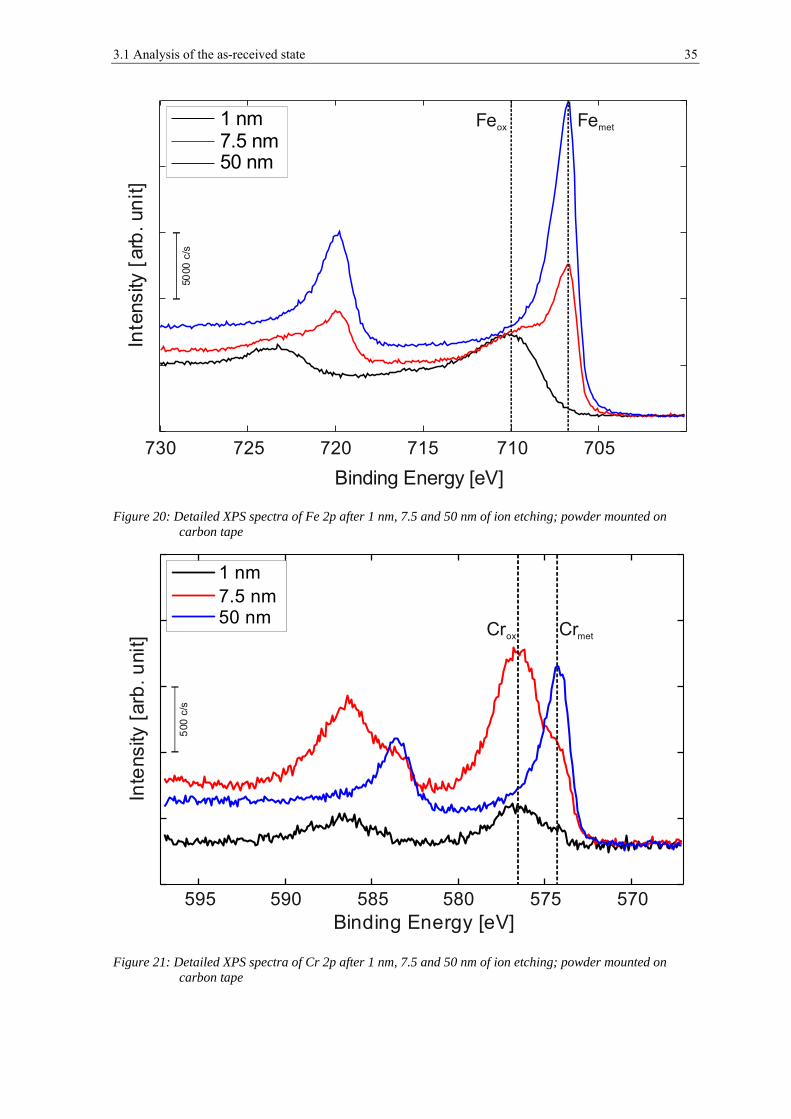
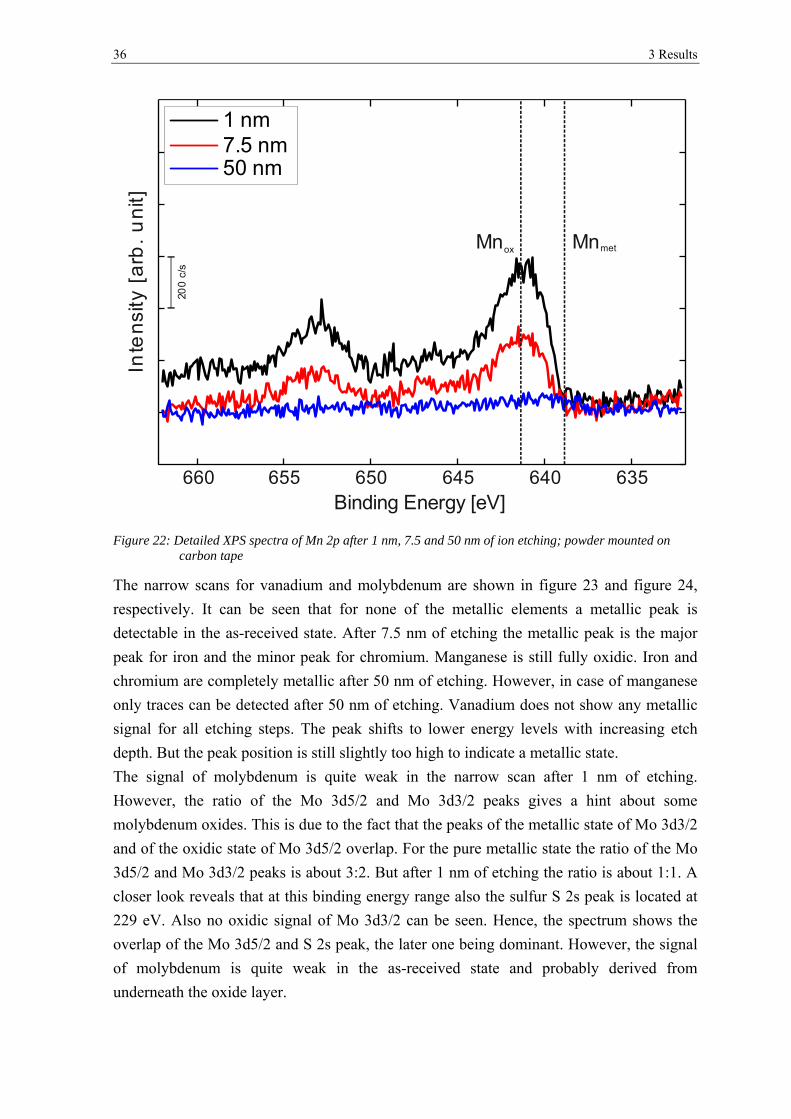
Figure 20, figure 21 and figure 22 show narrow spectra of iron, chromium and manganese
peaks for the powder after 1 nm of etching, which corresponds to the removal of surface
contaminations, and after 7.5 nm and 50 nm of ion etching for the powder mounted on the
carbon tape.
3.1 Analysis of the as-received state 35
Figure 20: Detailed XPS spectra of Fe 2p after 1 nm, 7.5 and 50 nm of ion etching; powder mounted on carbon tape
Figure 21: Detailed XPS spectra of Cr 2p after 1 nm, 7.5 and 50 nm of ion etching; powder mounted on carbon tape
Binding Energy [eV]
Inte
nsity
[arb
.un
it]
730 725 720 715 710 705
Feox Femet1 nm7.5 nm50 nm
5000
c/s
1 nm7.5 nm50 nm
Binding Energy [eV]
Inte
nsity
[ar
b. u
nit]
595 590 585 580 575 570
Crox Crmet
500
c/s
36 3 Results
Figure 22: Detailed XPS spectra of Mn 2p after 1 nm, 7.5 and 50 nm of ion etching; powder mounted on carbon tape
The narrow scans for vanadium and molybdenum are shown in figure 23 and figure 24,
respectively. It can be seen that for none of the metallic elements a metallic peak is
detectable in the as-received state. After 7.5 nm of etching the metallic peak is the major
peak for iron and the minor peak for chromium. Manganese is still fully oxidic. Iron and
chromium are completely metallic after 50 nm of etching. However, in case of manganese
only traces can be detected after 50 nm of etching. Vanadium does not show any metallic
signal for all etching steps. The peak shifts to lower energy levels with increasing etch
depth. But the peak position is still slightly too high to indicate a metallic state.
The signal of molybdenum is quite weak in the narrow scan after 1 nm of etching.
However, the ratio of the Mo 3d5/2 and Mo 3d3/2 peaks gives a hint about some
molybdenum oxides. This is due to the fact that the peaks of the metallic state of Mo 3d3/2
and of the oxidic state of Mo 3d5/2 overlap. For the pure metallic state the ratio of the Mo
3d5/2 and Mo 3d3/2 peaks is about 3:2. But after 1 nm of etching the ratio is about 1:1. A
closer look reveals that at this binding energy range also the sulfur S 2s peak is located at
229 eV. Also no oxidic signal of Mo 3d3/2 can be seen. Hence, the spectrum shows the
overlap of the Mo 3d5/2 and S 2s peak, the later one being dominant. However, the signal
of molybdenum is quite weak in the as-received state and probably derived from
underneath the oxide layer.
Binding Energy [eV]
Inte
nsi
ty[a
rb.
un
it]1 nm7.5 nm50 nm
660 655 650 645 640 635
Mnox Mnmet
200
c/s
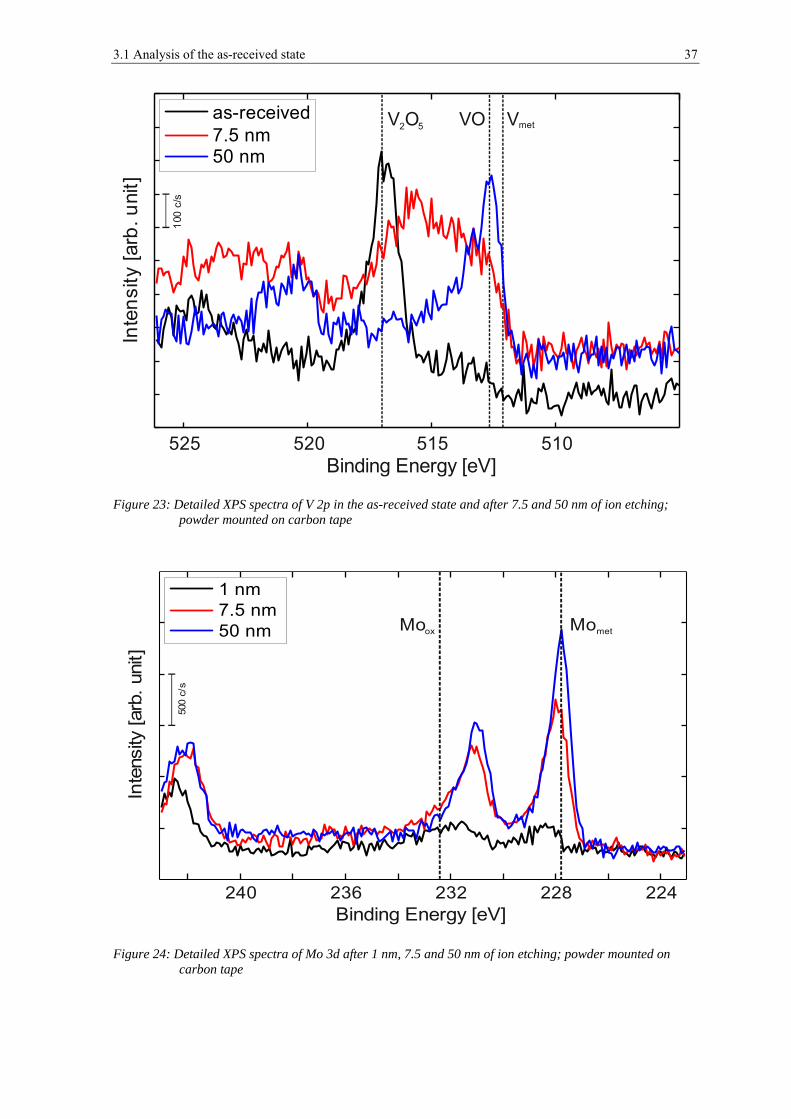
3.1 Analysis of the as-received state 37
Figure 23: Detailed XPS spectra of V 2p in the as-received state and after 7.5 and 50 nm of ion etching; powder mounted on carbon tape
Figure 24: Detailed XPS spectra of Mo 3d after 1 nm, 7.5 and 50 nm of ion etching; powder mounted on carbon tape
Binding Energy [eV]
Inte
nsi
ty[a
rb.u
nit]
as-received7.5 nm50 nm
Vmet
525 520 515 510
V O2 5 VO
100
c/s
Binding Energy [eV]
Inte
nsity
[ar
b. u
nit]
1 nm7.5 nm50 nm Moox Momet
240 232 228236 224
500
c/s
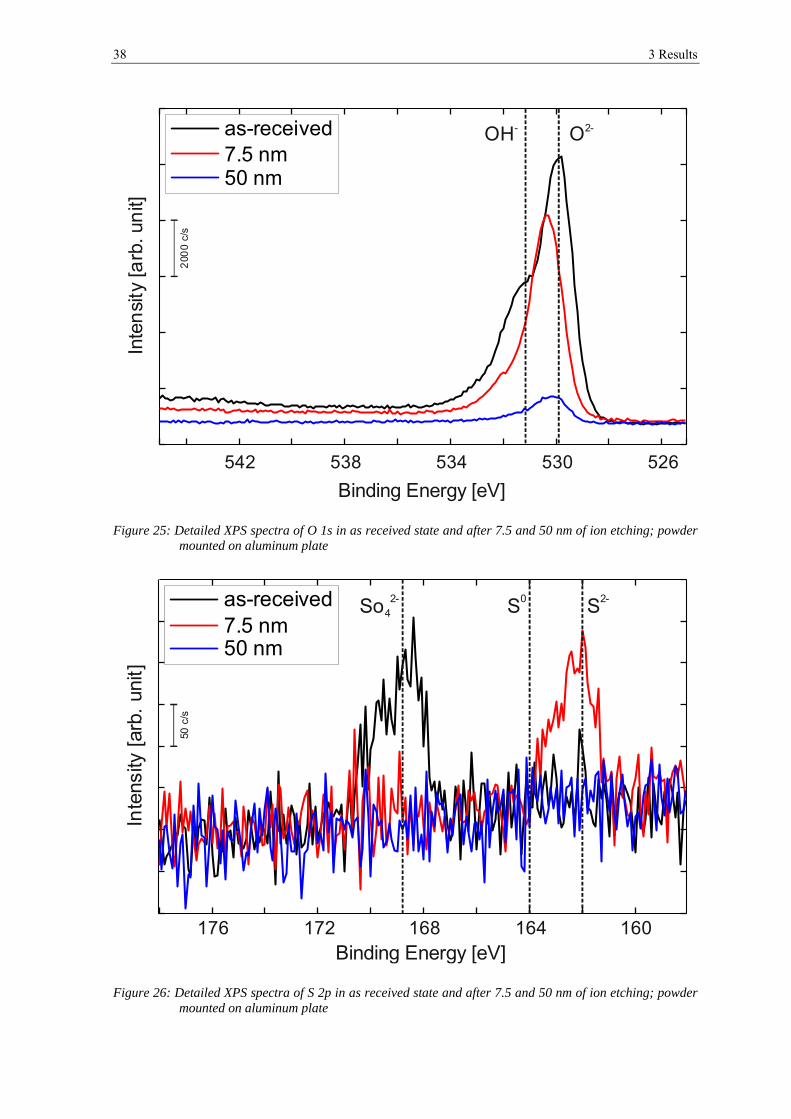
38 3 Results
Figure 25: Detailed XPS spectra of O 1s in as received state and after 7.5 and 50 nm of ion etching; powder mounted on aluminum plate
Figure 26: Detailed XPS spectra of S 2p in as received state and after 7.5 and 50 nm of ion etching; powder mounted on aluminum plate
Binding Energy [eV]
Inte
nsi
ty [a
rb. u
nit]
526
as-received7.5 nm50 nm
OH- O2-
534 530538542
200
0 c/
s
Binding Energy [eV]
Inte
nsity
[arb
. un
it]
160
as-received7.5 nm50 nm
164168172176
So42- S0 S2-
50 c
/s

3.1 Analysis of the as-received state 39
Besides the metallic elements, the non-metallic elements undergo changes in the chemical
state, as well. The oxygen peak of the as-received state can be split into two main peaks
(see figure 25). It is composed of O2- which represents oxygen in metallic oxides and OH-
representing oxygen in hydroxides. However, the contribution from the hydroxyl group is
removed after 1 nm of etching. Hence, it is only present as a top layer.
Sulfur is present in the SO42- group in the as-received state. After removal of the
contamination layer its binding energy shifts to lower binding energies which corresponds
to some sulfides. After 50 nm of etching no sulfur can be detected.
To analyze the fraction of the elements in different chemical states, curve-fitting was
performed for iron, chromium and manganese. This was not done for vanadium as it is
fully oxidic at every etching step. However, different oxidic states can also be observed but
this is most probably due to ion etching that leads to transformation of oxides [38]. Hence,
after ion etching a quantitative analysis is not possible. Molybdenum does not show any
changes in the chemical state indicating its presence in the metallic state from the
beginning.
Figure 27: Fraction of the metallic state of Fe, Cr and Mn as a function of the etch depth; powder mounted on carbon tape
In figure 27 the fraction of the metallic state is plotted over the etch depth. In the outermost
surface iron is fully oxidized. After etching, the metallic fraction increases with increasing
etch depth until it is fully metallic at 20 nm depth. The trend for chromium is almost the
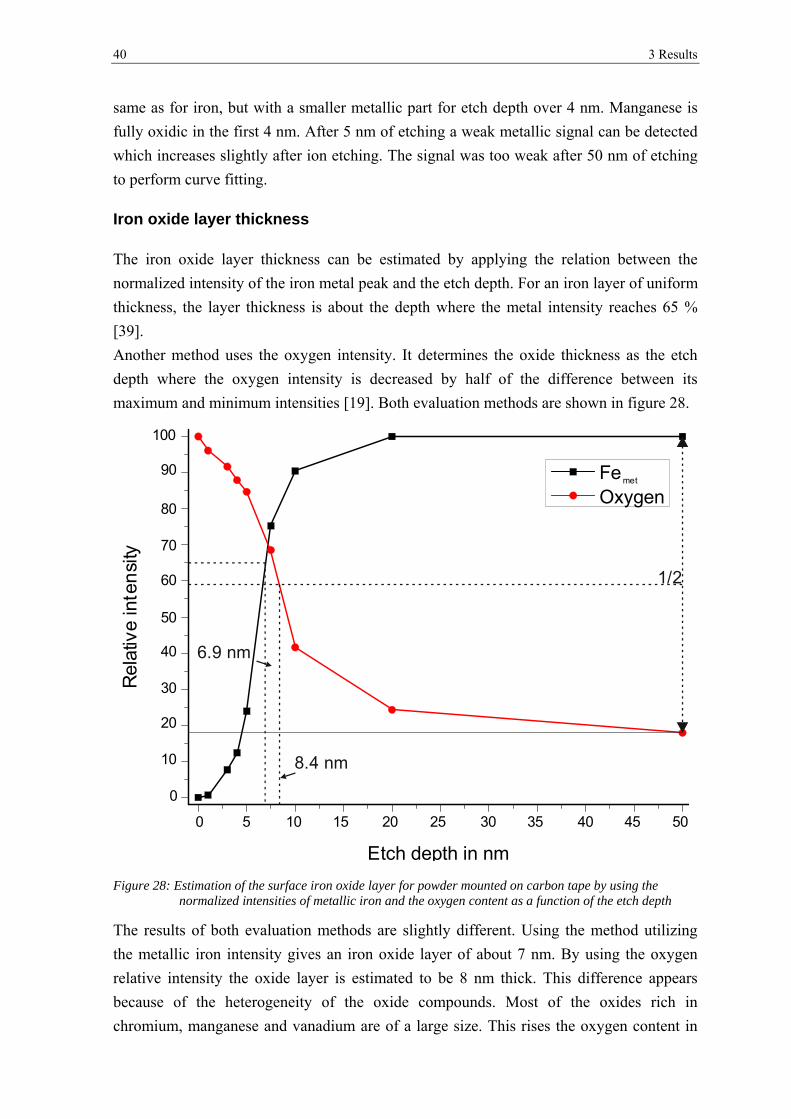
40 3 Results
same as for iron, but with a smaller metallic part for etch depth over 4 nm. Manganese is
fully oxidic in the first 4 nm. After 5 nm of etching a weak metallic signal can be detected
which increases slightly after ion etching. The signal was too weak after 50 nm of etching
to perform curve fitting.
Iron oxide layer thickness
The iron oxide layer thickness can be estimated by applying the relation between the
normalized intensity of the iron metal peak and the etch depth. For an iron layer of uniform
thickness, the layer thickness is about the depth where the metal intensity reaches 65 %
[39].
Another method uses the oxygen intensity. It determines the oxide thickness as the etch
depth where the oxygen intensity is decreased by half of the difference between its
maximum and minimum intensities [19]. Both evaluation methods are shown in figure 28.
Figure 28: Estimation of the surface iron oxide layer for powder mounted on carbon tape by using the normalized intensities of metallic iron and the oxygen content as a function of the etch depth
The results of both evaluation methods are slightly different. Using the method utilizing
the metallic iron intensity gives an iron oxide layer of about 7 nm. By using the oxygen
relative intensity the oxide layer is estimated to be 8 nm thick. This difference appears
because of the heterogeneity of the oxide compounds. Most of the oxides rich in
chromium, manganese and vanadium are of a large size. This rises the oxygen content in
0 5 10 15 20 25 30 35 40 45 50
0
10
20
30
40
50
60
70
80
90
100
Rel
ativ
ein
ten
sity
Etch depth in nm
Femet
Oxygen
1/2
8.4 nm
6.9 nm
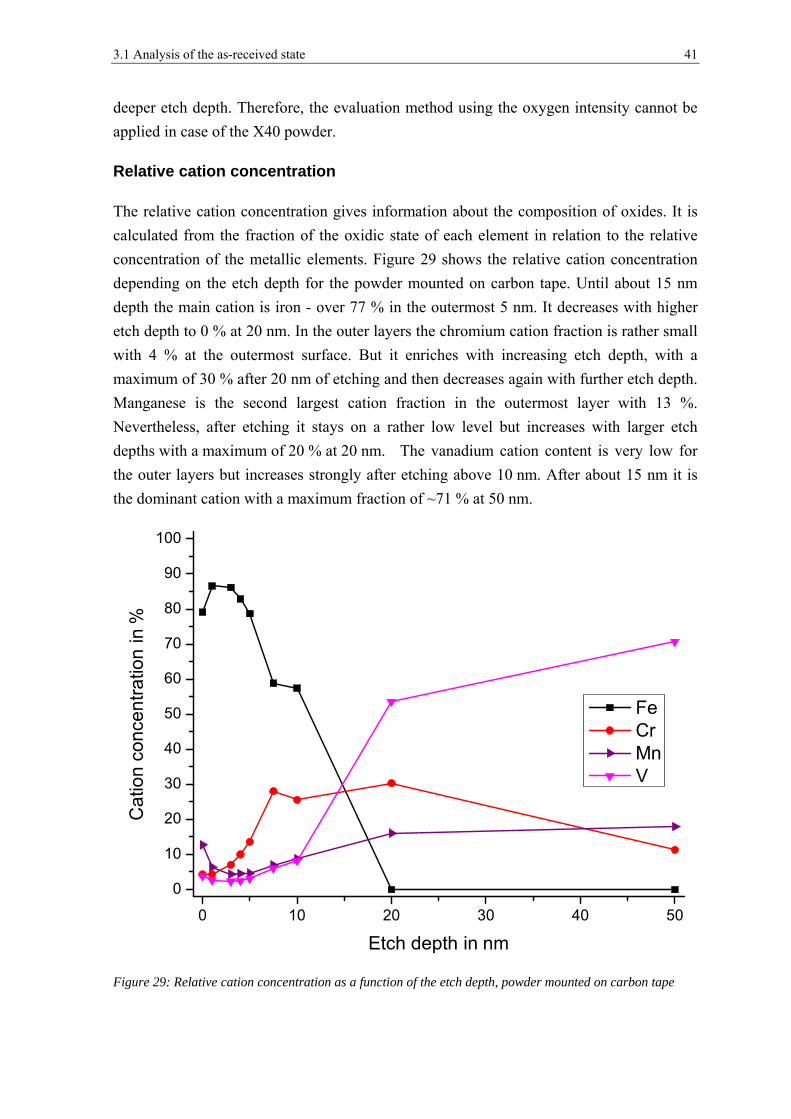
3.1 Analysis of the as-received state 41
deeper etch depth. Therefore, the evaluation method using the oxygen intensity cannot be
applied in case of the X40 powder.
Relative cation concentration
The relative cation concentration gives information about the composition of oxides. It is
calculated from the fraction of the oxidic state of each element in relation to the relative
concentration of the metallic elements. Figure 29 shows the relative cation concentration
depending on the etch depth for the powder mounted on carbon tape. Until about 15 nm
depth the main cation is iron - over 77 % in the outermost 5 nm. It decreases with higher
etch depth to 0 % at 20 nm. In the outer layers the chromium cation fraction is rather small
with 4 % at the outermost surface. But it enriches with increasing etch depth, with a
maximum of 30 % after 20 nm of etching and then decreases again with further etch depth.
Manganese is the second largest cation fraction in the outermost layer with 13 %.
Nevertheless, after etching it stays on a rather low level but increases with larger etch
depths with a maximum of 20 % at 20 nm. The vanadium cation content is very low for
the outer layers but increases strongly after etching above 10 nm. After about 15 nm it is
the dominant cation with a maximum fraction of ~71 % at 50 nm.
Figure 29: Relative cation concentration as a function of the etch depth, powder mounted on carbon tape

42
3.2
3.2.
The
oxida
iron
statis
The
rathe
appe
seen
Figur
Anal
.1 Scan
specimens
ation due to
oxide layer
stically by o
differences
er small com
arance of a
in figure 30
re 30: SEM imin vacu
ysis aft
ning Ele
were analy
o exposure t
r that cann
observation
s observed
mpared to t
a very few r
0. They cou
mage of rectanuum
ter heat
ctron Mi
zed in the S
to air was u
ot be detec
in a numbe
on the pow
the un-anne
rectangular
uld not be an
ngular particu
t treatm
icroscop
SEM after
unavoidable
cted by SEM
er of sites.
wder surfac
ealed powde
particulate
nalyzed by E
ulates on the X
ent
py
XPS measu
. But this le
M and EDX
e after vac
er. The only
s with sizes
EDX due to
X40 powder su
urements. C
eads mostly
X. Each res
uum annea
y remarkab
s below 200
o their small
urface after he
Consequentl
y to formatio
sult was co
aling at 500
ble differenc
0 nm which
l size.
eat treatment
3 Results
ly, slight
on of the
onfirmed
0 °C are
ce is the
h can be
at 500 °C
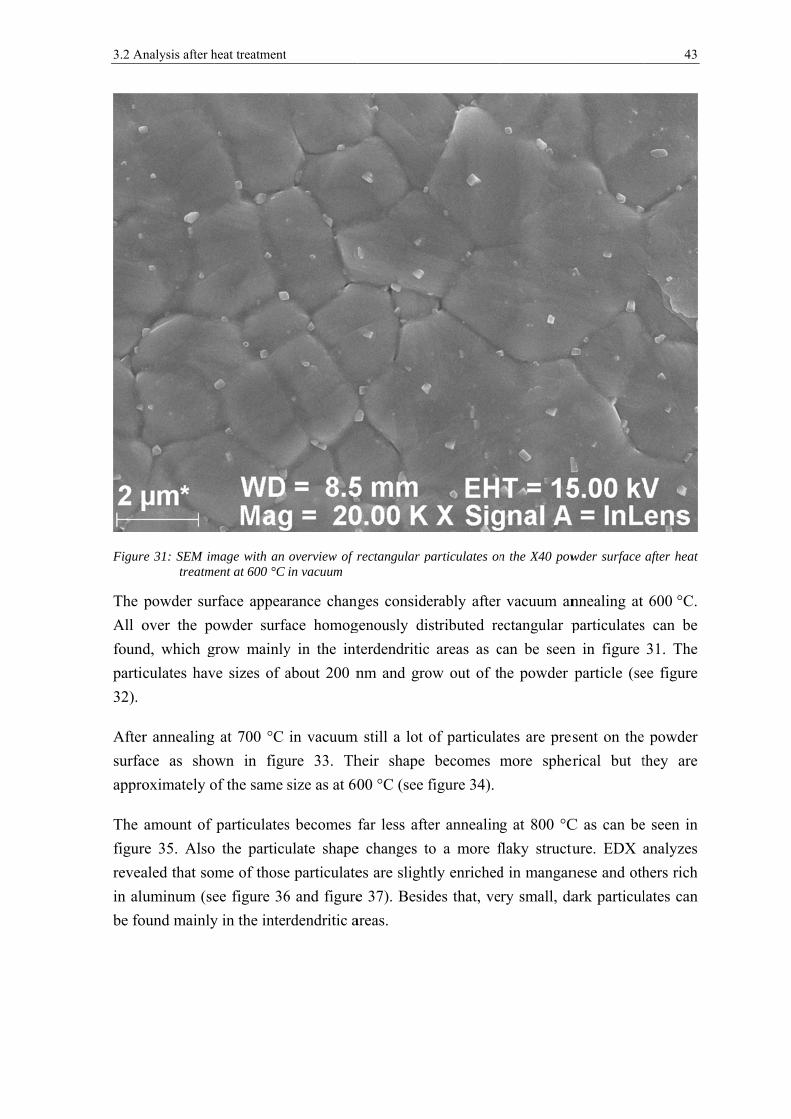
3.2 An
Figur
The
All o
found
partic
32).
After
surfa
appro
The
figur
revea
in alu
be fo
nalysis after h
re 31: SEM imtreatme
powder sur
over the po
d, which g
culates hav
r annealing
ace as sho
oximately o
amount of
re 35. Also
aled that so
uminum (se
ound mainly
heat treatment
mage with an ent at 600 °C
rface appea
owder surfa
grow mainly
ve sizes of a
at 700 °C
wn in figu
of the same
particulates
o the particu
me of those
ee figure 36
y in the inter
t
overview of rin vacuum
arance chang
face homog
y in the int
about 200 n
in vacuum
ure 33. Th
size as at 60
s becomes
ulate shape
e particulate
6 and figure
rdendritic a
rectangular p
ges conside
genously di
terdendritic
nm and gro
m still a lot o
heir shape
00 °C (see f
far less afte
e changes t
es are slight
e 37). Besid
areas.
particulates on
erably after
stributed re
c areas as c
ow out of th
of particula
becomes m
figure 34).
er annealing
o a more f
tly enriched
des that, ve
n the X40 pow
r vacuum an
ectangular p
can be seen
he powder
ates are pres
more spher
g at 800 °C
flaky structu
d in mangan
ry small, da
wder surface
nnealing at
particulates
n in figure
particle (se
sent on the
erical but t
C as can be
ture. EDX
nese and oth
ark particul
43
after heat
600 °C.
s can be
31. The
ee figure
e powder
they are
e seen in
analyzes
hers rich
lates can
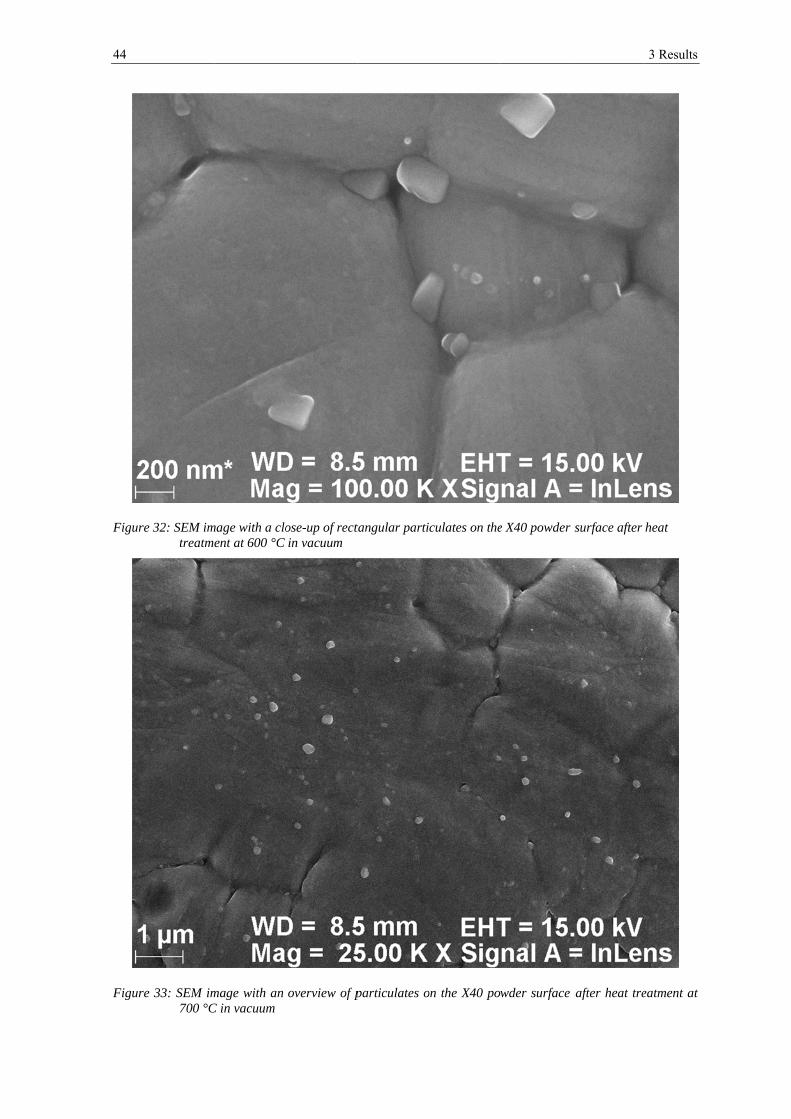
44
Figur
Figur
re 32: SEM imtreatme
re 33: SEM im700 °C
mage with a cloent at 600 °C
mage with an C in vacuum
ose-up of rectin vacuum
overview of p
tangular parti
particulates o
culates on the
on the X40 po
e X40 powder
wder surface
surface after
after heat tre
3 Results
heat
eatment at
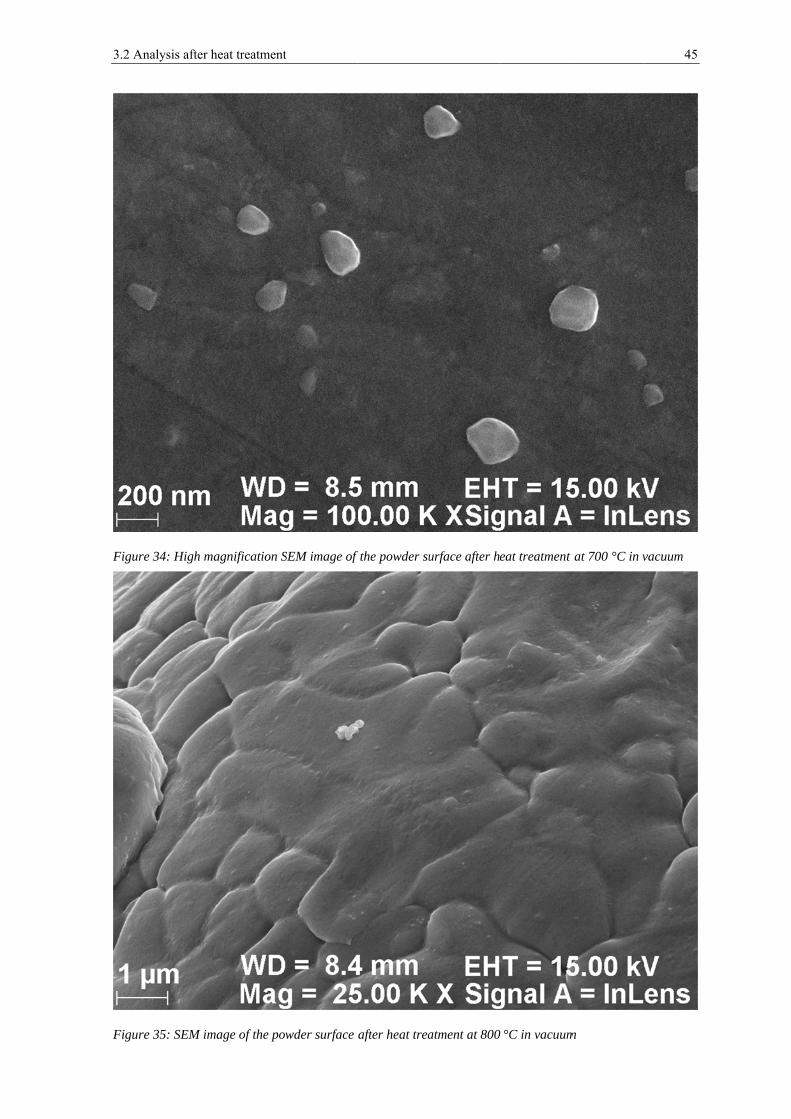
3.2 An
Figur
Figur
nalysis after h
re 34: High ma
re 35: SEM im
heat treatment
agnification S
mage of the pow
t
SEM image of
wder surface
f the powder su
after heat trea
urface after h
atment at 800
eat treatment
°C in vacuum
at 700 °C in v
m
45
vacuum
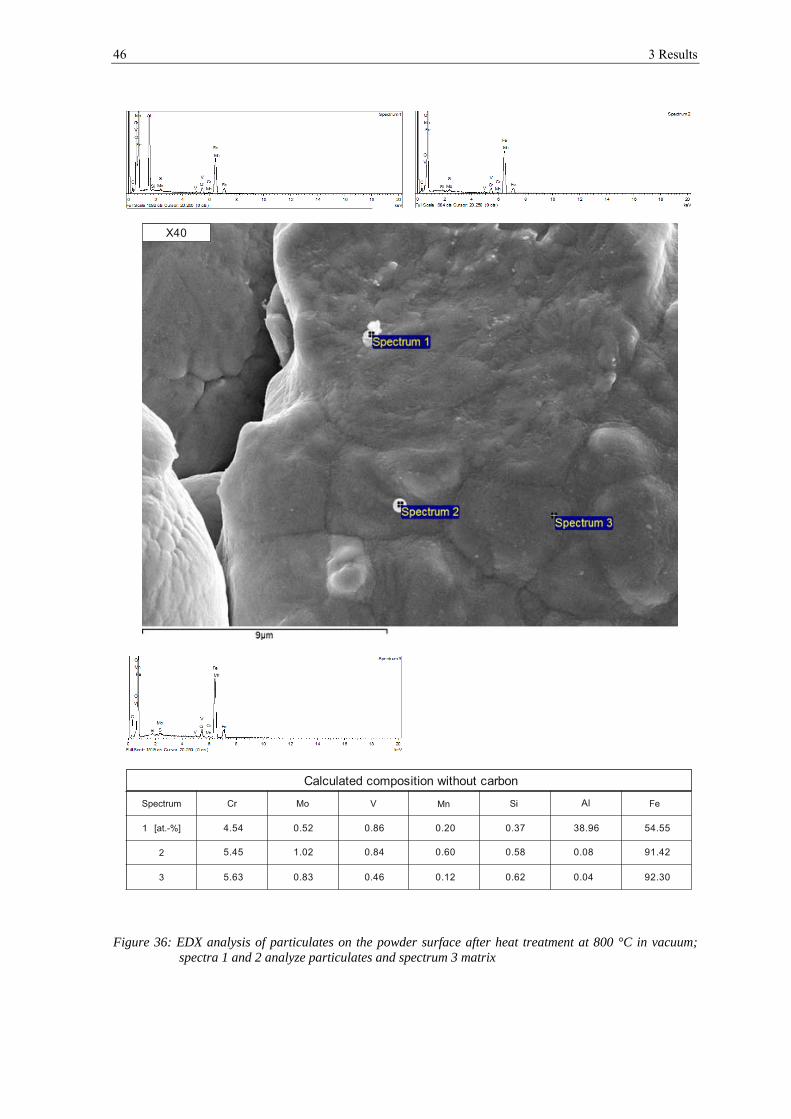
46 3 Results
Figure 36: EDX analysis of particulates on the powder surface after heat treatment at 800 °C in vacuum; spectra 1 and 2 analyze particulates and spectrum 3 matrix
X40
Calculated composition without carbon
4.54
5.45
5.63
0.52
1.02
0.83
0.86
0.84
0.46
0.20
0.60
0.12
0.37
0.58
0.62
54.55
91.42
92.30
38.96
0.08
0.04
Al
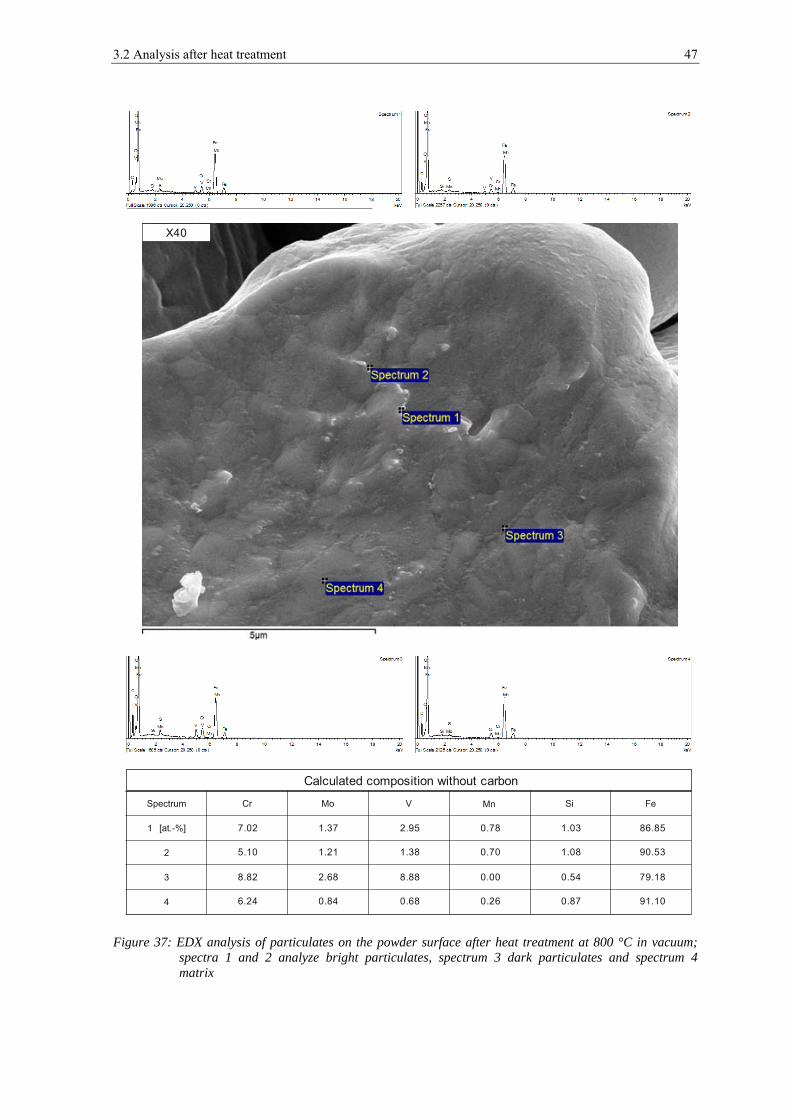
3.2 Analysis after heat treatment 47
Figure 37: EDX analysis of particulates on the powder surface after heat treatment at 800 °C in vacuum; spectra 1 and 2 analyze bright particulates, spectrum 3 dark particulates and spectrum 4 matrix
X40
Calculated composition without carbon
7.02
5.10
8.82
6.24
1.37
1.21
2.68
0.84
2.95
1.38
8.88
0.68
0.78
0.70
0.00
0.26
1.03
1.08
0.54
0.87
86.85
90.53
79.18
91.10
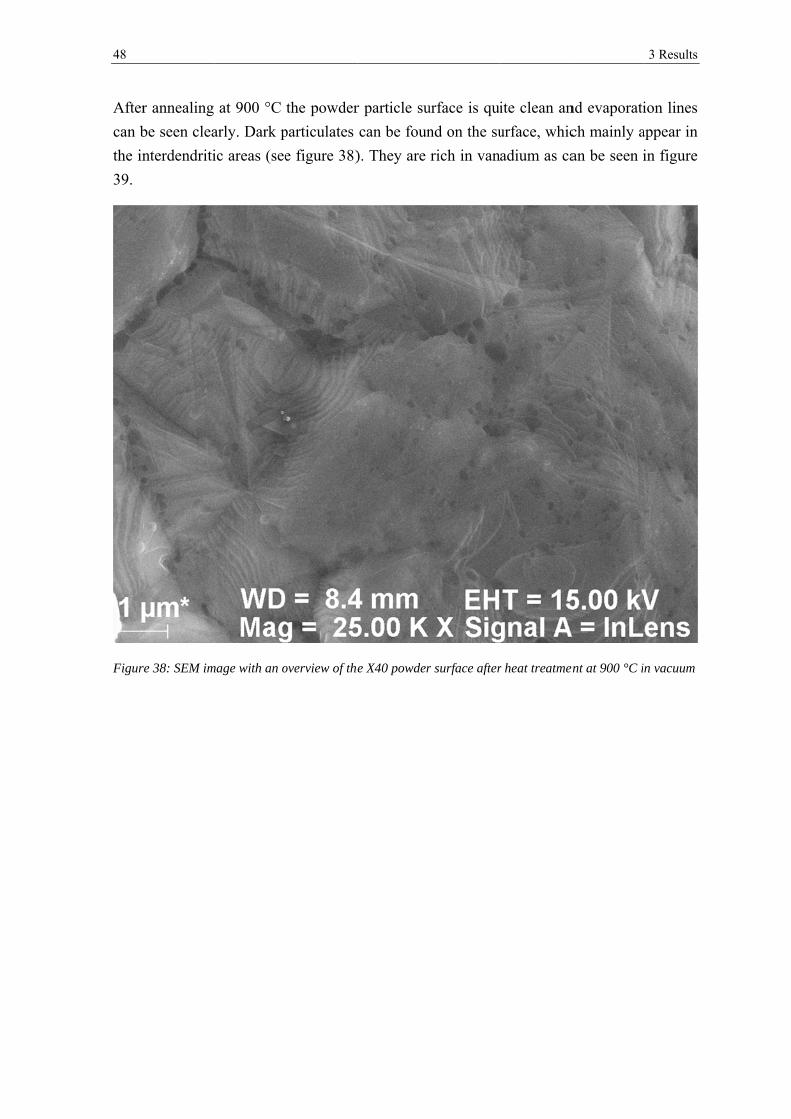
48
After
can b
the in
39.
Figur
r annealing
be seen clea
nterdendriti
re 38: SEM im
at 900 °C
arly. Dark p
ic areas (see
mage with an o
the powder
particulates
e figure 38)
overview of the
r particle su
can be foun
). They are
e X40 powder
urface is qui
nd on the su
rich in van
r surface after
ite clean an
urface, whic
adium as ca
r heat treatmen
nd evaporati
ch mainly a
an be seen i
ent at 900 °C i
3 Results
ion lines
appear in
in figure
in vacuum
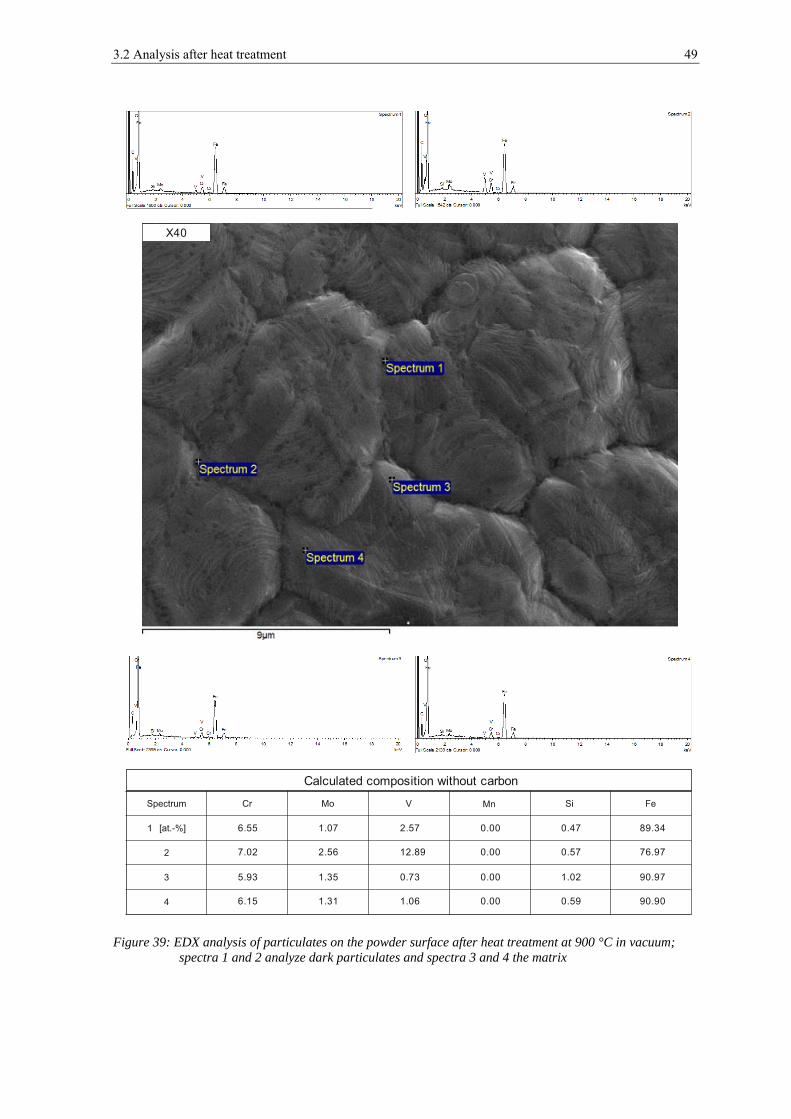
3.2 Analysis after heat treatment 49
Figure 39: EDX analysis of particulates on the powder surface after heat treatment at 900 °C in vacuum; spectra 1 and 2 analyze dark particulates and spectra 3 and 4 the matrix
X40
Calculated composition without carbon
6.55
7.02
5.93
6.15
1.07
2.56
1.35
1.31
2.57
12.89
0.73
1.06
0.00
0.00
0.00
0.00
0.47
0.57
1.02
0.59
89.34
76.97
90.97
90.90
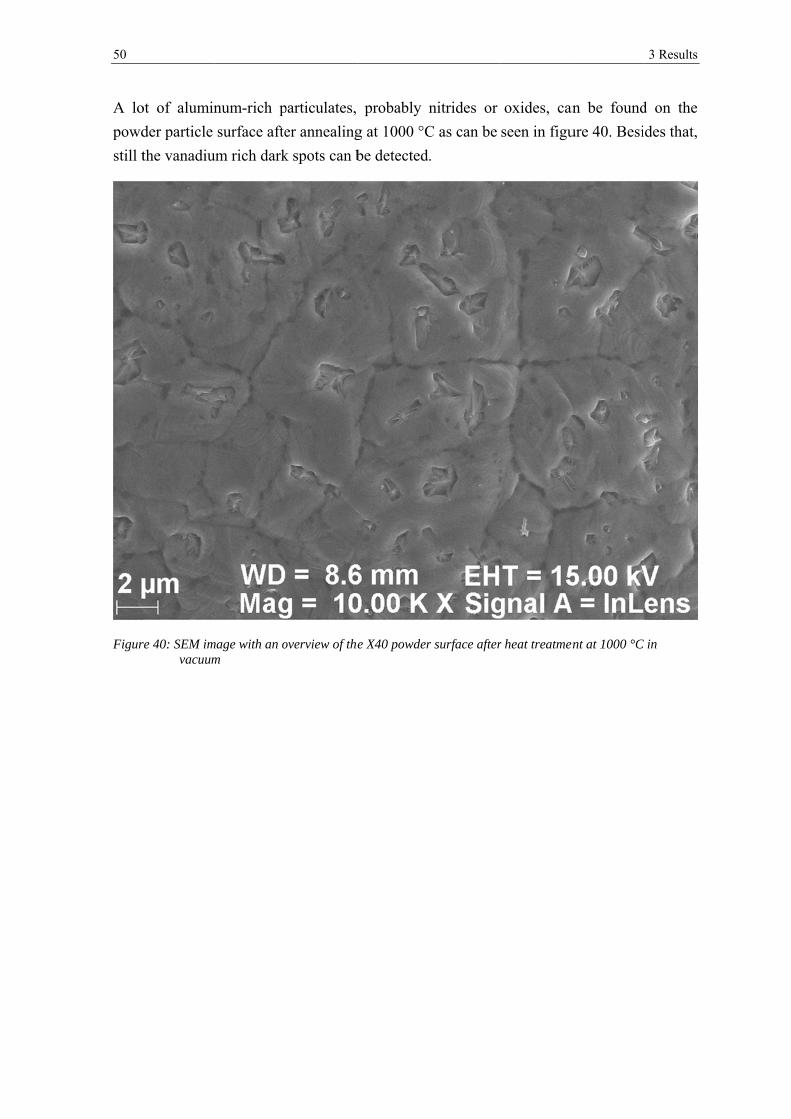
50
A lo
powd
still t
Figur
ot of alumin
der particle
the vanadiu
re 40: SEM imvacuum
num-rich p
surface afte
um rich dark
mage with an om
particulates,
er annealing
k spots can b
overview of the
probably n
g at 1000 °C
be detected
e X40 powder
nitrides or
C as can be
.
r surface after
oxides, can
seen in figu
r heat treatmen
an be found
ure 40. Besi
ent at 1000 °C
3 Results
d on the
ides that,
C in
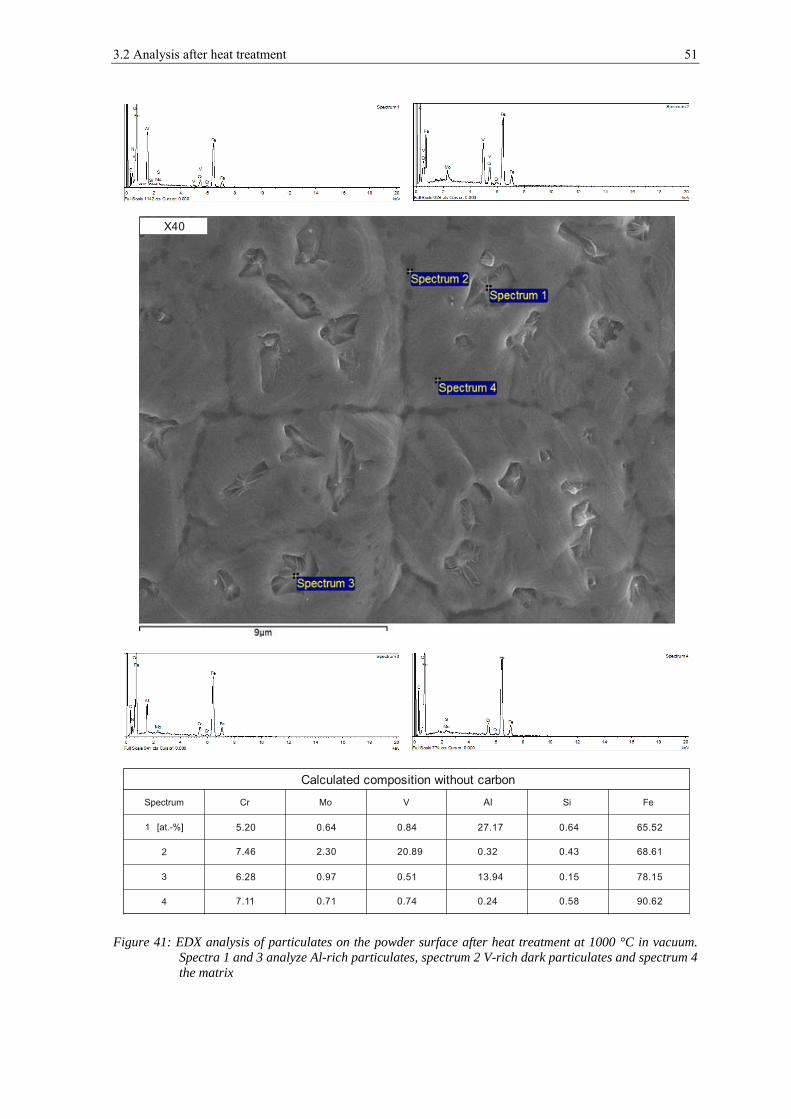
3.2 Analysis after heat treatment 51
Figure 41: EDX analysis of particulates on the powder surface after heat treatment at 1000 °C in vacuum. Spectra 1 and 3 analyze Al-rich particulates, spectrum 2 V-rich dark particulates and spectrum 4 the matrix
X40
Calculated composition without carbon
5.20
7.46
6.28
7.11
0.64
2.30
0.97
0.71
0.84
20.89
0.51
0.74
Al
0.32
13.94
0.24
0.64
0.43
0.15
0.58
65.52
68.61
78.15
90.62
27.17
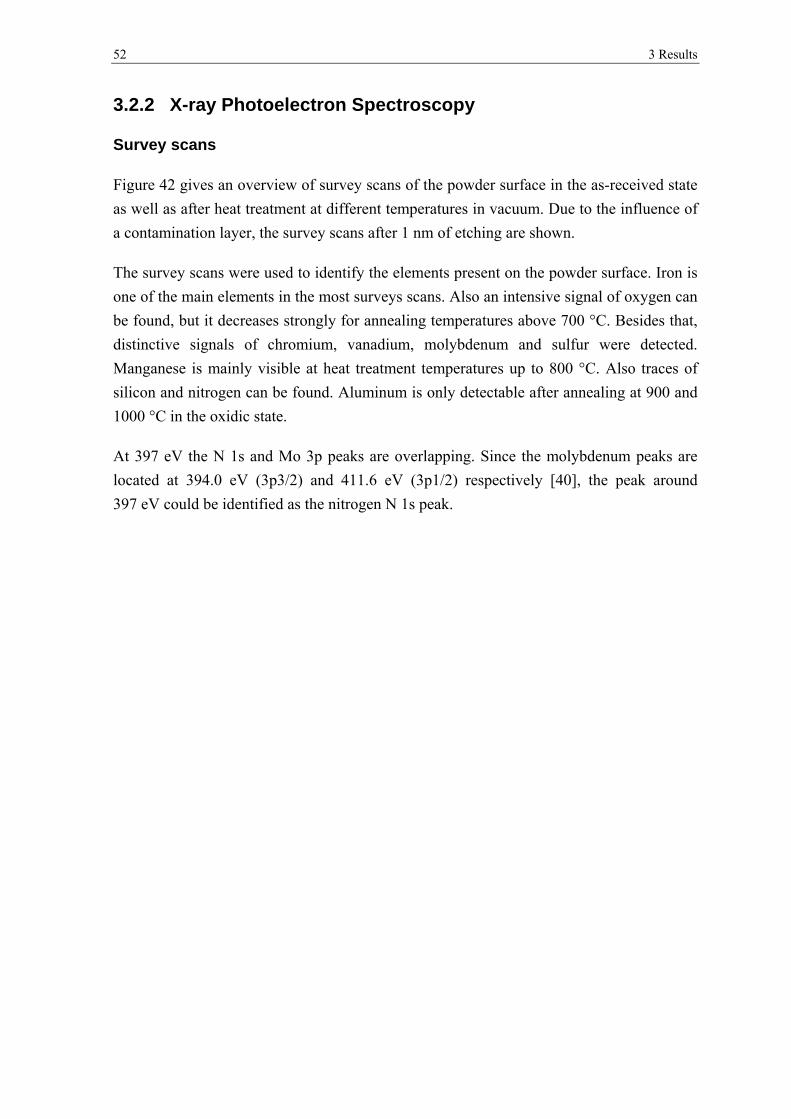
52 3 Results
3.2.2 X-ray Photoelectron Spectroscopy
Survey scans
Figure 42 gives an overview of survey scans of the powder surface in the as-received state
as well as after heat treatment at different temperatures in vacuum. Due to the influence of
a contamination layer, the survey scans after 1 nm of etching are shown.
The survey scans were used to identify the elements present on the powder surface. Iron is
one of the main elements in the most surveys scans. Also an intensive signal of oxygen can
be found, but it decreases strongly for annealing temperatures above 700 °C. Besides that,
distinctive signals of chromium, vanadium, molybdenum and sulfur were detected.
Manganese is mainly visible at heat treatment temperatures up to 800 °C. Also traces of
silicon and nitrogen can be found. Aluminum is only detectable after annealing at 900 and
1000 °C in the oxidic state.
At 397 eV the N 1s and Mo 3p peaks are overlapping. Since the molybdenum peaks are
located at 394.0 eV (3p3/2) and 411.6 eV (3p1/2) respectively [40], the peak around
397 eV could be identified as the nitrogen N 1s peak.
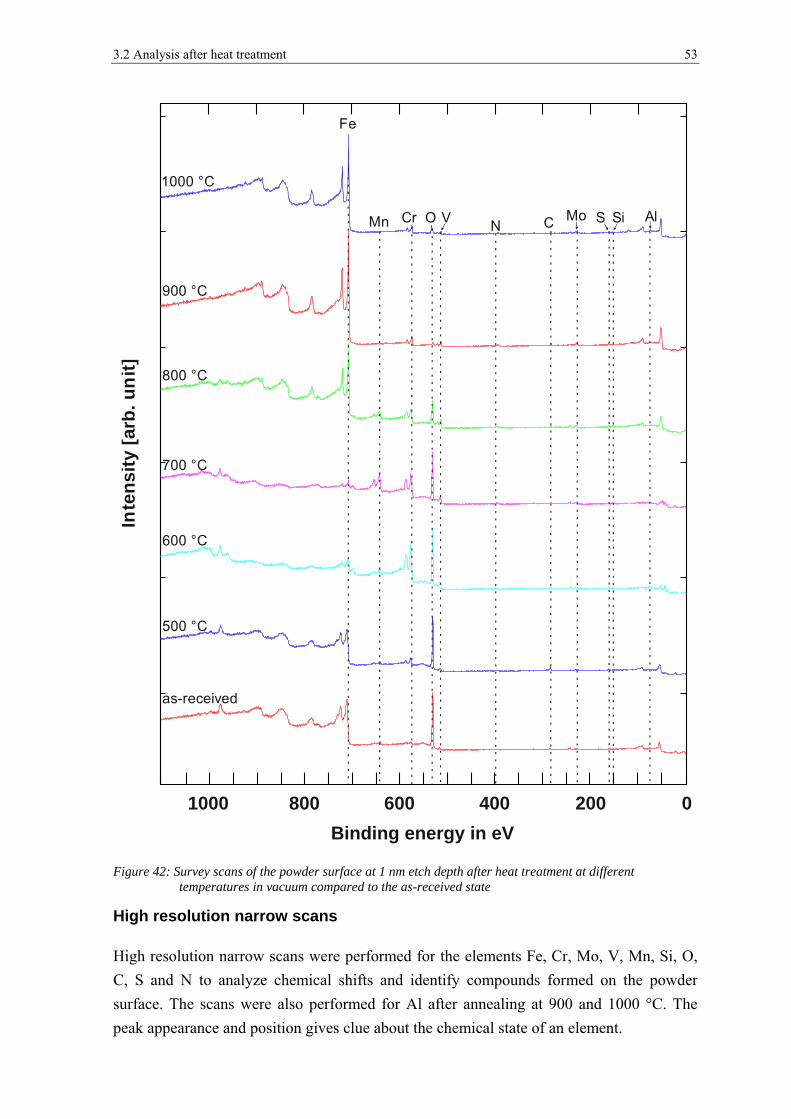
3.2 Analysis after heat treatment 53
Figure 42: Survey scans of the powder surface at 1 nm etch depth after heat treatment at different temperatures in vacuum compared to the as-received state
High resolution narrow scans
High resolution narrow scans were performed for the elements Fe, Cr, Mo, V, Mn, Si, O,
C, S and N to analyze chemical shifts and identify compounds formed on the powder
surface. The scans were also performed for Al after annealing at 900 and 1000 °C. The
peak appearance and position gives clue about the chemical state of an element.
Binding energy in eV
01000 200400600800
Inte
nsi
ty[a
rb.u
nit
]Fe
Mn Cr O V C Mo S Si AlN
1000 °C
900 °C
800 °C
700 °C
600 °C
500 °C
as-received
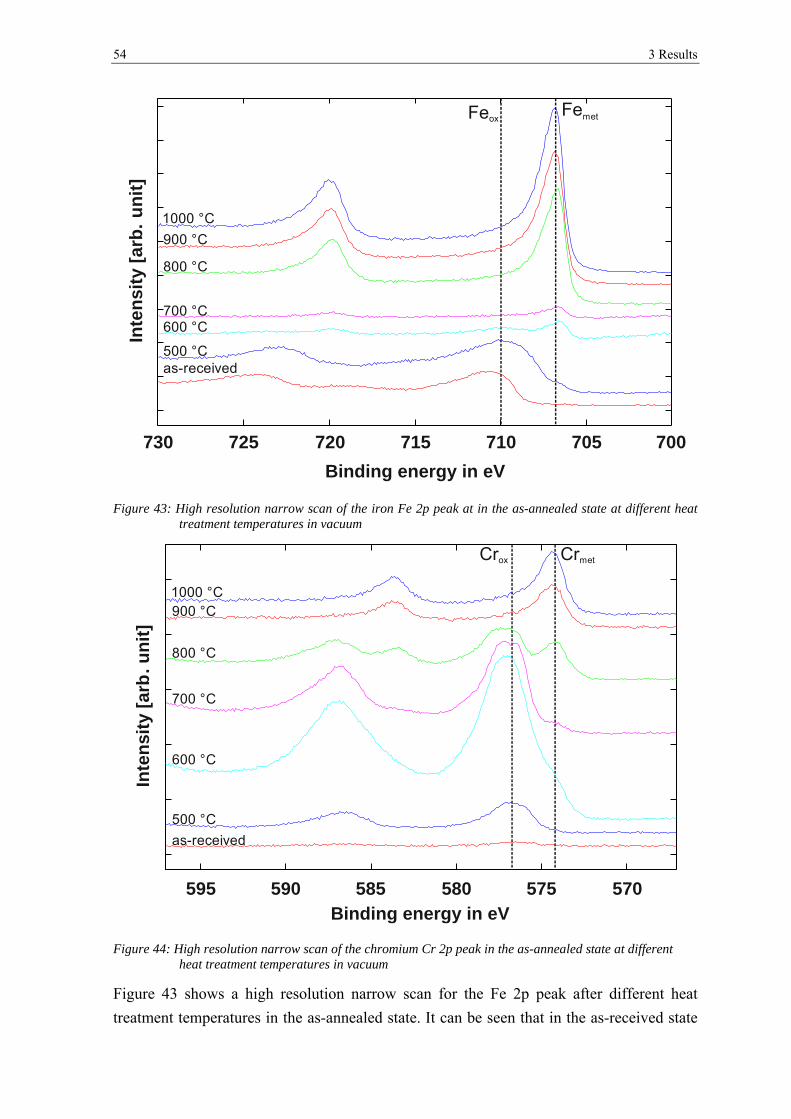
54 3 Results
Figure 43: High resolution narrow scan of the iron Fe 2p peak at in the as-annealed state at different heat treatment temperatures in vacuum
Figure 44: High resolution narrow scan of the chromium Cr 2p peak in the as-annealed state at different heat treatment temperatures in vacuum
Figure 43 shows a high resolution narrow scan for the Fe 2p peak after different heat
treatment temperatures in the as-annealed state. It can be seen that in the as-received state
Binding energy in eV
Inte
nsi
ty [
arb
. u
nit
]
700
1000 °C
900 °C
800 °C
700 °C600 °C
500 °Cas-received
705710715720725730
FeoxFemet
Binding energy in eV
Inte
nsi
ty [
arb
. un
it]
570
1000 °C900 °C
800 °C
700 °C
600 °C
500 °C
as-received
575580585590595
Crox Crmet
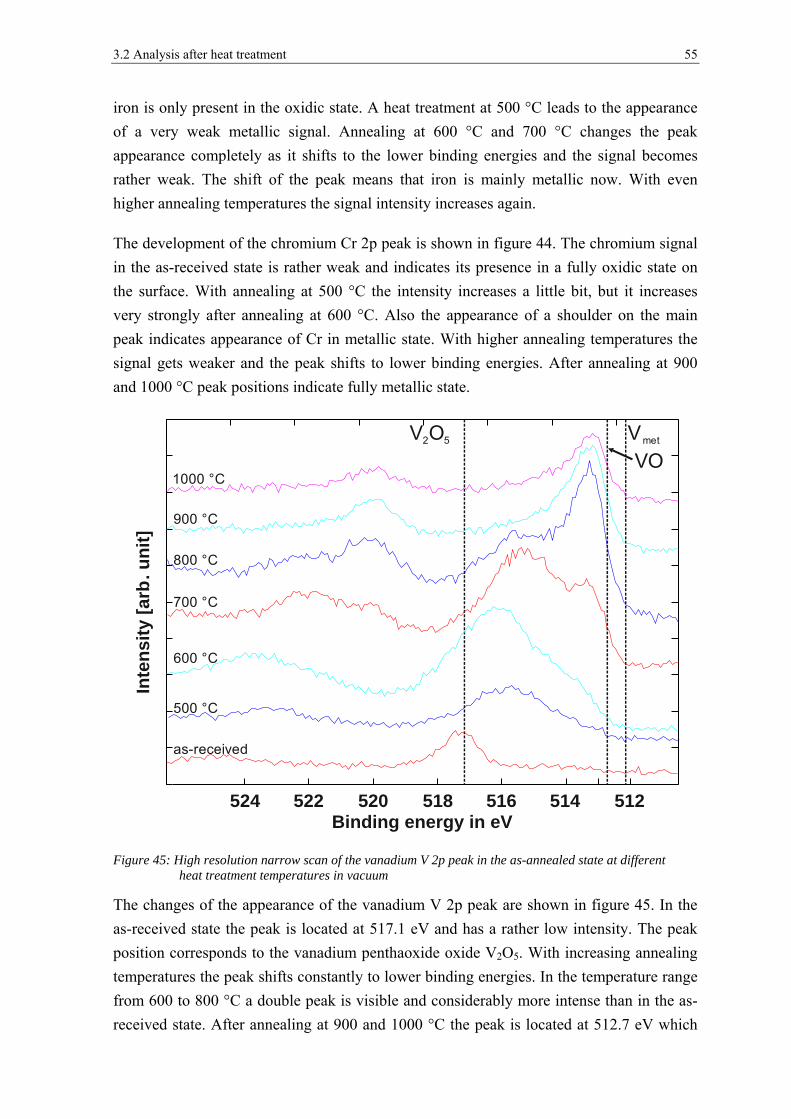
3.2 Analysis after heat treatment 55
iron is only present in the oxidic state. A heat treatment at 500 °C leads to the appearance
of a very weak metallic signal. Annealing at 600 °C and 700 °C changes the peak
appearance completely as it shifts to the lower binding energies and the signal becomes
rather weak. The shift of the peak means that iron is mainly metallic now. With even
higher annealing temperatures the signal intensity increases again.
The development of the chromium Cr 2p peak is shown in figure 44. The chromium signal
in the as-received state is rather weak and indicates its presence in a fully oxidic state on
the surface. With annealing at 500 °C the intensity increases a little bit, but it increases
very strongly after annealing at 600 °C. Also the appearance of a shoulder on the main
peak indicates appearance of Cr in metallic state. With higher annealing temperatures the
signal gets weaker and the peak shifts to lower binding energies. After annealing at 900
and 1000 °C peak positions indicate fully metallic state.
Figure 45: High resolution narrow scan of the vanadium V 2p peak in the as-annealed state at different heat treatment temperatures in vacuum
The changes of the appearance of the vanadium V 2p peak are shown in figure 45. In the
as-received state the peak is located at 517.1 eV and has a rather low intensity. The peak
position corresponds to the vanadium penthaoxide oxide V2O5. With increasing annealing
temperatures the peak shifts constantly to lower binding energies. In the temperature range
from 600 to 800 °C a double peak is visible and considerably more intense than in the as-
received state. After annealing at 900 and 1000 °C the peak is located at 512.7 eV which
VmetV O2 5
Binding energy in eV
Inte
nsi
ty[a
rb.u
nit
]
1000 °C
900 °C
800 °C
700 °C
600 °C
500 °C
as-received
VO
512514516518520522524
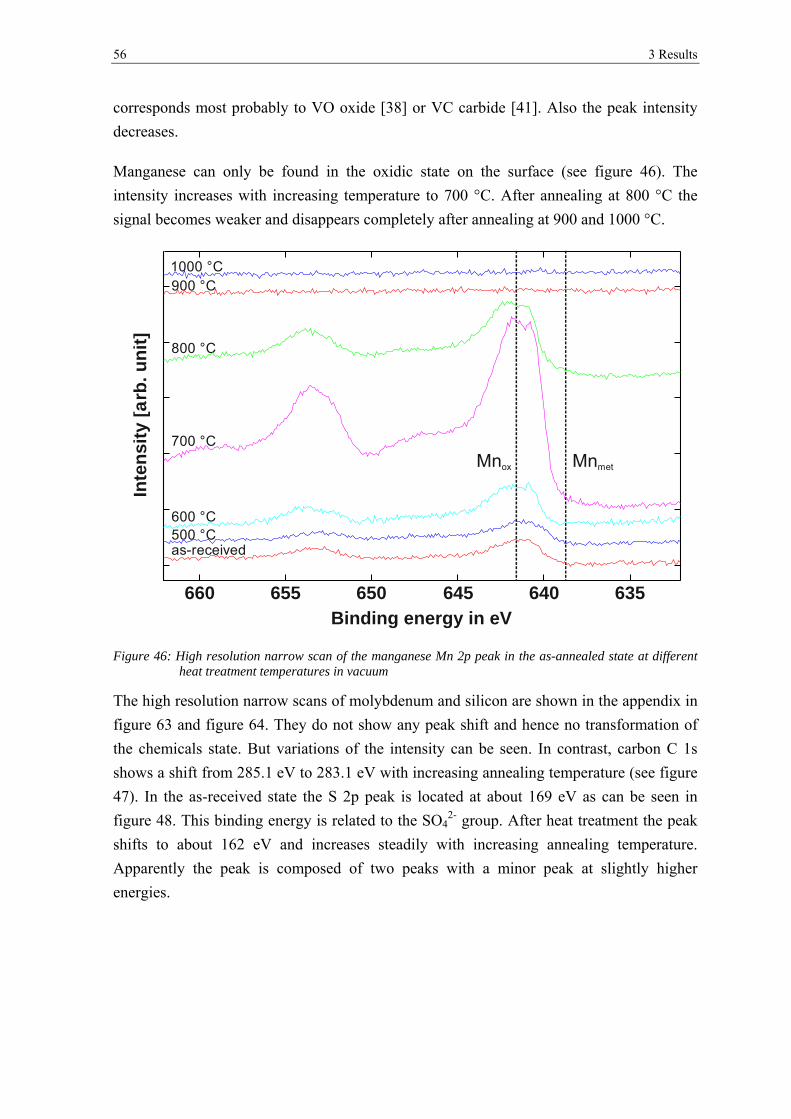
56 3 Results
corresponds most probably to VO oxide [38] or VC carbide [41]. Also the peak intensity
decreases.
Manganese can only be found in the oxidic state on the surface (see figure 46). The
intensity increases with increasing temperature to 700 °C. After annealing at 800 °C the
signal becomes weaker and disappears completely after annealing at 900 and 1000 °C.
Figure 46: High resolution narrow scan of the manganese Mn 2p peak in the as-annealed state at different heat treatment temperatures in vacuum
The high resolution narrow scans of molybdenum and silicon are shown in the appendix in
figure 63 and figure 64. They do not show any peak shift and hence no transformation of
the chemicals state. But variations of the intensity can be seen. In contrast, carbon C 1s
shows a shift from 285.1 eV to 283.1 eV with increasing annealing temperature (see figure
47). In the as-received state the S 2p peak is located at about 169 eV as can be seen in
figure 48. This binding energy is related to the SO42- group. After heat treatment the peak
shifts to about 162 eV and increases steadily with increasing annealing temperature.
Apparently the peak is composed of two peaks with a minor peak at slightly higher
energies.
Binding energy in eV
Inte
nsi
ty [
arb
. un
it]
635640645650655660
Mnox Mnmet
1000 °C900 °C
800 °C
700 °C
600 °C500 °Cas-received
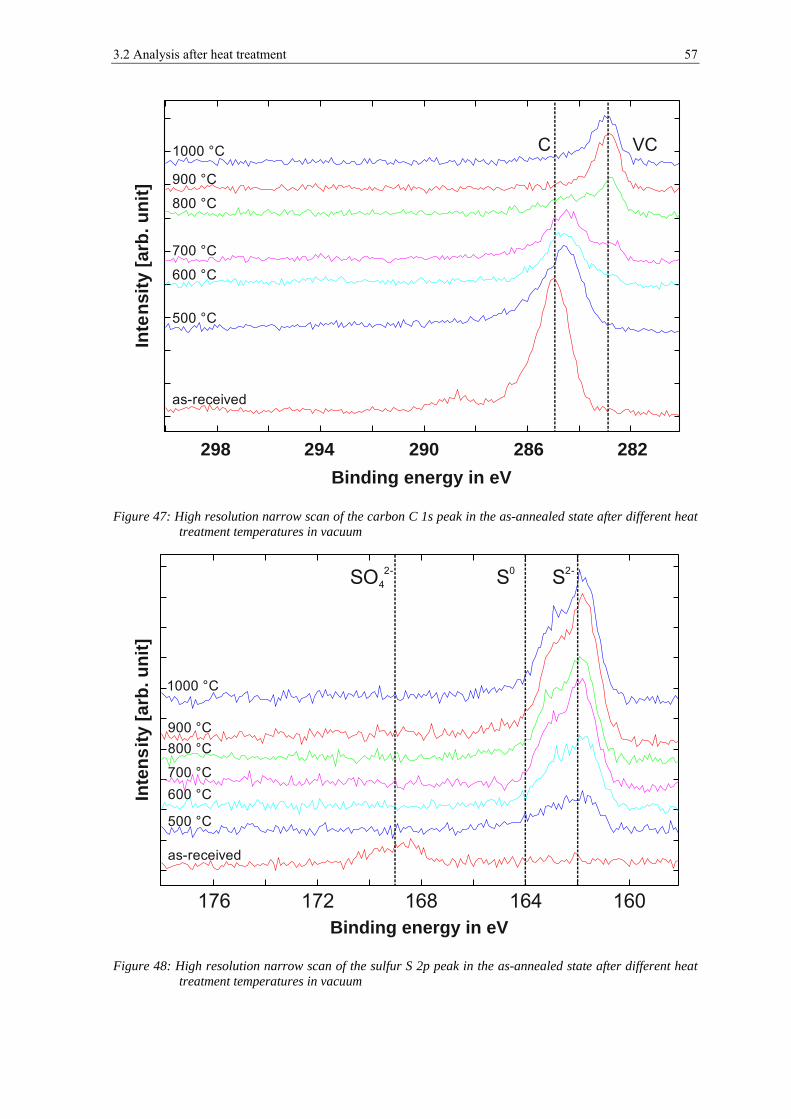
3.2 Analysis after heat treatment 57
Figure 47: High resolution narrow scan of the carbon C 1s peak in the as-annealed state after different heat treatment temperatures in vacuum
Figure 48: High resolution narrow scan of the sulfur S 2p peak in the as-annealed state after different heat treatment temperatures in vacuum
Binding energy in eV
Inte
nsi
ty [
arb
. un
it]
282286290294298
1000 °C
900 °C
800 °C
700 °C
600 °C
500 °C
as-received
C VC
Binding energy in eV
Inte
ns
ity
[arb
. un
it]
1000 °C
900 °C
800 °C
700 °C
600 °C
500 °C
as-received
SO4
2- S0 S2-
160164168172176

58 3 Results
Chemical composition of the powder surface after heat treatment
The high resolution narrow scans were used to determine the chemical surface composition
quantitatively. Figure 49 shows the results over the etch depth for different annealing
temperatures in vacuum. This diagram will be used to describe the development of the
non-metallic elements. The development of the metallic elements will be described in the
next subchapter “Metal composition of the powder surface after heat treatment”. This has
the advantage that the trends for the metallic elements can be seen more clearly, as changes
in the fraction of non-metallic elements can be quite steep and this strongly affects the
fraction of the metallic elements. The exact values for the chemical composition after heat
treatment can be found in the appendix in table 7 to 12.
After annealing at 500 °C the chemical compositions of the powder surface changes only
very slightly compared to the as-received state. Remarkable is that the trace elements like
nitrogen and sulfur appear stronger on the outermost surface. The content of sulfur
increases to almost 3 at.-%. The oxygen content decreases slightly after annealing at
700 °C. The content of sulfur, nitrogen and silicon increases further. After heat treatment at
800 °C the oxygen content decreases considerably to 30 at.% and to 6 at.-% after annealing
at 900 °C. Hence, after annealing at 900 °C the oxygen content on the outermost layer is
lower than in the inner layers due to segregation of other non-metallic elements, especially
sulfur with over 8 at-%. After annealing at 1000°C the oxygen content on the outermost
layer decreases even more to 2 at.-%. The sulfur content is still high with 8 at.-%.
Furthermore, nitrogen is enriched with almost 4 at.-%.
Metal composition of the powder surface after heat treatment
To evaluate the development of the metallic elements, the non-metallic elements have been
excluded and the data normalized to 100 %. The corresponding diagram can be seen in
figure 50.
After annealing at 500 °C the amounts of Cr, V and Mn increased on the outermost surface
compared to the as-received state. The fraction of molybdenum is below 1 % on the
outermost surface and increases with etch depth. The trend of enrichment of the alloying
elements increases further with annealing at 600 °C. Chromium is the major metallic
element with 66 at.-%. Also vanadium increased strongly to almost 11 at.-% and
manganese to 7 at.-%. In general, the enrichment can mainly be seen in the top 10 nm. On
the other hand, the amount of silicon decreased a little bit and the fraction of iron is very
low with 14 at.-%. Manganese is the major element on the surface after annealing at
700 °C with 40 at.-%. Furthermore, increased silicon content can be found with a
maximum of 9 at.-% after 3 nm of etching. The fraction of chromium decreases to
33 at.-%.
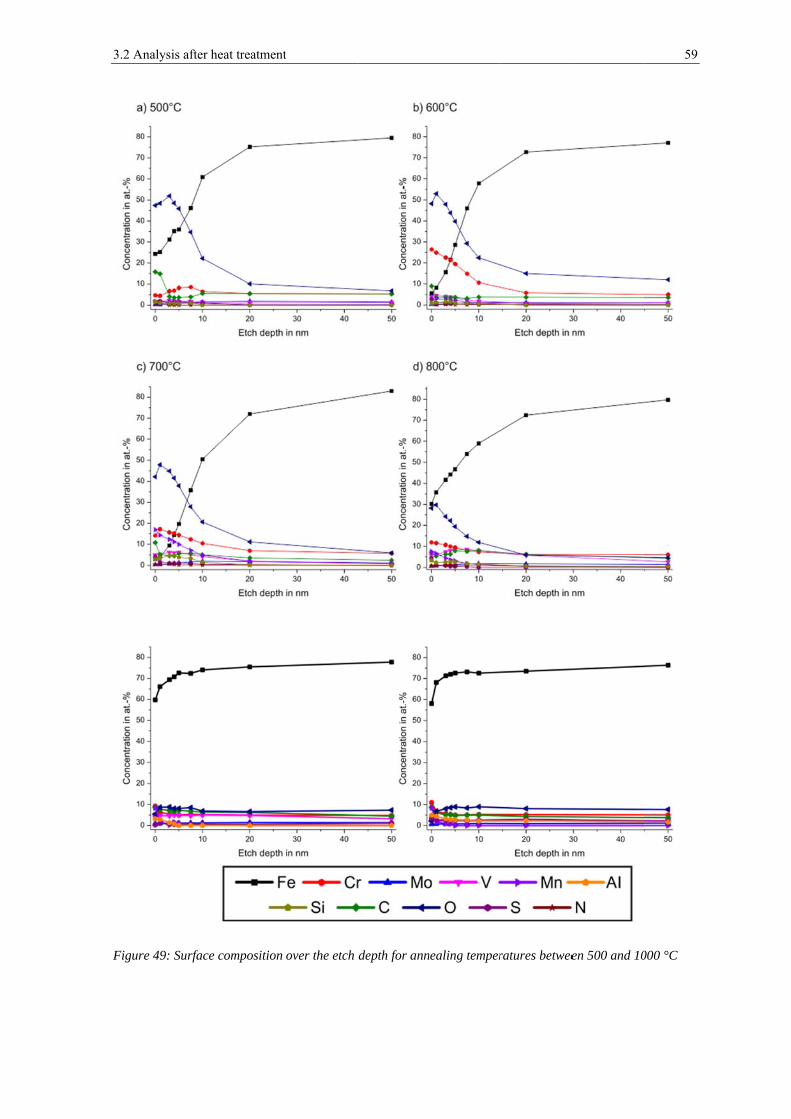
3.2 An
Figur
nalysis after h
re 49: Surface
heat treatment
composition
t
over the etch depth for annnealing temperratures betweeen 500 and 10
59
000 °C
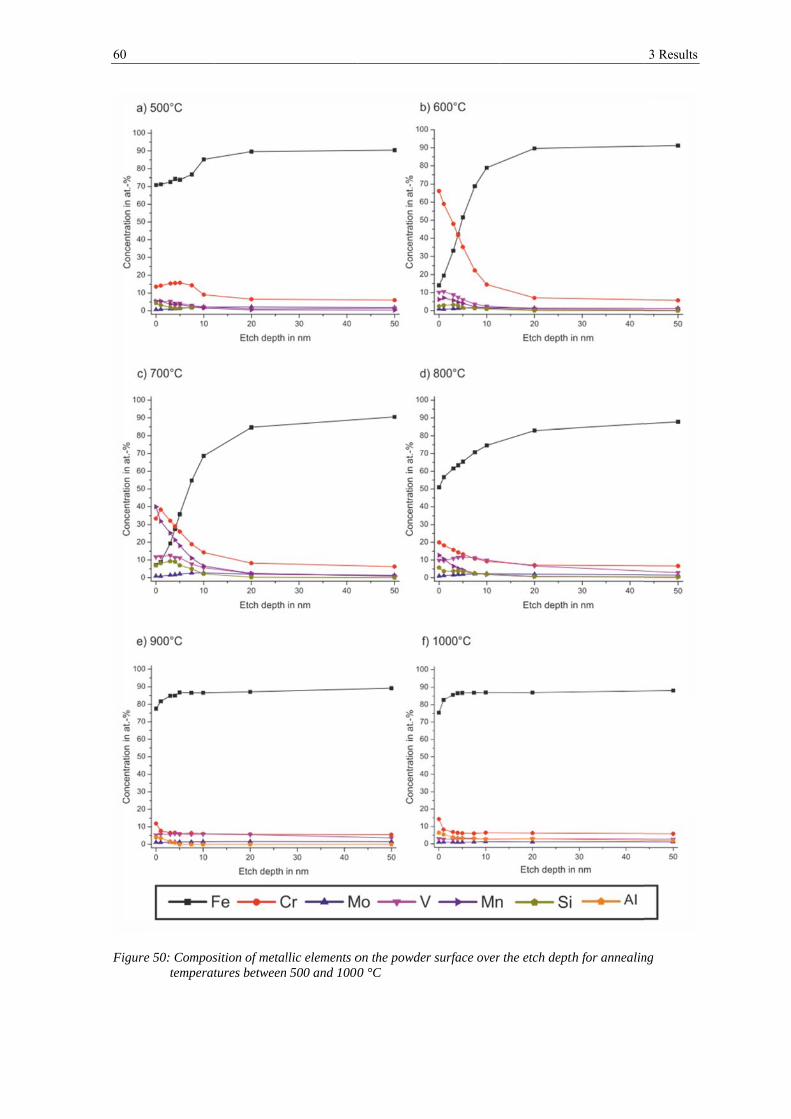
60
Figur
re 50: Compostemperat
sition of metaltures between
llic elements o 500 and 1000
on the powder0 °C
r surface over the etch depthth for annealin
3 Results
ng
3.2 Analysis after heat treatment 61
After annealing at 800 °C the amount of alloying elements on the powder surface decreases
compared to 700 °C. Therefore, iron is the major element again, followed by chromium
with ~20 at.-% and manganese (13 at.-%). The amount of vanadium and silicon remains
almost the same.
Annealing at 900 °C decreases the amount of alloying elements on the surface even more.
Chromium is still enriched in the surface with 12 at.-%, but it content decreases strongly
after etching. Molybdenum stays on a quite constant level just above 1 at.-% for all etch
depth. Vanadium is very slightly enriched on the surface with 5 at.-% on the outermost
layer and decreases constantly to about 4 at.-% after 50 nm of etching. Manganese and
silicon cannot be found anymore. But instead, aluminum can be detected with 4 at.-% on
the outermost layer. After 5 nm of etching it cannot be detected at all.
Annealing at 1000 °C leads to an increase of the aluminum content to 5 at.-% on the
outermost layer and after 50 nm of etching still almost 2 at.-% can be found. The vanadium
content decreases to 2 at.-%. Chromium is still strongly enriched in the surface with
14 at.-%, but it decreases to 8 at.-% after 1 nm of etching.
Chemical state of the metallic elements and composition of cations on the
powder surface after heat treatment
In figure 51 the fraction of the metallic state is plotted over the etch depth for different heat
treatment temperatures for iron, chromium and manganese. Vanadium and molybdenum
are not shown, because vanadium was only found in the oxidic state and molybdenum only
in the metallic state. Aluminum found after annealing at 900 and 1000 °C was also only
detected in the oxidic state. The fraction of the metallic state of manganese was not
evaluated for all etch depth as it was not always possible to perform curve fitting due to its
low content.
The differences in the chemical state after 500 °C of annealing compared to the as-received
state are quite small. However, after annealing at 600 °C iron is mainly reduced. The
amount of metallic chromium and manganese decreased for the etch depth of 20 nm and 50
nm. The amount of metallic chromium increased again after annealing at 700 °C. But still
some oxidic chromium can be found even after 50 nm of etching. Annealing at 800 °C
leads to full reduction of iron and higher amount of reduced chromium on the outermost
surface. But after annealing at 900 °C chromium is also fully reduced for all etch depth.
After annealing at 900 °C and 1000°C no manganese was found at all.
Figure 52 shows the relative cation concentration over the etch depth on the powder
particle surface for different heat treatment temperatures in vacuum. After annealing at
500 °C iron is the main cation on the powder surface with 71 %. After 5 nm of etching its
fraction decreases constantly to 0 % after 20 nm of etching. When the fraction of iron
cation decreases the fraction of chromium cation increases. On the outermost surface 14 %
62 3 Results
of all cations are chromium. The fraction increases to about 32 % from 7.5 nm to 20 nm of
etching and decreases again to 0 % after 50 nm. The fraction of vanadium is about 5 % on
the outermost surface, but it increases constantly after 7.5 nm of etching and reaches 89 %
after 50 nm of etching. The manganese fraction is about 5 % in the outer layers with a
maximum of 16 % after 20 nm of etching. The fraction of silicon cations is rather low with
a maximum of 5 % after 7.5 nm of etching.
Chromium becomes the main cation after heat treatment at 600 °C. On the outermost
surface its fraction is 73 % and it decreases constantly to 40 % after 50 nm of etching. At
the same time the fraction of iron decreases strongly with a maximum of 7 % after 1 nm of
etching. The second largest fraction is observed for vanadium cations. Their amount
increases constantly from 12 % in the unetched state to 49 % after 50 nm of etching. The
fraction of manganese and silicon also increases slightly compared to 500 °C with a
maximum of 13 % after 20 nm of etching for manganese and 8 % after 10 nm of etching
for silicon.
Besides chromium the surface is mainly enriched in manganese after annealing at 700 °C.
Both elements have a cation fraction of about 42 %. With increasing etch depth the amount
decreases to 25 % after 20 nm of etching for chromium and 22 % after 50 nm for
manganese. Vanadium becomes the main cation after 10 nm of etching. It increases
constantly with increasing etch depth from 13 % to 44 %. The fraction of silicon increases
from 7 % at the outermost surface to 17 % after 7.5 nm of etching and decreases again to
0 % after 50 nm of etching. The iron cation fraction is below 1 %.
After annealing at 800 °C the outermost surface is still enriched in chromium (32 %) and
manganese (29 %). But also high fraction of vanadium can be found of around 24 %. With
increasing etch depth the fraction of chromium and manganese decreases and the fraction
of vanadium increases. After 3 nm of etching vanadium is already the main cation and it
has a maximum of 82 % after 50 nm of etching. The fraction of silicon is rather constant
over all etch depth and varies between 9 and 16 %.
Vanadium is the main cation after heat treatment at 900 °C. Besides vanadium also
aluminum cations can be found on the top surface with 43 %. After 5 nm of etching only
vanadium cations are found.
The amount of aluminum cations increases after annealing at 1000 °C and is the main
fraction for the top 10 nm. At higher etch depths the amount of vanadium cations is
slightly increases.
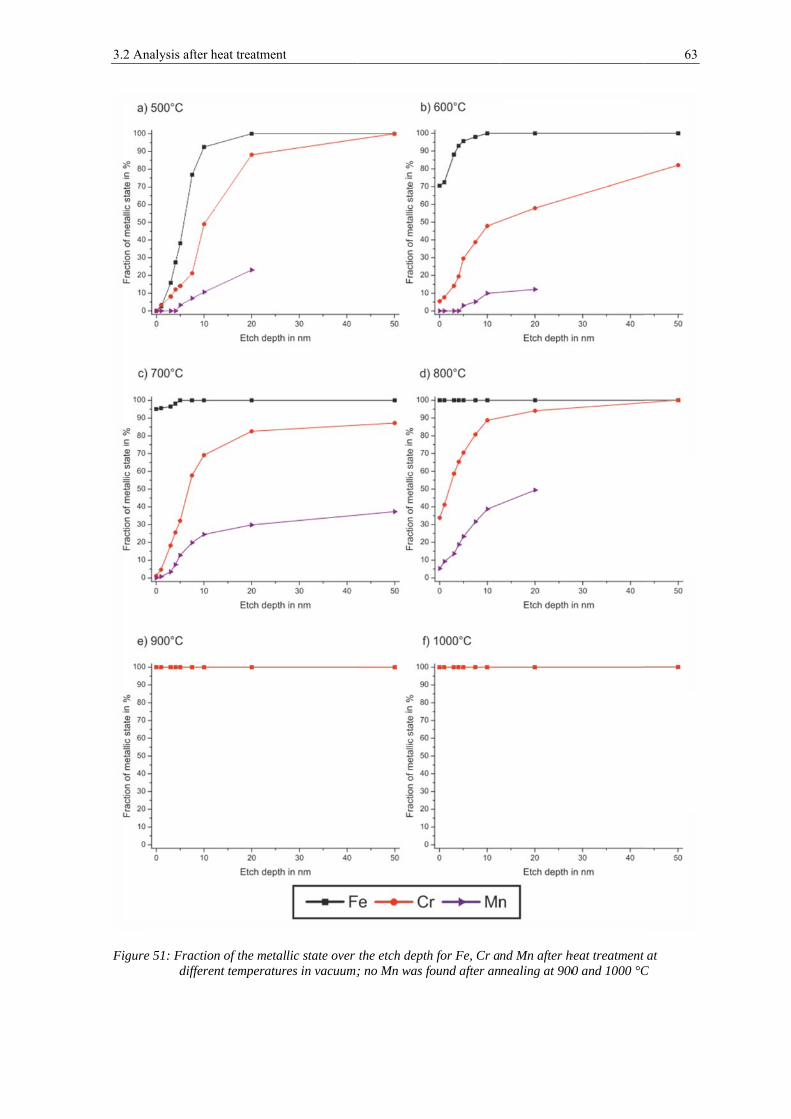
3.2 An
Figur
nalysis after h
re 51: Fractiondifferen
heat treatment
n of the metalnt temperatur
t
llic state over res in vacuum;
the etch depth; no Mn was f
h for Fe, Cr anfound after an
nd Mn after hnealing at 900
heat treatment0 and 1000 °C
63
t at C
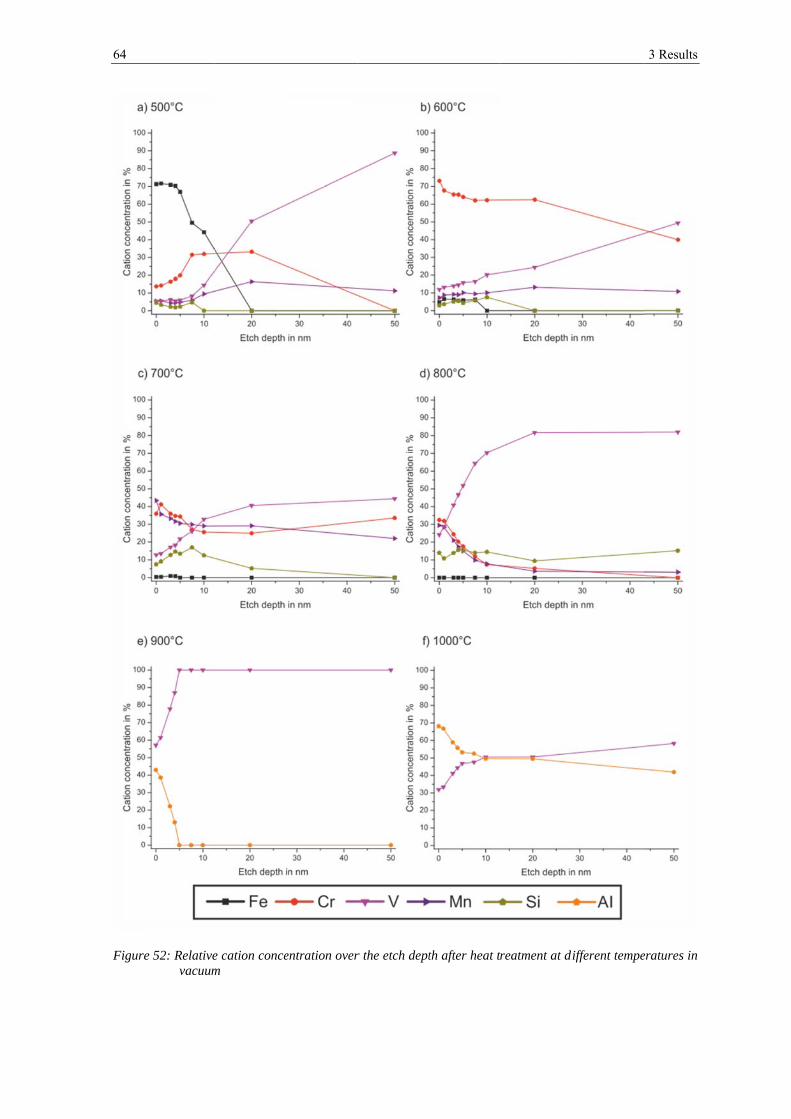
64
Figur
re 52: Relative vacuum
e cation concem
entration overr the etch deptth after heat treatment at didifferent tempe
3 Results
eratures in
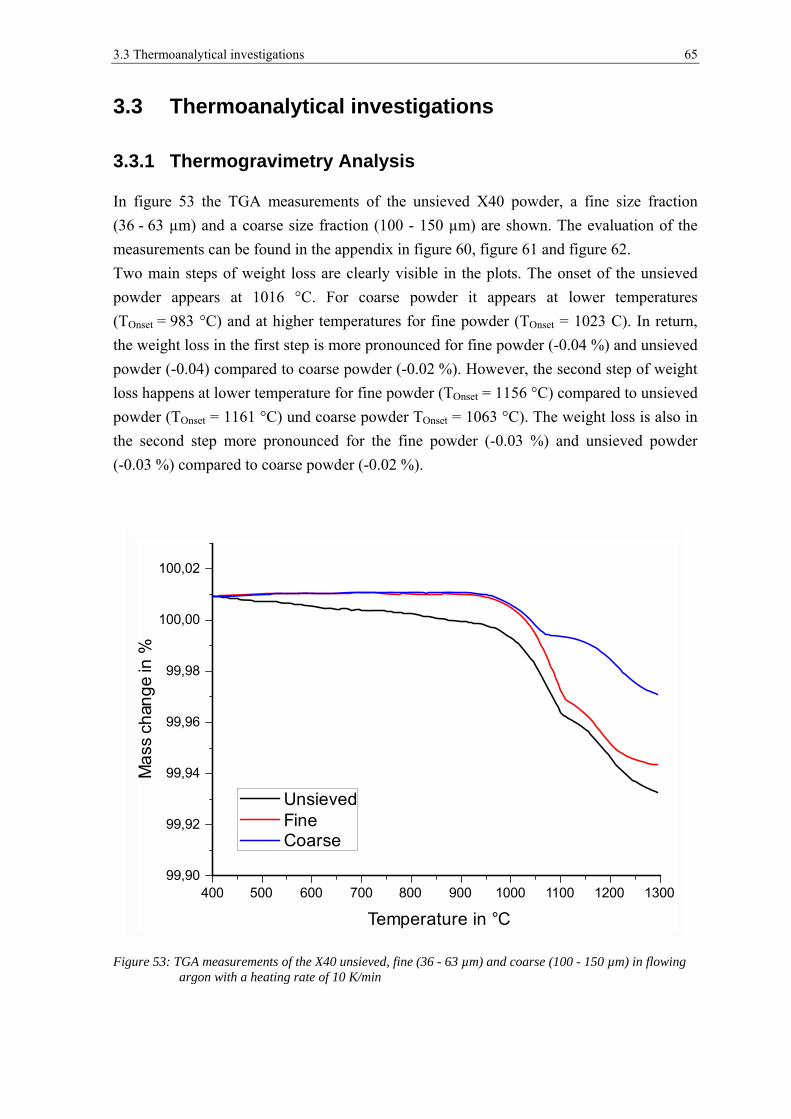
3.3 Thermoanalytical investigations 65
3.3 Thermoanalytical investigations
3.3.1 Thermogravimetry Analysis
In figure 53 the TGA measurements of the unsieved X40 powder, a fine size fraction
(36 - 63 µm) and a coarse size fraction (100 - 150 µm) are shown. The evaluation of the
measurements can be found in the appendix in figure 60, figure 61 and figure 62.
Two main steps of weight loss are clearly visible in the plots. The onset of the unsieved
powder appears at 1016 °C. For coarse powder it appears at lower temperatures
(TOnset = 983 °C) and at higher temperatures for fine powder (TOnset = 1023 C). In return,
the weight loss in the first step is more pronounced for fine powder (-0.04 %) and unsieved
powder (-0.04) compared to coarse powder (-0.02 %). However, the second step of weight
loss happens at lower temperature for fine powder (TOnset = 1156 °C) compared to unsieved
powder (TOnset = 1161 °C) und coarse powder TOnset = 1063 °C). The weight loss is also in
the second step more pronounced for the fine powder (-0.03 %) and unsieved powder
(-0.03 %) compared to coarse powder (-0.02 %).
Figure 53: TGA measurements of the X40 unsieved, fine (36 - 63 µm) and coarse (100 - 150 µm) in flowing argon with a heating rate of 10 K/min
400 500 600 700 800 900 1000 1100 1200 130099,90
99,92
99,94
99,96
99,98
100,00
100,02
Ma
ss c
han
ge
in %
Temperature in °C
UnsievedFineCoarse
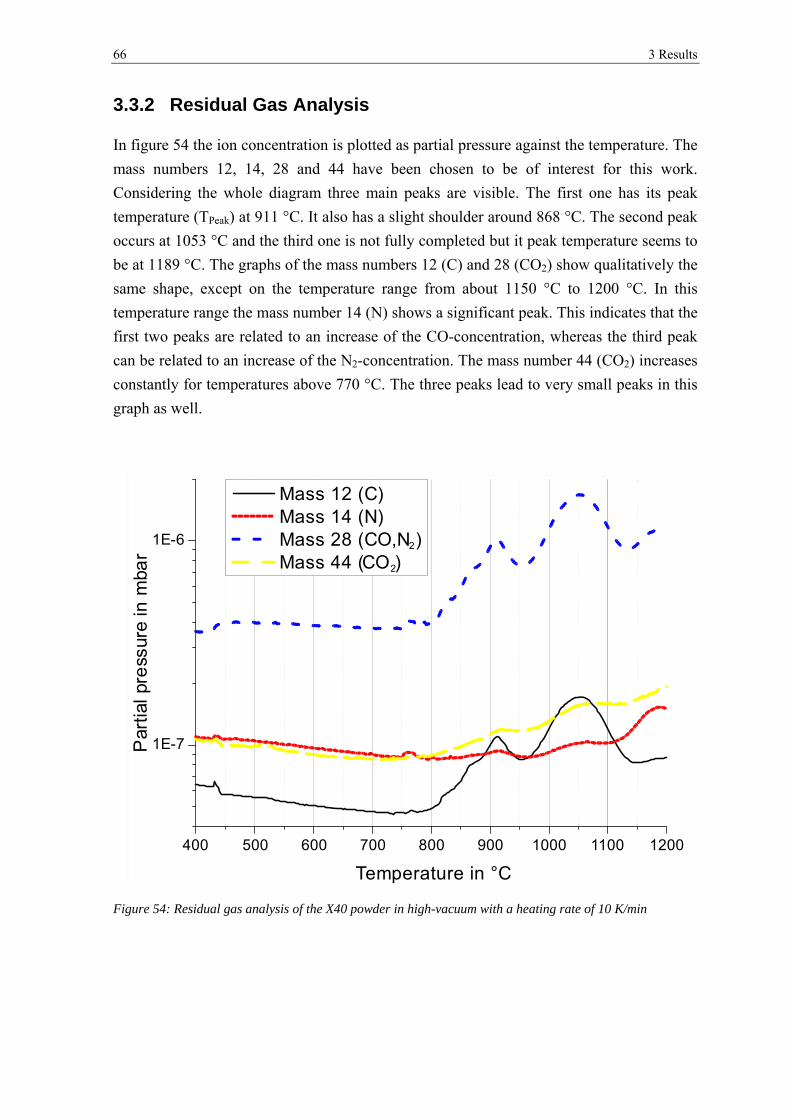
66 3 Results
3.3.2 Residual Gas Analysis
In figure 54 the ion concentration is plotted as partial pressure against the temperature. The
mass numbers 12, 14, 28 and 44 have been chosen to be of interest for this work.
Considering the whole diagram three main peaks are visible. The first one has its peak
temperature (TPeak) at 911 °C. It also has a slight shoulder around 868 °C. The second peak
occurs at 1053 °C and the third one is not fully completed but it peak temperature seems to
be at 1189 °C. The graphs of the mass numbers 12 (C) and 28 (CO2) show qualitatively the
same shape, except on the temperature range from about 1150 °C to 1200 °C. In this
temperature range the mass number 14 (N) shows a significant peak. This indicates that the
first two peaks are related to an increase of the CO-concentration, whereas the third peak
can be related to an increase of the N2-concentration. The mass number 44 (CO2) increases
constantly for temperatures above 770 °C. The three peaks lead to very small peaks in this
graph as well.
Figure 54: Residual gas analysis of the X40 powder in high-vacuum with a heating rate of 10 K/min
400 500 600 700 800 900 1000 1100 1200
1E-7
1E-6
Par
tial p
ress
ure
in m
bar
Temperature in °C
Mass 12 (C)Mass 14 (N)Mass 28 (CO,N )2
Mass 44 (CO )2
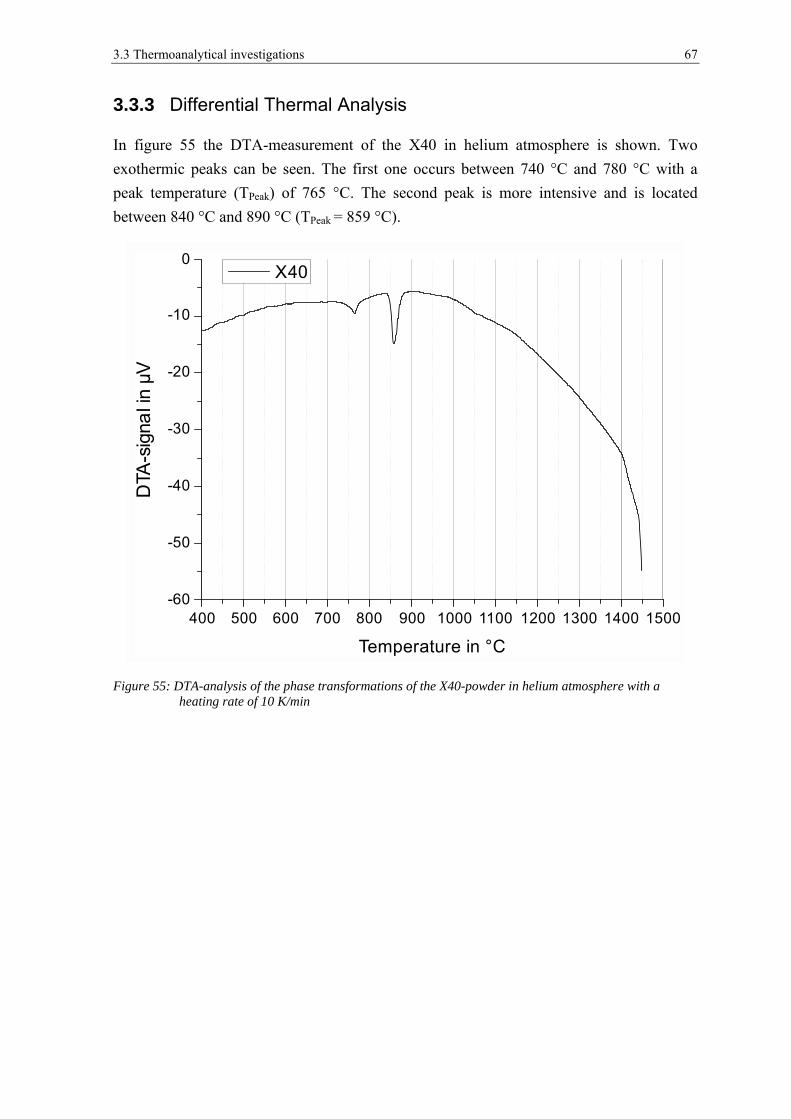
3.3 Thermoanalytical investigations 67
3.3.3 Differential Thermal Analysis
In figure 55 the DTA-measurement of the X40 in helium atmosphere is shown. Two
exothermic peaks can be seen. The first one occurs between 740 °C and 780 °C with a
peak temperature (TPeak) of 765 °C. The second peak is more intensive and is located
between 840 °C and 890 °C (TPeak = 859 °C).
Figure 55: DTA-analysis of the phase transformations of the X40-powder in helium atmosphere with a heating rate of 10 K/min
400 500 600 700 800 900 1000 1100 1200 1300 1400 1500-60
-50
-40
-30
-20
-10
0
DTA
-sig
nal i
n µV
Temperature in °C
X40
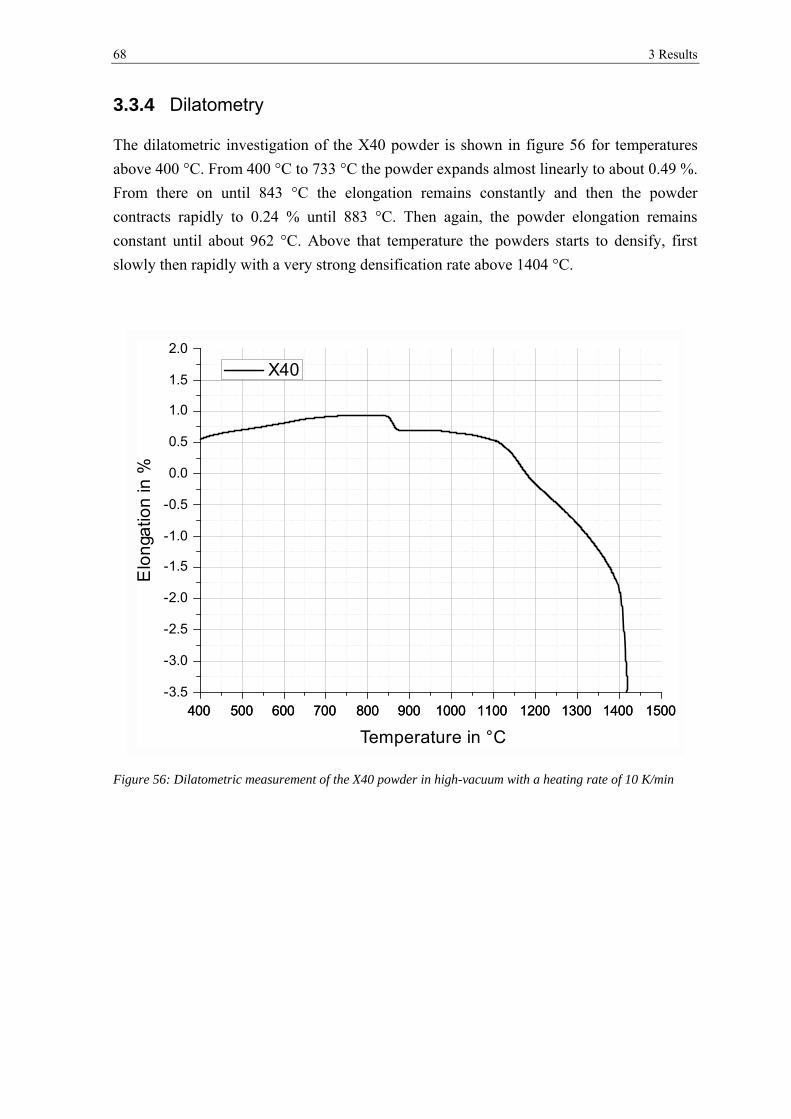
68 3 Results
3.3.4 Dilatometry
The dilatometric investigation of the X40 powder is shown in figure 56 for temperatures
above 400 °C. From 400 °C to 733 °C the powder expands almost linearly to about 0.49 %.
From there on until 843 °C the elongation remains constantly and then the powder
contracts rapidly to 0.24 % until 883 °C. Then again, the powder elongation remains
constant until about 962 °C. Above that temperature the powders starts to densify, first
slowly then rapidly with a very strong densification rate above 1404 °C.
Figure 56: Dilatometric measurement of the X40 powder in high-vacuum with a heating rate of 10 K/min
400 500 600 700 800 900 1000 1100 1200 1300 1400 1500
X40
400 500 600 700 800 900 1000 1100 1200 1300 1400 1500-3.5
-3.0
-2.5
-2.0
-1.5
-1.0
-0.5
0.0
0.5
1.0
1.5
2.0
Elo
nga
tion
in %
Temperature in °C
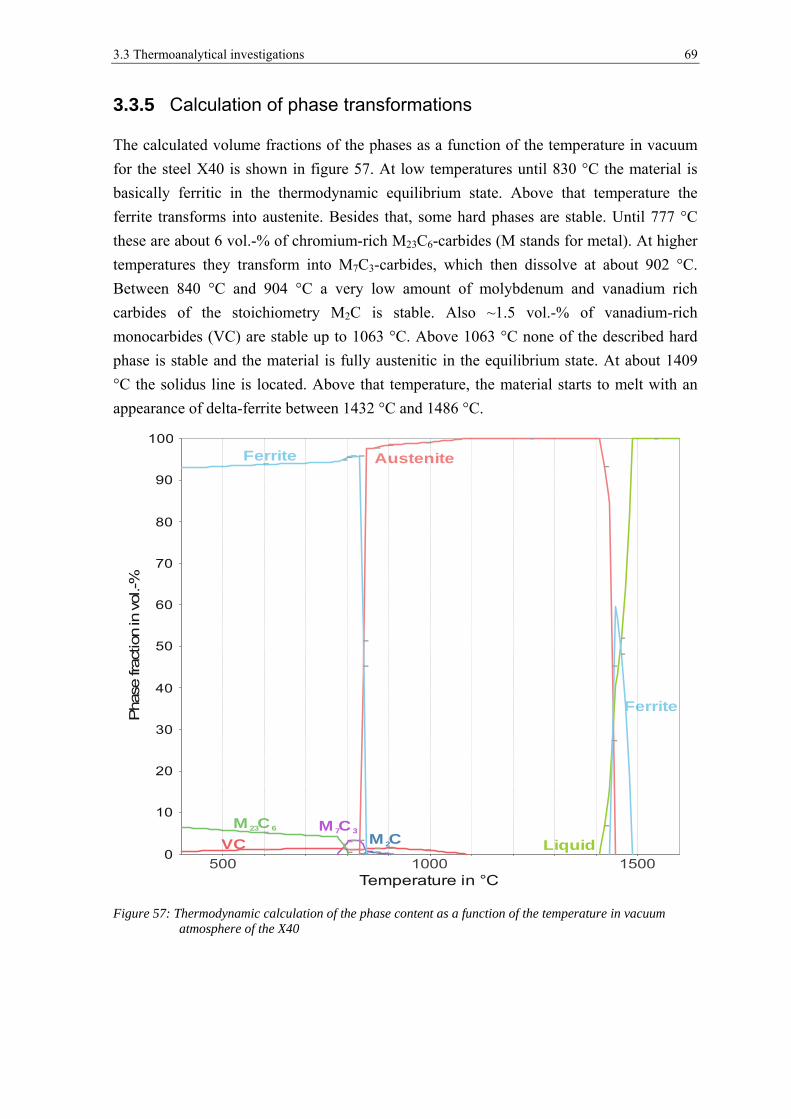
3.3 Thermoanalytical investigations 69
3.3.5 Calculation of phase transformations
The calculated volume fractions of the phases as a function of the temperature in vacuum
for the steel X40 is shown in figure 57. At low temperatures until 830 °C the material is
basically ferritic in the thermodynamic equilibrium state. Above that temperature the
ferrite transforms into austenite. Besides that, some hard phases are stable. Until 777 °C
these are about 6 vol.-% of chromium-rich M23C6-carbides (M stands for metal). At higher
temperatures they transform into M7C3-carbides, which then dissolve at about 902 °C.
Between 840 °C and 904 °C a very low amount of molybdenum and vanadium rich
carbides of the stoichiometry M2C is stable. Also ~1.5 vol.-% of vanadium-rich
monocarbides (VC) are stable up to 1063 °C. Above 1063 °C none of the described hard
phase is stable and the material is fully austenitic in the equilibrium state. At about 1409
°C the solidus line is located. Above that temperature, the material starts to melt with an
appearance of delta-ferrite between 1432 °C and 1486 °C.
Figure 57: Thermodynamic calculation of the phase content as a function of the temperature in vacuum atmosphere of the X40
Temperature in °C
Phase
fra
ctio
n in
vol.-
%
0
70
60
50
40
10
30
20
80
90
100
Liquid
Ferrite Austenite
M C7 3 M C23 6
Ferrite
VC M C2
4 Discussion
First of all the powder particle surface in the as-received state will be discussed. The SEM
studies show that the X40 powder is spherically shaped which is typical for gas-atomized
steel powder [8]. No metallic element could be found in the metallic state on the as-
received surface, which implies that the powder surface is covered completely by a
continuous oxide layer. After a few nanometers of argon ion etching the fraction of the
metallic state increases strongly for iron and after 20 nm of etching iron is completely
metallic. Since the other elements do not show the same trend, it can be concluded that iron
forms a thin homogeneous oxide layer on the powder surface. The thickness has been
determined to be about 7 nm. This is quite thick for inert gas atomized steel powder and
can be explained by improper storage over a long period of time without protective
atmosphere. After 7.5 nm of etching the iron cation concentration decreases strongly. This
can be explained by the removal of homogeneous iron oxide layer and so chromium
cations increase at this depth. In fact, chromium also shows a steep increase of the metallic
state, even though a little bit weaker compared to iron. However, it cannot be concluded
that it also forms a chromium oxide layer. If there would be a continuous chromium oxide
layer no metallic iron signal could be detected. Hence, there is a free metallic matrix with
distributes chromium, manganese and vanadium oxide particulates.
Vanadium shows a change in the chemical state with increasing etch depth, but the binding
energy is still too high to indicate a metallic state. Besides that, vanadium oxide is very
sensitive to ion etching [38]. That means that it transforms to lower oxidation states when
being etched. Thus, the implied change in the chemical state must not only have a real
chemical meaning but is also a secondary effect of the ion etching. Molybdenum does not
play an important role in the oxide formation and is depleted on the surface. This was also
shown in studies of Karlsson [12] and Danninger et al. [42, 43].
On top of the oxides a contamination layer can be found. It is indicated by a large amount
of carbon, assuming presence of absorbed species. Also the oxygen peak shows a shoulder
which corresponds to the present of oxygen in hydroxides. Besides that, the sulfur S 2p
peak shifts strongly after 1 nm of etching from about 169 eV to 162 eV. The higher
binding energy corresponds to sulfur in the SO42- group and the lower one to some sulfides.
But it cannot be concluded if there is a contamination layer with SO42- and underneath
sulfides or if the shift is due to the influence of ion etching [19]. Manganese is also
enriched on the surface and both elements mainly disappear after 10 nm of etching. Hence,
presence of a monolayer formed by MnS sulfide can be assumed, covering the powder
surface. Because it is very thin, the oxide layer underneath the contamination layer can also
be measured in the as-received state. Such a contamination layer is typical for atomized
metal powders.
71
The SEM studies confirm the observations by XPS. The iron oxide layer cannot be found
due to its small thickness compared to the large interaction area of the electron beam with
the powder material, but different kinds of particulates could be observed.
Heat treatment of the X40 powder in an UHV furnace leads to significant changes in the
powder surface composition. However, the differences after annealing at 500 °C are rather
small compared to the as-received state. Chromium, silicon and vanadium are enriched on
the surface. A slight difference compared to the as-received state can also be seen in SEM
studies as very few small rectangular particulates appear.
After annealing at 600 °C the surface appearance changed considerably. The rectangular
particulates appear all over the powder particle surface especially in the interdendritic
areas, where the content of elements with strong oxide affinity as vanadium und chromium
is higher. Taking the XPS results into account it becomes clear that they must be chromium
rich oxides, due to the fact that the chromium content is strongly increased on the surface
and still in the oxidic state. Simultaneously, the iron oxide is mainly reduced indicating
that probably it acted as the source of oxygen during heat-treatment to form the chromium
oxides. This is also proved by the fact that the oxygen content stays on the same level on
the outermost surface. The oxides do not only cover a big area on the surface, they also
grow in size as can be seen by the chemical state of chromium, since it is not fully metallic
any more after 50 nm of etching. The fraction of metallic manganese is also lower in etch
depths over 10 nm compared to the state after annealing at 500 °C. Thus, the iron oxide
layer is reduced in favor of more stable chromium and manganese oxides. The metallic
part of chromium that can be measured is probably a signal from chromium in the steel
matrix that is free of oxides now. Vanadium shows a shift in the binding energy to lower
energies. According to vanadium oxide studies of Hryha et al. [38], vanadium undergoes a
stepwise reduction process from V2O5 VO2 V2O3 VO V. The binding energies
of 515.95 eV and 515.5 eV are related to the presence of vanadium in VO2 and V2O3.
The content of chromium on the powder surface is decreased after annealing at 700 °C. In
return, the content of manganese increases, accompanied by an increase of sulfur on the
outermost surface. Probably sulfur and manganese form manganese sulfide (MnS). The
binding energy of manganese Mn 2p3/2 in MnS is at 640.9 eV [44] and thus overlaps with
the peak of manganese in the oxidic state. But the S 2p was found at about 161.9 eV,
which is in good accordance with values in literature for sulfur in MnS at 162.1 eV.
At larger etch depths manganese is still in oxidic state. The same is valid for the signal of
silicon which increased after annealing at 700 °C and was found in the Si4+ state.
Manganese and silicon are known to form stable Mn-Si-oxides [14, 45]. But no
information about the binding energy for this type of oxide could be found.
Still, also a lot of chromium is present on the powder surface, assuming formation of
72 4 Discussion
spinels with manganese of the type MnCr2O4. According to the literature, a small satellite
peak around 647 eV is visible if this spinel is present [46], which indeed could be founds
here and thus indicate the presence of MnCr2O4 spinels after annealing at 700 °C.
Furthermore does the appearance of the particulates change to a more spherical shape,
which is also an indication for a transformation of the oxide type.
The V 2p3/2 peak is composed of at least two peaks. The second one appears at lower
binding energies at 513.2 eV. There are two possible chemical compounds associated to
that energy. Firstly, there is a further reduced state of vanadium oxides (VO). According to
[19] its binding energy is 512.7 eV for the V 2p3/2 peak. Secondly, there is VC which has
a binding energy of 513.5 eV [41]. A hint which is the case here can give a look on the
narrow scans of carbon. The carbon C 1s peak is composed of two peaks after annealing at
700 °C. The minor peak is located at about 282.8 eV which is quite close to 282.5 eV for
carbon in VC carbides measured by Antonik et al. [41]. In multicomponent alloys carbides
are never pure, which also shifts the binding energies slightly. This might also be the case
here. However, most probably the measured V 2p signal is an overlap of both, VO and VC,
and one growing on another. Formation of VO on top of VC has been investigated before
[47]. According to reaction calculations performed with HSC Chemistry 7.0 the Gibbs
energy ΔG is positive for the reaction
VO + 2C VC + CO 4.1
below 1100 °C. Even if the values for ΔG are quite low for the temperatures from 700 °C
to 1000 °C the reactions is still not possible from the thermodynamical point of view.
However, the equilibrium constant K has a calculated value of 1.238·10-3 for the reaction at
700 °C. According to equation (2.5) this corresponds to a CO partial pressure of
1.238·10-3 bar, which is rather high and possible to reach under the applied conditions. For
higher temperatures then 800 °C the partial CO pressure even increases and thus the
reaction is getting more likely. The exact calculated values can be found in table 13 in the
appendix. Hence, transformation from vanadium oxide VO to vanadium carbides VC is
very probable.
Another possible explanation for the shift of the C 1s peak is formation of chromium-rich
carbides on the surface. According to the thermodynamic calculations by Thermo-Calc, the
type M23C6 (M stands for metal) is stable at 700 °C. No information about this type could
be found, but about the type M7C3, which is favored at 800 °C and above. The signal of the
chromium Cr 2p3/2 is located at 574.5 eV in Cr7C3 and at 574.1 eV in (Fe,Cr)7C3. This
overlaps with the peak of metallic chromium at 574.3 eV [48]. Thus, information about the
carbides is difficult to derive from the chromium signal. But the C 1s peak is located at
283.0 eV for Cr7C3, respectively 283.3 eV for (Fe,Cr)7C3. Hence, it is very likely that the
73
measured carbon peak is composed of both, carbon in vanadium carbide and chromium-
rich M23C6, respectively M7C3.
The decrease of the oxygen content on the powder surface after annealing at 800 °C is very
distinctive. Simultaneously the content of chromium and manganese decreases strongly,
indicating a decrease of chromium and manganese oxides. Manganese has a comparatively
high vapor pressure and the vacuum level in the furnace was ultra-high. Thermodynamic
calculations and experimental findings of high alloyed Fe-19Mn-18Cr-C-N steels showed a
large sublimation of manganese for temperatures above 700 °C in the same experimental
set-up as used for this work [14]. Thus, it can be concluded that the same effect occurs for
the steel investigated here. The sublimation was not verifiable in the RGA measurement
for the X40, but this is not remarkable as manganese is just a trace element and thus the
signal might be not strong enough. However, for the Fe-19Mn-18Cr-C-N manganese
sublimation has also been observed in RGA in former works [49]. 34 % of chromium on
the outermost surface is in the metallic state which shows a reduction of chromium oxides.
First reduction processes indicated by RGA start around 800 °C, but a first decent peak
cannot be seen before 911 °C. In the TGA the onset off weight loss starts around 1023 °C.
But different oxygen partial pressures in each experiment have to be considered. In the
furnace attached to the XPS the vacuum pressure was about 10-7 mbar, whereas the
pressure for the RGA analysis was <10-4 mbar and the TGA analysis was performed in
flowing argon atmosphere. This means that the temperature intervals of each experiment
where the reduction occurs cannot be compared exactly. But it is known that the lower the
oxygen partial pressure the lower is the temperature needed to reduce oxides (see figure 4).
Hence, in the XPS the oxide reduction must start at much lower temperatures compared to
RGA and TGA for the chosen conditions.
Oxide reduction is also visible in the SEM pictures. The surface looks rather clean after
annealing at 800 °C. Besides a very few bright particulates, the main particulates found on
the surface appeared darker and the EDX measurements showed that they are rich in
vanadium. Due to the low oxygen content measured, they are probably vanadium carbides.
The peak shifts of V 2p and C 1s to lower binding energies are even more pronounced after
annealing at 800 °C, which suggests formation of VC carbides. Additionally, very small
particulates were seen in the SEM. The CALPHAD calculations indicate the present of
chromium-rich M7C3 carbides. But due to their small size this could not be proved by
EDX.
In the DTA-plot an endothermic reaction can be seen at 765 °C and a second one at
859 °C. Exactly at the same temperature interval of the second peak a pronounced and
rapid shrinkage can be seen in the dilatometry plot. Considering this it can be concluded
that the second endothermic peak is related to the transformation of ferrite to austenite,
since the face-centered cubic (fcc) crystal lattice of austenite has a denser atomic packing
compared to the body-centered cubic (bcc) crystal lattice of the ferrite [4]. The
74 4 Discussion
transformation from ferrite to austenite is also in compliance to the transformation
calculated with CALPHAD. There are two possible explanations for the first endothermic
peak: The first one is the already shown formation of VC carbides. The as-received powder
of the steel grade X34CrMoCo3-3-3 was investigated by synchrotron radiation in [50]. It is
shown that the as-received powder consists mainly of martensite and some retained
austenite. But no carbides were found. It is very likely that it is the same case for the X40
powder due to the comparable chemical composition. Some segregation was found in the
cross-sections of the X40 powder but no clearly visible carbides. Thus, the carbide
precipitation must take place during the heat treatment. But due to the high affinity of
vanadium to carbon, the precipitation should start at lower temperatures [4]. This is also
indicated by the CALPHAD calculations. Therefore, it is likely that the VC precipitation
starts at lower temperatures and cannot be seen in the DTA, probably because the heat
effect is too low. On the other hand, the VC precipitation on the powder particle surface
takes place somewhere between 600 °C and 800 °C. Hence, when the oxide reduction
takes place the vanadium carbide formation is also enabled on the surface. The
thermodynamic calculations with CALPHAD show that between 780 °C and 810 °C the
chromium rich M23C6 carbides transform into carbides of the type M7C3. This consists very
well to the first measured DTA peak. The M23C6 carbides form also at low temperatures
and were probably also not detectable in the DTA plot.
Annealing at 900 °C leads to a mostly oxide free surface indicated by the low oxygen
content and the metallic state of iron and chromium. Manganese and silicon cannot be
detected anymore. Thus, most of the oxides are reduced and the surface is quite clean.
These reduction processes can be related to the peaks seen in the TGA measurements and
the first double peak of CO in the RGA measurements. These peaks appear at higher
temperatures as 900 °C, but this can be explained by the different vacuum conditions as
mentioned above. The TGA measurements show a pronounced weight loss of the powder
which is related to the formation and emission of mainly CO gas measured in RGA, which
indicates direct carbothermal reduction processes taking place. The measurements show
that the reduction process is divided into two steps, meaning either two different kinds of
oxides get reduced at different temperature intervals or one peak is related to the reduction
of surface oxides and the other one to reduction of inner oxides.
Amongst other things the degassing behavior of different powder particle sizes of plain
carbon steel Fe-0.5% C was studied in [43]. It was shown that the finer the particle size the
more pronounced is the first peak and it is shifted to slightly higher temperatures. This can
be explained by the larger surface area of finer powder, leading to larger content of iron
oxides in the iron oxide layer. Exactly the same degassing behavior was found for the
different powder size fractions of the powder studied here in the TGA measurements. This
leads to the conclusion that the oxide reduction on the surface occurs in two steps and the
second reduction peak is related to inner oxides and thermodynamically stable surface
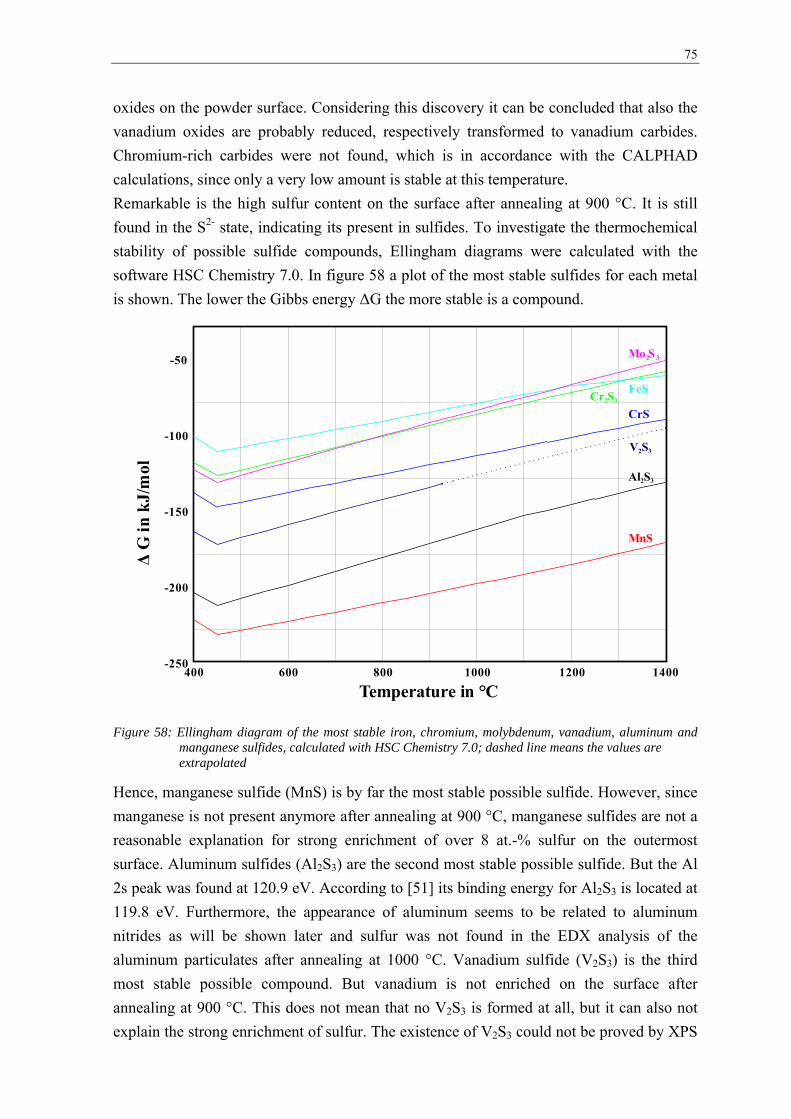
75
oxides on the powder surface. Considering this discovery it can be concluded that also the
vanadium oxides are probably reduced, respectively transformed to vanadium carbides.
Chromium-rich carbides were not found, which is in accordance with the CALPHAD
calculations, since only a very low amount is stable at this temperature.
Remarkable is the high sulfur content on the surface after annealing at 900 °C. It is still
found in the S2- state, indicating its present in sulfides. To investigate the thermochemical
stability of possible sulfide compounds, Ellingham diagrams were calculated with the
software HSC Chemistry 7.0. In figure 58 a plot of the most stable sulfides for each metal
is shown. The lower the Gibbs energy ΔG the more stable is a compound.
Figure 58: Ellingham diagram of the most stable iron, chromium, molybdenum, vanadium, aluminum and manganese sulfides, calculated with HSC Chemistry 7.0; dashed line means the values are extrapolated
Hence, manganese sulfide (MnS) is by far the most stable possible sulfide. However, since
manganese is not present anymore after annealing at 900 °C, manganese sulfides are not a
reasonable explanation for strong enrichment of over 8 at.-% sulfur on the outermost
surface. Aluminum sulfides (Al2S3) are the second most stable possible sulfide. But the Al
2s peak was found at 120.9 eV. According to [51] its binding energy for Al2S3 is located at
119.8 eV. Furthermore, the appearance of aluminum seems to be related to aluminum
nitrides as will be shown later and sulfur was not found in the EDX analysis of the
aluminum particulates after annealing at 1000 °C. Vanadium sulfide (V2S3) is the third
most stable possible compound. But vanadium is not enriched on the surface after
annealing at 900 °C. This does not mean that no V2S3 is formed at all, but it can also not
explain the strong enrichment of sulfur. The existence of V2S3 could not be proved by XPS
400 600 800 1000 1200 1400-250
-200
-150
-100
-50
Δ G
in
kJ/
mol
Temperature in °C
Al S2 3
CrS
Cr S2 3
FeS
MnS
Mo S2 3
V S2 3
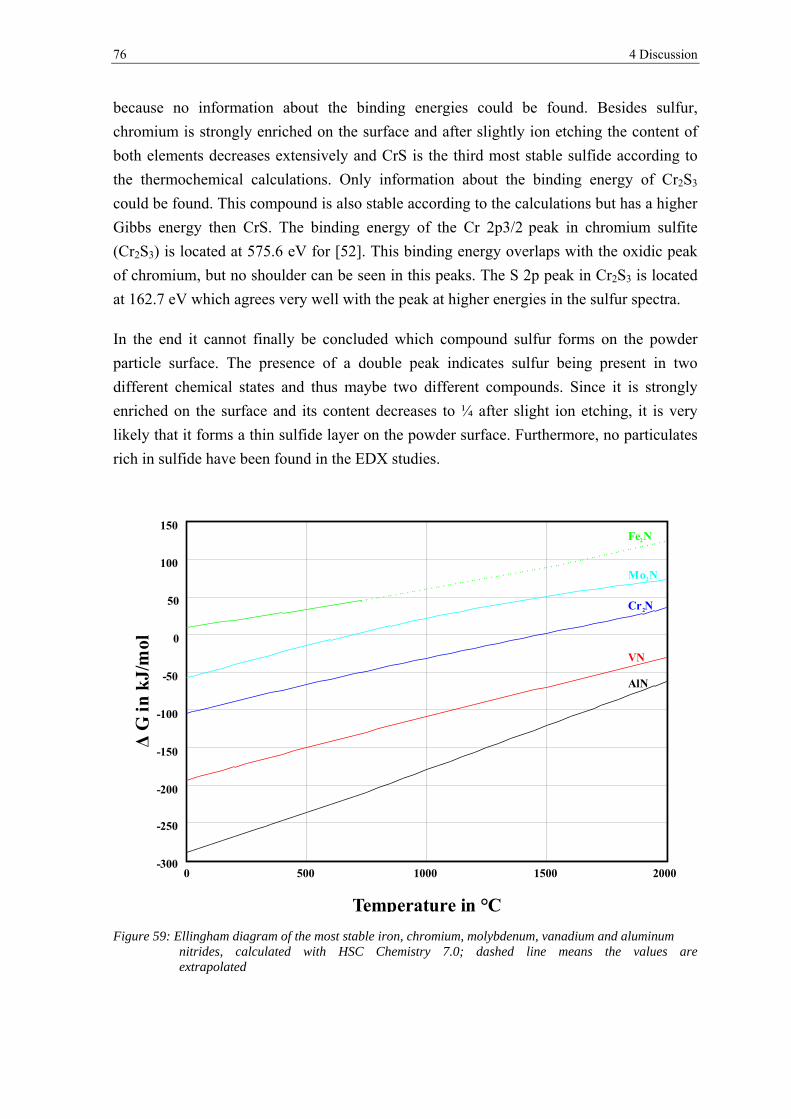
76 4 Discussion
because no information about the binding energies could be found. Besides sulfur,
chromium is strongly enriched on the surface and after slightly ion etching the content of
both elements decreases extensively and CrS is the third most stable sulfide according to
the thermochemical calculations. Only information about the binding energy of Cr2S3
could be found. This compound is also stable according to the calculations but has a higher
Gibbs energy then CrS. The binding energy of the Cr 2p3/2 peak in chromium sulfite
(Cr2S3) is located at 575.6 eV for [52]. This binding energy overlaps with the oxidic peak
of chromium, but no shoulder can be seen in this peaks. The S 2p peak in Cr2S3 is located
at 162.7 eV which agrees very well with the peak at higher energies in the sulfur spectra.
In the end it cannot finally be concluded which compound sulfur forms on the powder
particle surface. The presence of a double peak indicates sulfur being present in two
different chemical states and thus maybe two different compounds. Since it is strongly
enriched on the surface and its content decreases to ¼ after slight ion etching, it is very
likely that it forms a thin sulfide layer on the powder surface. Furthermore, no particulates
rich in sulfide have been found in the EDX studies.
Figure 59: Ellingham diagram of the most stable iron, chromium, molybdenum, vanadium and aluminum nitrides, calculated with HSC Chemistry 7.0; dashed line means the values are extrapolated
0 500 1000 1500 2000-300
-250
-200
-150
-100
-50
0
50
100
150
AlN
Cr N2
Fe N2
Mo N2
VN
ΔG
ink
J/m
ol
Temperature in °C
77
Annealing at 1000°C leads to the formation of aluminum- rich particulates on the powder
surface. In addition, the content of nitrogen is strongly increased. The Ellingham diagram
for possible nitride compounds shows the high stability of AlN (see figure 59).
Questionable is the source of origin of aluminum. The shape of the particulates indicates
that they grow out of the powder particle itself. The initial content of aluminum in the
powder is not known, so this hypothesis cannot be validated. The second possible source
can be the heating element used in the UHV furnace. It is made of the material
“Kanthal A-1” which is a FeCrAl-alloy. But no such contaminations when using this
filament have been observed before.
The RGA plot shows evolvement of N2 gas for temperatures above 1100 °C. The measured
nitrogen peak N 1s is located at 397.6 eV for elevated temperatures. Thermodynamic
calculations with CALPHAD showed that nitrogen is bound in VC when no aluminum is
present and form vanadium carbonitrides. No information about the binding energy of
nitrogen in that kind of compound could be found, but in vanadium nitride (VN) it is at
about 397.3 eV [53] and thus also indicates that nitrogen is present in the vanadium
carbonitrides. Since the solubility of nitrogen in steels is rather low it forms N2 and
evaporates when the nitrides dissolve [54].
Finally, the feasibility of vacuum annealing of X40 powder will be discussed. As the
formation of sintering necks takes place at contact points of plain metallic surfaces,
previous reduction of the oxide layer covering the powder particle surface is mandatory to
achieve a good metallic bonding between the powder particles. It was shown in this work
that the powder particles are covered by a heterogeneous oxide in the as-received state.
This leads to a weakening of the former inter-particle boundaries after HIP processing if no
previous heat treatment was performed, as previous studies showed [1, 2]. As soon as
diffusion is enabled at elevated temperatures, a progressive mass transport of strong oxide
forming elements occurs towards the powder particle surface and leads to a growth of more
stable oxides, e.g. MnCr2O4 spinels. These in turn means transformation of the iron oxide
layer and leads to a main reduction of iron after annealing for 1h at 600 °C and a complete
reduction after annealing at 700 °C. However, the oxide particulates are homogenously
distributed and cover big parts of the powder surface and thus will be enclosed inside the
sintering necks if the material would be sintered in this condition. Finally they would
remain in the sintered material and eventually weaken it. Consequently, an annealing
temperature above 700 °C, depending on the vacuum quality, is necessary to reduce the Cr-
Mn oxides as well.
The Cr-Mn and partly vanadium oxides are reduced after annealing at 900 °C which leads
to a rather clean powder surface. Vanadium rich carbides can be found on the surface, but
they are not supposed to have a negative effect. They a rather needed to improve the wear
78 4 Discussion
resistance and restrict grain growth during sintering and heat treatment of the final product.
Furthermore, they are not enriched on the surface as the XPS depth profiling showed. But
chromium and sulfur are still enriched on the powder particle surface. Sulfur is often added
to steels to improve the machinability but it is supposed to form MnS [4]. No information
about the influence of chromium sulfides on the mechanical properties of steels could be
found. Questionable is if enough manganese is left in the powder bulk to form MnS during
the processing subsequent to the vacuum annealing. However, probably the sulfide layer
forms particulates during subsequent processing steps as it has been observed for MnS [55]
and thus it has no detrimental effect on the mechanical properties. Besides the loss of Mn,
also a loss of carbon occurs, due to the carbothermal reduction forming CO / CO2. The loss
of carbon has significant effect on changes of the mechanical properties of tool steels and
has to be taken into account when performing vacuum annealing of the X40 powder.
To summarize, vacuum annealing of the X40 powder before sintering or HIP processing
seems to be feasible if the loss of carbon is considered.
5 Conclusion and future work
In this thesis the as-received surface and changes in the surface chemistry during vacuum
heat treatment of the powder metallurgical Hot Work Tool Steel X40CrMoV5-1 were
investigated.
The results show that the as-received surface is completely covered by a heterogeneous
oxide layer, composed by a homogeneous 7 nm thin iron oxide layer and particulate oxides
rich in chromium, manganese, silicon and vanadium. Larger particulates appear during
annealing mainly in the interdendritic areas, which are enriched in alloying elements due to
segregation. During vacuum annealing the powder particle surface undergoes considerable
changes. Annealing at 600 °C reduces main parts of the iron oxide layer. However, this
leads to growth of rectangular shaped, chromium-rich oxides with sizes of about 200 nm
all over the powder surface. The type of oxides changes to Cr-Mn-oxides by annealing at
700 °C. The chromium and manganese oxides can be reduced by annealing at 900 °C,
leading to an oxide free surface probably covered by a sulfide layer, which growth with
increasing annealing temperature. Vanadium oxides undergo several transformations with
increasing annealing temperature. Also a transformation to vanadium carbides is indicated
to start around 700 °C.
Based on the results obtained it can be concluded that vacuum annealing of the X40
powder before consolidation seems to be feasible to reduce surface oxides and thus
improve the metallic bonding between the powder particles during subsequent
consolidation. But loss of carbon and manganese during annealing has to be considered.
The next step to establish powder metallurgy as a way of production for Hot Work Tool
Steels is mechanical testing on consolidated material to show if the oxide reduction leads
to an improvement in the mechanical properties. For HWS toughness, impact energy and
wear resistance are the key factors for high durability. As wear resistance should not be so
much affected by previous oxide reduction, tests can focus on toughness and impact work,
i.e. tensile and notch impact tests. Subsequent fractography can give clues about fracture
behavior and information concerning presence oxide phases, their composition and
distribution on the former inter-particle boundaries.
For the vacuum annealing it has to be taken into account that the majority of industrial
furnaces have a lower vacuum level then the ultra-high vacuum applied in this work and
thus oxide reduction is shifted to higher temperatures. The loss of carbon can be
compensated by either using powder with higher carbon content or by admixing graphite
powder to the steel powder.

80 5 Conclusion and future work
Concerning the surface chemistry of the investigated steel powder, there are still some
questions open. The chemical composition of the oxide particulates could not be
conclusively determined by EDX due to their small size. These could be evaluated by
Auger Electron Spectroscopy (AES), since it has a considerably better lateral resolution
(up to 12 nm) compared to XPS and significantly smaller information volume (couple of
nanometers) compared to EDX.
The influence of sulfur on the surface chemistry could also not be clarified due to a lack of
information about the binding energies of sulfides. However, sintering experiments do not
show any influence of sulfur segregation on the sintering process and resulting mechanical
properties.
To determine the origin of the aluminum particulates after annealing at 1000 °C, two
factors have to be checked. First of all – the aluminum content in the base powder has to be
measured by chemical analysis as this data is not available for the produced powder.
Secondly, possibility of contamination of the powder by aluminum during vacuum
annealing has to be checked.
References
[1] T. Schneiders, Neue pulvermetallurgische Werkzeugstähle, Ph.D. Thesis, Ruhr-
University Bochum, 2005.
[2] F. Wendl, Einfluss der Fertigung auf Gefüge und Zähigkeit von Warmarbeitsstählen
mit 5% Chrom, Ph.D Thesis, Ruhr-University Bochum: VDI-Verlag, Volume 5,
No. 91, 1985.
[3] R. German, Powder Metallurgy Science, Princeton: Metal Powder Industries
Federation, 1994.
[4] H. Berns and W. Theisen, Ferrous Materials - Steel and Cast Iron, Springer-Verlag,
2008.
[5] R. German, Powder metallurgy and particulate materials processing: The processes,
materials, products, properties and applications, Metal Powder Industries
Federation, 2005.
[6] Deutsches Institut für Normung e.V. (DIN), ISO 4957 - Tool Steels, Beuth-Verlag,
2001.
[7] D. Broek, Elementary Engineering Fracture Mechanics, Delft University of
Technology, Netherlands: Noordhoff International Publishing, 1974.
[8] W. Schatt und K.-P. Wieters, Powder metallurgy: processing and materials,
Shrewsbury, U.K.: European Metallurgy Association, 1997.
[9] A. Weddeling, Surface Analysis of Austenitic Fe-18Cr-19Mn-C-N Powder, Bachelor
Thesis, Chalmers University of Technology, Gothenburg, Sweden, 2011.
[10] M. Hansen und K. Anderko, Constitution of bnary alloys, New-York: McGraw-Hill,
1958.
[11] W. Schatt, Sintervorgänge: Grundlagen, Düsseldorf: VDI-Verlag, 1992.
[12] D. Stöver, Pulvermetallurgie, Ruhr-University Bochum: Script, 2010.
82 References
[13] A. Weddeling, K. Zumsande, E. Hryha, S. Huth, L. Nyborg und S. Weber,
„Characterization of High-Mn-Cr Austenitic Steel Powder Fe-19Mn-18Cr-C-
N,“ EuroPM Barcelona, Proceedings, Vol. 2, pp. 15-20, 2011.
[14] K. Zumsande, A. Weddeling, E. Hryha, S. Huth, L. Nyborg, S. Weber, N. Krasokha
und W. Theisen, „Characterization of the surface of Fe-19Mn-18Cr-C-N during
heat treatment in a high vacuum - An XPS study“.
[15] P. Beiss, „Sintering atmospheres for PM steels,“ Höganäs Chair in Powder
Metallurgy, Workshop "Sintering Atmospheres", 1999.
[16] D. Gaskell, Introduction to the Thermodynamics of Materials, New York:
Taylor&Francis Group, 2008.
[17] E. Hryha, E. Dudrova und L. Nyborg, „On-line control of processing atmospheres for
proper sintering of oxidation-sensitive PM steels,“ Jounal of Materials
Processing Technology, Vol. 212, pp. 977-987, 2012.
[18] D. Chasoglou, „Effect of Sintering Atmosphere on the Transformation of Surface
Oxides during Sintering of Chromium Alloyed Steel,“ Powder Metallurgy
Progress, Vol. 9, Nr. 3, pp. 141-155, 2009.
[19] E. Hryha, C. Gierl, L. Nyborg, H. Danninger und E. Dudrova, „Surface composition
of the steel powders pre-alloyed with manganese,“ Applied Surface Science Vol.
256, Issue 12, pp. 3946-3961, 2010.
[20] E. Bayer und H. Seilstorfer, „Pulvermetallurgisch durch heißisostatisches Pressen
hergestellter Warmarbeitsstahl X40 CrMoV5 1,“ Archiv für Eisenhüttenwesen,
Vol. 55, Nr. 4, pp. 169 - 176, 1984.
[21] A. Oppenkowski, Zähigkeit von pulvermetallurgischen Werkzeugstählen und Metal
Matrix Composites, Diploma Thesis, Lehrstuhl Werkstofftechnik, Ruhr-
University Bochum, 2007.
[22] H. Berns, Hartlegierungen und Hartverbundwerkstoffe, Berlin: Springer Verlag, 1998.
[23] Deutsches Institut für Normung (DIN) e.V., DIN EN 10027-1 - Designation systems
for steels, Berlin: Beuth-Verlag, 2005.
[24] Deutsches Institut für Normung e.V. (DIN), DIN ISO 4497 - Metallpulver -
Bestimmung der Teilchengrößen durch Trockensiebung, Berlin: Beuth-Verlag,
83
1991.
[25] Deutsches Institut für Normung e.V. (DIN), DIN 66165 - Siebanalyse, Berlin: Beuth-
Verlag, 1987.
[26] J. F. Moulder, W. F. Stickle, P. E. Sobol und K. D. Bomben, Handbook of X-Ray
Photoelectron Spectroscopy, Minnesota: Perkin-Elmer Corporation, 1992.
[27] J. F. Watts und J. Wolstenholme, An introduction to surface analysis in XPS and AES,
Chichester: J. Wiley, 2003.
[28] A. Klein, Grundlagen der Röntgenphotoelektronenspektroskopie, Leibnitz Universität
Hannover: Script, 2008.
[29] L. Reimer, Scanning Electron Microscopy: Physics of Image Formation and
Microanalysis, Berlin: Springer-Verlag, 1998.
[30] J. I. Goldstein, Scanning electron microscopy and x-ray microanalysis: a text for
biologists, materials scientists, and geologists, New York: Plenum Press, 1992.
[31] M. E. Brown, Handbook of Thermal Analysis and Calorimetry - Volume 1: Principles
and Practice, Amsterdam: Elsevier Science B.V., 1998.
[32] N. Krasokha, Einfluss der Sinteratmosphäre auf das Verdichtungsverhalten
hochlegierte PM-Stähle, Ph.D Thesis, Ruhr-University Bochum, 2012.
[33] J.-C. Zhao, Methods for Phase Diagram Determination, Elsevier Science, 2007.
[34] H. L. Lukas, S. G. Fries und B. Sundman, Computational Thermodynamics: The
Calphad Method, New York: Cambridge University Press, 2007.
[35] N. Saunders und A. P. Miodownik, CALPHAD (Calculation of Phase Diagrams): A
Comprehensive Guide, Oxford and New York: Pergamon, 1998.
[36] S. Pingfang und B. Sundman, TCC Thermo-Calc Software User's Guide Version 3.0,
Thermo-Calc Software AB.
[37] Thermo-Calc Software AB: TCFE6 - TCS Steels/Fe-Alloys Database, Version 6.2.
[38] E. Hryha, E. Rutquist und L. Nyborg, „Stoichiometric vanadium oxides studied by
XPS,“ Surface and Interface Analysis, Vol. 44, pp. 1022-1025, 2012.
84 References
[39] L. Nyborg, A. Nylund und I. Olefjord, „Thickness Determination of Oxide Layers on
Spherically-shaped Metal Powders by ESCA,“ Surface and Interface Analysis,
Vol. 12, pp. 110-114, 1988.
[40] R. Nyholm und N. Mårtensson, „Core level binding energies for the elements Zr-Te (
Z= 40-52),“ Journal of Physics C: Solid State Physics, Vol. 13, pp. 279-284,
1980.
[41] M. Antonik, R. Lad und T. Christensen, „Clean Surface and Oxidation Behavior of
Vanadium Carbide, VC0.75(100),“ Surface and Interface Analysis, pp. 681-686,
1996.
[42] H. Danninger, X. Chen und B. Lindquist, „Oxygen Removal during Sintering of
Steels Prepared from Cr-Mo and Mo Prealloyed Steels,“ Materials Science
Forum, Vols. 534-536, pp. 577-580, 2007.
[43] H. Danninger, C. Gierl, S. Kremel, G. Leitner, K. Jaenicke-Roessler und Y. Yu,
„Degassing and Deoxidation Processing during Sintering of unalloyed and
alloyed PM Steels,“ Powder Metallurgy Progress, Vol. 2, No. 3, pp. 125-140,
2002.
[44] B. R. Strohmeier und D. M. Hercules, „Surface Spectroscopic Characterization of
Mn/Al2O3 Catalysts,“ Journal of Physical Chemie, Vol. 88, pp. 4922-4929,
1984.
[45] R. Oro, M. Campos, E. Hryha, L. Nyborg und J. Torralba, „Surface Analysis at
Different Sintering Stages of Steel Compacts with Mn and Si,“ European
Powder Metallurgy Association, editor. Proceeding of EuroPM 2011 Congress
& Exhibition, Vol. 1, pp. 113-118, 2011.
[46] G. Alleen, S. Harris und J. Jutson, „A Study of a Number of mixed Transition Metal
Oxide Spinels using X-Ray Photoelectron Spectroscopy,“ Applied Surface
Science, Vol. 37, pp. 111-134, 1989.
[47] D. Gozzi, M. Montozzi und P. Cignini, „Oxidation kinetics of refractory carbides at
low oxygen partial pressures,“ Solid State Ionics, Vol 123, Elsevier, pp. 11-18,
1999.
[48] M. Detroye, F. Reniers, C. Buess-Hermann und J. Vereecken, „AES–XPS study of
chromium carbides and chromium iron carbides,“ Applied Surface Science,
85
Vols. 144-145, pp. 78-82, 1999.
[49] T. Albayram, „Einfluss der Stickstoffatmosphäre auf das Verdichtungsverhalten von
hochlegierten PM-Stählen,“ Bachelor Thesis, Lehrstuhl Werkstofftechnik, Ruhr-
University Bochum, 2012.
[50] M. Gras, „Untersuchung des Einflusses der Pulverkorngröße auf die Phasenverteilung
gasverdüster Pulver mit Synchrotron-Strahlung,“ Semesterarbeit, Lehrstuhl
Werkstofftechnik, Ruhr-University Bochum, 2012.
[51] G. E. McGuire, G. K. Schweitzer und T. A. Carlson, „Stud of Core Electron Binding
Energies in Some Group IIIa, Vb, and VIb Compounds,“ Inorganic Chemistry,
Vol. 12, No. 10, pp. 2450 - 2453, 1973.
[52] E. Agostinell, C. Battistoni, D. Fiorani, G. Mattogno und M. Nogues, „An XPS Study
of the electronic Structure of the Zn(x)Cd(1-x)Cr2X4 (X=S,Se) Spinel System,“
Journal of Physics and Chemistry of Solids, Vol. 50, No. 3, pp. 269-272, 1989.
[53] A. V. Naumkin, A. Kraut-Vass, S. W. Gaarenstroom und C. J. Powell, „NIST X-ray
Photoelectron Spetroscopy Database - Database 20, Version 4.1,“ 23 05 2013.
[Online]. Available: http://srdata.nist.gov/xps/.
[54] V. G. Gavriljuk und H. Berns, „High Nitrogen Steels - Structure, Properties,
Manufacture, Applications,“ Springer Verlag, 1999.
[55] E. Hryha, E. Dudrova und L. Nyborg, „Critical Aspects of Alloying of Sintered Steels
with Manganese,“ Metallurgical and Materials Transactions A, Vol 41A, pp.
2880-2897, 2010.
[56] D. Chasoglou, „Surface Interactions During Sintering of Chromium-alloyed PM
Steels in Different Atmospheres,“ Proceeding of World PM 2010: Powder
Metallurgy World Congress & Exhibition 2010, pp. 3-12, 2010.
[57] X.-R. Yu, F. Liu, Z.-Y. Wang und Y. Chen, „Auger Parameters for Sulfur-containing
Compounds usind a mixed Aluminum-Silver Excitation Source,“ Journal of
Electron Spectroscopy and Related Phenomena, Vol. 50, pp. 159-166, 1990.
[58] K.-H. Schwalbe, „On the influence of Microstructure on Crack Propagation
Mechanisms and Fracture Toughness of metallic materials,“ Engineering
Fracture Mechanics, Vol. 9, pp. 795-832, 1977.
86 References
[59] H. Karlsson, L. Nyborg und O. Bergman, „Surface Interactions during Sintering of
Wateratomised Pre-alloyed Steel Powder,“ Euro PM2004 - Sintered Steels, pp.
23-28, 2004.
[60] H. Karlsson, L. Nyborg und S. Berg, „Surface chemical analysis of prealloyed water
atomised steel powder, Vol. 48,“ Powder Metallurgy, pp. 51-58, 2005.
[61] D. Chasoglou, Surface Chemical Characteristics of Chromium-alloyed Steel Powder
and the Role of Process Parameters during Sintering, Ph.D. Thesis, Chalmers
University of Technology, Gothenburg, Sweden, 2012.
[62] C. Powell, „Recommended Auger parameters for 42 elemental solids,“ Journal of
Electron Spectroscopy and Related Phenomena, Vol. 185, Nr. 1, pp. 1-3, 2012.
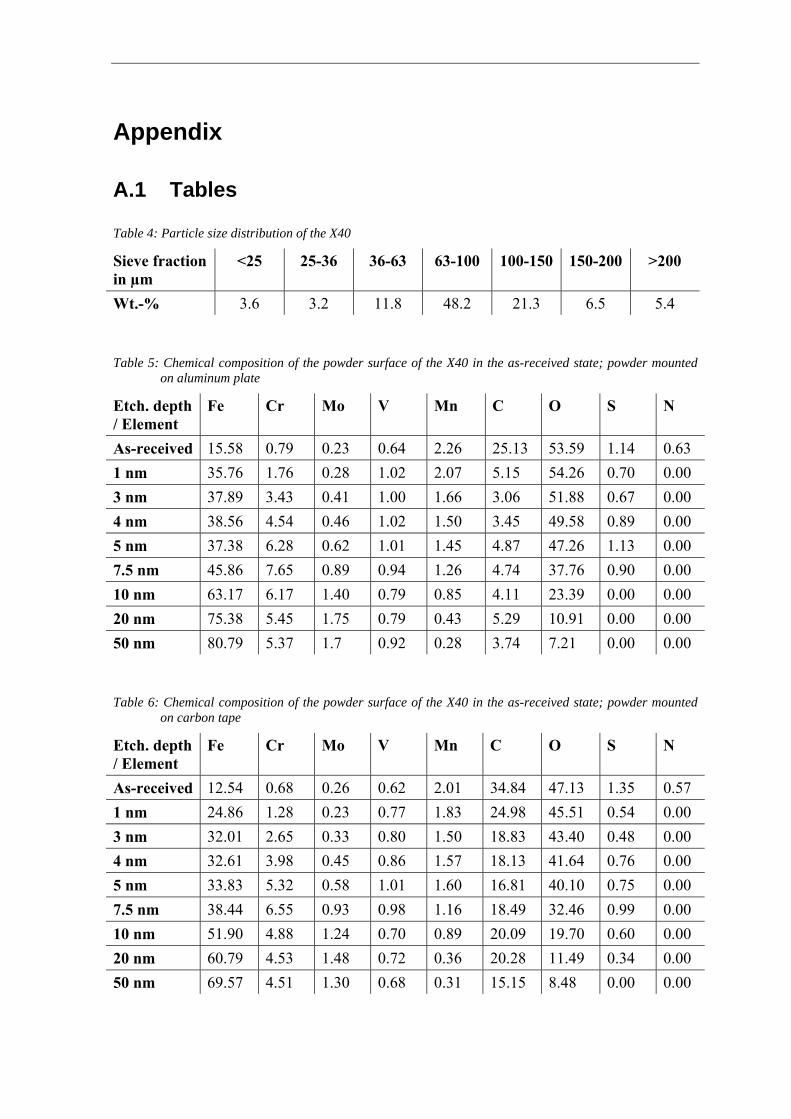
Appendix
A.1 Tables
Table 4: Particle size distribution of the X40
Sieve fraction in µm
<25 25-36 36-63 63-100 100-150 150-200 >200
Wt.-% 3.6 3.2 11.8 48.2 21.3 6.5 5.4
Table 5: Chemical composition of the powder surface of the X40 in the as-received state; powder mounted on aluminum plate
Etch. depth / Element
Fe Cr Mo V Mn C O S N
As-received 15.58 0.79 0.23 0.64 2.26 25.13 53.59 1.14 0.63
1 nm 35.76 1.76 0.28 1.02 2.07 5.15 54.26 0.70 0.00
3 nm 37.89 3.43 0.41 1.00 1.66 3.06 51.88 0.67 0.00
4 nm 38.56 4.54 0.46 1.02 1.50 3.45 49.58 0.89 0.00
5 nm 37.38 6.28 0.62 1.01 1.45 4.87 47.26 1.13 0.00
7.5 nm 45.86 7.65 0.89 0.94 1.26 4.74 37.76 0.90 0.00
10 nm 63.17 6.17 1.40 0.79 0.85 4.11 23.39 0.00 0.00
20 nm 75.38 5.45 1.75 0.79 0.43 5.29 10.91 0.00 0.00
50 nm 80.79 5.37 1.7 0.92 0.28 3.74 7.21 0.00 0.00
Table 6: Chemical composition of the powder surface of the X40 in the as-received state; powder mounted on carbon tape
Etch. depth / Element
Fe Cr Mo V Mn C O S N
As-received 12.54 0.68 0.26 0.62 2.01 34.84 47.13 1.35 0.57
1 nm 24.86 1.28 0.23 0.77 1.83 24.98 45.51 0.54 0.00
3 nm 32.01 2.65 0.33 0.80 1.50 18.83 43.40 0.48 0.00
4 nm 32.61 3.98 0.45 0.86 1.57 18.13 41.64 0.76 0.00
5 nm 33.83 5.32 0.58 1.01 1.60 16.81 40.10 0.75 0.00
7.5 nm 38.44 6.55 0.93 0.98 1.16 18.49 32.46 0.99 0.00
10 nm 51.90 4.88 1.24 0.70 0.89 20.09 19.70 0.60 0.00
20 nm 60.79 4.53 1.48 0.72 0.36 20.28 11.49 0.34 0.00
50 nm 69.57 4.51 1.30 0.68 0.31 15.15 8.48 0.00 0.00
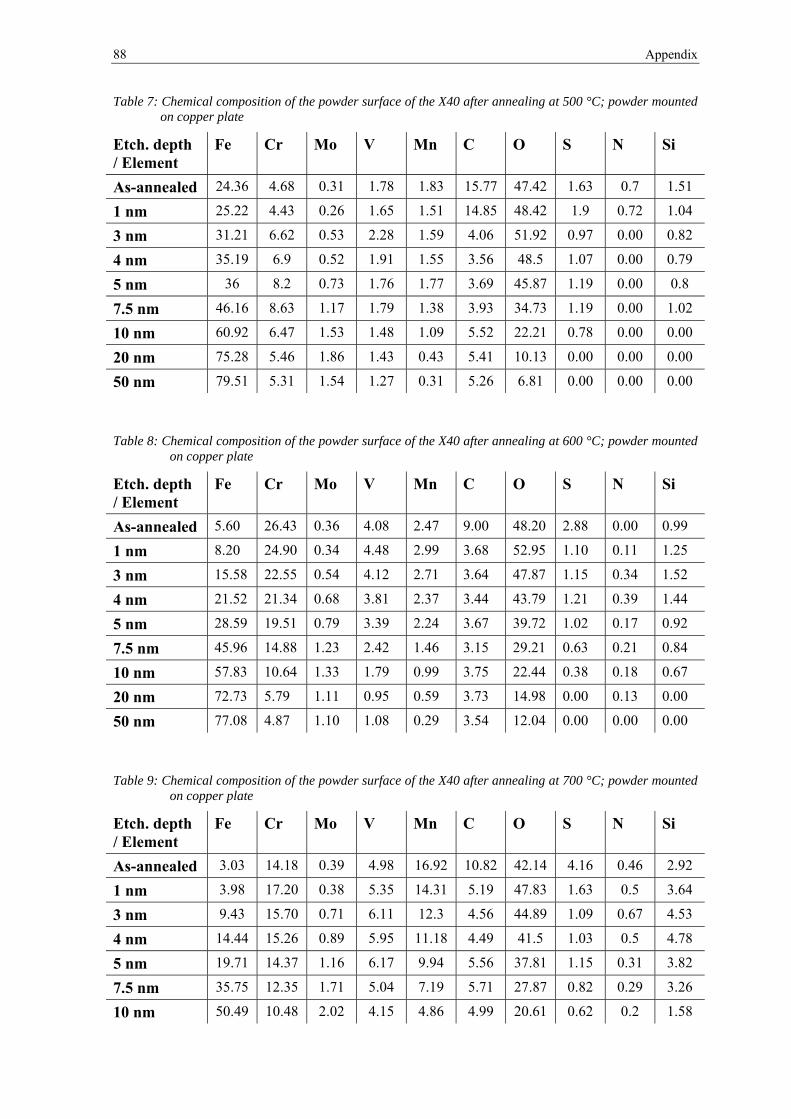
88 Appendix
Table 7: Chemical composition of the powder surface of the X40 after annealing at 500 °C; powder mounted on copper plate
Etch. depth / Element
Fe Cr Mo V Mn C O S N Si
As-annealed 24.36 4.68 0.31 1.78 1.83 15.77 47.42 1.63 0.7 1.51
1 nm 25.22 4.43 0.26 1.65 1.51 14.85 48.42 1.9 0.72 1.04
3 nm 31.21 6.62 0.53 2.28 1.59 4.06 51.92 0.97 0.00 0.82
4 nm 35.19 6.9 0.52 1.91 1.55 3.56 48.5 1.07 0.00 0.79
5 nm 36 8.2 0.73 1.76 1.77 3.69 45.87 1.19 0.00 0.8
7.5 nm 46.16 8.63 1.17 1.79 1.38 3.93 34.73 1.19 0.00 1.02
10 nm 60.92 6.47 1.53 1.48 1.09 5.52 22.21 0.78 0.00 0.00
20 nm 75.28 5.46 1.86 1.43 0.43 5.41 10.13 0.00 0.00 0.00
50 nm 79.51 5.31 1.54 1.27 0.31 5.26 6.81 0.00 0.00 0.00
Table 8: Chemical composition of the powder surface of the X40 after annealing at 600 °C; powder mounted on copper plate
Etch. depth / Element
Fe Cr Mo V Mn C O S N Si
As-annealed 5.60 26.43 0.36 4.08 2.47 9.00 48.20 2.88 0.00 0.99
1 nm 8.20 24.90 0.34 4.48 2.99 3.68 52.95 1.10 0.11 1.25
3 nm 15.58 22.55 0.54 4.12 2.71 3.64 47.87 1.15 0.34 1.52
4 nm 21.52 21.34 0.68 3.81 2.37 3.44 43.79 1.21 0.39 1.44
5 nm 28.59 19.51 0.79 3.39 2.24 3.67 39.72 1.02 0.17 0.92
7.5 nm 45.96 14.88 1.23 2.42 1.46 3.15 29.21 0.63 0.21 0.84
10 nm 57.83 10.64 1.33 1.79 0.99 3.75 22.44 0.38 0.18 0.67
20 nm 72.73 5.79 1.11 0.95 0.59 3.73 14.98 0.00 0.13 0.00
50 nm 77.08 4.87 1.10 1.08 0.29 3.54 12.04 0.00 0.00 0.00
Table 9: Chemical composition of the powder surface of the X40 after annealing at 700 °C; powder mounted on copper plate
Etch. depth / Element
Fe Cr Mo V Mn C O S N Si
As-annealed 3.03 14.18 0.39 4.98 16.92 10.82 42.14 4.16 0.46 2.92
1 nm 3.98 17.20 0.38 5.35 14.31 5.19 47.83 1.63 0.5 3.64
3 nm 9.43 15.70 0.71 6.11 12.3 4.56 44.89 1.09 0.67 4.53
4 nm 14.44 15.26 0.89 5.95 11.18 4.49 41.5 1.03 0.5 4.78
5 nm 19.71 14.37 1.16 6.17 9.94 5.56 37.81 1.15 0.31 3.82
7.5 nm 35.75 12.35 1.71 5.04 7.19 5.71 27.87 0.82 0.29 3.26
10 nm 50.49 10.48 2.02 4.15 4.86 4.99 20.61 0.62 0.2 1.58
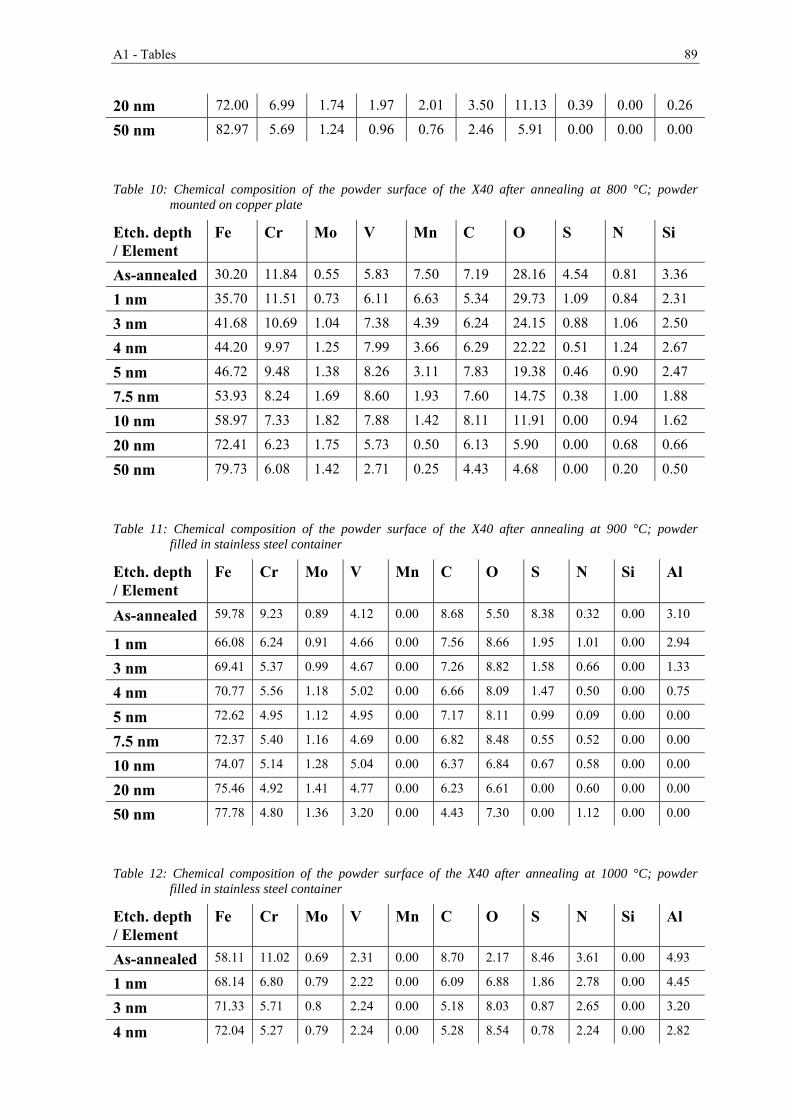
A1 - Tables 89
20 nm 72.00 6.99 1.74 1.97 2.01 3.50 11.13 0.39 0.00 0.26
50 nm 82.97 5.69 1.24 0.96 0.76 2.46 5.91 0.00 0.00 0.00
Table 10: Chemical composition of the powder surface of the X40 after annealing at 800 °C; powder mounted on copper plate
Etch. depth / Element
Fe Cr Mo V Mn C O S N Si
As-annealed 30.20 11.84 0.55 5.83 7.50 7.19 28.16 4.54 0.81 3.36
1 nm 35.70 11.51 0.73 6.11 6.63 5.34 29.73 1.09 0.84 2.31
3 nm 41.68 10.69 1.04 7.38 4.39 6.24 24.15 0.88 1.06 2.50
4 nm 44.20 9.97 1.25 7.99 3.66 6.29 22.22 0.51 1.24 2.67
5 nm 46.72 9.48 1.38 8.26 3.11 7.83 19.38 0.46 0.90 2.47
7.5 nm 53.93 8.24 1.69 8.60 1.93 7.60 14.75 0.38 1.00 1.88
10 nm 58.97 7.33 1.82 7.88 1.42 8.11 11.91 0.00 0.94 1.62
20 nm 72.41 6.23 1.75 5.73 0.50 6.13 5.90 0.00 0.68 0.66
50 nm 79.73 6.08 1.42 2.71 0.25 4.43 4.68 0.00 0.20 0.50
Table 11: Chemical composition of the powder surface of the X40 after annealing at 900 °C; powder filled in stainless steel container
Etch. depth / Element
Fe Cr Mo V Mn C O S N Si Al
As-annealed 59.78 9.23 0.89 4.12 0.00 8.68 5.50 8.38 0.32 0.00 3.10
1 nm 66.08 6.24 0.91 4.66 0.00 7.56 8.66 1.95 1.01 0.00 2.94
3 nm 69.41 5.37 0.99 4.67 0.00 7.26 8.82 1.58 0.66 0.00 1.33
4 nm 70.77 5.56 1.18 5.02 0.00 6.66 8.09 1.47 0.50 0.00 0.75
5 nm 72.62 4.95 1.12 4.95 0.00 7.17 8.11 0.99 0.09 0.00 0.00
7.5 nm 72.37 5.40 1.16 4.69 0.00 6.82 8.48 0.55 0.52 0.00 0.00
10 nm 74.07 5.14 1.28 5.04 0.00 6.37 6.84 0.67 0.58 0.00 0.00
20 nm 75.46 4.92 1.41 4.77 0.00 6.23 6.61 0.00 0.60 0.00 0.00
50 nm 77.78 4.80 1.36 3.20 0.00 4.43 7.30 0.00 1.12 0.00 0.00
Table 12: Chemical composition of the powder surface of the X40 after annealing at 1000 °C; powder filled in stainless steel container
Etch. depth / Element
Fe Cr Mo V Mn C O S N Si Al
As-annealed 58.11 11.02 0.69 2.31 0.00 8.70 2.17 8.46 3.61 0.00 4.93
1 nm 68.14 6.80 0.79 2.22 0.00 6.09 6.88 1.86 2.78 0.00 4.45
3 nm 71.33 5.71 0.8 2.24 0.00 5.18 8.03 0.87 2.65 0.00 3.20
4 nm 72.04 5.27 0.79 2.24 0.00 5.28 8.54 0.78 2.24 0.00 2.82
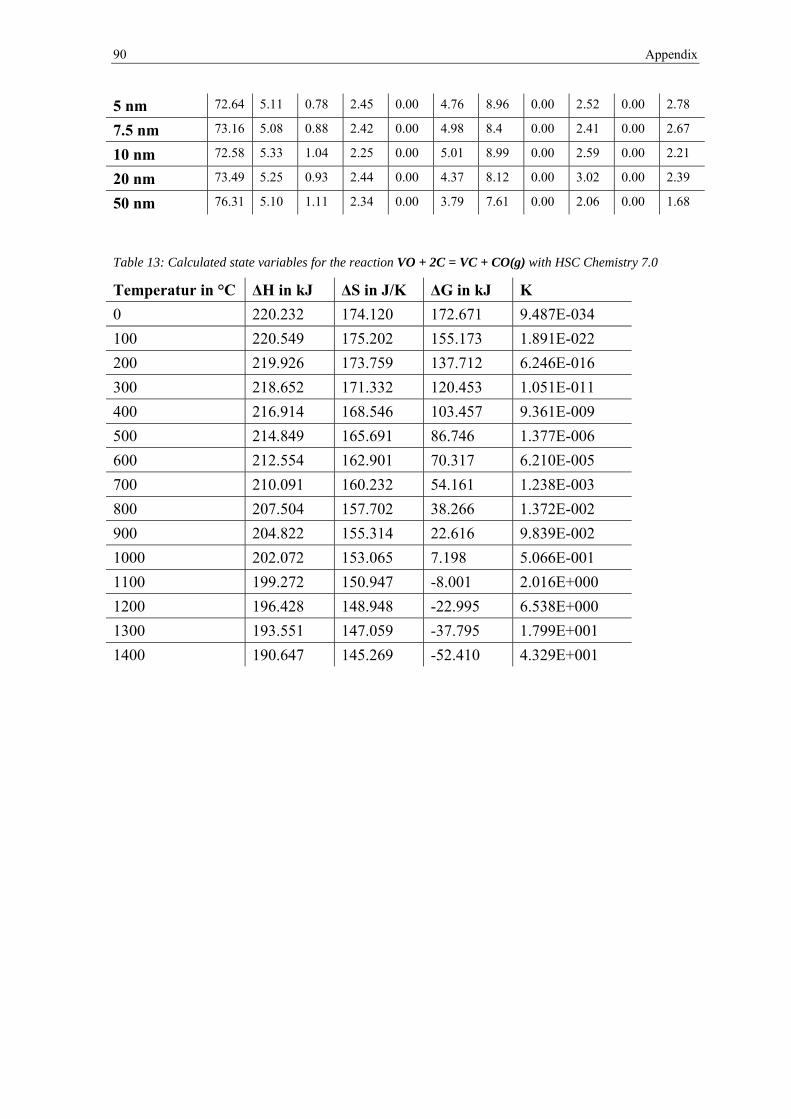
90 Appendix
5 nm 72.64 5.11 0.78 2.45 0.00 4.76 8.96 0.00 2.52 0.00 2.78
7.5 nm 73.16 5.08 0.88 2.42 0.00 4.98 8.4 0.00 2.41 0.00 2.67
10 nm 72.58 5.33 1.04 2.25 0.00 5.01 8.99 0.00 2.59 0.00 2.21
20 nm 73.49 5.25 0.93 2.44 0.00 4.37 8.12 0.00 3.02 0.00 2.39
50 nm 76.31 5.10 1.11 2.34 0.00 3.79 7.61 0.00 2.06 0.00 1.68
Table 13: Calculated state variables for the reaction VO + 2C = VC + CO(g) with HSC Chemistry 7.0
Temperatur in °C ΔH in kJ ΔS in J/K ΔG in kJ K
0 220.232 174.120 172.671 9.487E-034
100 220.549 175.202 155.173 1.891E-022
200 219.926 173.759 137.712 6.246E-016
300 218.652 171.332 120.453 1.051E-011
400 216.914 168.546 103.457 9.361E-009
500 214.849 165.691 86.746 1.377E-006
600 212.554 162.901 70.317 6.210E-005
700 210.091 160.232 54.161 1.238E-003
800 207.504 157.702 38.266 1.372E-002
900 204.822 155.314 22.616 9.839E-002
1000 202.072 153.065 7.198 5.066E-001
1100 199.272 150.947 -8.001 2.016E+000
1200 196.428 148.948 -22.995 6.538E+000
1300 193.551 147.059 -37.795 1.799E+001
1400 190.647 145.269 -52.410 4.329E+001
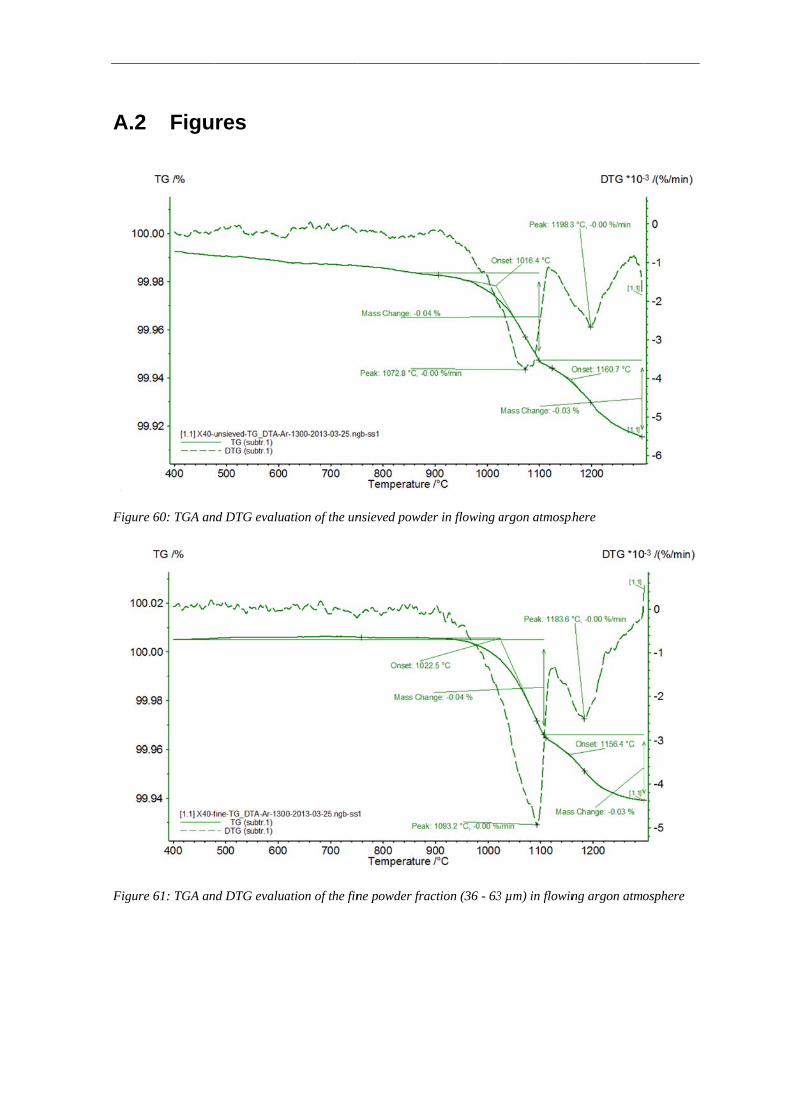
A.2
Figur
Figur
2 Figu
re 60: TGA an
re 61: TGA an
res
nd DTG evalua
nd DTG evalua
ation of the un
ation of the fin
nsieved powde
ne powder fra
er in flowing a
action (36 - 63
argon atmosph
3 µm) in flowin
here
ng argon atmo
osphere
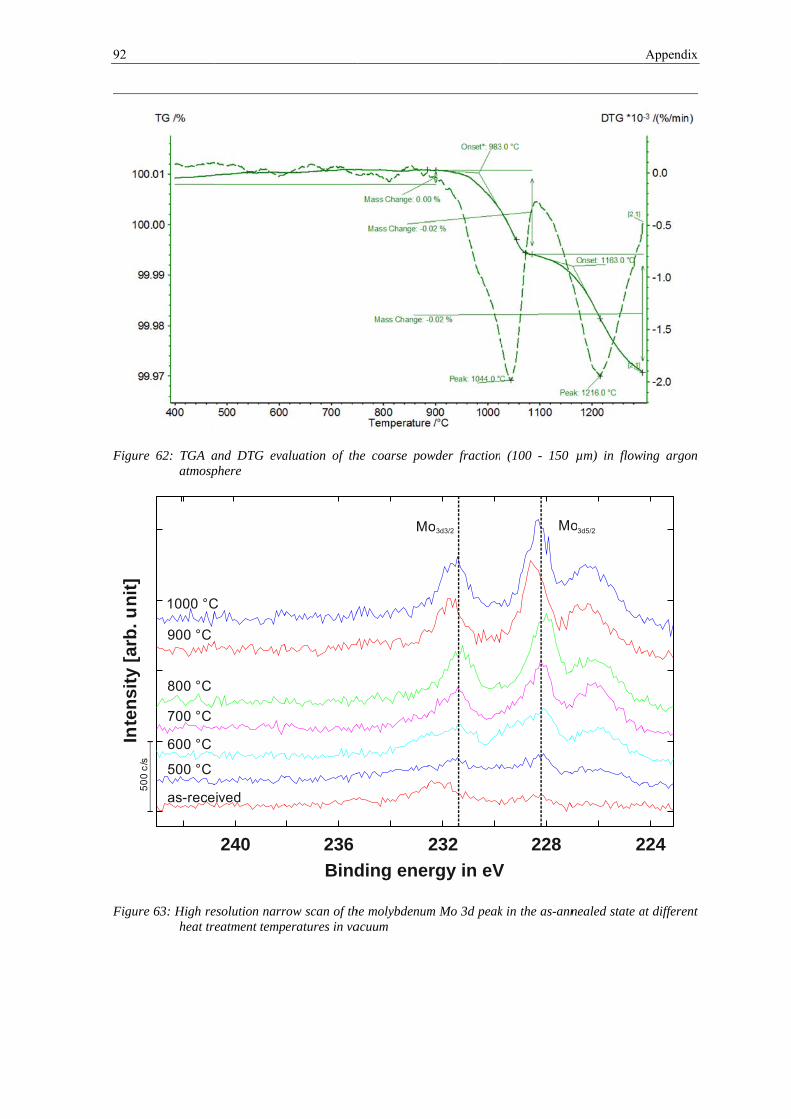
92
Figur
Figur
Inte
nsi
ty [
arb
. un
it]
50
0c
/s
re 62: TGA aatmosp
re 63: High re heat tr
1000 °C
900 °C
800 °C
700 °C
600 °C
500 °C
as-rece
50
0 c
/s
and DTG evaphere
esolution narrreatment temp
C
eived
240
aluation of th
row scan of theratures in va
Bind
236
he coarse pow
he molybdenumacuum
ding ene
2
Mo
wder fraction
m Mo 3d peak
rgy in eV
232
o3d3/2
(100 - 150
k in the as-ann
V
228
Mo
µm) in flow
nealed state a
2
o3d5/2
Appendix
ing argon
at different
224
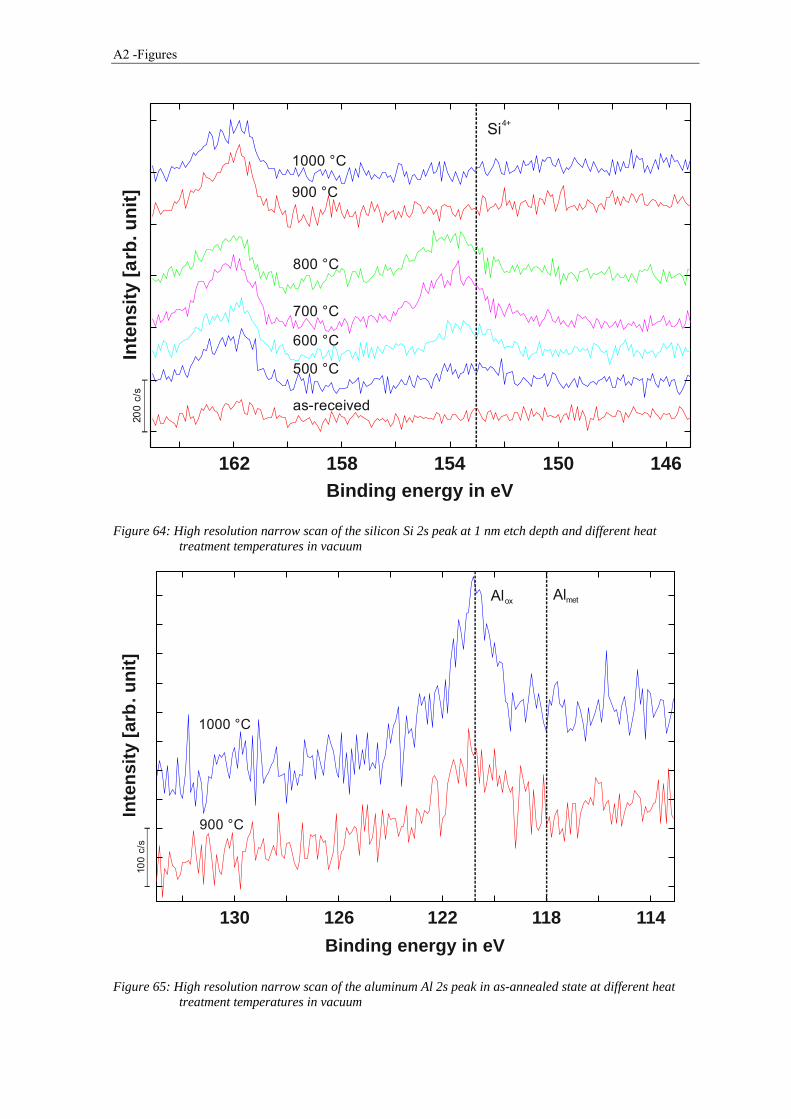
A2 -Figures
Figure 64: High resolution narrow scan of the silicon Si 2s peak at 1 nm etch depth and different heat treatment temperatures in vacuum
Figure 65: High resolution narrow scan of the aluminum Al 2s peak in as-annealed state at different heat treatment temperatures in vacuum
Binding energy in eV
Inte
nsi
ty [
arb
. un
it]
1000 °C
900 °C
800 °C
700 °C
600 °C
500 °C
as-received
146150154158162
200
c/s
Si4+
Binding energy in eV
1000 °C
900 °C
114
100
c/s
Inte
nsi
ty [
arb
. un
it]
118122126130
AlmetAlox
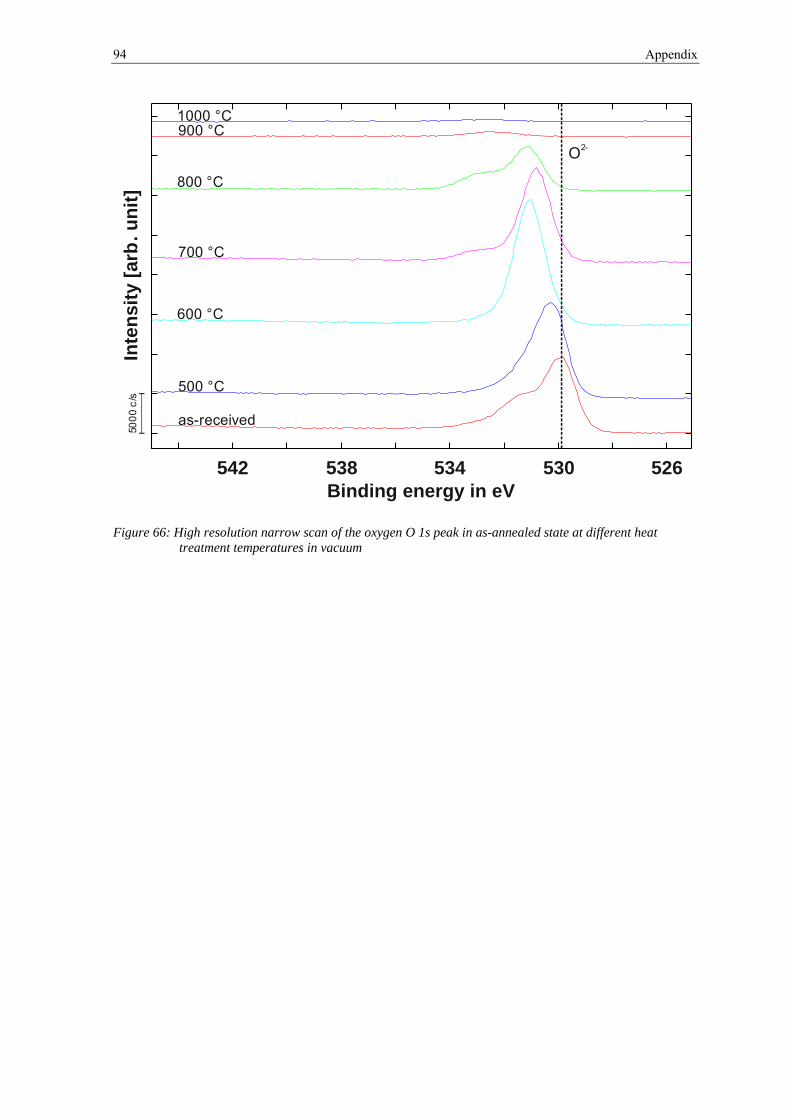
94 Appendix
Figure 66: High resolution narrow scan of the oxygen O 1s peak in as-annealed state at different heat treatment temperatures in vacuum
Binding energy in eV
Inte
nsi
ty [
arb
. un
it]
526
500
0 c
/s1000 °C900 °C
800 °C
700 °C
600 °C
500 °C
as-received
530534538542
O2-