transforming naval aviation maintenance for the …
TRANSCRIPT

RDML(S) Michael HardeeCOMMANDER
NAVAL AVIATION DEPOTS
25 October 2005
TRANSFORMING NAVAL AVIATIONMAINTENANCE FOR THE 21ST CENTURY

10/31/2005 5:00 PMAIR 6.0Depot Airspeed vr9.PPT 2
OUTLINE
• WHERE WE’VE BEEN – DEPLOYED READINESS FOCUS
• WHERE WE ARE:– ENTERPRISE MANAGEMENT– COST-WISE READINESS– READY FOR TASKING AIRCRAFT– TMS FOCUS– AIRSpeed
(ie. LEAN, SIX SIGMA, TOC)– PBL / PPP
• WHERE WE ARE HEADED:– PBL / PPP– FLEET READINESS CENTERS

10/31/2005 5:00 PMAIR 6.0Depot Airspeed vr9.PPT 3
•TURN-AROUND-TIME– RFT– WIP
•RELIABILITY•COST
Metrics
NAVAL AVIATION ENTERPRISE
CFFC / CNAF
FLEET
N78 / N43 / HQMCNAVAIR / PEOsNAVSUP,
DLA, NPDC,NAVSEA, SPAWAR
REQUIREMENTS/RISKS
REQUIREMENTS/RISKS
PROVIDERSPROVIDERS RESOURCESRESOURCES
RIGHT FORCE . . .RIGHT READINESS . . .
RIGHT COST . . .
Current Readiness
Future Readiness

10/31/2005 5:00 PMAIR 6.0Depot Airspeed vr9.PPT 4
Acquisition&
Life Cycle SupportLeader:
RDML Venlet
Readiness Standards &
PolicyLeader:
Flag Officer to be named
NAVRIIP Readiness Cross Functional TeamTeam Leader: RADM Starling, CNAL
Maintenance & Supply Chain
ManagementLeader:
RDML Roesner / RDML Williams
Naval Aviation EnterpriseNAVRIIP CFT
NAVRIIP Steering Committee
• Linkage• Alignment
• RFT achievement• Performance gap closure• FHP cost drivers &
cost initiatives• Enterprise AIRSpeed• Provider metrics
management• FHP Cost Initiative mgmt
• Resource Prioritization• TMS Team Husbandry• Policy• M-Rating achievement• Metrics management &
automation• Requirements mgmt
(M-ratings, RFT)• Cost Standards - Earned value• Productive ratios
• Acquisition metrics development and management
• Product Enterprise Team architecture and implementation
• Acquisition cost drivers and cost initiatives
• Productive Ratios
TMS Teams Drive Focus on RFT, M Rating, Cost
10/31/2005 5:00 PMAIR 6.0Depot Airspeed vr9.PPT 5
Total Cost
500 M
1,000 M
1,500 M
2,000 M
2,500 M
Oct Nov Dec Jan Feb Mar Apr May Jun Jul Aug Sep0.85
0.90
0.95
1.00
1.05
1.10
1.15
1.20
ACTUALPLANEarned ValueSPICPI
AVDLR Cost
200.0 M
400.0 M
600.0 M
800.0 M
1,000.0 M
1,200.0 M
Oct
Nov
Dec Jan
Feb
Mar
Apr
May Jun
Jul
Aug
Sep
ACTUALPLAN
Flying Hours
0.0 K
50.0 K
100.0 K
150.0 K
200.0 K
250.0 K
300.0 K
350.0 K
400.0 K
450.0 K
500.0 K
Oct Nov Dec Jan Feb Mar Apr May Jun Jul Aug Sep
ACTUALOPS F/Hrs
Fuel Cost
100 M
200 M
300 M
400 M
500 M
600 M
ACTUALPLAN
AFM Cost
50.0 M
100.0 M
150.0 M
200.0 M
250.0 M
300.0 M
350.0 M
400.0 M
450.0 M
ACTUALPLAN
SQDN AFM
0 K
2,000 K
4,000 K
6,000 K
8,000 K
10,000 K
12,000 K
14,000 K
16,000 KO
ctN
ovD
ec Jan
Feb
Mar
Apr
May Jun
Jul
Aug
Sep
JCN
No JCN AIMD AFM
0 K
2,000 K
4,000 K
6,000 K
8,000 K
10,000 K
12,000 K
14,000 K
16,000 KJCN
No JCN
Performance Variances
-40.0 M
-20.0 M
0.0 M
20.0 M
40.0 M
60.0 M
80.0 M
100.0 M
120.0 M
140.0 M
M ar Apr M ay
Cost Variance
Schedule Variance
CPH
0.0 K
0.5 K
1.0 K
1.5 K
2.0 K
2.5 K
3.0 K
3.5 K
4.0 K
4.5 K
5.0 K
Oct
Nov
Dec Jan
Feb
Mar
Apr
May Jun
Jul
Aug
Sep
FYTD
Targ
et
AVDLRAFMFuelPlan
Overhead Costs
0 K
5,000 K
10,000 K
15,000 K
20,000 K
25,000 K
Oct
Nov
Dec Jan
Feb
Mar
Apr
May Jun
Jul
Aug
Sep
AFMAVDLRPLAN
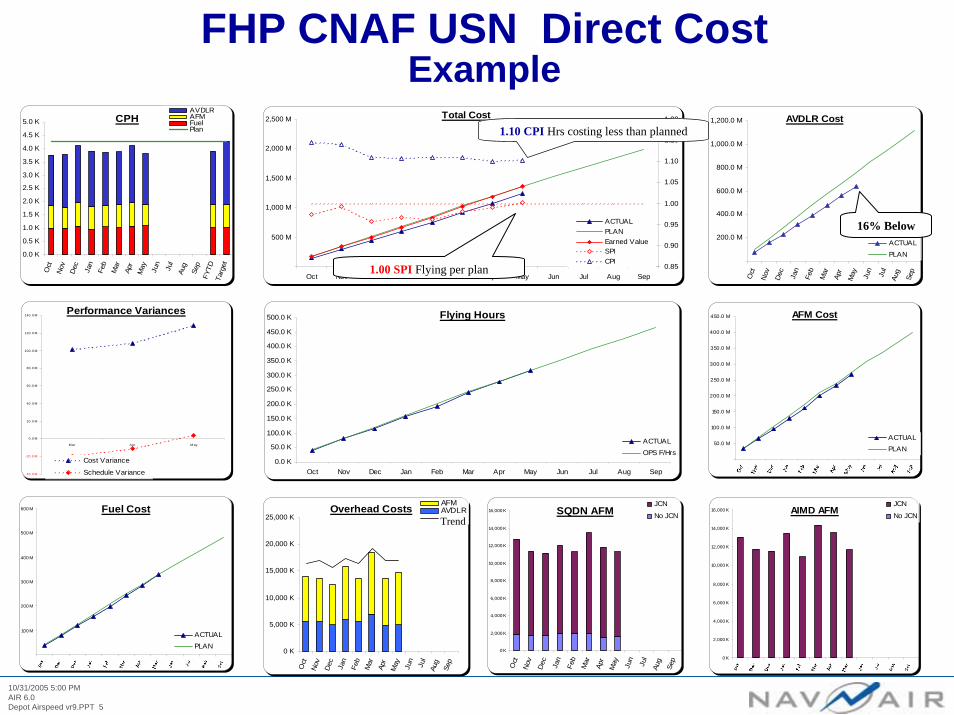
FHP CNAF USN Direct Cost Example
1.10 CPI Hrs costing less than planned
1.00 SPI Flying per plan
16% Below
Trend

10/31/2005 5:00 PMAIR 6.0Depot Airspeed vr9.PPT 6
NAVRIIP “Big Four”ROLLUP
FLYING HOURS PROGRAMCOST PERFORMANCE
READINESS
CPI = EARNED VALUE / ACTUAL TOTAL COST
-115
-65
-15
35
85
135
185
J F M A M J J A S O N D J F M A M J J
Squ
adro
ns
In Limits 20% 30%
RFT AVAILABILITY GAPRFT AVAILABILITY GAP
-13.20.00.00.00.0-0.2-0.3 -0.4
-6.6
-3.5-8.0
-5.8-8.6-4.2-3.5-2.0
-3.2
-16.0-32.4
-112.8
-60%
-50%
-40%
-30%
-20%
-10%
0%
All N
avy
P-3
EA-6
B
T-39
MH
-53E
F-14 E-2
SH
-60B
H-6
0F/H
TH-5
7
MH
-60S
T-45
F/A
-18
C-2 S-3
T-44 T-2
T-6
TC-1
2
T-34
RFT
Gap
(%)
-120.00
-100.00
-80.00
-60.00
-40.00
-20.00
0.00
RFT
Gap
(# o
f A/C
)
6 Mo Avg (%) 3 Mo Avg (%) Jun 05 (%) 6 Mo Avg (#) 3 Mo Avg (#) Jun 05 (#)

10/31/2005 5:00 PMAIR 6.0Depot Airspeed vr9.PPT 7
1186,800+162177F402RR408A Repair Conversion
Minimized Increases
PendingAIRSpeedLean Events –on-going
+ 1200146H-53
22,120-637T58GS16A
3579,600+2049AH-1W PMI 1
No increase
Pending AIRSpeed Lean Events –on-going
+371935H-46
Reduction in Depot WIP-Assets available to Fleet
Workforce Size (Decrease)
Decreased Travel Distance(feet)
WLS Change(hours)
Reduction in TAT – Avg.(days)
Platform/ Engine
11
OIF
6
16
14
Cherry Point Continuous ImprovementAIRSpeed

10/31/2005 5:00 PMAIR 6.0Depot Airspeed vr9.PPT 8
North Island AIRspeed
Deployment
• Components: Pre-LEAN Post-LEAN
(TAT Days) (TAT Days)– Dynamic
Components 89 49
– F-18 Displays (Kaiser PBL) 109 39
– Surfaces/Canopies 73 53
• F/A-18 PMI 1–Avg. Cycle time from 190 days - 140 days–WIP reduced by 12 A/C–Results achieved despite work content growth from
6453 hours to 8335 hours
• CH-53–376 Days TAT to 318 days–Current target: <260 days
• E-2–PMI 2 TAT reduced from 225 days to 180 days–PMI 1 TAT reduced from 100 days to 35 days
• C-2–PMI 3 SLEP TAT reduced from 400 days to 300 days–$1.8M Savings to NAE in reduced execution hours
on E-2 PMI 1 and PMI 2 events vs. FY06 funded workload
Single Piece Flow and Synchronized Pull System Based on Fleet Flight-line
Requirements
AIRSpeed CLOSES SOME OF THE READINESS GAP

10/31/2005 5:00 PMAIR 6.0Depot Airspeed vr9.PPT 9
Jacksonville AIRSpeed Value Delivered
• EA-6BWork in Process (WIP) Reduced from 17 Aircraft to 9
• WIP reduction returned 2 Squadrons to the FleetAircraft Returned to Fleet Faster (FY04 vice FY05)
• Reduced Cycle Time from 463 Days to 380 Days• Increased On-time Deliveries from 31 percent to 83 percent
• P-3Reduced TAT by 24 Days (225 Days to 201 Days)Improved Stability / Reduced Variability by over 40 Days
(79 Std Dev to 69 Std Dev)Sold 22 Aircraft vs. 19 Aircraft in FY04Reduced WIP by 5 Aircraft (from 17 to 12)
• EnginesF414 Turn-Around-Time Reduced from 65 to 32 Days
• F404 Main Fuel Control SystemTurn-Around-Time Reduced from 39 to 22 DaysWinner of the Honeywell Quest Award for Continuous Process Improvement
• F/A-18 Center Barrel Replacement (CBR+)16 percent reduction in TAT between first two deliveries

10/31/2005 5:00 PMAIR 6.0Depot Airspeed vr9.PPT 10
1 2 3
40
72
104
3 7 1125
38 4757
67 70
1 2 3 6 10 13177
11
120138
154 160
20
20406080
100120140160180200
FY87 FY93 FY94 FY95 FY96 FY97 FY98 FY99 FY00 FY01 FY02 FY03 FY04 FY05YTD
$783
$35$85
$245$331
$525$486
$711
$0100200300400500600700800
FY98 FY99 FY00 FY01 FY02 FY03 FY04 FY05YTD
NAVICP PBL Obligations$M
# of
Con
trac
ts A
war
ded
Awarded PBLsAwarded PBLs
42K items, 24% of demand
covered Proj
A Reengineering Tool to Improve Readiness/Sustainment
PBL Status Overall
A Reengineering Tool to Improve Readiness/SustainmentA Reengineering Tool to Improve Readiness/Sustainment
NADEP PPPsNADEP PPPs
Aviation PBLsAviation PBLs

10/31/2005 5:00 PMAIR 6.0Depot Airspeed vr9.PPT 11
Public-Private Partnering With the DepotAchieving the Optimum Mix and Balance of Best Business Practices
Industry Depot
OEM ExpertiseSupply Chain Management
Tech DataConfiguration Management
Process Improvement ToolsSubcontractor Management
Existing InfrastructureEnvironmental PermitsProduct Knowledge
Strike Proof Skilled LaborKnowledge of Fleet Customers
ISO Registered

10/31/2005 5:00 PMAIR 6.0Depot Airspeed vr9.PPT 12
FLEET READINESS CENTER“Approach”
• Shift Maintenance Concept– Three Levels to Two
• (On Flight Line – Off Flight Line)• Move capability to fleet• Integrate I/D and optimize resource allocation• Shift “point-of-sale”
– TMS Focus– Regional Alignment
• Remove Organizational White Space (ie. Improve Value Stream)
• Reduce Total System Cycle Time• Employ Naval Aviation Enterprise Approach
MAJOR TRANSFORMATION IN THE DELIVERY OF AVIATION MAINTENANCE!
• Reduced Work Content– Eliminate Task Duplication– Reduce Material Requirements
• Improved Reliability– Centers of Excellence
• Less WIP in the system

10/31/2005 5:00 PMAIR 6.0Depot Airspeed vr9.PPT 13
X
Site Key WestAIMD Key West
Site Patuxent RiverAIMD PAX RIVER
Site N. OrleansAIMD Atlanta (E-2C Support)NAVAIRES New Orleans FRC EAST
NADEP CHERRY POINT AIMD Willow Grove
FRC MID ATLANTICAIMD OCEANA AIMD NorfolkAIMD NAS Corpus ChristiNADEP CP Det OceanaNADEP JAX Det NorfolkNADEP JAX Det OceanaFRC WEST
AIMD LEMOORENADEP NI Det Lemoore
Site FallonNADEP NI Det Fallon
AIMD Fallon
Site Fort WorthAIMD Atlanta (FA-18 Support)
AIMD Fort Worth
FRC SOUTHWESTNADEP NI Det Miramar
AIMD North IslandNADEP North Island
NADEP North Island DET NI
Site PendletonNADEP NI Det Pendleton
Site Pt. MuguAIMD Pt Mugu Site Yuma
NADEP NI Det Yuma
FRC NORTHWESTAIMD WHIDBEY ISLAND
NADEP NI Det Whidbey IS
Site New RiverNADEP CP Det New River
FRC SOUTHEASTNADEP JACKSONVILLENADEP JAX Det Cecil FieldAIMD BrunswickAIMD JAX
Site MayportAIMD MayportNADEP JAX Det Mayport
Site BeaufortNADEP JAX Det Beaufort
FRC Regional Alignment
10/31/2005 5:00 PMAIR 6.0Depot Airspeed vr9.PPT 14
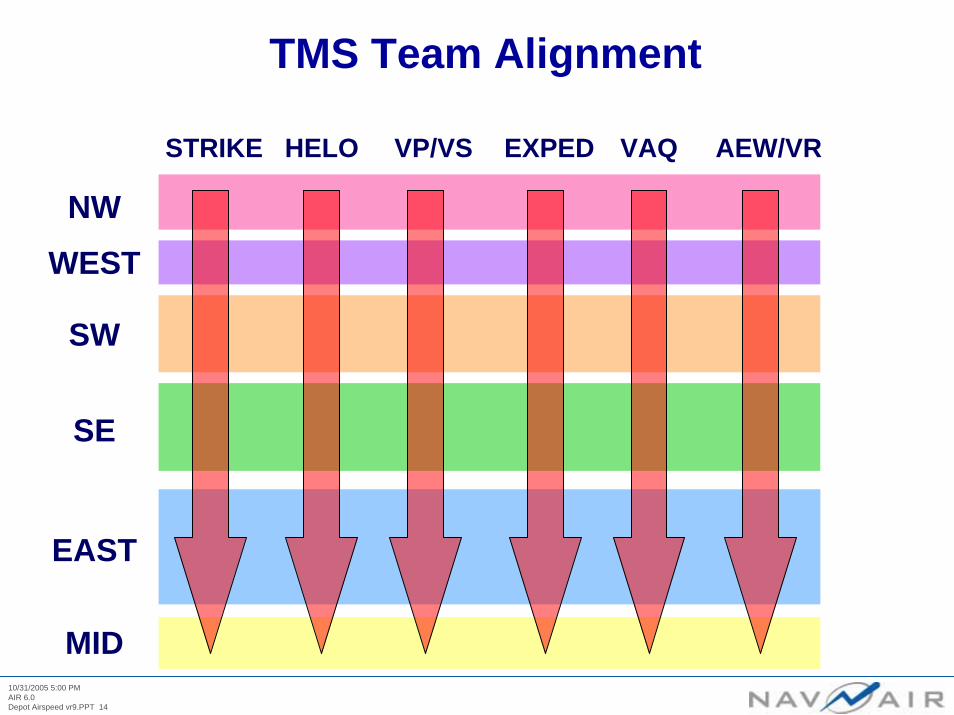
TMS Team Alignment
NW
WEST
SW
SE
EAST
MID
STRIKE HELO VP/VS EXPED VAQ AEW/VR

RDML(S) Michael HardeeCOMMANDER
NAVAL AVIATION DEPOTS
25 October 2005
TRANSFORMING NAVAL AVIATIONMAINTENANCE FOR THE 21ST CENTURY
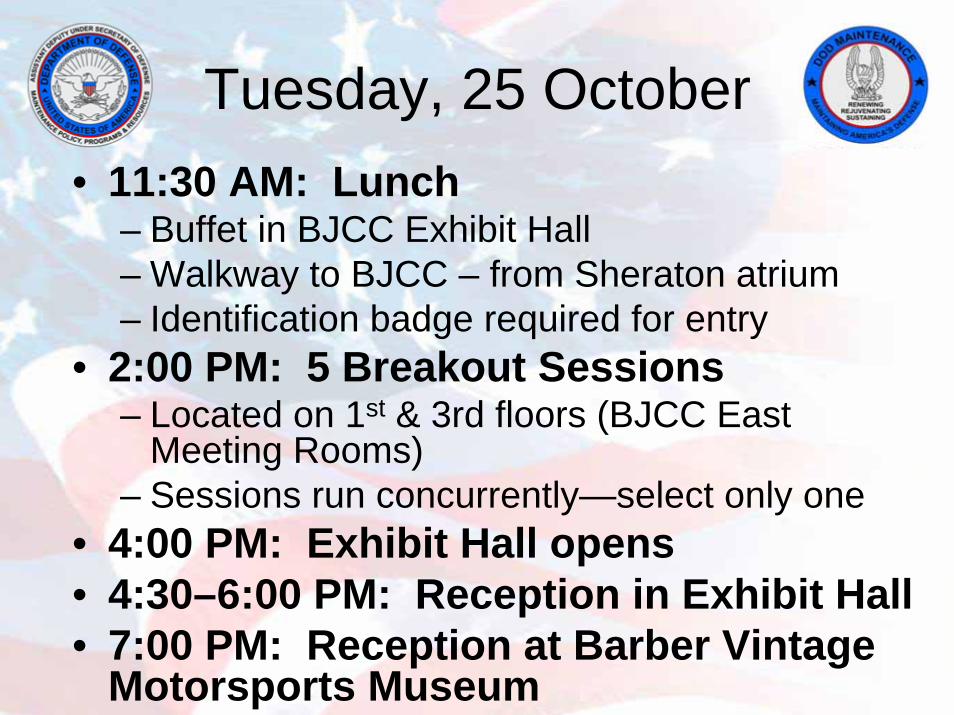
Tuesday, 25 October• 11:30 AM: Lunch
– Buffet in BJCC Exhibit Hall– Walkway to BJCC – from Sheraton atrium– Identification badge required for entry
• 2:00 PM: 5 Breakout Sessions– Located on 1st & 3rd floors (BJCC East
Meeting Rooms) – Sessions run concurrently—select only one
• 4:00 PM: Exhibit Hall opens• 4:30–6:00 PM: Reception in Exhibit Hall• 7:00 PM: Reception at Barber Vintage
Motorsports Museum