transient boating in maryland - maryland sea … boating in maryland: the economic impact of...
TRANSCRIPT

TRANSIENT BOATING IN MARYLAND: THE ECONOMIC IMPACT OF OUT-OF-STATE BOATER SPENDING
Douglas Lipton
Department of Agricultural and Resource Economics Maryland Sea Grant Extension Program
University of Maryland College Park, MD 20742
A University of Maryland Sea Grant Extension Report Prepared For:
Maryland Department of Natural Resources
Maryland Department of Business & Economic Development
Marine Trades Association of Maryland
May 2005

2
EXECUTIVE SUMMARY
The purpose of this study was to develop the first estimate of transient boater activity and spending in Maryland waters. From previous University of Maryland Sea Grant studies we know that boaters who register their boats in Maryland contribute about $1.5 billion to the state economy, but until now there was no estimate of the contribution from boaters who register their boat in other states, but visit Maryland sometime during the boating season. Three surveys were conducted during 2004 to aid in making these estimates. In addition, information was gathered about boater attitudes in order to better understand the factors that keep boaters in Maryland longer and determine how owners of expensive documented boats decide what state to declare as their state of principal use. Major Findings
• We estimate that 4,900 (11.1%) of Maryland DNR’s estimate of 44,103 Maryland boat slips are used at least some time during the year for transient boaters.
• We estimate that 26,157 transient vessels spent at least one day renting space at a
Maryland marina or visited a Maryland boatyard during 2004.
• It is estimated that transient boaters spent $154 million in 2004, while in Maryland on items related to their boat or on trip-related activities.
• Transient boater spending had a $186 million impact on the Maryland economy in
2004, and can be linked to 2,627 full-time equivalent jobs. Most of this is new spending that would not have occurred if boaters had chosen to spend time in waters of other states.
• A large percentage of the transient boaters interviewed are here for short stays
and are generally unaware of time restrictions that might require them to be required to owe Maryland excise tax. However, boaters that stay longer have greater familiarity with the rules. Nonetheless, of the small number of boaters that are here for five months or more, 31% were not familiar with the time restrictions.
• If 31% of the transient boaters who were at least somewhat familiar with length
of stay limits related to excise taxes remained on average 1.9 months longer in Maryland, they would spend an additional $32.5 million, creating an additional $29.2 million in economic output and another 484 full time equivalent jobs in the state.

3
• A survey of documented boaters who potentially could choose Maryland as state of principal use revealed that the most important factors in making this choice were proximity to residence and quality of boating in the chosen state.
• Boaters who considered Maryland as their state of principal use but ultimately
chose another state rated Maryland higher for services, quality of boating, and environmental quality than boaters who chose Maryland. They rated Maryland lower in regard to accessibility from their home, accessibility to out-of-state destinations and for the level of state taxes and fees.
• Attracting boaters that consider Maryland when choosing state of principal use
can generate additional economic impacts to the state. If we attracted the 1,600 boaters that we estimated considered Maryland and did not choice it, this would result in an additional $36 million in economic output and 600 full time equivalent jobs.
Recommendations • Maryland State Agencies such as DNR and DBED should work in concert with
the marine industry in the state to increase the number of transient boaters that visit Maryland and the length of time that these boats stay here in order to increase the level of economic impact that transient boating has on the Maryland economy.
• Innovative ways should be sought to allow boaters to stay longer in Maryland
while not creating an unfair situation relative to taxes paid by Maryland registered boaters. In considering approaches, policymakers should consider both the revenue stream from taxes, permits and fees, and the revenue stream from daily spending of the boater.
• Maryland should develop a marketing campaign targeted at the segment of
documented boaters who choose among states for declaration of principal use with the purpose of getting these boaters to register in Maryland.
• Maryland should review its boating laws and regulations to ensure that they do
not unintentionally deter boaters and create a negative perception of the state as a boating destination or a state to register your boat in.
• Maryland could greatly benefit from building on these preliminary survey results
to conduct more in-depth studies, including focus groups of transient boaters and potential documented boat owners who might register in Maryland.

4
Background Continuing studies by Maryland Sea Grant have estimated that the economic
impact of spending by recreational boaters registered in Maryland contribute $1.5 billion
in total economic output to the state and over 26 thousand full time equivalent jobs
(http://www.mdsg.umd.edu/Extension/recboat.html). Although Maryland is one of the
few states that consistently track annual spending by its registered boaters, there is no
estimate of the economic impact created by the many out-of-state transient vessels that
spend time in Maryland waters. There is no estimate of the number of out of state boats
that use Maryland waters during the year, how long they stay there and what there
spending patterns are. It is important to understand the fiscal impact that these out of
state boaters have on the Maryland economy in order to determine the benefits of
attracting boaters to Maryland and having them stay here for longer periods.
With support from the Maryland Department of Business and Economic
Development, the Maryland Department of Natural Resources, the Marine Trades
Association of Maryland and University of Maryland Sea Grant, three surveys were
conducted in 2004 to develop estimates of the impact of transient boaters in Maryland
and understand the factors that attract boaters here:
1. The first survey (logbooks) was conducted among marinas that provide slips for
transient vessels and was intended to be used to estimate the total number of
vessels that visit Maryland marinas during the year.
2. A second survey was conducted via in-person interviews with transient vessel
owners to determine their spending patterns while in Maryland.
5
3. Finally, a survey was sent to documented vessel owners in mostly the eastern
United States to determine the factors that influence boater choice of state of
principal use for their vessel.
Transient Slip Logbooks During the summer of 2004, we recruited marina operators to maintain logbooks
on the usage of their transient slips. They recorded information on the size of the vessel
using the slip, whether it was power or sail, the vessel’s hailing port state, vessel name,
date of arrival and the number of days that they occupied the slip. A few marinas did not
maintain a logbook for us, but were able to summarize data on slip usage from their own
set of records. In total, we obtained data on transient slip usage for 14 marinas. These
marinas have a total of 3,928 slips of which 403 are generally available for transient
boaters. Figures obtained from Maryland Department of Natural Resources put the total
number of slips in Maryland at 44,103. A simple ratio of slips in our sample to total slips
in Maryland (10.3%) provides one estimate of the total number of transient slips in
Maryland, 4,525. However, since we intentionally recruited marinas likely to have
transient slips, we needed to develop an unbiased independent estimate of transient slips
in Maryland. To do this, we randomly telephoned 27 marinas that were not included in
our logbook sample and asked the contact the total number of slips in the marina and the
total number that may be available during the boating season. In this latter sample, two
We estimate that about 11.1% of the over 44,000 marina boat slips in Maryland are available for transient vessels.

6
marinas had no transient slips and 26% of the marinas had less than 5 slips available.
Nevertheless, the sample had a higher percentage of transient slips available (11.8%) than
the marinas that kept logbooks for us (10.2%). Therefore, we combined the logbook
sample and the telephone sample so that we had data on 9,929 slips of which 1,103 were
available for transients. Based on these data, we estimate that 11.1% (4,900) of the
44,103 slips in Maryland are available for transient usage at least some time during the
boating season.
The logbook data allows us to estimate the number of out of state transient boaters
using Maryland slips during the May through August period. Our sample contained
observations on 2,654 vessels. Using our estimate of the number of slips in Maryland,
we extrapolate our sample and estimate that the total number of vessels using Maryland
waters during the May-August period was 23,910. The number of vessels in any month
varied throughout the May-August sample period: vessel activity was 9.4% of the total in
May; 16.7% in June; 42.3% in July; and 31.6% in August. Although a few marinas
provided data on slip usage outside the sample period, we estimated the additional
activity for the January-April and September-December periods, by assuming a constant
monthly rate of increase in transient vessel activity between January and May and a
constant monthly rate of decrease between August and December. This seasonal
adjustment adds another 2,247 transient vessels, bringing the yearly total to 26,157. As a
further check, we divide the total number of transient trips by the total number of slips
available, to determine that the average transient slip is visited by 5.3 different vessels
during the year.
7
The average length of all vessels included in the transient vessel logbooks was 38
feet and the average length of stay at a Maryland marina was 3.82 days. The mean length
of vessels were the same for power and sail, but powerboat mean length of stay was 2.86
days; whereas, sailboats stayed an average of 5 days at a marina. This information on
vessel length and number of days will be combined with spending per day data from the
next section to help determine total transient boater spending in Maryland.
Transient Boater Spending Survey
During July-September, 2004, we visited various marinas around Maryland to
conduct in-person interviews with vessel owners and operators to determine their
spending patterns while in Maryland waters. A total of 219 surveys were completed
providing data on daily or monthly spending patterns as well as major supply and repair
expenditures.
Spending on items that vary depending on the length of stay include: fuel, slip
fees, food and entertainment expenditures. Most of the vessel owners also made major
purchases of boating equipment (75%) or had repair or maintenance work performed
(73%) while in Maryland. To determine the total spending, the average number of days
spent for vessels of different size categories was multiplied by the variable spending per
day. This variable spending figure was added to the estimated per boat spending on
equipment or repair after accounting for the fact that not all vessels incur these fixed
In 2004, we estimate that 26,157 transient recreational vessels, registered or documented in other states, rented space at a Maryland marina.

8
expenditures. Spending by vessel type (power or sail) and size category is shown in
Table 1. Direct total spending by out-of-state transient boaters in Maryland amounted to
an estimated $154 million in 2004. This compares to a $1.7 billion direct expenditure by
Maryland registered boaters, if we do not count new boat purchases.
Table 1. Estimated direct spending by transient boaters, by boat type and size.
Length (ft.)
Transients in MD TOTAL
Power <29 4,168 $5,276,688 30-39 8,584 $23,571,664 40-49 4,773 $36,818,922 50-59 1,294 $25,516,386 60+ 475 $27,127,725 Sail <39 4,714 $19,440,536 40+ 2,149 $15,971,368 TOTAL 26,157 $153,723,289
The average days in Maryland used to calculate these impacts are based on our
direct interview with boat owners as opposed to the logbooks kept by the participating
marinas. Direct interviews indicated significantly longer stays in Maryland waters by
transient boaters for each of the size categories. Part of this discrepancy may be due to
the fact that boaters may go to multiple marinas within the state, whereas, the logbook
only captures the time spent at a single marina.
Direct spending by transient boaters in Maryland is estimated as $154 million per year.

9
Total Economic Impact of Transient Boater Spending
To determine the total economic impact of transient boater spending, we use the
same modeling approach used to calculate the economic impact of Maryland registered
boaters. Spending totals are estimated for unique IMPLAN spending categories which
allow statewide multipliers to be applied to the direct spending estimates to obtain
indirect and induced output, income and employment. We calculate these spending
impacts for the estimated direct expenditures of $154 million.
Table 2. Economic Impact of Transient Boater Spending in Maryland. Direct Spending Total MD
Output Total MD Income
Direct Jobs Total Jobs
$154 million $186 million $113 million 1,650 2,627
Including out-of-state transient boater spending impacts increases the total economic
impact of recreational boating on the Maryland economy by 12%.
Excise Tax Effects on Transient Boaters in Maryland
As part of our survey efforts we tried to determine the role that vessel excise tax
issues might play in the potential contribution of transient vessels to the Maryland
economy. In our direct interview with boaters we asked several questions related to the
Maryland excise tax laws. After reading to the boater a statement about the time limits
on boating in Maryland related to excise tax liability, we asked the boater how familiar
Transient boater spending results in an increase in output of $186 million a year for the Maryland economy and contributes 2,627 full time equivalent jobs.

10
they were on a scale of 1-5 with this regulation (see appendix). Overall, boaters were
very unfamiliar with these requirements with 67% stating they had no (answered 1 out of
5) or very little familiarity (answered 2 out of 5) with the law and 29% being very or
somewhat aware (answered 4 or 5 ). However, the longer the boater stayed in Maryland
waters, the more likely they were to be familiar with the regulations.
Table 3. Percent of transient boaters very unfamiliar with time limits and excise tax regulations by length of stay in Maryland waters.
Length of Stay < 1 month 1-2 months 3- 4 months 5 + months
Percent Unfamiliar 79% 59% 44% 31%
Number responding
48 29 18 13
Another question focused on how much longer a boater might stay in Maryland
waters. Since many boaters indicated that they were unaware of the regulations, we only
used data from those boaters who stated they were at least somewhat knowledgeable
about the requirement. The responses are given in Table 4.
If 31% of the transient boaters who were at least somewhat familiar with length of stay limits related to excise taxes remained on average 1.9 months longer in Maryland, they would spend an additional $32.5 million, creating an additional $29.2 million in economic output and another 484 full time equivalent jobs in the state.

11
Table 4. Boater familiarity with Maryland length of stay restricitions and desire to stay longer. Length (ft.) Longer Stay (months) % Familiar Power <29 5.75 16.7% 30-39 0 17.1% 40-49 2.40 52.6% 50-59 2.82 52.4% 60+ 4.5 33.3% Sail <39 0 33.3% 40+ 4.13 50%
To estimate the potential impact of boaters staying longer in Maryland, we multiply the
percentage of boaters familiar with the law times the number of estimated transient boats
of that size class to determine the number of boats that will stay longer. We then
multiply that number times the average number of months they stated they would remain
in Maryland and the average variable monthly spending. Based on the above, we
estimate that transient boaters familiar with Maryland’s vessel excise tax laws would
spend 21% more than currently if they did not have to concern themselves with the length
of stay rules. This results in additional direct spending by transient boaters of $32.5
million with a total economic impact of $29.2 million and an additional 484 full time
equivalent jobs.1
Documented Vessel Survey
A mail survey was conducted for documented vessel owners that focused on the
more expensive category of boats, those valued at $200,000 and above. Since the value
of the boat is not indicated in the Coast Guard database of documented vessels, we used 1 The total output is lower than the direct spending because a large percentage of variable spending is on items such as fuel and groceries which include goods where most of the value-added to create these goods is paid to out of state firms (e.g., the cost of oil refining).

12
size and vintage as indicators of boat value. The size and year chosen was determined
with the help of industry experts and is given in Table 5. Since the survey will ask for the
value of the boat, those sampled who indicate a value falling below $200,000 are not
included in the following data analysis.
Table 5. Combinations of length of vessel and age to subsample Coast Guard database for targeting of vessels worth over $200,000.
Length (ft.)
Powerboat Vintage (yrs.)
Sailboat Vintage (yrs.)
40-45 0-10 0-7 46-50 0-15 0-10 >50 0-25 0-20
The 2004 Coast Guard Documented vessel database contains information on
223,936 documented recreational vessels in the United States. When we apply the above
criteria of size and vintage, there are 34,506 vessels (15.4%) that meet the criterion. We
next focused on the following states as the major market for Maryland to attract boaters
from: Connecticut, District of Columbia, Delaware, Florida, Maryland, North Carolina,
New Hampshire, New Jersey, New York, Pennsylvania, Rhode Island and Virginia.
These states were chosen as being the Maryland market by examining the Coast Guard
data and choosing states with the highest percentages where the residents listed Maryland
as homeport2. The total number of boats from these states that meet the size and vintage
criteria is 13,887. This number represents the documented boats that are likely valued at
over $200,000 that might consider declaring Maryland as state of principal use.
A random sample of 2,285 boats was taken from the boats in the above states
meeting the size and vintage criteria. Two hundred surveys were sent to each state except
the District of Columbia which had 85 surveys mailed. A total of 255 surveys (11%)
2 Homeport designation does not necessarily correspond to state of principal use.

13
were returned as undeliverable as addressed. Of the delivered surveys, 318 were
returned, a response rate of 16%.
Even with the size and vintage criterion, only 62% of the vessels that returned
surveys had a current value of greater than $200,000. This could indicate a non-response
bias by owners of more valuable boats or the criteria were not efficient in selecting out
lower value boats. In addition, responses were received from states of owner residence
that were not included in the original mailing. Mail may have been forwarded to owners
if they changed address or the owner may have answered the state of residence question
differently on the Coast Guard application. State of residence in addition to those
mentioned above included: Arizona, California, Massachusetts, Maine, Missouri,
Tennessee and Texas.
Of the states we surveyed, most did a good job of having their residents declare
that state as the state of principal use. From Table 6, we can see that the exceptions
Table 6.. Percentage of residents declaring their home state as state of principal use.
State of Residence % Same State Principal Use
CT 79% DC 17% DE 25% FL 80% MD 90% NC 80% NH 42% NJ 77% NY 87% PA 6% RI 100% VA 57%
to this are states that have limited options for boaters (i.e., DC, DE, NH and PA). A large
percentage of Virginia owners (32%) have Maryland as state of principal use, but few

14
Marylanders keep their boats in Virginia. Overall, 40% of boaters that responded to our
survey declare a state of principal use other than their state of residence. It is likely that
these boaters who are choosing other than their state of residence as state of principal use
are the boaters who are most susceptible to being attracted to Maryland. The remainder
of this section explores the factors that enter into the boater’s choice of state of principal
use.
We queried boaters about the factors that were important to them in deciding what
state they wanted to declare as state of principal use. The list of possibilities was
developed with the help of the Marine Trades Association of Maryland and included: 1)
availability of repair, supply and support services; 2) quality of boating destinations
within the state; 3) water quality, fishing quality and other environmental factors; 4) level
of state taxes and fees; 5) accessibility of the boat to owners residence; and 6)
accessibility of the location to other boating destinations outside the state. Boaters were
asked to rank these factors on a five point Likert scale with a response of 1 representing
that the factor was not important and 5 representing a factor of highest importance. The
average ranking for all boaters showed that the two most important factors in deciding
state of principal use were quality of boating destinations within the state (4.24) and
accessibility of boat to residence (4.15). The rankings continued with environmental
factors (3.72), accessibility to other states (3.68), services (3.50) and taxes and fees
(3.45).

15
We next asked the boater to rank the state that they chose for principal use in the
same six categories based on whether the state was below average, average, or above
average in those categories. We used the responses to the previous question on what is
important to weight the responses they supplied. For example, if a respondent answered
that accessibility from their residence was not an important factor and they rated the state
they choose as high (i.e., they live nearby), this did not count as much in the overall state
ranking for that individual as it would have if they had rated the factor high in
importance.
For the first set of responses we looked at how boaters ranked the state that they
chose for principal use. The data can be used to explore what was important to
contributing to the overall score the boater gave their state and how scores compared
among states. We had data on 231 responses, 74 (32%) of which claimed Maryland as
state of principal use. Maryland’s overall ranking on the 1-5 scale was 3.52, placing it
10th out of the 11 states for which we had 9 or more responses. Boating quality and
accessibility to residence contributed the most to Maryland’s overall score (28.2%, each),
and state fees and taxes contributed the least (10.3%). Just looking at state fees and taxes
When choosing a state of principal use, boat owners are most concerned about the quality of the boating in the state chosen and the accessibility of the boat to their residence. Of more moderate importance were environmental quality, accessibility of other boating destinations, repair and support services and state taxes and fees.

16
question alone, Connecticut, New Jersey and New York had lower rankings than
Maryland.
Of interest in trying to attract boaters to Maryland are the attitudes of boaters who
considered Maryland in the states they considered for principal use, but ultimately choose
another state. For all boaters who considered Maryland when choosing a state of
principal use, a summary of the scores for the six categories that boaters ranked and the
total score is given in table 7.
Table 7. Rankings on a scale of 1-5 of factors affecting boater decisions on choice of state of principal use. Boating
Infrastructure Boating Quality
Environmental Quality
Low Taxes & Fees
Accessibility from home
Accessibility to boating destinations
Overall (1-5)
Chose MD/MD Rank
2.78 4.02 2.33 1.82 4.00 2.64 3.52
Chose Other State/MD Rank
3.22 3.81 2.85 2.37 1.89 2.63 3.36
Chose Other State/Other State Rank
2.62 3.35 2.88 3.30 3.27 3.08 3.70
The factor that influences overall score the most for all boaters is accessibility to home.
Other than convincing boaters to move closer to Maryland, there is little that can be done
to overcome this barrier to more boaters choosing Maryland as state of principal use.
Boaters perception about other factors that influenced their decisions can be changed
through education and marketing as well as investing in the underlying factors that lead
to the perception (e.g., investing in boating infrastructure). Even perceptions about
accessibility to other boating destinations can be altered by raising awareness of quality
destinations that are in easy cruising distance.

17
It is revealing to compare in Table 7 how boaters who considered Maryland but
chose another state, compared that state to Maryland. For example, boaters ranked
Maryland higher than their state of principal use for boating infrastructure and overall
boating quality. Boaters ranked their state of principal use higher than Maryland in terms
of accessibility to out-of-state boating destinations and in terms of having lower taxes and
fees associated with boating.
In our sample, 11.5% of the boaters did not choose Maryland, but considered it as
an alternative. Earlier, we estimated that our sample represented a population of boats
that numbered 13,887. If 11.5% of these consider, but do not choose Maryland as state of
principal use, that represents a potential market of 1,597 vessels. While we can not
calculate from our data what changes in attitude would be necessary to get these boat
owners to actually choose Maryland, we can estimate from our earlier analysis on boater
spending what they could potentially contribute on a per boat basis to the Maryland
economy.
Boaters who considered Maryland as their state of principal use but ultimately chose another state rated Maryland higher for services, quality of boating, and environmental quality than boaters who chose Maryland. They rated Maryland lower in regard to accessibility from their home, accessibility to out-of-state destinations and for the level of state taxes and fees.

18
We assume that a boater, that declares Maryland as state of principal use will
have the same spending patterns as similar boaters already in Maryland. From our
Maryland boater spending survey (http://www.mdsg.umd.edu/Extension/recboat.html),
we use the estimated expenditure for the highest powerboat (>33 feet) and highest
sailboat (>31 feet) size category to estimate what the annual spending by these boaters
would be. We estimate that the typical powerboat of 33+ feet spent a total of $31,479 in
2003, and the typical sailboat of 31+ feet spent $17,377. Powerboats make up78% of the
documented vessels in our database. If we are able to attract 25% of this potential
market, it would represent about 400 boats coming to Maryland that otherwise would
have declared another state, 312 powerboats and 88 sailboats. These boaters would
generate another $9.9 million in direct spending having a total economic impact of just
over $9 million dollars, and it would create an additional 104 direct jobs and 151 total
new jobs in the Maryland workforce.
Conclusions and Recommendations
The Chesapeake Bay and coastal waters of Maryland are valuable resources
creating recreational opportunities for all types of boating enthusiasts. The activities of
If we could change the attitudes of the approximately 1600 boaters who considered but did not choose Maryland as their state of principal use and convince them to all come to Maryland we could generate almost $40 million in new spending, $36 million in total economic output and add 600 full time equivalent jobs to the Maryland workforce.

19
these boaters have a strong fiscal impact on the Maryland economy, creating income, tax
revenues and employment for Maryland citizens. For the vast majority of boaters, the
decision about where to keep their boat, and thus where much of their money is spent, is
simple. In the words of one respondent to our mail survey, “I live in Maryland, I boat in
Maryland”. In another study, we have calculated the approximate spending of these
Maryland boaters (http://www.mdsg.umd.edu/Extension/recboat.html). In 2003, there
were 209,500 registered boats in Maryland leading to $1.5 billion in total economic
output in the state and 26,166 full-time equivalent jobs.
This study focused on another category of boater in Maryland waters, the
transient boater. For the first time, we estimate the total number of transient boats that
enter Maryland waters and stay at least one day at a Maryland marina. Through in-
person interviews with transient boaters we develop an estimate of their spending
patterns. Combining the number of vessels, their length of stay and spending patterns
yields an estimate of the total spending by transient boaters in 2004. These boaters spent
a total of $154 million. Using an economic input-output model, we estimate that this
direct spending translated into an overall economic impact on the Maryland economy of
$186 million and added a total of 2,627 full time equivalent jobs to the economy. It is
important to note that this economic output is new spending for Maryland, money
brought into the state that would otherwise be spent in other states. If Maryland was not
a boating destination, these boaters would spend their money in other states.
Many of these transient boaters spend only a short period in Maryland waters and
they have little concern, or even knowledge about the fact that if they remain here beyond
a certain period of time they may be out of compliance with the rules governing state of

20
principal use. Boaters remaining for longer periods tend to be more aware of this issue
and indicate that they would be willing to stay longer (and spend more money) in
Maryland if they did not have to be concerned with this compliance issue. Maryland
should review its boating laws and regulations to ensure that they do not
unintentionally deter boaters and create a negative perception of the state as a boating
destination or a state to register your boat in.
Boaters detered from visiting or staying longer in Maryland must go somewhere
other than Maryland with their vessels, thus, spending that would otherwise occur in
Maryland is lost to other states. It is recommended that Maryland explore innovative
ways to encourage transient boaters to remain in Maryland waters for longer periods.
Whatever approach is adopted should be carefully designed so as not to provide a
loophole for individuals who are just seeking to avoid paying Maryland excise tax. In
considering approaches, policymakers should consider both the revenue stream from
taxes, permits and fees, and the revenue stream from daily spending of the boater.
In addition to getting transient boaters to stay longer in Maryland, there is also an
opportunity to encourage owners of documented vessels to consider Maryland in their
choice set of states of principal use, and then try and get them to actually choose
Maryland. Our survey of documented boaters indicates that most boaters only consider
the state that they are a resident of in their choice set. However, 11.5% of the boaters we
sampled did consider Maryland, but then rejected it for another state. These boaters
ranked Maryland lower than a lot of other states in the factors that enter into making the
choice. These boaters may have misperceptions about the quality of the boating
experience in Maryland. For example, many of them rate Maryland poorly in terms of

21
environmental quality issues. It may be that the negative press regarding the state of
Chesapeake Bay restoration leads out of state boaters to believe that the quality of the
Maryland boating experience is poor. It is recommended that an investment in a
marketing campaign targeted at the high value documented boater market that
educates the boater on the high quality boating experience in Maryland waters be
undertaken with the intent of increasing the number of documented boaters declaring
Maryland as state of principal use.
There is an active and competitive market for boaters along the east coast of the
United States. Each state vies for the boater’s dollar in a variety of ways. Some states
have a low entry fee (i.e., no excise tax) with the intent on capturing economic benefits
via the boaters spending within their state. Maryland State Agencies such as DNR and
DBED should work in concert with the marine industry in the state to increase the
number of transient boaters that visit Maryland and the length of time that these boats
stay here in order to increase the level of economic impact that transient boating has
on the Maryland economy. Maryland has the opportunity to be a more competitive
player within this marketplace. Innovative approaches based on an understanding of
boater behavior and decision-making can lead to substantial economic gains that benefit
the state.

22
APPENDICES
TRANSIENT BOATER SPENDING SURVEY
DOCUMENTED BOAT OWNERS SURVEY
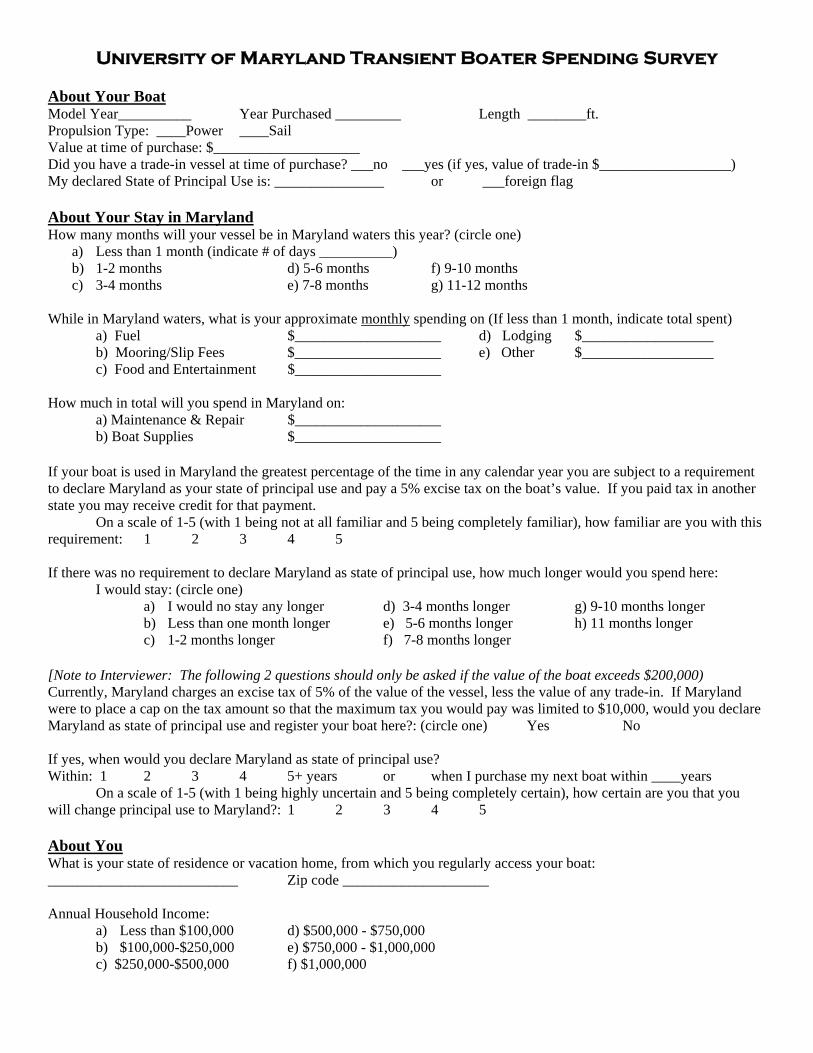
University of Maryland Transient Boater Spending Survey About Your Boat Model Year__________ Year Purchased _________ Length ________ft. Propulsion Type: ____Power ____Sail Value at time of purchase: $____________________ Did you have a trade-in vessel at time of purchase? ___no ___yes (if yes, value of trade-in $__________________) My declared State of Principal Use is: _______________ or ___foreign flag About Your Stay in Maryland How many months will your vessel be in Maryland waters this year? (circle one)
a) Less than 1 month (indicate # of days __________) b) 1-2 months d) 5-6 months f) 9-10 months c) 3-4 months e) 7-8 months g) 11-12 months
While in Maryland waters, what is your approximate monthly spending on (If less than 1 month, indicate total spent)
a) Fuel $____________________ d) Lodging $__________________ b) Mooring/Slip Fees $____________________ e) Other $__________________ c) Food and Entertainment $____________________
How much in total will you spend in Maryland on:
a) Maintenance & Repair $____________________ b) Boat Supplies $____________________
If your boat is used in Maryland the greatest percentage of the time in any calendar year you are subject to a requirement to declare Maryland as your state of principal use and pay a 5% excise tax on the boat’s value. If you paid tax in another state you may receive credit for that payment. On a scale of 1-5 (with 1 being not at all familiar and 5 being completely familiar), how familiar are you with this requirement: 1 2 3 4 5 If there was no requirement to declare Maryland as state of principal use, how much longer would you spend here: I would stay: (circle one)
a) I would no stay any longer d) 3-4 months longer g) 9-10 months longer b) Less than one month longer e) 5-6 months longer h) 11 months longer c) 1-2 months longer f) 7-8 months longer
[Note to Interviewer: The following 2 questions should only be asked if the value of the boat exceeds $200,000) Currently, Maryland charges an excise tax of 5% of the value of the vessel, less the value of any trade-in. If Maryland were to place a cap on the tax amount so that the maximum tax you would pay was limited to $10,000, would you declare Maryland as state of principal use and register your boat here?: (circle one) Yes No If yes, when would you declare Maryland as state of principal use? Within: 1 2 3 4 5+ years or when I purchase my next boat within ____years On a scale of 1-5 (with 1 being highly uncertain and 5 being completely certain), how certain are you that you will change principal use to Maryland?: 1 2 3 4 5 About You What is your state of residence or vacation home, from which you regularly access your boat: __________________________ Zip code ____________________ Annual Household Income:
a) Less than $100,000 d) $500,000 - $750,000 b) $100,000-$250,000 e) $750,000 - $1,000,000 c) $250,000-$500,000 f) $1,000,000

24
DOCUMENTED BOAT OWNERS SURVEY 1. Please indicate your state of residence ________ 2. What state is the “State of Principal Use” for your documented vessel? ___________ 3. What was the approximate value of your vessel at the time of documentation? $_________________ In Year 19____ 4. What is the approximate current value of your vessel for trade-in or sale $ ____________ 5. Did you trade-in another boat when purchasing your current vessel (Y or N) _____ If yes, what was the trade-in’s approximate value? $_______________ 6. What is the one-way travel distance from your residence (or other typical point of embarkation) to the place where your vessel is principally kept? ______Miles 7. How often during the year do you make this trip? ___ times a year 8. What is your annual household family income? __ Less than $100,000 __ $400,000 - $499,999 __ $100,000 - $199,999 __ $500,000 - $749,999 __ $200,000 - $299,999 __ $750,000 - $1,000,000 __ $300,000 - $399,999 __ Greater than $1,000,000 Please complete the following table by circling one of the numbered responses that represents the importance of the item to your decision as to where to register your boat and how you rank the state in which your boat is currently registered.
PLEASE TURN OVER AND COMPLETE THE SURVEY ON THE OTHER SIDE
Importance to My Decision Where My State Ranks Not Moderate Highest
-2 -1 0 +1 +2Worse Average Best -2 -1 0 +1 +2
Vessel Repair, Supplies and Support Services Available -2 -1 0 +1 +2 -2 -1 0 +1 +2
Quality of Boating Destinations, Good Anchorages, Wide Selection of Marinas, Restaurants, Shopping
-2 -1 0 +1 +2 -2 -1 0 +1 +2
Water Quality, Fishing Quality, and Other Environmental Factors
-2 -1 0 +1 +2 -2 -1 0 +1 +2
Low State Taxes and Fees -2 -1 0 +1 +2 -2 -1 0 +1 +2Accessibility from my Home -2 -1 0 +1 +2 -2 -1 0 +1 +2Accessibility to Out-Of-State Boating Destinations -2 -1 0 +1 +2 -2 -1 0 +1 +2

25
Please complete the table below for up to two other States that you considered, but did not choose. Make sure to enter the two-letter abbreviation for name of the State you are ranking.
THANK YOUR FOR TAKING THE TIME TO COMPLETE THIS SURVEY.
Other States Considered, But Not Chosen:
State #1 Considered: ______ (Please write 2-letter State abbreviation in space provided)
State #2 Considered: ______ (Please write 2-letter State abbreviation in space provided)
Not Moderate Highest -2 -1 0 +1 +2
Worse Average Best -2 -1 0 +1 +2
Vessel Repair, Supplies and Support Services Available -2 -1 0 +1 +2 -2 -1 0 +1 +2
Quality of Boating Destinations, Good Anchorages, Wide Selection of Marinas, Restaurants, Shopping
-2 -1 0 +1 +2 -2 -1 0 +1 +2
Water Quality, Fishing Quality, and Other Environmental Factors
-2 -1 0 +1 +2 -2 -1 0 +1 +2
Low State Taxes and Fees -2 -1 0 +1 +2 -2 -1 0 +1 +2Accessibility from my Home -2 -1 0 +1 +2 -2 -1 0 +1 +2Accessibility to Out-Of-State Boating Destinations -2 -1 0 +1 +2 -2 -1 0 +1 +2