transient dynamic analysis of the bao’an stadiumquantumfi.net/papers/knight2016transient.pdfthis...
TRANSCRIPT

Transient Dynamic Analysis of the Bao’An Stadium
David Knight, Rowan Whitefield, Eric Nhieu, Faham Tahmasebinia, Peter Ansourian, and Fernando Alonso-
Marroquin a)
School of Civil Engineering, the University of Sydney, Sydney NSW 2006
a)Corresponding author: [email protected]
Abstract. Bao’An Stadium is a unique structure that utilises 54m span cantilevers with tensioned members to
support the roof. This report involves a simplified finite element model of Bao’An stadium using Strand7 to analyse
the effects of deflections, buckling and earthquake loading. Modelling the cantilevers of the original structure with a
double curvature was problematic due to unrealistic deflections and no total mass participation using the Spectral
Response Solver. To rectify this, a simplified symmetrical stadium was created and the cable free length attribute was
used to induce tension in the inner ring and bottom chord members to create upwards deflection. Further, in place of
the Spectral Response Solver, the Transient Linear Dynamic Solver was inputted with an El-Centro earthquake. The
stadium’s response to a 0.20g earthquake and self-weight indicated the deflections satisfied AS1170.0, the loading in
the columns was below the critical buckling load, and all structural members satisfied AS4100.

INTRODUCTION
Bao’An stadium is an iconic structure that has structural columns inspired by local bamboo forests, intended to
create a prominent feature in Shenzhen China. The structure has a circular shape with an outer diameter of 236m and
an inner diameter of 128m. A lightweight roof structure with a polytetrafluoroethylene membrane is cantilevered 54m
to provide shelter for spectators. The stadium is a complex structure due to the inclusion of the inner ring cables that
have a pre tension of 3600 kN in the top cable, and 1800 kN in the bottom cable. These cables are supported through
a lightweight truss system comprising of thin cables that extend to the external columns which also support a large
compression ring. The columns are large circular hollow sections ranging in sizes from 550 mm to 800 mm. The
stadium behaves similar to a bicycle wheel, the trusses equivalent to tension spokes of the wheel and the rim
representing the outer compression ring (Guo et al., 2011; Tian et al., 2011). The stadium has a gross floor area of
88,500 m2 and was constructed over a 2 year period. TABLE 1 shows the main details.
The key structural components supporting the stadium roof are long span cantilevered members. This is achieved
through the use of tensioned cables as the bottom chord and a tapered truss geometry that creates upward deflection
(Guo et al., 2013). This report investigates how the cantilevers of Bao’An stadium prevent deflections under self-
weight and dynamic earthquake loading.
TABLE 1. Building details
Location: Shenzhen China The year of build: 2009-2011
Architects: GMP Architeken Overall height: 39.65m
Structural Engineers: Schlaich Bergermann Und Partner Floor area: 88,500 m2
Function: Sports stadium primarily constructed for the Universiade Car spaces: 750
The structure of the plan: A large circular roof structure with a circular
rings at the centre supported on a complicated external column geometry
ranging from 550 mm to 800 mm
Occupant capacity: 40,050
PRELIMINARY STRUCTURAL MEMBERS
There is a lack of detailed information in the literature on the member sizing and properties. This resulted in the
majority being estimated from pictures. The members chosen for the Strand7 model were based on images from
Ferguson (2011) and structural journals (Guo et al., 2011; Guo et al., 2013; Tian et al., 2011). TABLE 2 shows the
members chosen for the structure. The detailed member selection process is contained in APPENDIX 1. The key
criteria for the selection of the members was vertical deflection limits, ideally stiff, light weight members. This is
achieved with the selection of circular hollow sections for majority of the structural members.
TABLE 2. Structural elements
Structural Element Size of elements (mm) Dead Load (kN/m)
External Columns 800x50 CHS 9.07
Box Girder 200 x 100 1.54
Top Chord 250 x 30 CHS 1.60
Bottom Chord 200 x 5 CHS 0.24
Cables 10 mm Cable -
Vertical Truss Members 400 x 10 CHS -
Roof Membrane - polytetrafluoroethylene 1mm 0.20
STRUCTURAL SYSTEM
Bao’An stadium consists of a complex structural system to resist vertical and lateral loads. Vertical loads are
resisted as shear flows through the roof truss. These are then transferred to the columns as bending moments through
a fixed connection, and then transferred to the foundations. The membrane roof is connected continuously to the top
chord to completely supress all buckling modes. Vertical truss members also act as spring stiffeners to reduce the
effective length to the lower chord to prevent large buckling modes. The ring cables are pre tensioned to prevent any
compressive stresses causing sagging catenary actions. Lateral loads are resisted by the very stiff columns which are
stabilised by the outer compression rings.

-400
-300
-200
-100
0
100
200
0 10 20 30 40 50
Def
lect
ion
(m
m)
Cantilever Length (m)
Mb = 0.5Ma Mb = 0.535Ma
Long Span Cantilever To demonstrate how the cantilevers can resist deflection, a single column-roof section has been analysed. The
self-weight of all the roof members are treated as an applied uniformly distributed load on the top chord. The bottom
chord is pre-tensioned to prevent compressive stresses while the inner ring is in tension to limit deflections. FIGURE
1(a) shows the overall action of the tensioned cables in the bottom chord and bottom inner ring. The net resultant force
is acting inwards because the inner ring is tensioned higher. FIGURE 1(b), shows a free body diagram of a typical
column-roof section with the applied tensile force ‘T’ as the resultant action of cable tension, this tensile force T may
be chosen to minimise the deflection of the cantilever. FIGURE 1(c) shows how this effectively creates an applied
moment that resists deflection.
Tension Within Members
Net Resultant Force
𝑀𝐴 =𝑤𝐿2
2=
1.8×542
2= 2624𝑘𝑁𝑚 and
𝑀𝐵 = 9 × 𝑇
FIGURE 1. (a) Net resultant force of single section (b) Free body diagram of a column-roof section (c) Free body diagram of
a truss cantilever (d) Comparison of deflected shape with applied end moment
(c) (b)
(d)
(a)

The truss is treated as a cantilevered beam with constant second moment of area, it can be shown that the moment
EQUATION (1) can be integrated twice (2) for deflection:
𝑀(𝑥) =𝑤
2(𝑥2 − 2𝐿) − 𝑀𝑏 (1)
𝜈(𝑥) = ∬ −𝑀
𝐸𝐼𝑑𝑥 = −
𝑤𝑥2
24𝐸𝐼(𝑥2 − 4𝑥𝐿 + 6𝐿2) +
𝑀𝑏𝑥2
𝐸𝐼 (2)
The cantilevered beam is assumed to have a depth of 9m as shown in FIGURE 1(b). The stiffness was then
calculated using the parallel axis theorem. A model was created to visualise the deflected shape and optimised the
applied moment MB to an appropriate value. In FIGURE 1(d) it was found that zero deflection at the free end of the
cantilever occurred when the end moment was half the support moment, MB = 0.5MA. Further, through trial and error
the sagging and hogging deflections were minimised, at a value of MB = 0.535MA. The resulting deflections were -
295.6 mm downward and 230.9 mm upward with a theoretical tensile value of 156.00 kN.
𝑀𝐵 = 0.535𝑀𝐴 = 0.535 × 2624 = 1403 𝑘𝑁𝑚 (3)
T =MB
9m=
1404 kNm
9m= 156.00 kN (4)
DESIGN AIMS
Deflection
The key parameter in the design was to limit the deflections experienced in the 54m cantilever. The process
involved modelling a singular column section and optimising the structure with cable elements to effectively reduce
the deflections. Once the deflections were satisfied, the stresses were checked and a buckling analysis was done. The
structure was then copied every 10° about the vertical axis to complete the model. The guide for acceptable deflections
is stated in AS1170.0 as EQUATION 5;
𝛿 =𝐿
120=
54
120= 0.45𝑚 (5)
Buckling Analysis
Perfect Euler The column was assumed to be a vertical cantilever with restraints at the top to be free and the bottom to be
translation and rotation fixed. The buckling length of the column was assumed to be half in EQUATION 6:
𝑃 =
𝜋2𝐸𝐼
4𝐿2 =𝜋2×200000×8.32×109
4×(32000)2 = 4010 𝑘𝑁 (6)
Strand7 – Linear Buckling Analysis The first mode of buckling was done with no gravity and then gravity applied. The eigenvalue and critical buckling
loads were found by strand7 using EQUATION 7.
𝑃𝑎𝑝𝑝𝑙𝑖𝑒𝑑 × 𝜆 = Pcrit (7)
Earthquake Analysis For a transient solver with damping, the global matrix equation is listed as EQUATION 8 below where M, C, and
K are the mass, damping and stiffness matrices respectively. Mrg(t) represents the external force (base acceleration)
acting on the mass where r is an arbitrary vector and g(t) is the earthquake acceleration.
𝑀�̈� + 𝐶�̇� + 𝐾𝑈 = 𝑀𝑟𝑔(𝑡) (8)
Before applying an earthquake, the structure was observed to be oscillating. To reduce oscillations, Rayleigh
damping was applied and the earthquake was run at 600 seconds after the initial vibrations were sufficiently damped.
It was found that the spectral response solver solutions produced mass participation factors of zero. The assumption
of a combination of modal shapes was not applicable hence the need for a Transient Dynamic Solver.

METHODOLOGY
Cylindrical Coordinates & Online Editor for 3D Model In Strand7, a single 2D column was created according to the nodes and elements in FIGURE 2. To create a 3D
model, the online editor tool was used to import the coordinates of the nodes for the columns and inner ring beams
from a spreadsheet. The nodes for the columns and ring beams were set every 10° and the appropriate beam elements
were selected as per (Guo et al., 2013). Using this process, the column section in FIGURE 2 was copied around a
central axis to form the completed 3D model of the stadium as shown in FIGURE 3.
FIGURE 2. Schematic of structural members
FIGURE 3. Section view
128 m
236 m
32 m
39 m
Modelling Limitations In this model, the roof was lighter than the actual stadium due to purlins that are supporting the Teflon roof not
being modelled. It could be expected that the required cable tension would be higher than the value obtained from
Strand7.
The double curvature of the roof was ignored to allow for a simple structure resembling a cantilever spanning 54m.
The flat roof allowed for each cantilever section to deflect equally. In an initial model, incorporating the curves in the
roof resulted in collapse.
The outer ring beams were not included in the model since they proved to be redundant in minimising deflections.
The columns are significantly large and the box girder connecting the beams provided sufficient restraint.
Cable Elements Cable elements required a non-linear analysis due to the deformed geometry of the cable. In the linear static
analysis, the load in the cable acted in the vertical direction only. In the nonlinear analysis the load is applied on the
deformed shape so it has orthogonal and parallel components to the cable. The effect of having the parallel component
is that axial shortening occurs. When running the nonlinear solver, the vertical deflection increased by 2mm and was
not significant.
To reduce deflections, the Cable Free Length attribute is a key parameter that can be modified to induce tension
in the cable elements. The Cable Free Length of the bottom chord was chosen to be 8m with the original cable length
as 8.55m. The Cable Free Length of the bottom inner ring beam was chosen to be 9.5m given the actual length is
11.5m.
The second method for inducing tension in cable members is applying point loads. Radial point loads were applied
which effectively mimicked the pre tension within the members as shown in FIGURE 1(a). Through this method, a
loading of 565 kN was applied which resulted in a similar deflection of 140mm. The reason this method was not
selected as it made the inner cables redundant as no load was being carried.
Linear Transient Dynamic Solver To model the stadium’s response to an earthquake, the El Centro earthquake data was used. The ground
acceleration was similar to that expressed in the Chinese standard GB 50011-2011 which specified 0.2g. The
acceleration vs time graphs for x, y and z were inputted as the base acceleration in the solver. The earthquake was
applied at 600 seconds after the initial vibrations were sufficiently damped.
NUMERICAL ANALYSIS
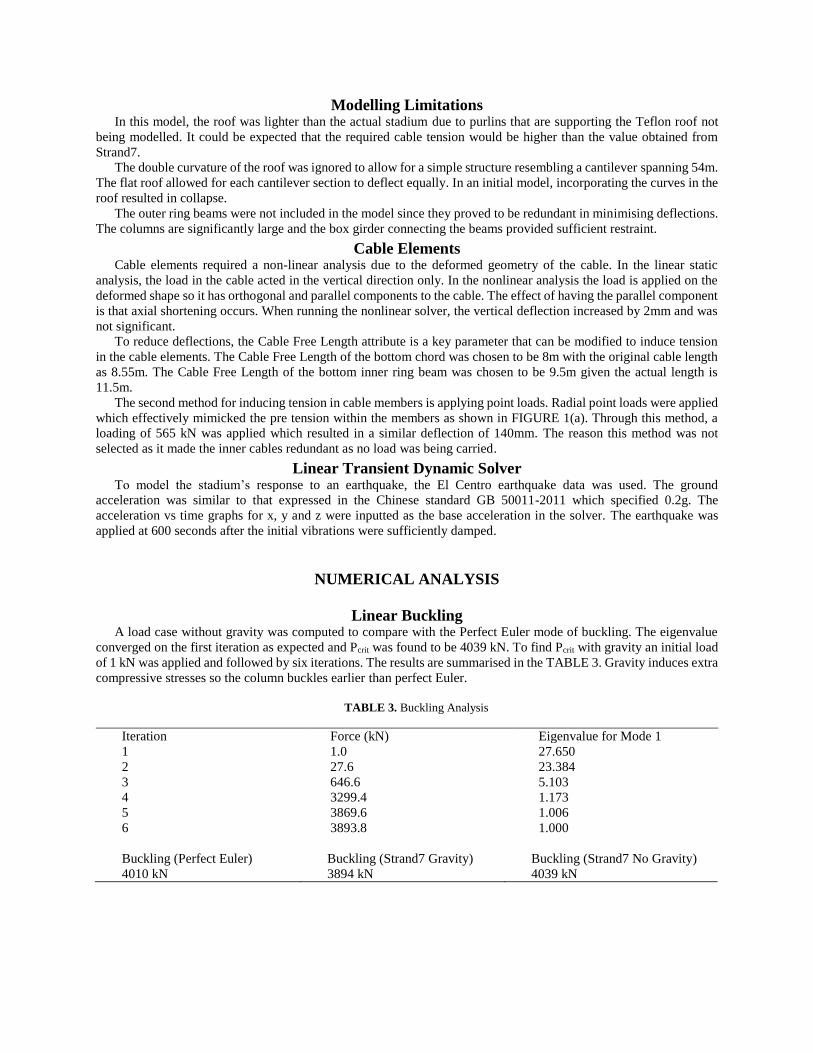
Linear Buckling A load case without gravity was computed to compare with the Perfect Euler mode of buckling. The eigenvalue
converged on the first iteration as expected and Pcrit was found to be 4039 kN. To find Pcrit with gravity an initial load
of 1 kN was applied and followed by six iterations. The results are summarised in the TABLE 3. Gravity induces extra
compressive stresses so the column buckles earlier than perfect Euler.
TABLE 3. Buckling Analysis
Iteration Force (kN) Eigenvalue for Mode 1
1 1.0 27.650
2 27.6 23.384
3 646.6 5.103
4 3299.4 1.173
5 3869.6 1.006
6 3893.8 1.000
Buckling (Perfect Euler) Buckling (Strand7 Gravity) Buckling (Strand7 No Gravity)
4010 kN 3894 kN 4039 kN

Linear Static Solver
FIGURE 4. Vertical displacements for linear static
FIGURE 5. Radial displacements for linear static
FIGURE 4 shows a maximum deflection of 133 mm downward under self-weight and post-tension, well under the
design limit of 450mm for serviceability. There is also an upward deflection of 131 mm induced by the tension in the
bottom chord cable. FIGURE 5 shows the inner ring contracting inwards 121 mm in equilibrium. This contraction is
due to the net resultant force of the inner ring in tension.

Linear Transient Dynamic Solver
FIGURE 6.Vertical displacement for Linear Transient Dynamic Solver
FIGURE 7. Vertical displacement El Centro
It was found no members reached yield capacity. The worst case base acceleration for El-Centro Earthquake
occurred in the vertical direction, other directions were not critical. Due to symmetry, the maximum displacement is
expected at the free end of the cantilever. FIGURE 6 shows this maximum beam displacement to be -109 mm in the
Z direction. Note that this is different from the node displacement in FIGURE 7 of -172 mm. The final node
displacements after the earthquake were equivalent to the linear static solver of 130 mm where the structure was in
equilibrium as shown in FIGURE 7. These are below the AS1170.0 limit of 450 mm.
A Non-Linear Transient Dynamic Solver would account for deformed geometry. However following an initial
simulation, this was found to be a time-consuming computation with non-convergence of time steps. A Linear
Transient Dynamic Solver was chosen as it was time efficient.
441 mm
- 172 mm
Final Displacement 130 mm
-300
-200
-100
0
100
200
300
400
500
600 610 620 630 640 650 660 670 680 690 700
No
de
Dis
pla
cem
ent
(mm
)
Time (seconds)

STRUCTURAL DESIGN
TABLE 4 compares theoretical loadings using AS4100 with the Strand7 results. The calculations for AS4100
theoretical maximums are listed in APPENDIX 1.
TABLE 4. Strand7 results compared with AS4100 Serviceability requirements
Loading Type Critical Member Size AS 4100 Maximum Strand7 Results
Flexure Top Chord 250x30 CHS Mi = 284 kNm M* = 226 kNm
Axial
Compression
Column 800x50 CHS φNc = 15624 kN Nc* = 490 kN
Axial Tension
(Cables)
Inner Ring 10 mm Cable φNt = 2142 kN Nt* = 1551 kN
Axial Tension
(Beams)
Top chord 250x30 CHS φNt = 5971 kN Nt* = 225 kN
Deflection Top Chord 250x30 CHS 𝛿 = 450 mm 𝛿* = 133 mm
Critical Buckling
Case
Column 800x50 CHS Pcrit = 3894 kN P* = 710 kN
CONCLUSIONS
The complex column structure was successfully simplified into a 2D model and rotated through 360° to create the
3D structure. The deflection of the cantilevers was the key criteria of design. Design aims for deflection, buckling and
earthquake were satisfied. Axial loads and bending moments were checked after deflection was satisfied. Net upward
deflections at the end of the cantilever were achieved with the use of tensioned cable elements and tapered out truss
geometry which allowed flexibility of the bottom chord of the truss. The Teflon roof membrane was an efficient choice
as a roof membrane as it fully restrained the top chord without contributing a large dead load. The combined action
of buckling and axial load proved to be critical for the columns. There was sufficient capacity to handle self-weight
and the El-Centro earthquake. The innovation of using tensioned cables in a bottom inner ring allowed for a long span
cantilever roof.
REFERENCES
CMC (2010). Code for Seismic Design of Buildings (GB50011-2010). China Ministry of Construction, China
Architecture and Building Press: Beijing, China. (in Chinese)
Frearson, A., 2011. De Zeen Magazine. [Online]. Available at: http://www.dezeen.com/2011/08/16/baoan-stadium-
by-gmp-architekten. [Accessed 12 May 2016].
Guo, Y., Tian, G., Wang, K., Zhang, B., & Zhao, S. (2011). Tensioning experiment on spoke structural roof of Bao'An
Stadium. Journal of Building Structures, 32(3), 1-10.
Guo, Y., Wang, K., Sun, W., Tian, G., & Zhang, B. (2013). Research on key structural design problems of the Bao'An
Stadium. Journal of Building Structures, 5 (1) 11-20.
Ronstan (2011). RPA112 Structural Cable Catalogue. Adelaide, Australia.
Standards Association of Australia (1998). AS 4100 Steel Structures, Sydney, Australia.
Standards Association of Australia (2002). AS1170.0 Structural Design Actions Part 0: General Principles. Sydney,
Australia.
Strand 7 (2011). ST7-1.40.35.3 Analysing Membrane Structures. Sydney, Australia
Strand 7 (2011). ST7-1.40.35.8 Modelling Tension-Only or Compression-Only Structural Members. Sydney, Australia
Tian, G., Guo, Y., Zhang, B., Wang, K., & Zhao, S. (2011). Experiment on sensitivity to construction tolerance and
research on tolerance control criteria in spoke structural roof of Bao’An Stadium. Journal of Building Structures,
32(3), 11-18.

APPENDIX 1
External Column
Axial Compression Member subjected to axial compression design as per AS 4100
Ag = 117810 mm2, I = 8.32x109 mm4, kf = 1, fyf = 320 MPa, fu = 440 MPa
For compression ϕ = 0.9 (Table 3.4)
Nominal Section Capacity (Clause 6.2.1)
𝜙𝑁𝑠 = 𝜙𝑘𝑓𝐴𝑔𝑓𝑦 = 0.9 × 1 × 117810 × 320 = 32,929.3 𝑘𝑁
Nominal Member Capacity (Clause 6.3.3)
𝜆𝑛 =𝑙𝑒
𝑟√𝑘𝑓√
𝑓𝑦
250=
30000
√(8.32×10⁹
117810)
√1 (√320
250) = 127.38
αb = -1.0 αc = 0.4605 (Table 6.3.3.3)
∴ 𝜙𝑁𝑐𝑥 = 0.4605 × 33,929.3 = 15624.4 𝑘𝑁
∴ 𝜙𝑁𝑠 = 33929.3 𝑘𝑁 𝑎𝑛𝑑 𝜙𝑁𝑐 = 15624.4 𝑘𝑁
Axial Tension Yield capacity (Clause 7.2)
𝜙𝑁𝑦 = 𝜙𝐴𝑔𝑓𝑦 = 0.9 × 117810 × 320 = 33,929.3 𝑘𝑁
Combined Actions
𝑍𝑒 =𝐼
𝑦𝑚𝑎𝑥=
8.32×10⁹
400= 20.8 × 10⁶𝑚𝑚3 𝑆 =
𝜋(𝑑𝑜𝑢𝑡4 −𝑑𝑖𝑛
4 )
32𝑑𝑜𝑢𝑡=
𝜋(8004−7004)
32×800= 20.8 × 10⁹𝑚𝑚3
Ze = min[S, 1.5Ze] =20.8x10⁹, kf = 1, fyf = 320 MPa, fu = 440 MPa, N*= 710 kN, M*= 1298 kNm
𝑀𝑆 = 𝑓𝑦𝑍𝑒 = 320 × 20.8 × 106 = 6656 𝑘𝑁𝑚
Section capacity (Clause 8.3.2) and in – plane capacity (Clause 8.4.2.2)
𝜙𝑀𝑟 = 𝜙𝑀𝑠 (1 −𝑁∗
𝜙𝑁𝑠
) = 0.9 × 6656 (1 −710
33929.3) = 5865 𝑘𝑁𝑚
𝜙𝑀𝑖 = 𝜙𝑀𝑠 (1 −𝑁∗
𝜙𝑁𝑐
) = 0.9 × 6656 (1 −710
15624.4) = 5718.2 𝑘𝑁𝑚
SATSIFACTORY
Top Chord
Axial Compression Member subjected to axial compression design as per AS 4100
Ag = 20734.5 mm+2, I = 1.2778x108 mm4, kf = 1, fyf = 320 MPa, fu = 440 MPa
For compression ϕ = 0.9 (Table 3.4)
Nominal Section Capacity (Clause 6.2.1)
𝜙𝑁𝑠 = 𝜙𝑘𝑓𝐴𝑔𝑓𝑦 = 0.9 × 1 × 20734.5 × 320 = 5971 𝑘𝑁
Nominal Member Capacity (Clause 6.3.3)
𝜆𝑛 =𝑙𝑒
𝑟√𝑘𝑓√
𝑓𝑦
250=
8630
√(1.2778×10⁸
20734.5)
√1 (√320
250) = 124
αb = -1.0 αc = 0.476 (Table 6.3.3.3)
∴ 𝜙𝑁𝑐𝑥 = 0.476 × 5971 = 2842.2 𝑘𝑁
∴ 𝜙𝑁𝑠 = 5971 𝑘𝑁 𝑎𝑛𝑑 𝜙𝑁𝑐 = 2842.2 𝑘𝑁
Axial Tension Yield capacity (Clause 7.2)
𝜙𝑁𝑦 = 𝜙𝐴𝑔𝑓𝑦 = 0.9 × 20734.5 × 320 = 5971 𝑘𝑁
Combined Actions
𝑍𝑒 =𝐼
𝑦𝑚𝑎𝑥=
1.2778×10⁸
125= 1022 × 103𝑚𝑚3 𝑆 =
𝜋(𝑑𝑜𝑢𝑡4 −𝑑𝑖𝑛
4 )
32𝑑𝑜𝑢𝑡=
𝜋(2504−1904)
32×250= 1022 × 103𝑚𝑚3
Ze = min[S, 1.5Ze] =1022x103, kf = 1, fyf = 320 MPa, fu = 440 MPa, N*= 225 kN, M*= 226 kNm
𝑀𝑆 = 𝑓𝑦𝑍𝑒 = 320 × 1022 × 103 = 327 𝑘𝑁𝑚

Section capacity (Clause 8.3.2) and in – plane capacity (Clause 8.4.2.2)
𝜙𝑀𝑟 = 𝜙𝑀𝑠 (1 −𝑁∗
𝜙𝑁𝑠
) = 0.9 × 327 (1 −225
5971) = 290 𝑘𝑁𝑚
𝜙𝑀𝑖 = 𝜙𝑀𝑠 (1 −𝑁∗
𝜙𝑁𝑐
) = 0.9 × 327 (1 −225
2842.2) = 284 𝑘𝑁𝑚
SATISFACTORY
Box Girder
Axial Compression Member subjected to axial compression design as per AS 4100
Ag = 20000 mm2, Ix = 1.667x107 mm4, Iy = 6.667x107 mm4, kf = 1, fyf = 320 MPa, fu = 440 MPa
For compression ϕ = 0.9 (Table 3.4)
Nominal Section Capacity (Clause 6.2.1) X AXIS
𝜙𝑁𝑠 = 𝜙𝑘𝑓𝐴𝑔𝑓𝑦 = 0.9 × 1 × 20000 × 320 = 5760 𝑘𝑁
Nominal Member Capacity (Clause 6.3.3)
𝜆𝑛𝑥 =𝑙𝑒
𝑟√𝑘𝑓√
𝑓𝑦
250=
4243
√(1.667×10⁷
20000)
√1 (√320
250) = 5.76
αb = -1.0 αc = 1 (Table 6.3.3.3)
∴ 𝜙𝑁𝑐𝑥 = 𝜙𝑁𝑠𝑥 = 5760 𝑘𝑁
Y AXIS
𝜆𝑛𝑦 =𝑙𝑒
𝑟√𝑘𝑓√
𝑓𝑦
250=
4243
√(6.667×10⁷
20000)
√1 (√320
250) = 83.14
αb = -1.0
αc = 0.7885 (Table 6.3.3.3)
∴ 𝜙𝑁𝑐𝑦 = 0.7885 × 5760 = 4541.76 𝑘𝑁
∴ 𝜙𝑁𝑠 = 5760 𝑘𝑁, 𝜙𝑁𝑐𝑥 = 5760 𝑘𝑁 𝑎𝑛𝑑 𝜙𝑁𝑐𝑦 = 4541.76 𝑘𝑁
Axial Tension Yield capacity (Clause 7.2)
𝜙𝑁𝑦 = 𝜙𝐴𝑔𝑓𝑦 = 0.9 × 20000 × 320 = 5760 𝑘𝑁
Combined Actions
𝑍𝑒𝑥 =𝐼
𝑦𝑚𝑎𝑥=
1.667×10⁷
50= 333 × 103𝑚𝑚3 𝑍𝑒𝑦 =
𝐼
𝑦𝑚𝑎𝑥=
6.667×10⁷
100= 667 × 103𝑚𝑚3
𝑆𝑥 =𝑏ℎ2
6=
200×1002
6= 333.3 × 10³𝑚𝑚3 𝑆𝑦 =
𝑏2ℎ
6=
2002×100
6= 666.7 × 10³𝑚𝑚3
Zex = min[S, 1.5Ze] =333x103, Zey = min[S, 1.5Ze] =666.7 x10³ kf = 1, fyf = 320 MPa, fu = 440 MPa, N*= 12.8 kN,
M*= 5.22 kNm
𝑀𝑆𝑥 = 𝑓𝑦𝑍𝑒 = 320 × 333 × 103 = 107 𝑘𝑁𝑚
Section capacity (Clause 8.3.2) and in – plane capacity (Clause 8.4.2.2)
𝜙𝑀𝑟 = 𝜙𝑀𝑠 (1 −𝑁∗
𝜙𝑁𝑠
) = 0.9 × 10⁷ (1 −12.8
5760) = 96 𝑘𝑁𝑚
𝜙𝑀𝑖 = 𝜙𝑀𝑠 (1 −𝑁∗
𝜙𝑁𝑐
) = 0.9 × 10⁷ (1 −12.8
5760) = 96 𝑘𝑁𝑚
SATSIFACTORY
Vertical Truss Member
Axial Compression Member subjected to axial compression design as per AS 4100
Ag = 12252.2 mm2, I = 2.33x108 mm4, kf = 1, fyf = 320 MPa, fu = 440 MPa
For compression ϕ = 0.9 (Table 3.4)
Nominal Section Capacity (Clause 6.2.1)
𝜙𝑁𝑠 = 𝜙𝑘𝑓𝐴𝑔𝑓𝑦 = 0.9 × 1 × 12252.2 × 320 = 3528.6 𝑘𝑁
Nominal Member Capacity (Clause 6.3.3) assume largest length 16245mm
𝜆𝑛𝑥 =𝑙𝑒
𝑟√𝑘𝑓√
𝑓𝑦
250=
16245
√(2.33×10⁸
12252.2)
√1 (√320
250) = 1

αb = -1.0 αc = 1 (Table 6.3.3.3)
∴ 𝜙𝑁𝑐𝑥 = 𝜙𝑁𝑠𝑥 = 3528.6 𝑘𝑁
Axial Tension Yield capacity (Clause 7.2)
𝜙𝑁𝑦 = 𝜙𝐴𝑔𝑓𝑦 = 0.9 × 12252.2 × 320 = 3528.6 𝑘𝑁
Combined Actions
𝑍𝑒 =𝐼
𝑦𝑚𝑎𝑥=
2.33×10⁸
200= 1165 × 103𝑚𝑚3 𝑆 =
𝜋(𝑑𝑜𝑢𝑡4 −𝑑𝑖𝑛
4 )
32𝑑𝑜𝑢𝑡=
𝜋(4004−3804)
32×400= 1165 × 103𝑚𝑚3
Zex = min[S, 1.5Ze] =1165x103, kf = 1, fyf = 320 MPa, fu = 440 MPa, N*= 14 kN, M*= 100 kNm
𝑀𝑆𝑥 = 𝑓𝑦𝑍𝑒 = 320 × 1165 × 103 = 373 𝑘𝑁𝑚
Section capacity (Clause 8.3.2) and in – plane capacity (Clause 8.4.2.2)
𝜙𝑀𝑟 = 𝜙𝑀𝑠 (1 −𝑁∗
𝜙𝑁𝑠
) = 0.9 × 373 (1 −14
3528.6) = 334 𝑘𝑁𝑚
𝜙𝑀𝑖 = 𝜙𝑀𝑠 (1 −𝑁∗
𝜙𝑁𝑐
) = 0.9 × 373 (1 −14
3528.6) = 334 𝑘𝑁𝑚
SATSIFACTORY
Inner Ring Cable
Axial Tension For a 50mm diameter ACS4 structural cable fyf = 1212 MPa (Ronstan, 2011)
Yield capacity (Clause 7.2)
𝜙𝑁𝑦 = 𝜙𝐴𝑔𝑓𝑦 = 0.9 × 1964 × 1212 = 2142 𝑘𝑁
Bottom Chord
Axial Compression Member subjected to axial compression design as per AS 4100
Ag = 3063.05 mm2, I = 1.457x107 mm4, kf = 1, fyf = 320 MPa, fu = 440 MPa
For compression ϕ = 0.9 (Table 3.4)
Nominal Section Capacity (Clause 6.2.1)
𝜙𝑁𝑠 = 𝜙𝑘𝑓𝐴𝑔𝑓𝑦 = 0.9 × 1 × 3063.05 × 320 = 882 𝑘𝑁
Nominal Member Capacity (Clause 6.3.3)
𝜆𝑛 =𝑙𝑒
𝑟√𝑘𝑓√
𝑓𝑦
250=
8550
√(1.457×10⁷
3063.05)
√1 (√320
250) = 140
αb = -1.0 αc = 0.389 (Table 6.3.3.3)
∴ 𝜙𝑁𝑐𝑥 = 0.389 × 882 = 343 𝑘𝑁
∴ 𝜙𝑁𝑠 = 882 𝑘𝑁 𝑎𝑛𝑑 𝜙𝑁𝑐 = 343 𝑘𝑁
Axial Tension Yield capacity (Clause 7.2)
𝜙𝑁𝑦 = 𝜙𝐴𝑔𝑓𝑦 = 0.9 × 3063.05 × 320 = 882 𝑘𝑁
Combined Actions
𝑍𝑒 =𝐼
𝑦𝑚𝑎𝑥=
1.457×10⁷
100= 146 × 103𝑚𝑚3 𝑆 =
𝜋(𝑑𝑜𝑢𝑡4 −𝑑𝑖𝑛
4 )
32𝑑𝑜𝑢𝑡=
𝜋(2004−1904)
32×200= 146 × 103𝑚𝑚3
Ze = min[S, 1.5Ze] =146 x 107, kf = 1, fyf = 320 MPa, fu = 440 MPa, N*= 53.33 kN, M*= 30 kNm
𝑀𝑆 = 𝑓𝑦𝑍𝑒 = 320 × 146 × 103 = 47 𝑘𝑁𝑚
Section capacity (Clause 8.3.2) and in – plane capacity (Clause 8.4.2.2)
𝑀𝑟 = 𝜙𝑀𝑠 (1 −𝑁∗
𝜙𝑁𝑠
) = 0.9 × 47 (1 −53.33
882) = 40 𝑘𝑁𝑚
𝑀𝑖 = 𝜙𝑀𝑠 (1 −𝑁∗
𝜙𝑁𝑐
) = 0.9 × 47 (1 −53.33
343) = 35 𝑘𝑁𝑚
SATISFACTORY