transit market analysis - kcata comprehensive service analysis . transit market analysis . february...
TRANSCRIPT
KCATA COMPREHENSIVE SERVICE ANALYSIS Transit Market Analysis
February 17, 2011
Prepared for: Prepared by:
Kansas City Area Transportation Authority COMPREHENSIVE SERVICE ANALYSIS
Page i
TABLE OF CONTENTS
INTRODUCTION ..................................................................................................................... 1
STUDY AREA .......................................................................................................................... 1
EXISTING POPULATION AND EMPLOYMENT ........................................................................... 3
POPULATION AND EMPLOYMENT DENSITIES ......................................................................... 4
Population Densities .......................................................................................................... 5
Employment Densities ....................................................................................................... 5
POPULATION AND EMPLOYMENT TRENDS ........................................................................... 10
Population Changes ......................................................................................................... 10
Employment Changes ...................................................................................................... 11
TRANSIT DEPENDENT POPULATIONS ................................................................................... 17
Older adults ..................................................................................................................... 17
Youth Populations ........................................................................................................... 17
Minority Populations ....................................................................................................... 22
Low Income Households .................................................................................................. 22
Zero-Vehicle Households ................................................................................................. 27
Limited English Proficiency ............................................................................................... 27
RELATIVE TRANSIT PROPENSITY ........................................................................................... 30
SERVICE TO ACTIVITY CENTERS ............................................................................................ 33
TRAVEL PATTERNS ............................................................................................................... 37
Travel within KCMO ......................................................................................................... 37
All Trip Purposes ................................................................................................................... 37
Home-Based Work Trips ....................................................................................................... 39
Regional Travel Patterns .................................................................................................. 41
All Trip Purposes ................................................................................................................... 41
Home-Based Work Trips ....................................................................................................... 41
SUMMARY OF RESULTS ....................................................................................................... 44

Kansas City Area Transportation Authority COMPREHENSIVE SERVICE ANALYSIS
Page ii
LIST OF TABLES Table 1: Kansas City Existing Population and Employment by County (2008) ............................... 3 Table 2: Primary Languages of Limited English Proficiency (LEP) Populations ............................ 30 Table 3: Transit Propensity Populations and Factors .................................................................. 30 Table 4: Existing Activity Area Descriptions .................................................................................. 36 LIST OF FIGURES Figure 1: KCATA CSA Study Area—Kansas City, Missouri ............................................................... 2 Figure 2: Transit Supportive Population and Employment Densities ............................................ 4 Figure 3: 2008 Population Density (Households per Acre)—KCATA CSA Study Area .................... 6 Figure 4: 2008 Population Density (Households per Acre)—Downtown and Inner Core .............. 7 Figure 5: 2008 Employment Density (Jobs per Acre)—KCATA CSA Study Area ............................. 8 Figure 6: 2008 Employment Density (Jobs per Acre)—Downtown and Inner Core ....................... 9 Figure 7: KCATA CSA KCMO Service Area Population Growth by County* ................................. 10 Figure 8: Population Change—2002 to 2008—KCATA CSA Study Area ....................................... 12 Figure 9: Population Change—2000 to 2008—Downtown and Inner Core ................................. 13 Figure 10: KCATA CSA Study Area in KCMO: Employment Growth by County* ......................... 14 Figure 11: Employment Change—2002 to 2008—KCATA CSA Study Area .................................. 15 Figure 12: Employment Change—2002 to 2008—Downtown and Inner Core ............................ 16 Figure 13: Population 65 Years of Age and Older (2008)—KCATA CSA Study Area ..................... 18 Figure 14: Population 65 Years of Age and Older (2008)—Downtown and Inner Core ............... 19 Figure 15: Youth Population (2008)—KCATA CSA Study Area ...................................................... 20 Figure 16: Youth Population (2008)—Downtown and Inner Core ............................................... 21 Figure 17: Minority Populations (2008)—KCATA CSA Study Area ................................................ 23 Figure 18: Minority Populations (2008)—Downtown and Inner Core ......................................... 24 Figure 19: 2000 Median Household Income—KCATA CSA Study Area ........................................ 25 Figure 20: 2000 Median Household Income—Downtown and Inner Core .................................. 26 Figure 21: Zero Vehicle Households—2000 – KCATA CSA Study Area ......................................... 28 Figure 22: Zero Vehicle Households—2000 –Downtown and Inner Core .................................... 29 Figure 23: Limited English Proficiency Populations (2008)—KCATA CSA Study Area .................. 31 Figure 24: Limited English Proficiency Populations (2008)—Downtown and Inner Core ............ 32 Figure 25: Relative Transit Propensity – KCATA CSA Study Area .................................................. 34 Figure 26: Activity Areas – KCATA CSA Study Area ....................................................................... 35 Figure 27: KCATA CSA Study Area Overall Travel Patterns—All Trip Purposes ............................ 38 Figure 28: KCATA CSA Study Area Overall Travel Patterns—Home-Based Work Trips ................ 40 Figure 29: KCMO Regional Travel Patterns—All Trip Purposes .................................................... 42 Figure 30: KCMO Regional Travel Patterns—Home-Based Work Trips ........................................ 43
Kansas City Area Transportation Authority COMPREHENSIVE SERVICE ANALYSIS
Page 1
MARKET ANALYSIS INTRODUCTION Like all cities, Kansas City is constantly changing. In order to provide the best possible service, the Kansas City Area Transportation Authority (KCATA) must continually adjust and keep pace with those changes. The purpose of this market analysis is to examine the underlying conditions in Kansas City and assess the trends as they relate to the demand for transit service and the types of services that best match the demand. Specifically, the market analysis looked at: Population and employment, including recent trends. Socio-economic characteristics. The location of major activity centers. Travel patterns.
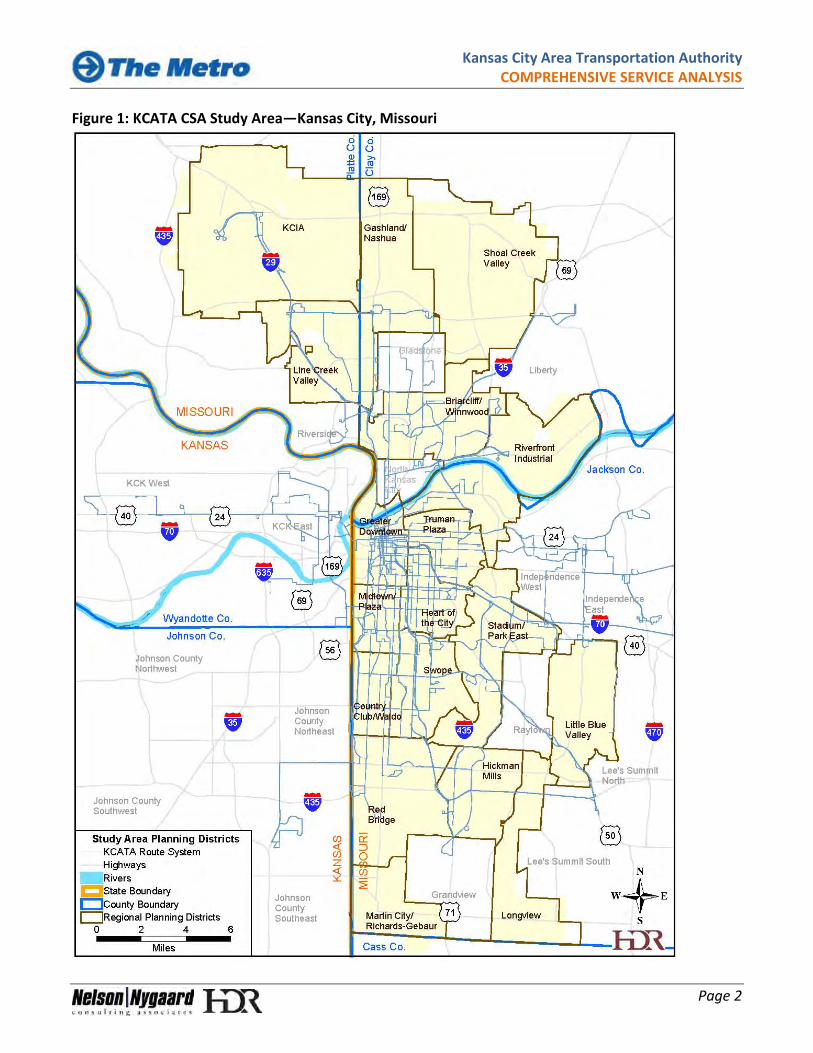
An important goal of the market analysis is to consider the implications of these factors on the demand for transit in Kansas City, Missouri (KCMO), and broadly gauge the types of transit changes that could better serve the existing and emerging demand. This information will be used in subsequent phases of the Comprehensive Service Analysis (CSA) to inform the design of transit service improvements. STUDY AREA The focus of the CSA is on KCATA service in KCMO, therefore, the market analysis also concentrates on socio-economic and demographic trends within KCMO. In addition, because KCMO service also operates into or through the “enclave” cities of Gladstone, North Kansas City, Raytown, Riverside, and Grandview, the market analysis also includes these communities. Combined these areas are the “KCATA CSA study area”. The CSA service area straddles four counties: Clay, Platte, Jackson and Cass. The four counties are geographically divided by the Missouri River with Clay and Platte located north of the river and Jackson and Cass located south of the river. Of the four counties, Jackson County is home to most of the Kansas City area’s employment and population and is the focus of most of KCATA’s operations (see Figure 1). Conversely, a much smaller portion of the CSA study area is in Cass County. Kansas City’s Planning and Development Department created 18 planning districts to group neighborhoods that share similar characteristics (see Figure 1); the market analysis also follows these planning districts to present and discuss the findings. In terms of transit demand, the planning districts broadly fall into four different types of operating environments:
Kansas City Area Transportation Authority COMPREHENSIVE SERVICE ANALYSIS
Page 2
Figure 1: KCATA CSA Study Area—Kansas City, Missouri
Kansas City Area Transportation Authority COMPREHENSIVE SERVICE ANALYSIS
Page 3
Downtown Kansas City - the region’s major employment destination and the center of much of KCATA’s service.
An inner core that surrounds downtown and includes Truman Plaza, Heart of the City, and Midtown Plaza, plus North Kansas City. There is high transit demand throughout most of this area.
An “outer core” that consists of Country Club/Waldo, Swope, Stadium/Park East, Riverfront Industrial, and Briarcliff/Winnwood. Transit demand is generally lower in this area, but there are significant exceptions such as Country Club/Waldo and Swope.
Outer areas where population and employment levels are much lower and development patterns are much more suburban. These districts include, but are not limited to, Shoal Creek Valley, Line Creek Valley, KCIA, Red Bridge, Hickman Mills, and Martin City/Richards-Gebaur.
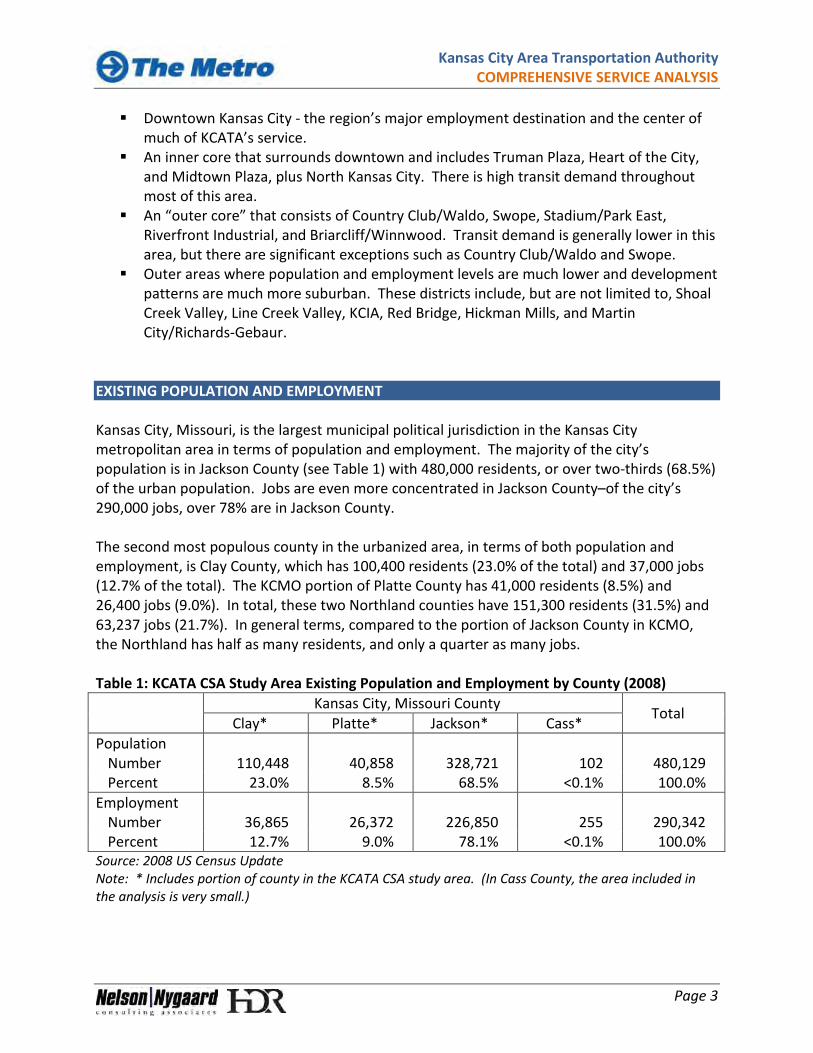
EXISTING POPULATION AND EMPLOYMENT Kansas City, Missouri, is the largest municipal political jurisdiction in the Kansas City metropolitan area in terms of population and employment. The majority of the city’s population is in Jackson County (see Table 1) with 480,000 residents, or over two-thirds (68.5%) of the urban population. Jobs are even more concentrated in Jackson County–of the city’s 290,000 jobs, over 78% are in Jackson County. The second most populous county in the urbanized area, in terms of both population and employment, is Clay County, which has 100,400 residents (23.0% of the total) and 37,000 jobs (12.7% of the total). The KCMO portion of Platte County has 41,000 residents (8.5%) and 26,400 jobs (9.0%). In total, these two Northland counties have 151,300 residents (31.5%) and 63,237 jobs (21.7%). In general terms, compared to the portion of Jackson County in KCMO, the Northland has half as many residents, and only a quarter as many jobs. Table 1: KCATA CSA Study Area Existing Population and Employment by County (2008)
Kansas City, Missouri County
Total Clay* Platte* Jackson* Cass*
Population Number 110,448 40,858 328,721 102 480,129 Percent 23.0% 8.5% 68.5% <0.1% 100.0%
Employment Number 36,865 26,372 226,850 255 290,342 Percent 12.7% 9.0% 78.1% <0.1% 100.0%
Source: 2008 US Census Update Note: * Includes portion of county in the KCATA CSA study area. (In Cass County, the area included in the analysis is very small.)
Kansas City Area Transportation Authority COMPREHENSIVE SERVICE ANALYSIS
Page 4
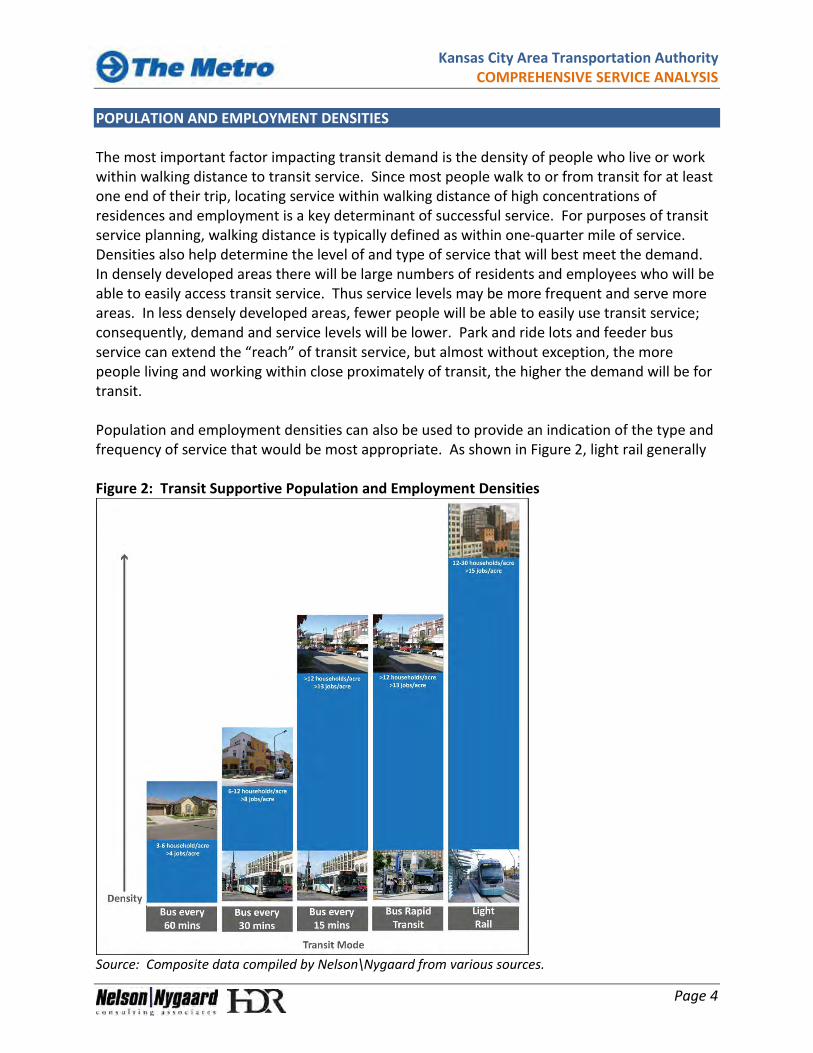
POPULATION AND EMPLOYMENT DENSITIES The most important factor impacting transit demand is the density of people who live or work within walking distance to transit service. Since most people walk to or from transit for at least one end of their trip, locating service within walking distance of high concentrations of residences and employment is a key determinant of successful service. For purposes of transit service planning, walking distance is typically defined as within one-quarter mile of service. Densities also help determine the level of and type of service that will best meet the demand. In densely developed areas there will be large numbers of residents and employees who will be able to easily access transit service. Thus service levels may be more frequent and serve more areas. In less densely developed areas, fewer people will be able to easily use transit service; consequently, demand and service levels will be lower. Park and ride lots and feeder bus service can extend the “reach” of transit service, but almost without exception, the more people living and working within close proximately of transit, the higher the demand will be for transit. Population and employment densities can also be used to provide an indication of the type and frequency of service that would be most appropriate. As shown in Figure 2, light rail generally Figure 2: Transit Supportive Population and Employment Densities
Source: Composite data compiled by Nelson\Nygaard from various sources.
Kansas City Area Transportation Authority COMPREHENSIVE SERVICE ANALYSIS
Page 5
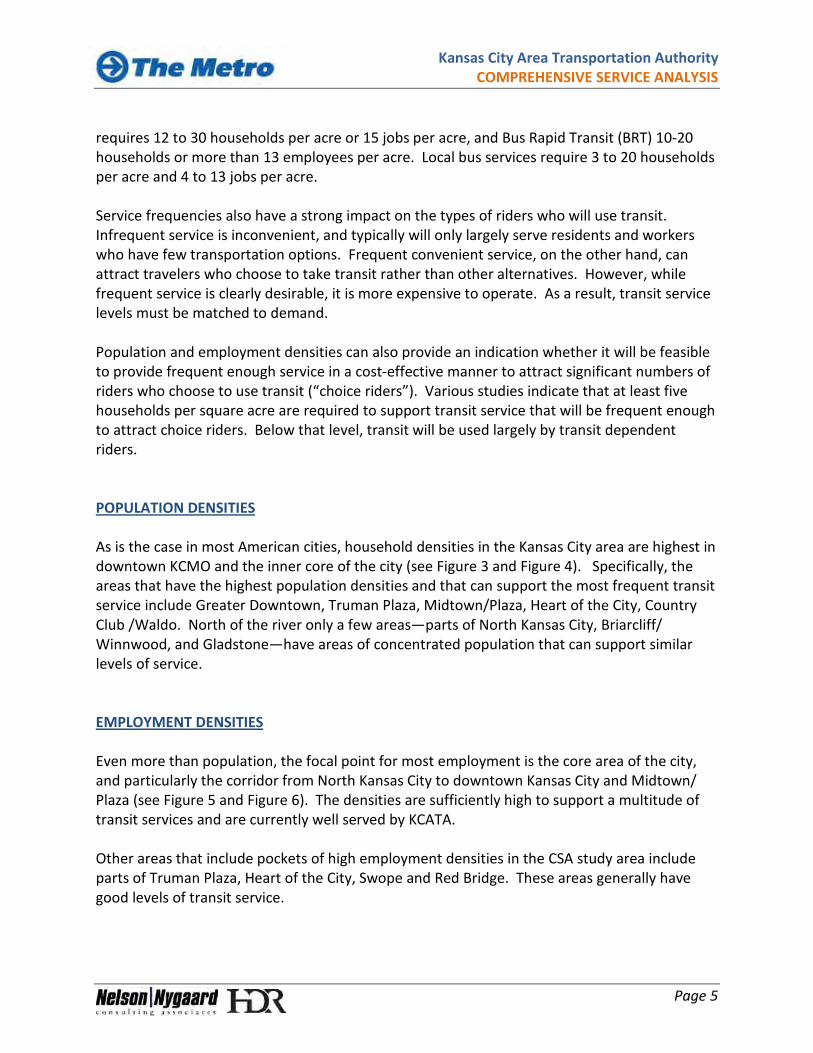
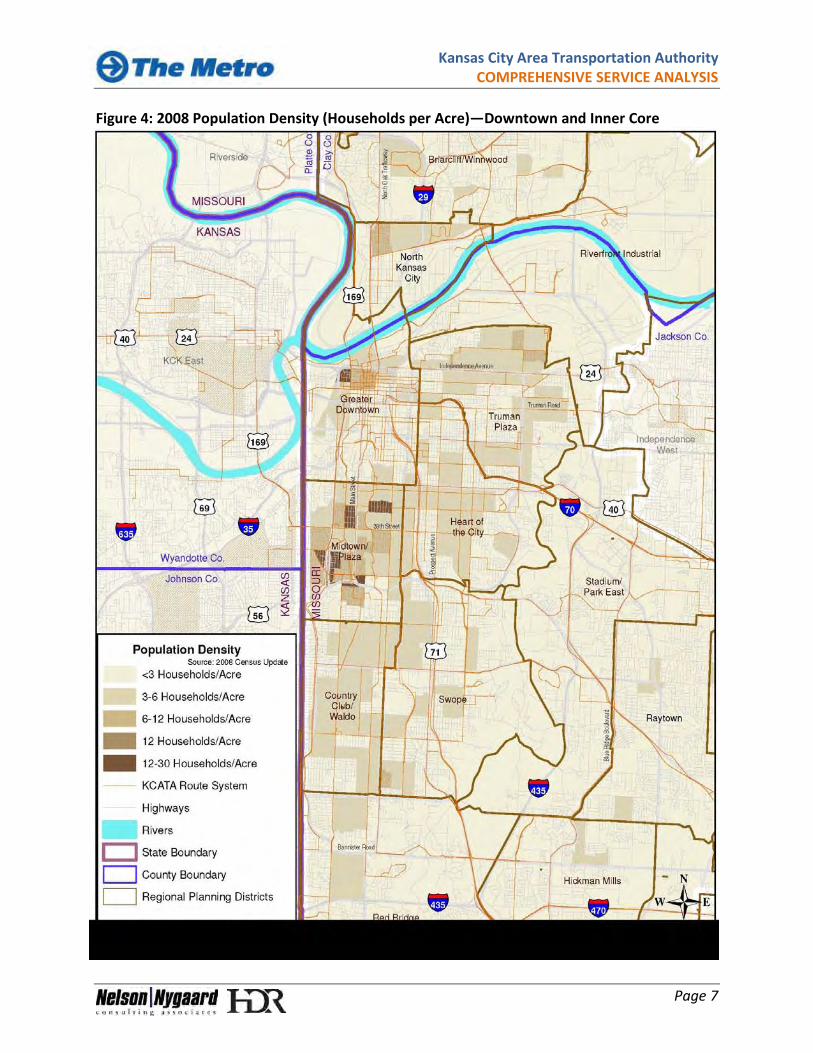
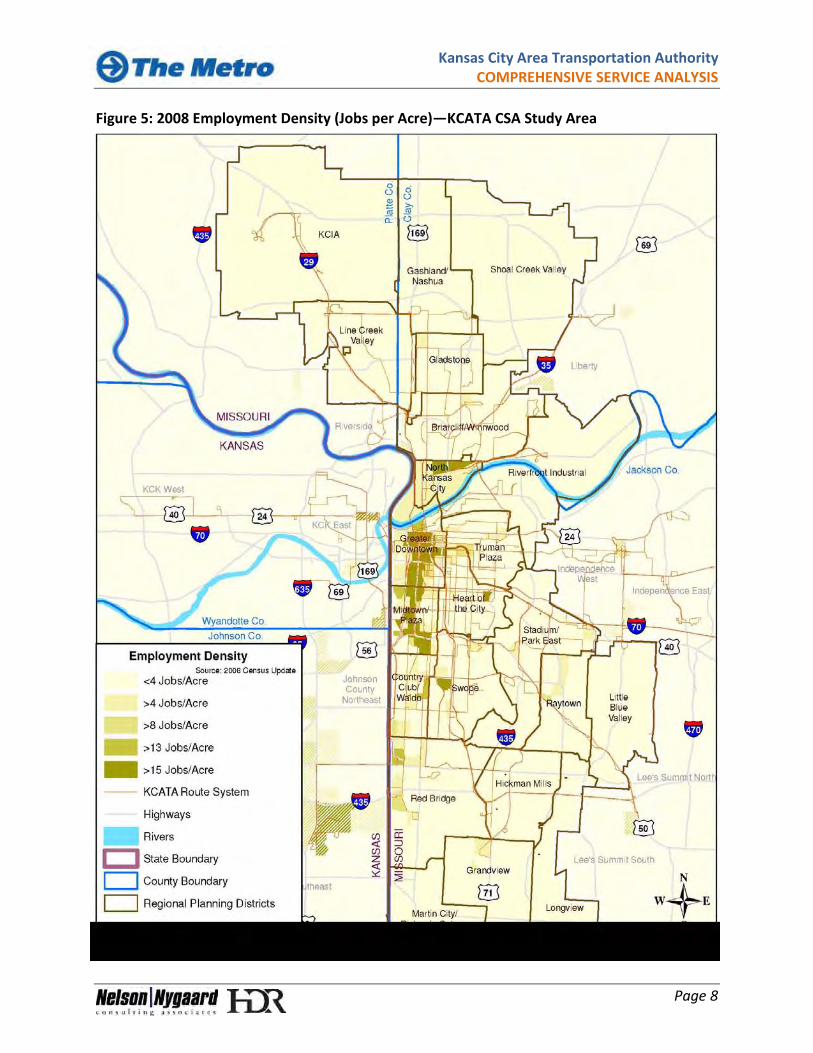
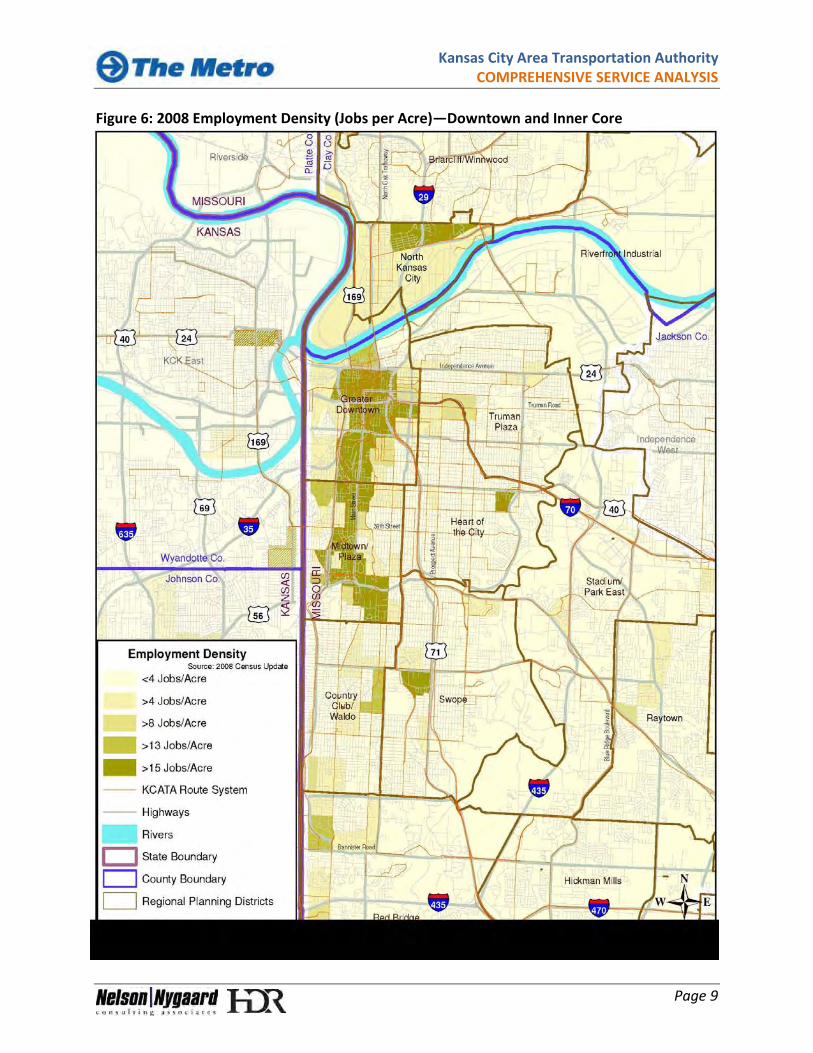
requires 12 to 30 households per acre or 15 jobs per acre, and Bus Rapid Transit (BRT) 10-20 households or more than 13 employees per acre. Local bus services require 3 to 20 households per acre and 4 to 13 jobs per acre. Service frequencies also have a strong impact on the types of riders who will use transit. Infrequent service is inconvenient, and typically will only largely serve residents and workers who have few transportation options. Frequent convenient service, on the other hand, can attract travelers who choose to take transit rather than other alternatives. However, while frequent service is clearly desirable, it is more expensive to operate. As a result, transit service levels must be matched to demand. Population and employment densities can also provide an indication whether it will be feasible to provide frequent enough service in a cost-effective manner to attract significant numbers of riders who choose to use transit (“choice riders”). Various studies indicate that at least five households per square acre are required to support transit service that will be frequent enough to attract choice riders. Below that level, transit will be used largely by transit dependent riders. POPULATION DENSITIES As is the case in most American cities, household densities in the Kansas City area are highest in downtown KCMO and the inner core of the city (see Figure 3 and Figure 4). Specifically, the areas that have the highest population densities and that can support the most frequent transit service include Greater Downtown, Truman Plaza, Midtown/Plaza, Heart of the City, Country Club /Waldo. North of the river only a few areas—parts of North Kansas City, Briarcliff/ Winnwood, and Gladstone—have areas of concentrated population that can support similar levels of service. EMPLOYMENT DENSITIES Even more than population, the focal point for most employment is the core area of the city, and particularly the corridor from North Kansas City to downtown Kansas City and Midtown/ Plaza (see Figure 5 and Figure 6). The densities are sufficiently high to support a multitude of transit services and are currently well served by KCATA. Other areas that include pockets of high employment densities in the CSA study area include parts of Truman Plaza, Heart of the City, Swope and Red Bridge. These areas generally have good levels of transit service.
Kansas City Area Transportation Authority COMPREHENSIVE SERVICE ANALYSIS
Page 6
Figure 3: 2008 Population Density (Households per Acre)—KCATA CSA Study Area
Kansas City Area Transportation Authority COMPREHENSIVE SERVICE ANALYSIS
Page 7
Figure 4: 2008 Population Density (Households per Acre)—Downtown and Inner Core
Kansas City Area Transportation Authority COMPREHENSIVE SERVICE ANALYSIS
Page 8
Figure 5: 2008 Employment Density (Jobs per Acre)—KCATA CSA Study Area
Kansas City Area Transportation Authority COMPREHENSIVE SERVICE ANALYSIS
Page 9
Figure 6: 2008 Employment Density (Jobs per Acre)—Downtown and Inner Core
Kansas City Area Transportation Authority COMPREHENSIVE SERVICE ANALYSIS
Page 10
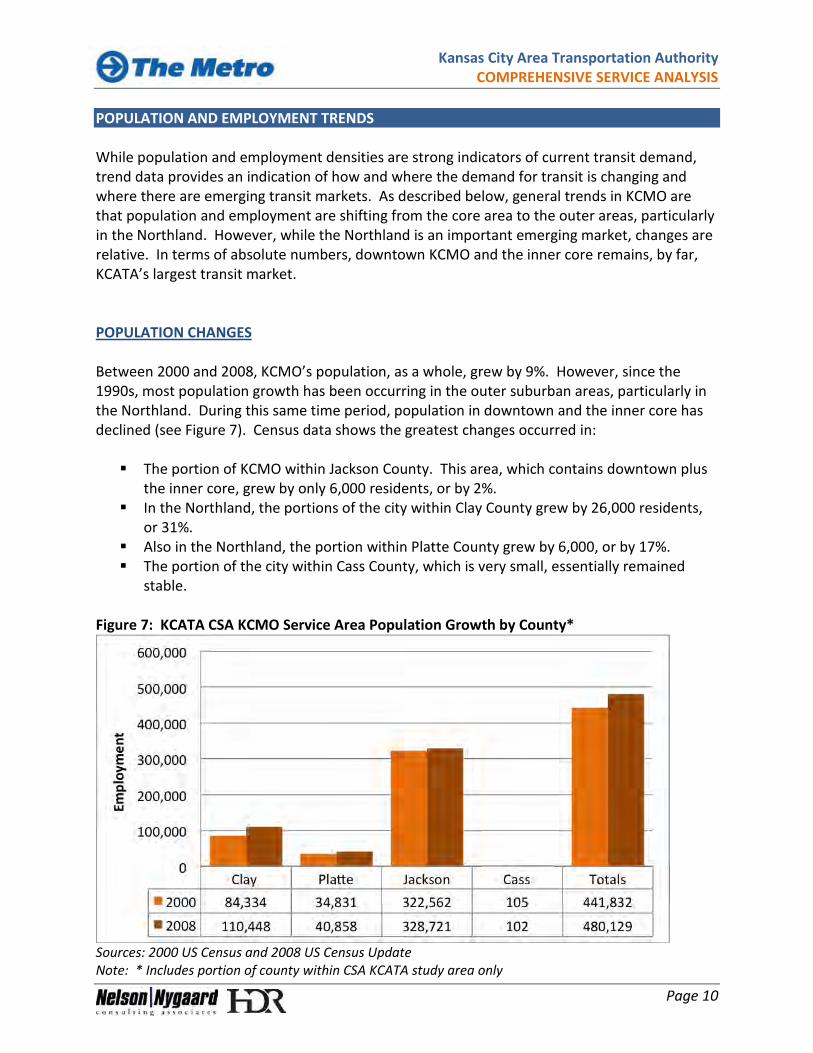
POPULATION AND EMPLOYMENT TRENDS While population and employment densities are strong indicators of current transit demand, trend data provides an indication of how and where the demand for transit is changing and where there are emerging transit markets. As described below, general trends in KCMO are that population and employment are shifting from the core area to the outer areas, particularly in the Northland. However, while the Northland is an important emerging market, changes are relative. In terms of absolute numbers, downtown KCMO and the inner core remains, by far, KCATA’s largest transit market. POPULATION CHANGES Between 2000 and 2008, KCMO’s population, as a whole, grew by 9%. However, since the 1990s, most population growth has been occurring in the outer suburban areas, particularly in the Northland. During this same time period, population in downtown and the inner core has declined (see Figure 7). Census data shows the greatest changes occurred in: The portion of KCMO within Jackson County. This area, which contains downtown plus
the inner core, grew by only 6,000 residents, or by 2%. In the Northland, the portions of the city within Clay County grew by 26,000 residents,
or 31%. Also in the Northland, the portion within Platte County grew by 6,000, or by 17%. The portion of the city within Cass County, which is very small, essentially remained
stable. Figure 7: KCATA CSA KCMO Service Area Population Growth by County*
Sources: 2000 US Census and 2008 US Census Update Note: * Includes portion of county within CSA KCATA study area only
Kansas City Area Transportation Authority COMPREHENSIVE SERVICE ANALYSIS
Page 11
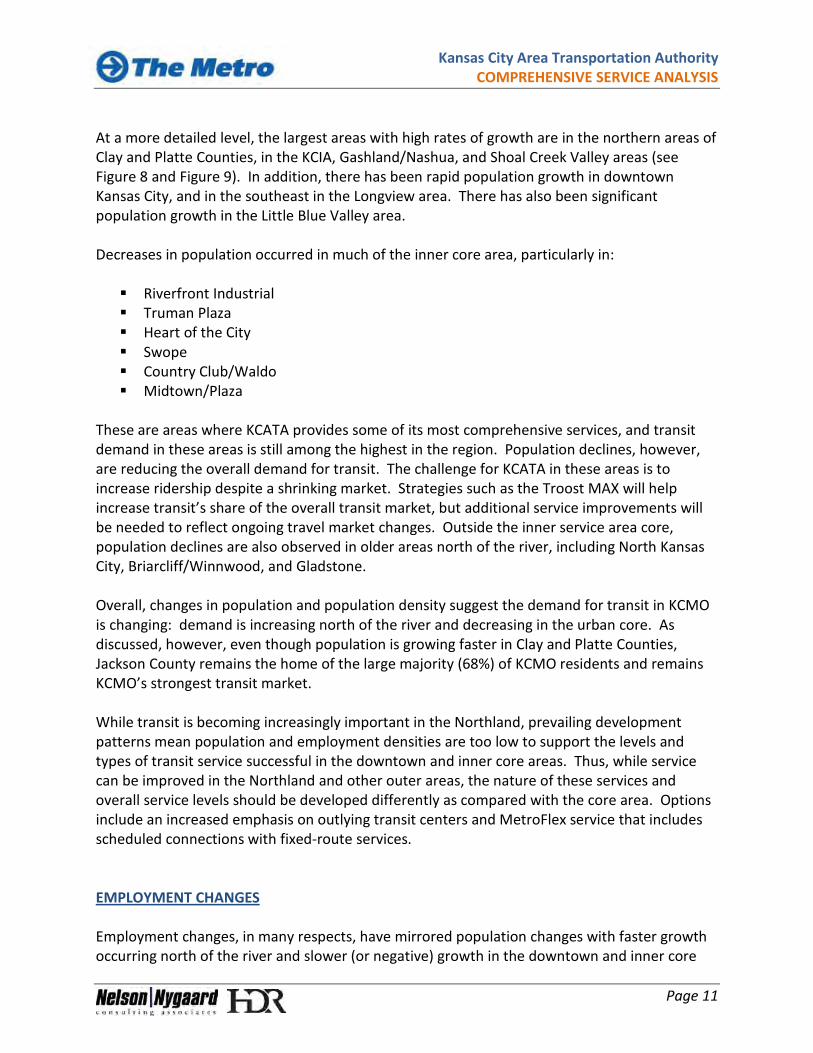
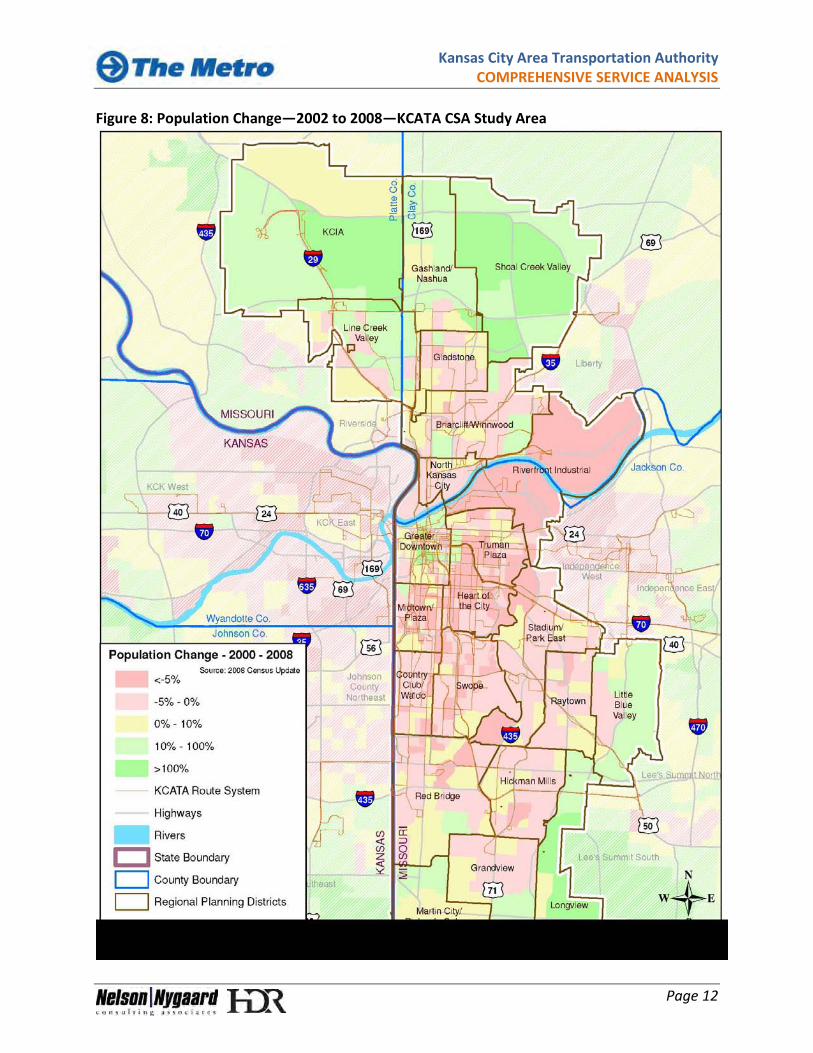
At a more detailed level, the largest areas with high rates of growth are in the northern areas of Clay and Platte Counties, in the KCIA, Gashland/Nashua, and Shoal Creek Valley areas (see Figure 8 and Figure 9). In addition, there has been rapid population growth in downtown Kansas City, and in the southeast in the Longview area. There has also been significant population growth in the Little Blue Valley area. Decreases in population occurred in much of the inner core area, particularly in: Riverfront Industrial Truman Plaza Heart of the City Swope Country Club/Waldo Midtown/Plaza
These are areas where KCATA provides some of its most comprehensive services, and transit demand in these areas is still among the highest in the region. Population declines, however, are reducing the overall demand for transit. The challenge for KCATA in these areas is to increase ridership despite a shrinking market. Strategies such as the Troost MAX will help increase transit’s share of the overall transit market, but additional service improvements will be needed to reflect ongoing travel market changes. Outside the inner service area core, population declines are also observed in older areas north of the river, including North Kansas City, Briarcliff/Winnwood, and Gladstone. Overall, changes in population and population density suggest the demand for transit in KCMO is changing: demand is increasing north of the river and decreasing in the urban core. As discussed, however, even though population is growing faster in Clay and Platte Counties, Jackson County remains the home of the large majority (68%) of KCMO residents and remains KCMO’s strongest transit market. While transit is becoming increasingly important in the Northland, prevailing development patterns mean population and employment densities are too low to support the levels and types of transit service successful in the downtown and inner core areas. Thus, while service can be improved in the Northland and other outer areas, the nature of these services and overall service levels should be developed differently as compared with the core area. Options include an increased emphasis on outlying transit centers and MetroFlex service that includes scheduled connections with fixed-route services. EMPLOYMENT CHANGES Employment changes, in many respects, have mirrored population changes with faster growth occurring north of the river and slower (or negative) growth in the downtown and inner core
Kansas City Area Transportation Authority COMPREHENSIVE SERVICE ANALYSIS
Page 12
Figure 8: Population Change—2002 to 2008—KCATA CSA Study Area
Kansas City Area Transportation Authority COMPREHENSIVE SERVICE ANALYSIS
Page 13
Figure 9: Population Change—2000 to 2008—Downtown and Inner Core
Kansas City Area Transportation Authority COMPREHENSIVE SERVICE ANALYSIS
Page 14
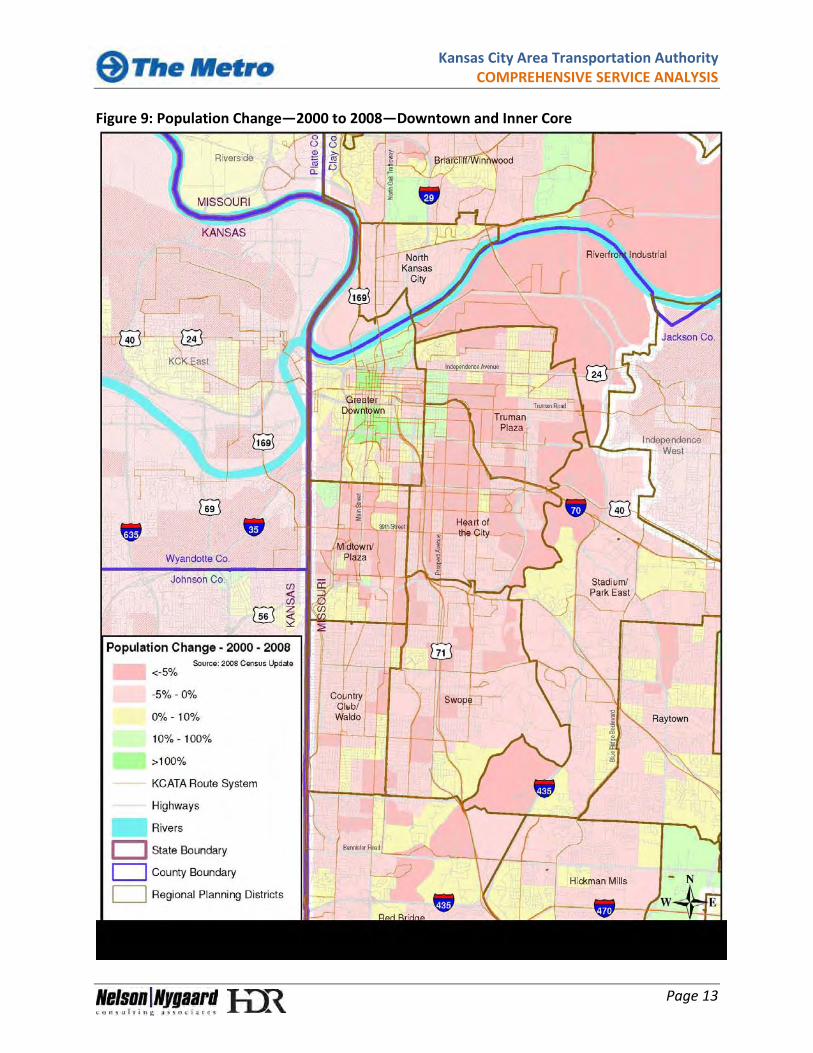
area. The pace of change for employment, however, was considerably slower than experienced for the population. Total employment in the KCATA CSA study area grew by 0.7% between 2002 and 2008. Employment changes by county (see Figure 10) show: Decrease of approximately 5,000 jobs (2.3%) in Jackson County. Increase of 3,000 jobs (9.7%) in Clay County. Increase of 4,000 jobs (18.3%) in Platte County.
Figure 10: KCATA CSA Study Area in KCMO: Employment Growth by County*
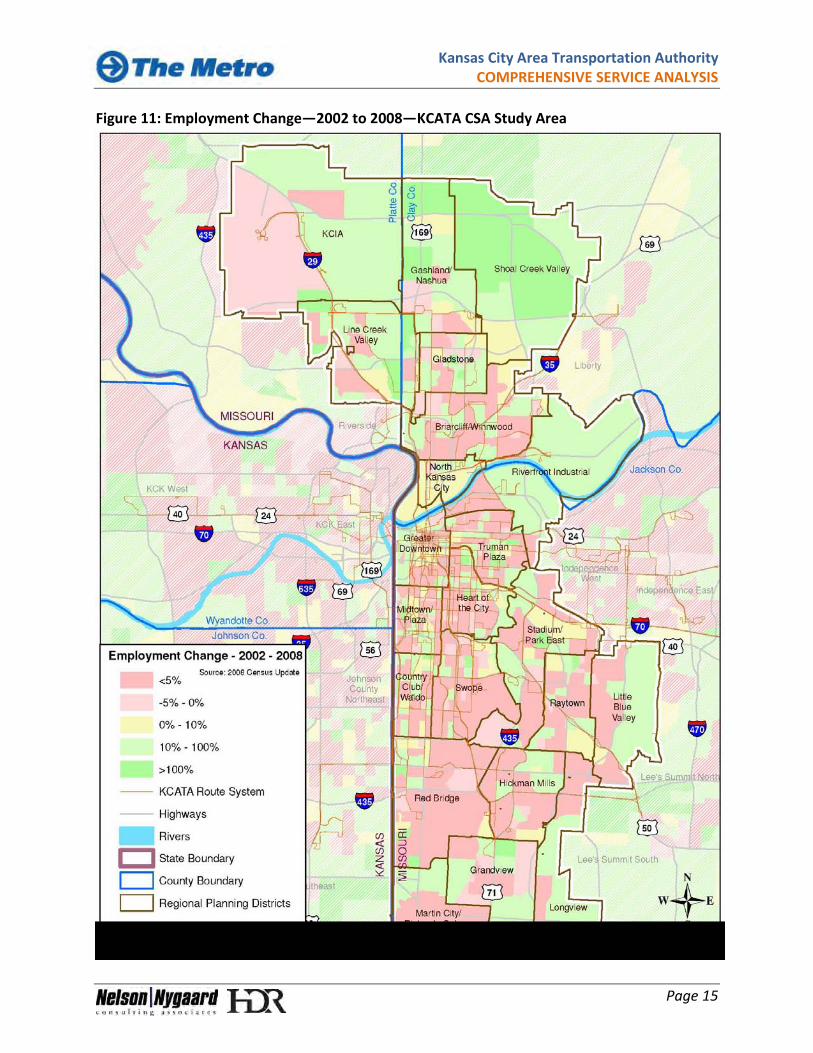
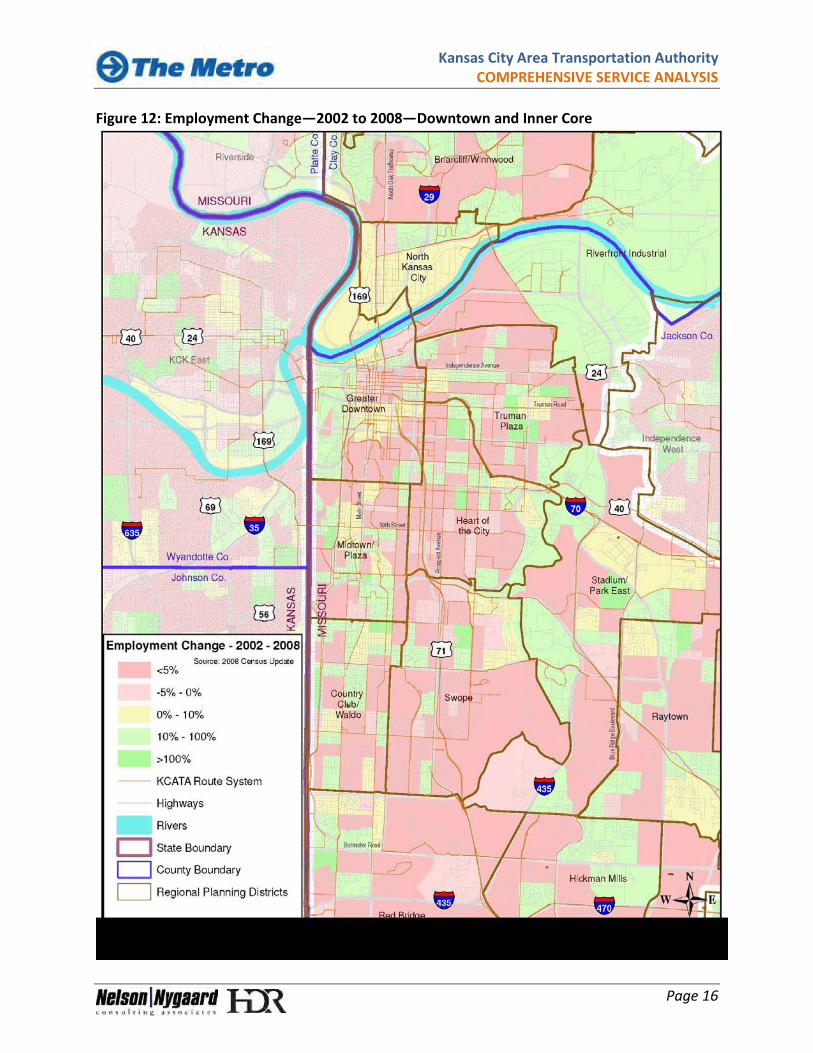
Sources: US Census LEHD, 2002 and 2008 *Includes portion of county in KCATA CSA Study Area only Consistent with changes in population, even with faster job growth occurring north of the river, Jackson County remains home to the large proportion of KCMO jobs (78%). In addition, while Jackson County as a whole lost jobs, some planning districts in downtown Kansas City gained jobs. Changes in employment are shown in Figure 11 and Figure 12 and include the following highlights: The greatest growth in employment included parts of Greater Downtown, and most
areas North of the River except Briarcliff/Winnwood, and Stadium/Park East. Employment was relatively stable in the Country Club/Waldo and Midtown/Plaza
districts, although some sub-sets in these areas gained or lost jobs. Decreases in employment occurred in most of the core area. Other areas that had an
overall net loss of jobs include Martin City/Richards-Gebaur, Red Bridge, Hickman Mills, and Briarcliff/Winnwood.
Employment trends also indicate that the demand for transit work trips in KCMO is changing. Job growth north of the river suggests an increase in the demand for transit, while declining employment in much of the downtown and inner core areas suggests softening demand.
Kansas City Area Transportation Authority COMPREHENSIVE SERVICE ANALYSIS
Page 15
Figure 11: Employment Change—2002 to 2008—KCATA CSA Study Area
Kansas City Area Transportation Authority COMPREHENSIVE SERVICE ANALYSIS
Page 16
Figure 12: Employment Change—2002 to 2008—Downtown and Inner Core
Kansas City Area Transportation Authority COMPREHENSIVE SERVICE ANALYSIS
Page 17
However, consistent with the population changes, Jackson County remains the home of the large majority of KCMO’s jobs. Thus, while there have been employment declines, Jackson County, and especially the downtown Kansas City – Country Club Plaza corridor, remains KCMO’s most important employment transit market. Due to the high concentrations of jobs, it also remains the area where transit can be most effective.
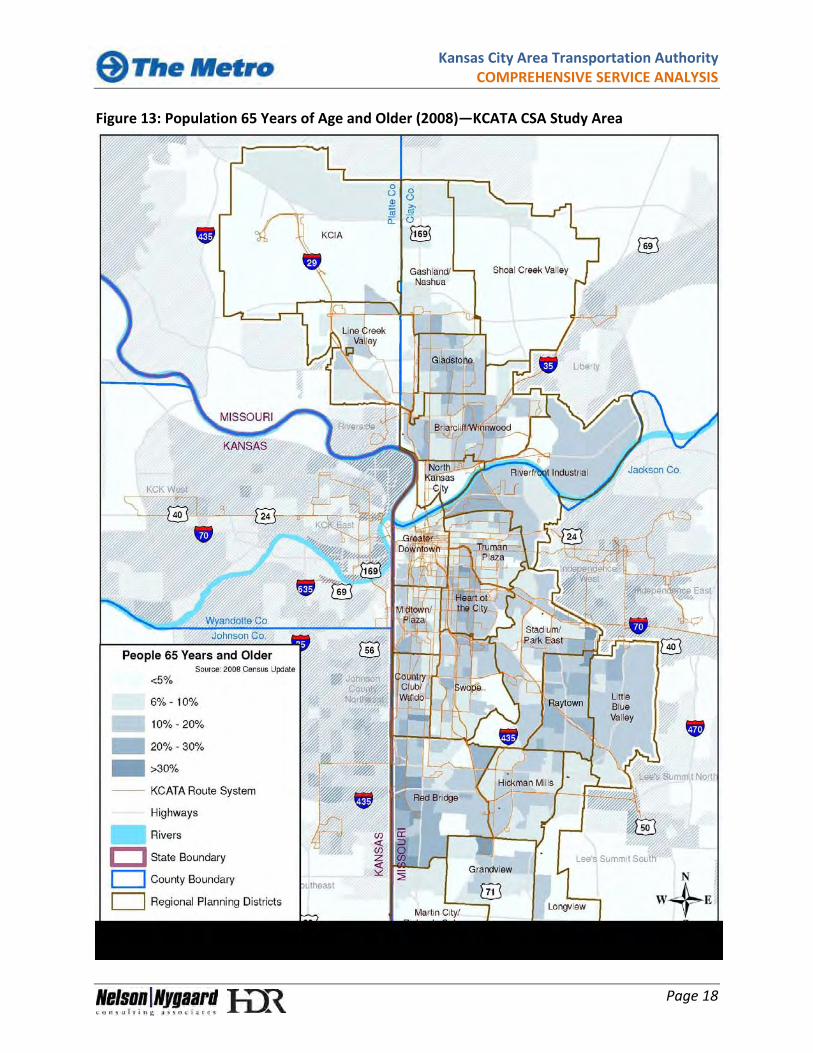
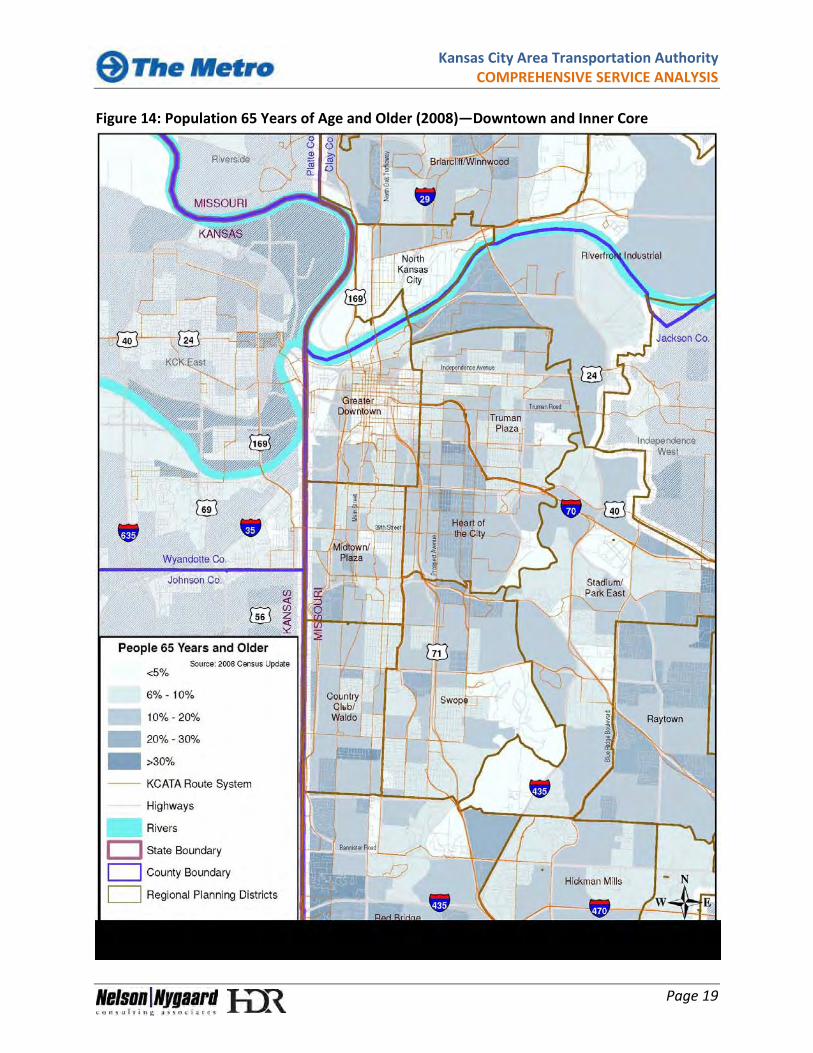
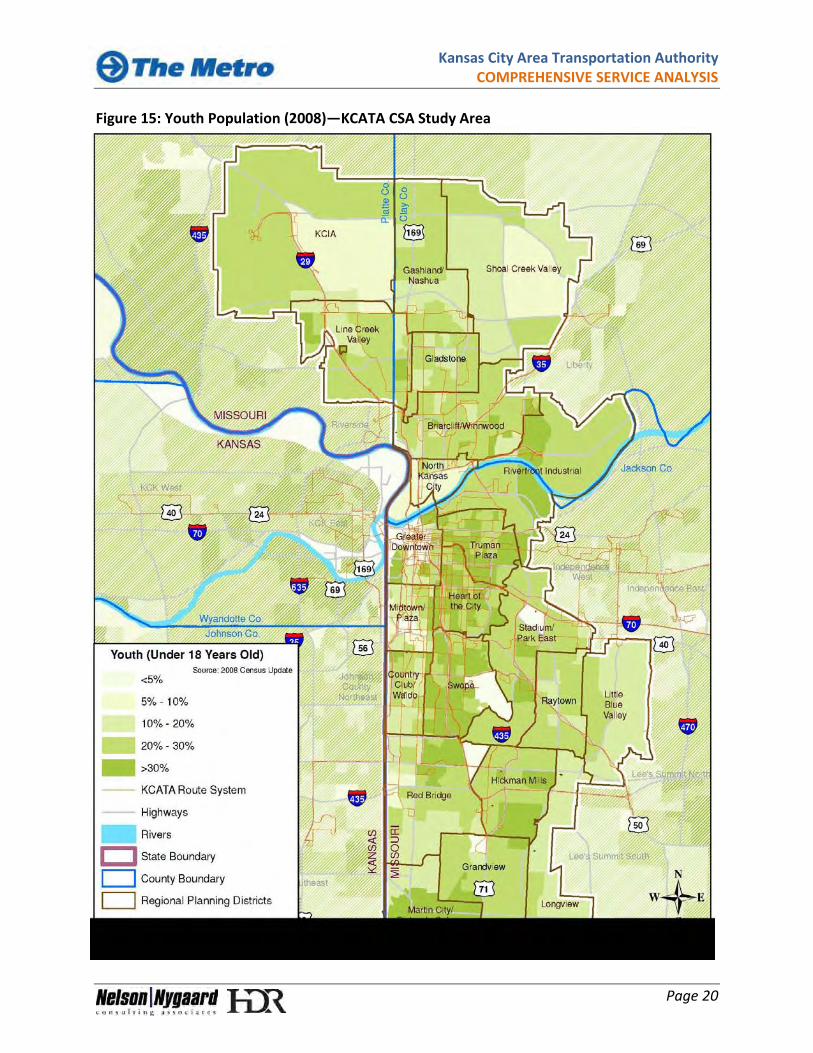
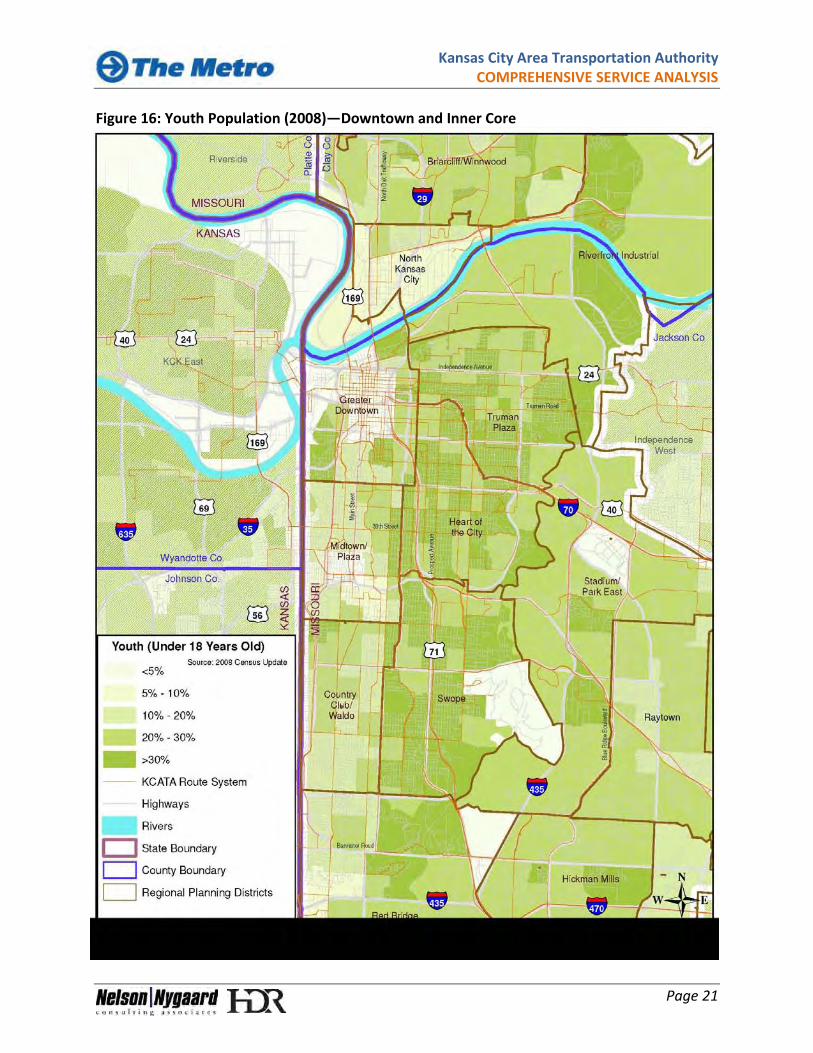
As employment shifts from the core area to the outer areas, especially in the Northland, the demand for transit services will follow. This is especially true for individuals living in the urban core whose commutes will need to follow the jobs. The most important areas for new transit service, therefore, include KCIA, Line Creek Valley, Shoal Creek Valley and Stadium/Park East. Lower density development, in these areas, however, means transit services will need to be designed differently, potentially with increased emphasis on service connections at transit hubs and increased use of flexible services. TRANSIT DEPENDENT POPULATIONS Certain groups, such as older adults, the young, minorities, low-income residents, households without vehicles, and those with limited English proficiency often use transit to a greater extent than other groups, as they lack access to a reliable vehicle or are unable to drive for other reasons. OLDER ADULTS Older adults, individuals aged 65 or more, typically have high rates of transit usage, as people become less comfortable driving as they age and/or have increasing mobility constraints due to income. Older adults typically use transit for non-work, locally oriented trips and they tend to travel outside of peak periods. Approximately 11% of the study area residents are aged 65 or more, and most of the study area has moderate to heavy concentrations of older adults (see Figure 13 and Figure 14). The highest concentration of older adults is in Red Bridge, parts of Country Club/Waldo, and Heart of the City. All of these areas are served by KCATA, except service currently does not extend to the southern portion of Red Bridge. Areas on the fringe of the city (such as KCIA, Shoal Creek Valley, and Martin City/Richards-Gebaur) have lower concentrations of older adults. YOUTH POPULATIONS Transit dependent youth populations are those individuals old enough to travel independently, but not old enough to drive. Consequently, they are typically frequent transit riders. As shown in Figure 15 and Figure 16, the areas that have the highest proportions of youths include:
Kansas City Area Transportation Authority COMPREHENSIVE SERVICE ANALYSIS
Page 18
Figure 13: Population 65 Years of Age and Older (2008)—KCATA CSA Study Area
Kansas City Area Transportation Authority COMPREHENSIVE SERVICE ANALYSIS
Page 19
Figure 14: Population 65 Years of Age and Older (2008)—Downtown and Inner Core
Kansas City Area Transportation Authority COMPREHENSIVE SERVICE ANALYSIS
Page 20
Figure 15: Youth Population (2008)—KCATA CSA Study Area
Kansas City Area Transportation Authority COMPREHENSIVE SERVICE ANALYSIS
Page 21
Figure 16: Youth Population (2008)—Downtown and Inner Core
Kansas City Area Transportation Authority COMPREHENSIVE SERVICE ANALYSIS
Page 22
Southern Martin City/Richards-Gebaur Northeastern and central Red Bridge Heart of the City Much of Swope Central Truman Plaza
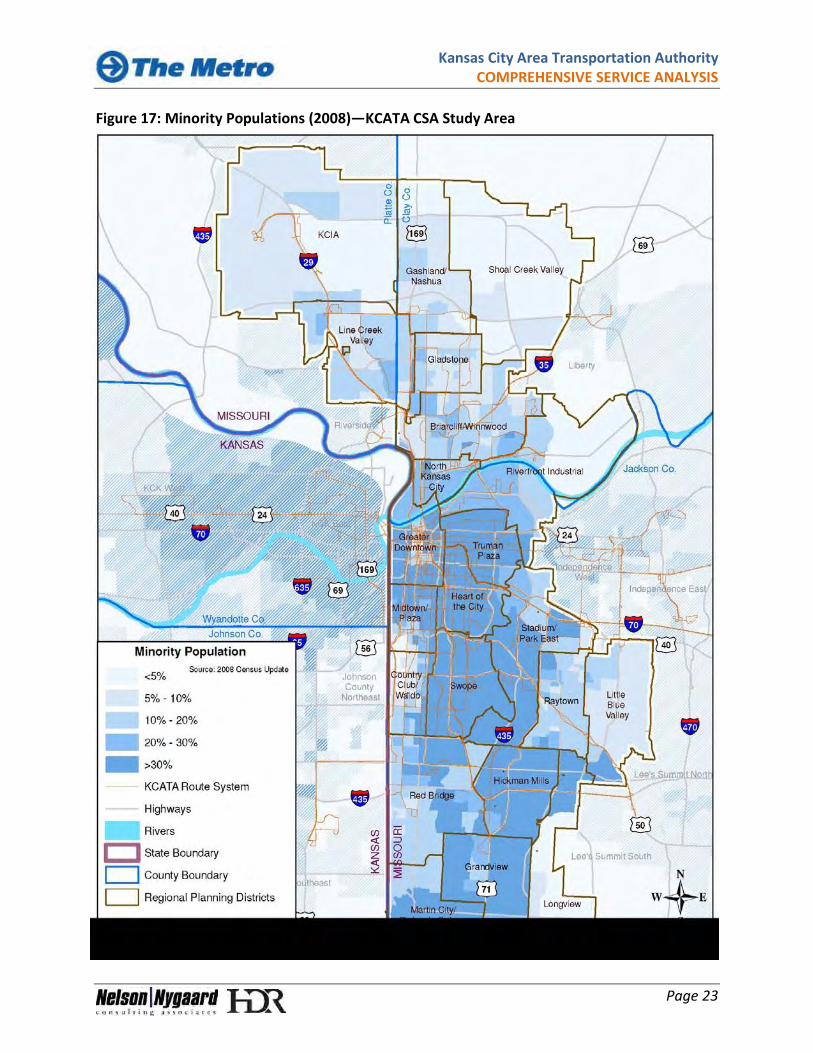
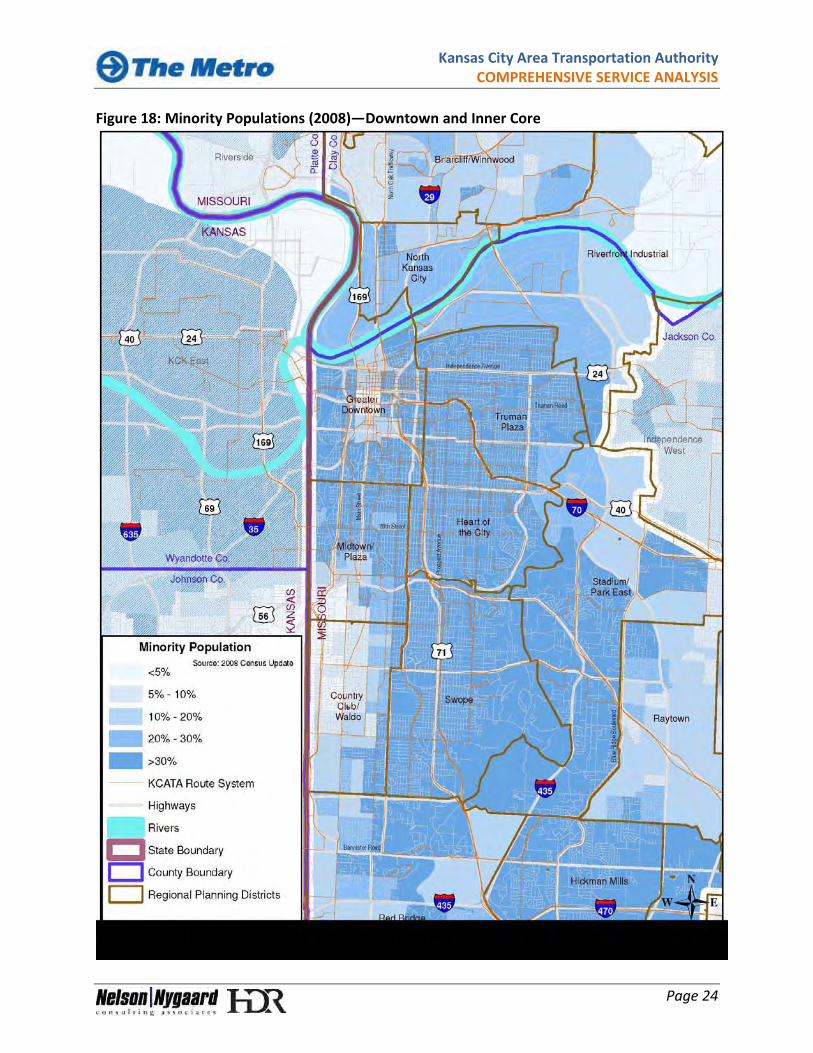
Most of these areas have varying levels of service with the exception of Martin City/Richards-Gebaur, which has no service. MINORITY POPULATIONS Throughout the country, minority populations tend to use transit more frequently than the general population. High use of transit by minority populations reflects a correlation of minority status with low-income and zero-vehicle households; lower incomes make individuals more sensitive to transportation costs and thus more likely to use transit. Over 46% of the KCATA CSA study area residents are minorities. Areas with the greatest concentrations (75% or more) of minority populations are primarily located in the inner core area south of the Missouri River along the Troost corridor and points eastward towards I-435 (see Figure 17 and Figure 18) and include the following planning districts: Much of Greater Downtown Truman Plaza Midtown/Plaza Heart of the City Swope Stadium/Park East Parts of Red Bridge Hickman Mills Martin City/Richards-Gebaur
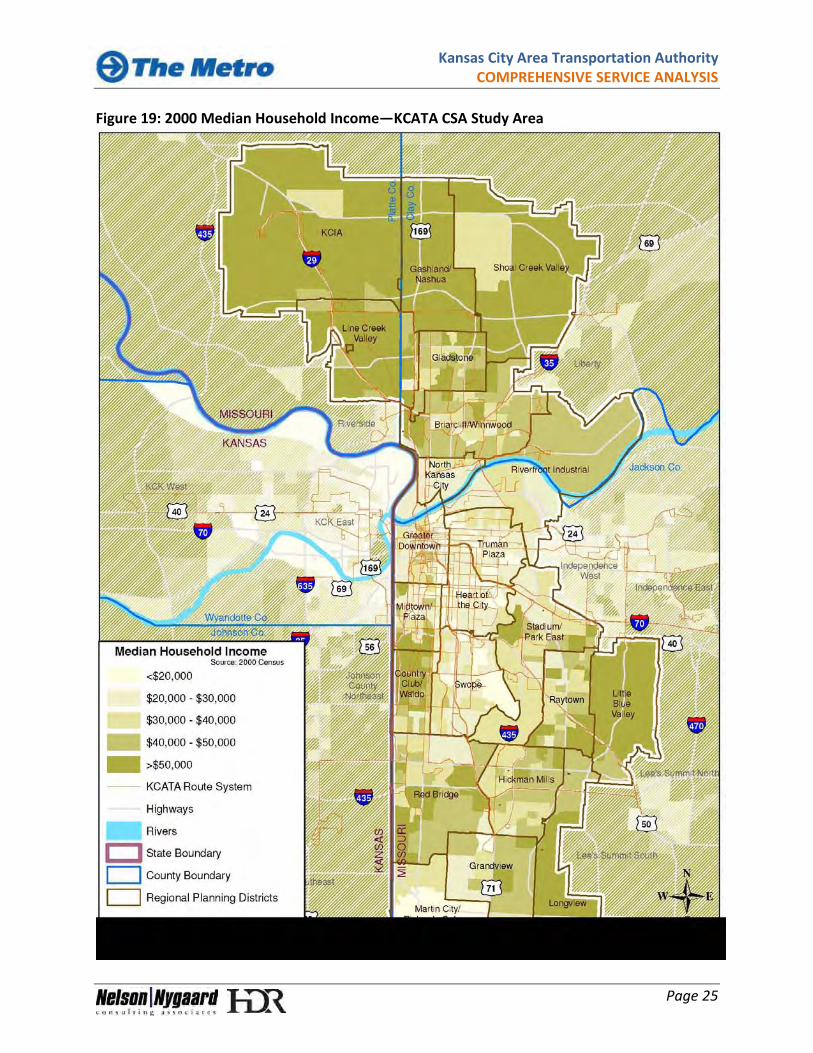
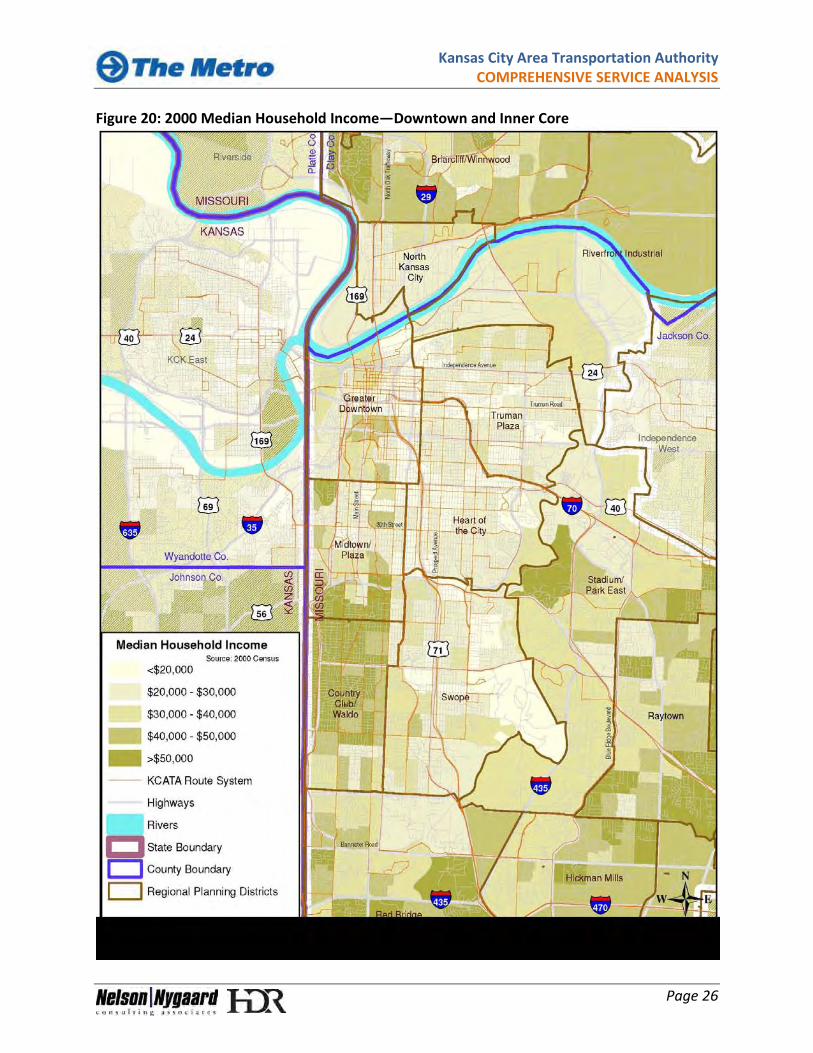
Areas in the core (Greater Downtown, Truman Plaza, Heart of the City, and Swope) and the northern part of Red Bridge are generally well served. Transit service is somewhat limited in Hickman Mills and there is no service in Martin City. LOW INCOME HOUSEHOLDS Income affects people’s transportation choices. Transit is less expensive than operating a private automobile; therefore, persons with lower incomes typically have higher rates of transit use. Based on the 2000 US Census, the median household income in KCMO was approximately $37,200. In all cities, however, incomes vary significantly by area. In KCMO, incomes are generally higher in the Northland, and lower south of the river. Areas with the lowest median household incomes (below $20,000) include (see Figure 19 and Figure 20):
Kansas City Area Transportation Authority COMPREHENSIVE SERVICE ANALYSIS
Page 23
Figure 17: Minority Populations (2008)—KCATA CSA Study Area
Kansas City Area Transportation Authority COMPREHENSIVE SERVICE ANALYSIS
Page 24
Figure 18: Minority Populations (2008)—Downtown and Inner Core
Kansas City Area Transportation Authority COMPREHENSIVE SERVICE ANALYSIS
Page 25
Figure 19: 2000 Median Household Income—KCATA CSA Study Area
Kansas City Area Transportation Authority COMPREHENSIVE SERVICE ANALYSIS
Page 26
Figure 20: 2000 Median Household Income—Downtown and Inner Core
Kansas City Area Transportation Authority COMPREHENSIVE SERVICE ANALYSIS
Page 27
Greater Downtown Truman Plaza Heart of the City Swope Martin City/Richards-Gebaur North Kansas City
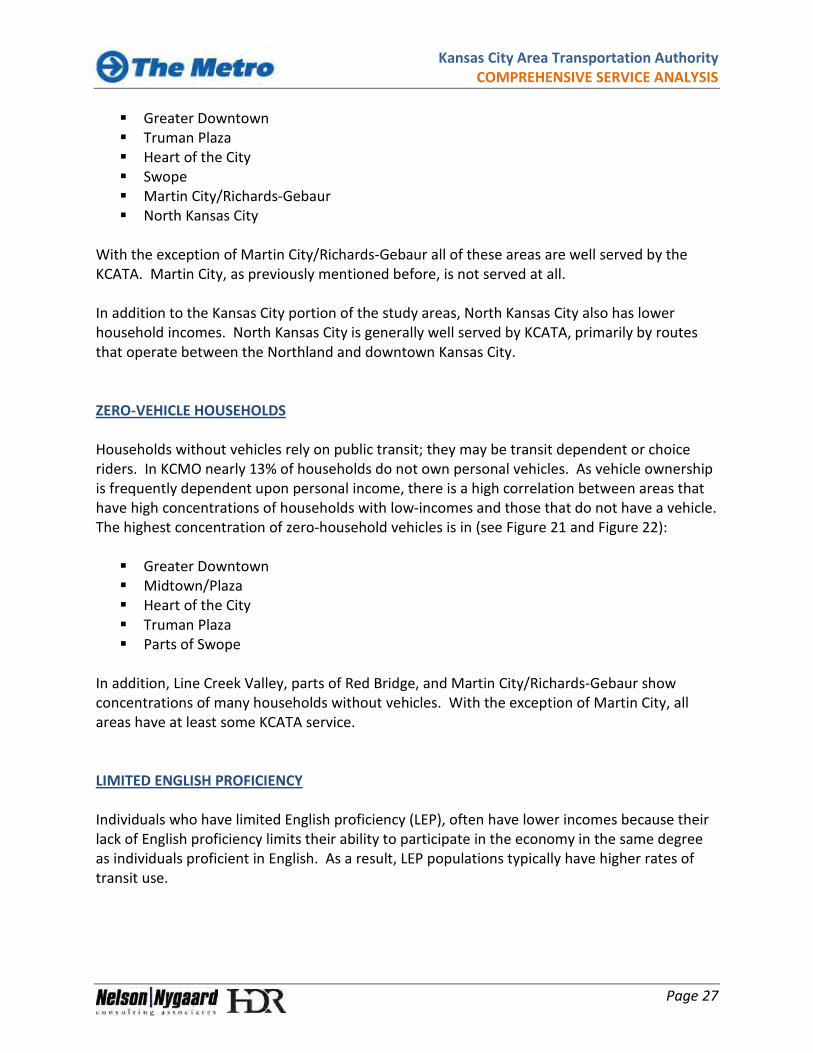
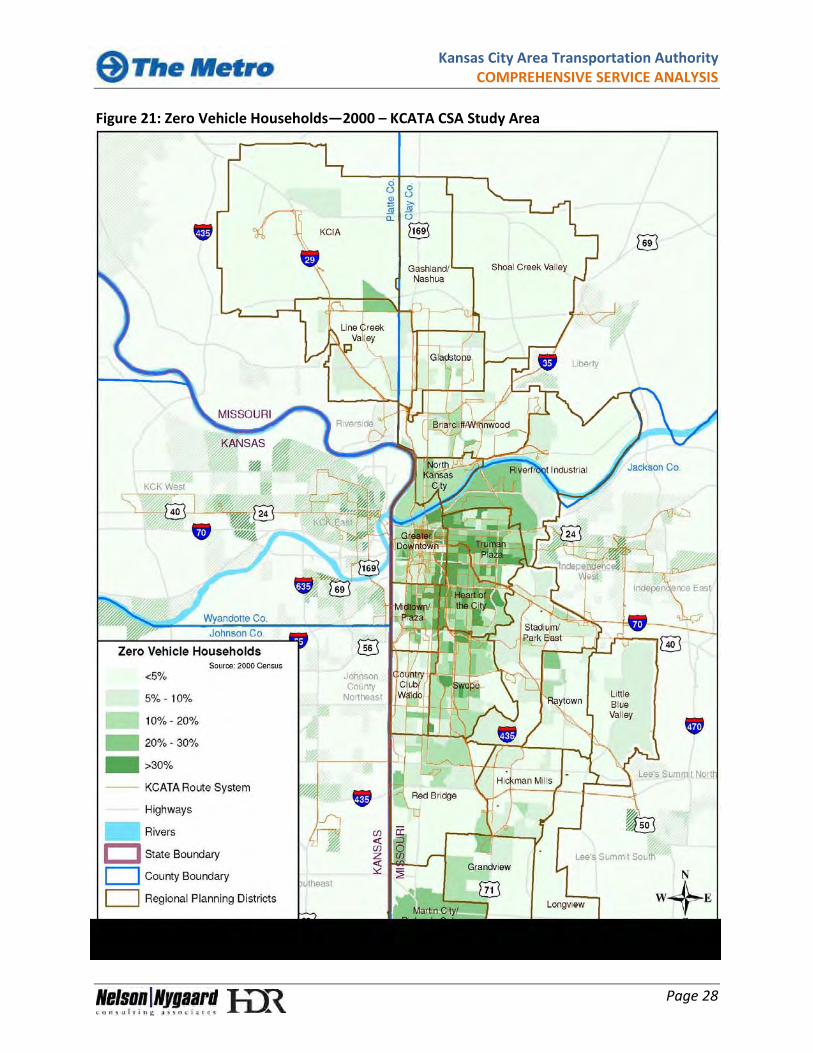
With the exception of Martin City/Richards-Gebaur all of these areas are well served by the KCATA. Martin City, as previously mentioned before, is not served at all. In addition to the Kansas City portion of the study areas, North Kansas City also has lower household incomes. North Kansas City is generally well served by KCATA, primarily by routes that operate between the Northland and downtown Kansas City. ZERO-VEHICLE HOUSEHOLDS Households without vehicles rely on public transit; they may be transit dependent or choice riders. In KCMO nearly 13% of households do not own personal vehicles. As vehicle ownership is frequently dependent upon personal income, there is a high correlation between areas that have high concentrations of households with low-incomes and those that do not have a vehicle. The highest concentration of zero-household vehicles is in (see Figure 21 and Figure 22): Greater Downtown Midtown/Plaza Heart of the City Truman Plaza Parts of Swope
In addition, Line Creek Valley, parts of Red Bridge, and Martin City/Richards-Gebaur show concentrations of many households without vehicles. With the exception of Martin City, all areas have at least some KCATA service. LIMITED ENGLISH PROFICIENCY Individuals who have limited English proficiency (LEP), often have lower incomes because their lack of English proficiency limits their ability to participate in the economy in the same degree as individuals proficient in English. As a result, LEP populations typically have higher rates of transit use.
Kansas City Area Transportation Authority COMPREHENSIVE SERVICE ANALYSIS
Page 28
Figure 21: Zero Vehicle Households—2000 – KCATA CSA Study Area
Kansas City Area Transportation Authority COMPREHENSIVE SERVICE ANALYSIS
Page 29
Figure 22: Zero Vehicle Households—2000 –Downtown and Inner Core
Kansas City Area Transportation Authority COMPREHENSIVE SERVICE ANALYSIS
Page 30
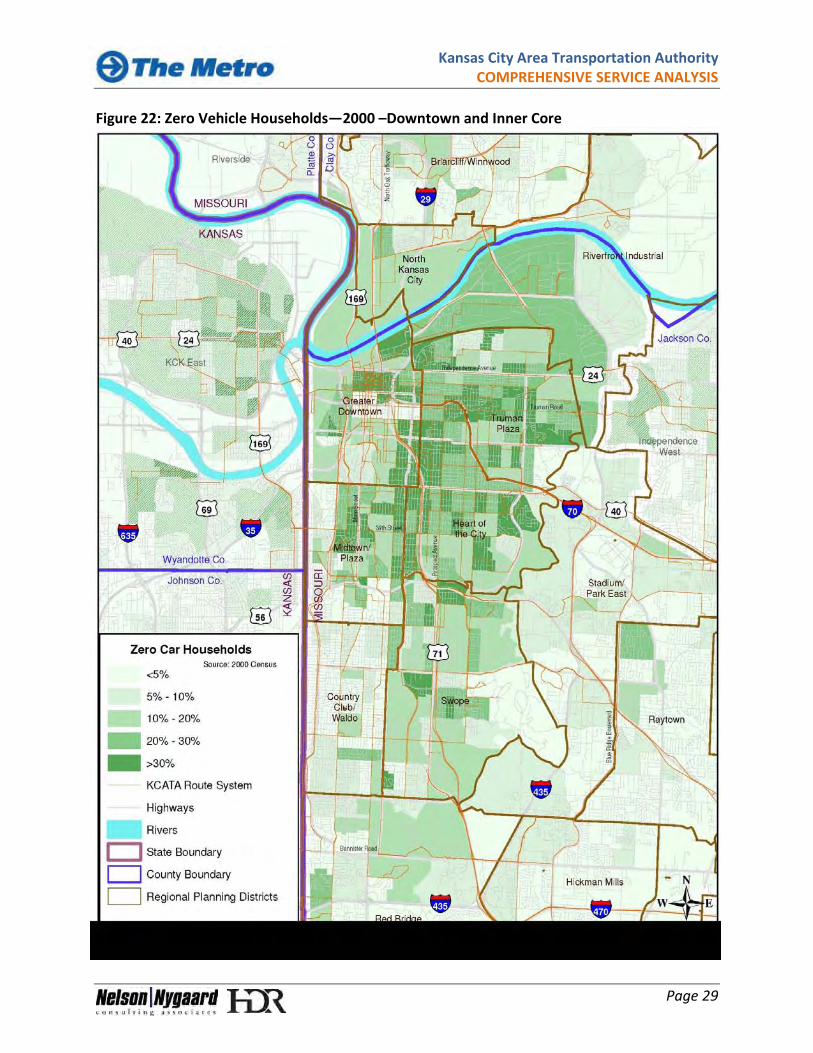
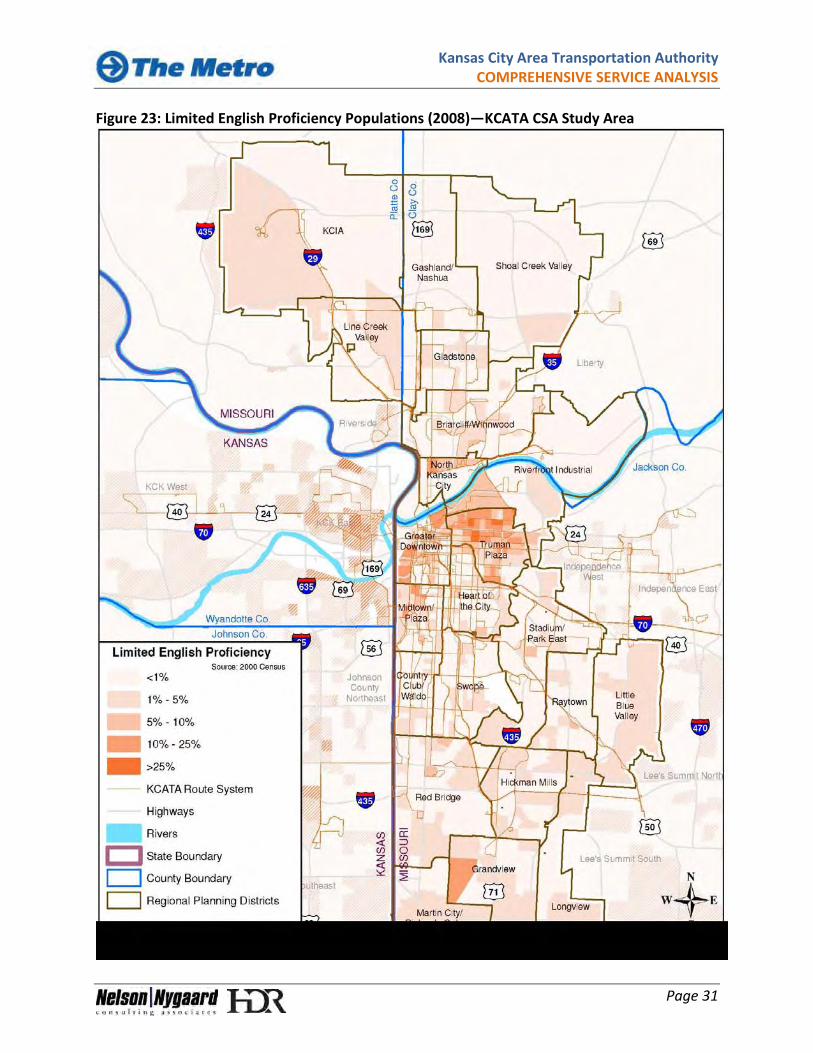
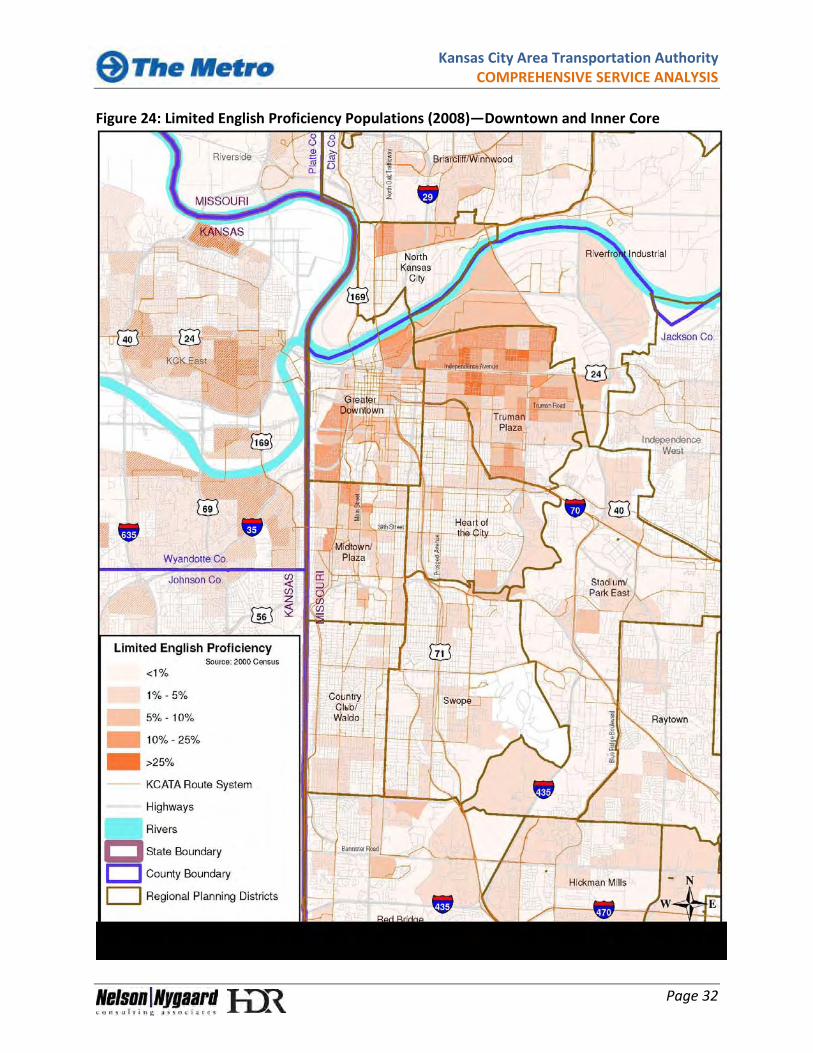
In Kansas City, about 18,250, or 4.13% of residents are defined has having limited English proficiency1
Figure 23. A large majority of these residents (61%) speak Spanish (see Table 2). The highest
concentrations of LEP individuals are in Greater Downtown and Truman Plaza (see and Figure 24), which are areas that are generally well served by KCATA. Table 2: Primary Languages of Limited English Proficiency (LEP) Populations
Total Population
Primary Language Total LEP
Percent LEP Spanish Indo-Euro Asian Other
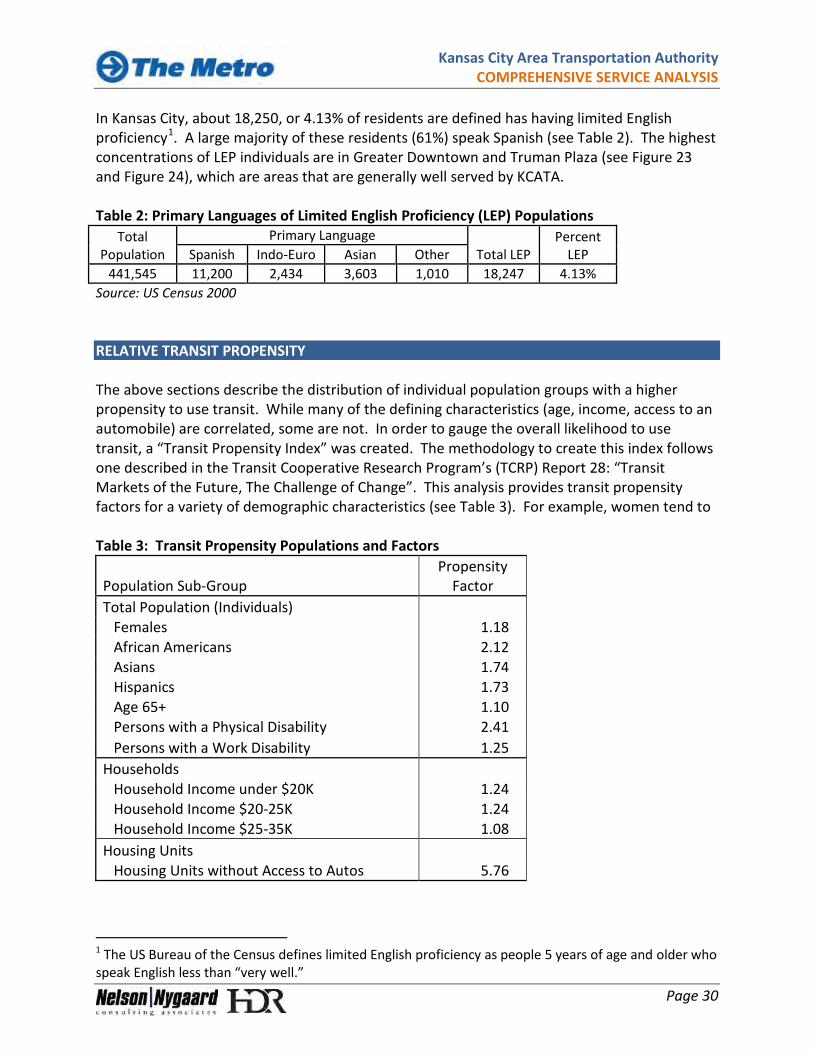
441,545 11,200 2,434 3,603 1,010 18,247 4.13% Source: US Census 2000 RELATIVE TRANSIT PROPENSITY The above sections describe the distribution of individual population groups with a higher propensity to use transit. While many of the defining characteristics (age, income, access to an automobile) are correlated, some are not. In order to gauge the overall likelihood to use transit, a “Transit Propensity Index” was created. The methodology to create this index follows one described in the Transit Cooperative Research Program’s (TCRP) Report 28: “Transit Markets of the Future, The Challenge of Change”. This analysis provides transit propensity factors for a variety of demographic characteristics (see Table 3). For example, women tend to Table 3: Transit Propensity Populations and Factors
Population Sub-Group Propensity
Factor Total Population (Individuals)
Females 1.18 African Americans 2.12 Asians 1.74 Hispanics 1.73 Age 65+ 1.10 Persons with a Physical Disability 2.41 Persons with a Work Disability 1.25
Households Household Income under $20K 1.24 Household Income $20-25K 1.24 Household Income $25-35K 1.08
Housing Units Housing Units without Access to Autos 5.76
1 The US Bureau of the Census defines limited English proficiency as people 5 years of age and older who speak English less than “very well.”
Kansas City Area Transportation Authority COMPREHENSIVE SERVICE ANALYSIS
Page 31
Figure 23: Limited English Proficiency Populations (2008)—KCATA CSA Study Area
Kansas City Area Transportation Authority COMPREHENSIVE SERVICE ANALYSIS
Page 32
Figure 24: Limited English Proficiency Populations (2008)—Downtown and Inner Core
Kansas City Area Transportation Authority COMPREHENSIVE SERVICE ANALYSIS
Page 33
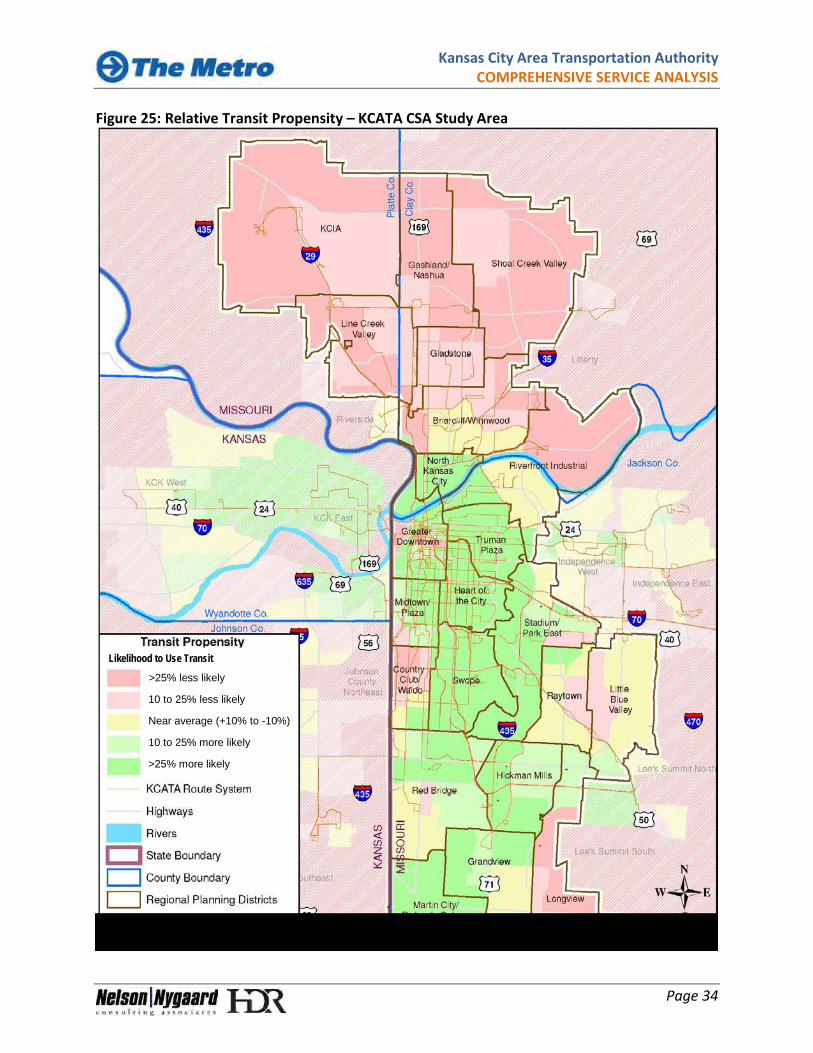
use transit 1.18 times more than average, so the factor for the female population is 1.18. Similarly, persons from households with incomes under $20,000 are 1.24 times more likely to use transit. To determine relative transit propensity in each area of Kansas City, these factors were applied for the city as a whole and for each census tract. Results were then measured for each census tract relative to the citywide average. Higher numbers on the Transit Propensity Index mean the relative demand for transit is higher. Most of the areas where residents have the highest propensity to use transit are in downtown KCMO and the inner core areas (see Figure 25): Greater Downtown Truman Plaza Heart of the City Midtown/Plaza Swope Stadium/Park East
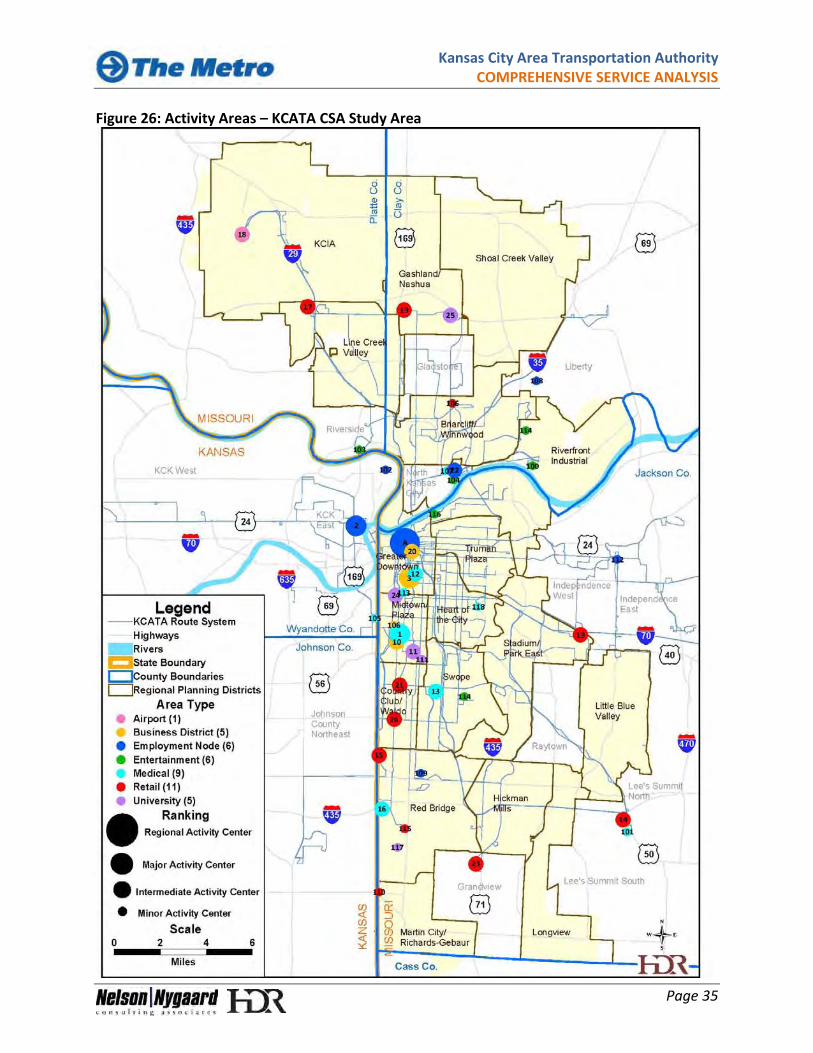
Transit propensities are also very high in much of southern Kansas City, particularly in Hickman Mills and Martin City/Richards-Gebaur, and parts of Red Bridge and Grandview. North of the River, the only area with relatively high transit propensity is North Kansas City. Most of the other parts of the Northland have a lower propensity to use transit. This finding helps explain lower ridership on most of the Northland routes. For the most part, KCATA’s service coverage is well matched to transit propensity: the highest concentrations of service are generally where transit propensities are highest, and the lower concentrations of service are where transit propensities are lower. Notable exceptions are areas in south Kansas City, south of Bannister Road, where the propensity to use transit is high but service levels are low. SERVICE TO ACTIVITY CENTERS A large proportion of all trips, as well as transit trips, are centered on travel to and from activity centers such as downtown areas, work sites, shopping centers, and hospitals. The largest activity centers in the CSA study area are downtown (including the Central Business District, the Sprint Center Arena, and the Power & Light Entertainment District) and Midtown (including St. Luke’s Hospital, the Country Club Plaza, and Westport) areas (see Figure 26 and Table 4). Intermediate activity areas consist of mid-sized retail centers and medical facilities. They also include the larger casinos (Ameristar Casino) and community colleges (Penn Valley Community College), as well as the Kansas City International Airport.
Kansas City Area Transportation Authority COMPREHENSIVE SERVICE ANALYSIS
Page 34
Figure 25: Relative Transit Propensity – KCATA CSA Study Area
>25% less likely
10 to 25% less likely
Near average (+10% to -10%)
10 to 25% more likely
>25% more likely
Likelihood to Use Transit
Kansas City Area Transportation Authority COMPREHENSIVE SERVICE ANALYSIS
Page 35
Figure 26: Activity Areas – KCATA CSA Study Area
Kansas City Area Transportation Authority COMPREHENSIVE SERVICE ANALYSIS
Page 36
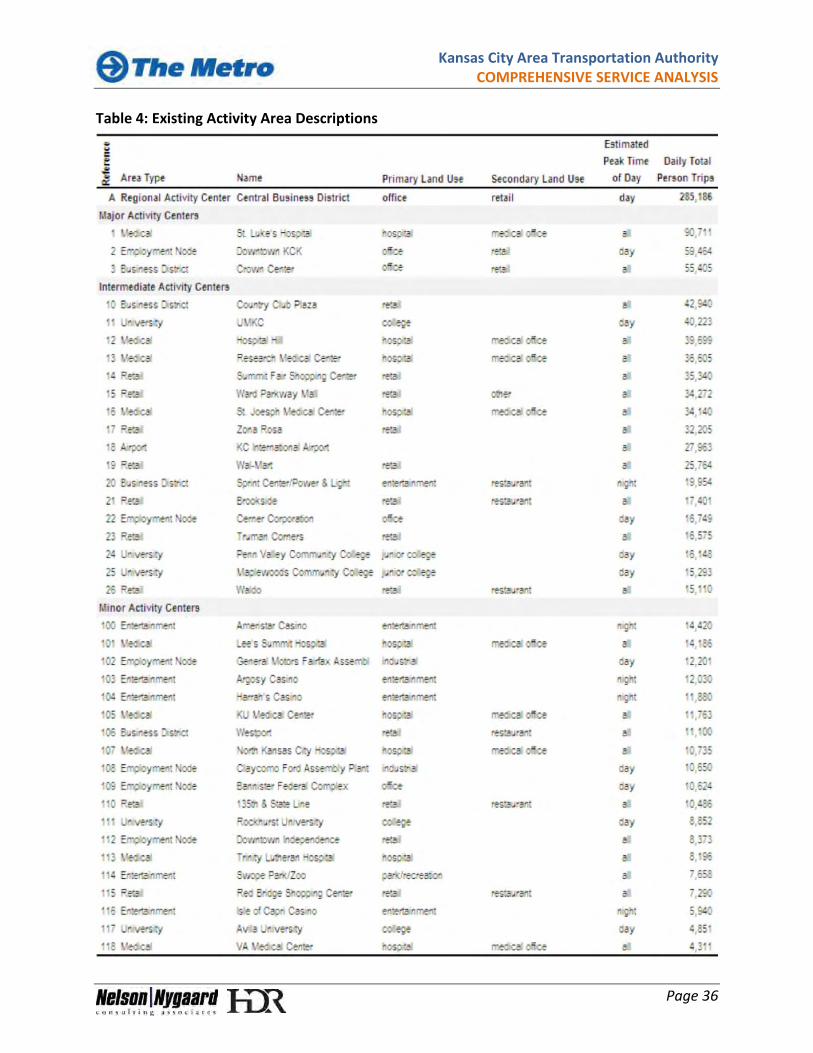
Table 4: Existing Activity Area Descriptions
Kansas City Area Transportation Authority COMPREHENSIVE SERVICE ANALYSIS
Page 37
The minor activity areas are mainly smaller community colleges, industrial/manufacturing areas, and entertainment areas such as the Kansas City Zoo, the historical 18th & Vine District, and the Worlds of Fun amusement park. Destinations such as Kemper Arena/American Royal and the Kauffman Baseball/Arrowhead Football Stadiums fall into the minor activity area category because of the event-driven nature of their use. Despite drawing very large crowds when events are being held, the average daily trip numbers for these facilities are quite low. Taken together, most of the activity centers are located on the west side of KCMO and fairly concentrated in a north/south direction in a corridor defined by Greater Downtown on the north, 103rd Street on the south, State Line Road on the west and Wornall/Holmes Roads on the east. In general, KCATA routes connect virtually all these areas. There are notable exceptions: A retail center at State Line and 135th Street in the Martin City district in southern
Kansas City (labeled 103 in the figure). The center has a Wal-Mart and Lowe’s home improvement center as well as other businesses and a variety of restaurants.
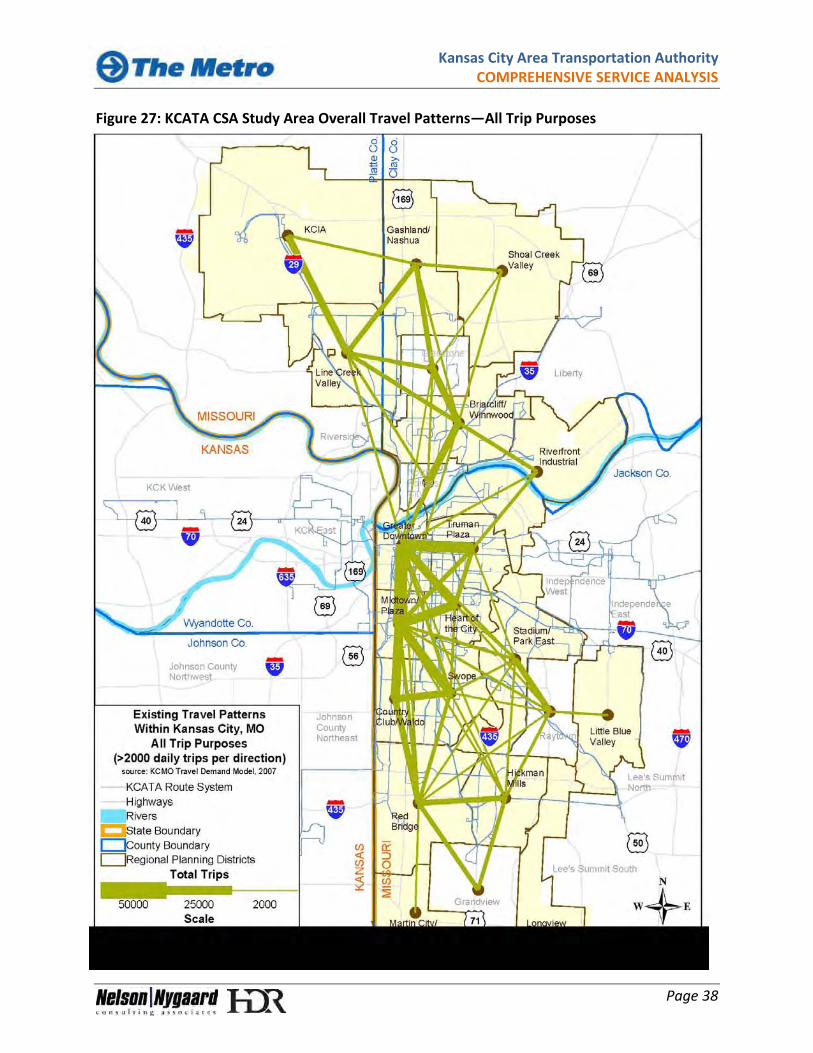
Avila University (labeled 107 in the Red Bridge area of southern Kansas City). TRAVEL PATTERNS Areas with the largest concentrations and densities of residences, transit-oriented populations and jobs are the strongest transit markets. Effective transit services offer convenient links between these areas. This section uses the estimated daily traffic flows in the Kansas City travel demand model to assess major travel flows within KCMO, and neighboring areas. The analysis considers all trips as well as home based work (commute) trips; it also looks at travel within KCMO and regional travel flows. The analysis provides an assessment of how well KCATA services match the predominant travel patterns. TRAVEL WITHIN KCMO The highest volumes of travel to locations in KCMO are from other locations within KCMO. The highest volumes are within and to the Greater Downtown – Midtown/Plaza – Country Club/Waldo corridor, within the Northland, between Hickman Mills and Red Bridge, and between Raytown and Stadium/Park East. All Trip Purposes For all trip purposes, travel within KCMO is heavily oriented toward Greater Downtown, Midtown/Plaza, and Country Club/Plaza. The largest of these are (see also Figure 27):
Kansas City Area Transportation Authority COMPREHENSIVE SERVICE ANALYSIS
Page 38
Figure 27: KCATA CSA Study Area Overall Travel Patterns—All Trip Purposes
Kansas City Area Transportation Authority COMPREHENSIVE SERVICE ANALYSIS
Page 39
Greater Downtown, from Truman Plaza, Heart of the City, and Midtown/Plaza. Midtown/Plaza, from Swope, Country Club/Waldo, and Heart of the City. Country Club/Waldo, from Swope and Red Bridge.
Overall, these travel flows are among the best served in the KCATA system and are served by KCATA’s premier services (Main Street MAX) and highest frequency services. Other important travel flows within KCMO south of the river include: Stadium/Park East, from Raytown. Service to the western half of Stadium/Park East is
comprehensive, but to the eastern half is much more limited. Red Bridge, from Grandview, Hickman Mills, and Swope. Service between these areas is
limited. Riverfront Industrial, from Truman Plaza, Briarcliff/Winnwood and Greater Downtown.
Service between these areas is relatively good in some places, very limited in others. North of the river, travel flows are much less oriented to downtown Kansas City and the Downtown – Country Club Plaza Corridor than they are south of the river. The largest travel flows are within the Northland: KCIA – Line Creek Valley Gashland/Nashua – Line Creek Valley Gashland – Gladstone Gladstone – Line Creek Valley Gladstone – Briarcliff/Winnwood Briarcliff/Winnwood – North Kansas City Briarcliff/Winnwood – Riverfront Industrial
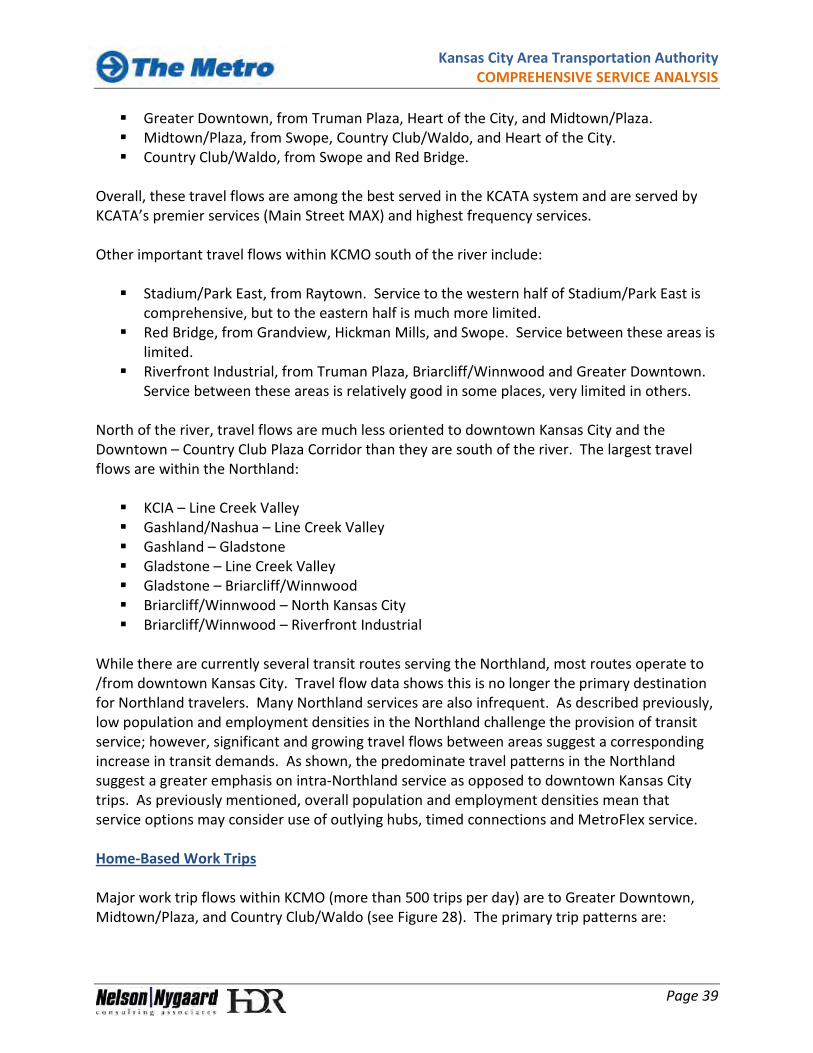
While there are currently several transit routes serving the Northland, most routes operate to /from downtown Kansas City. Travel flow data shows this is no longer the primary destination for Northland travelers. Many Northland services are also infrequent. As described previously, low population and employment densities in the Northland challenge the provision of transit service; however, significant and growing travel flows between areas suggest a corresponding increase in transit demands. As shown, the predominate travel patterns in the Northland suggest a greater emphasis on intra-Northland service as opposed to downtown Kansas City trips. As previously mentioned, overall population and employment densities mean that service options may consider use of outlying hubs, timed connections and MetroFlex service. Home-Based Work Trips Major work trip flows within KCMO (more than 500 trips per day) are to Greater Downtown, Midtown/Plaza, and Country Club/Waldo (see Figure 28). The primary trip patterns are:
Kansas City Area Transportation Authority COMPREHENSIVE SERVICE ANALYSIS
Page 40
Figure 28: KCATA CSA Study Area Overall Travel Patterns—Home-Based Work Trips
Kansas City Area Transportation Authority COMPREHENSIVE SERVICE ANALYSIS
Page 41
Greater Downtown, Midtown/Plaza, Truman Plaza, Heart of the City, and North Kansas
City. Midtown/Plaza, from Country Club/Waldo, Swope, and Heart of the City. North Kansas City, from Briarcliff/Winnwood. KCIA, from Line Creek Valley.
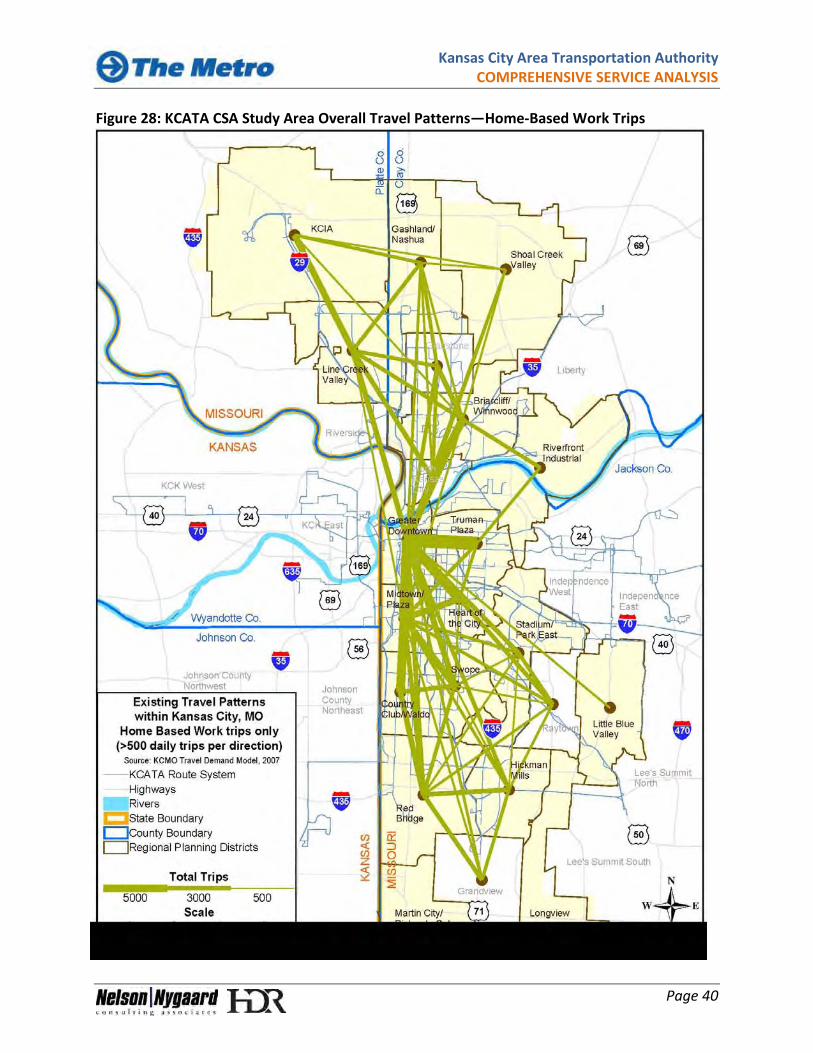
Greater Downtown is well served from all areas, as is North Kansas City. However, in the Line Creek Valley, KCIA/I-29 corridor service is fairly limited. REGIONAL TRAVEL PATTERNS There is also a large amount of travel to KCMO from surrounding communities and counties; this travel pattern indicates there is demand for effective connections with those areas. The largest of these are from Johnson County, Kansas, Kansas City, Kansas (KCK), and neighboring communities in Missouri. All Trip Purposes For all trip purposes, the major travel flows (2,000 daily trips or more) to KCMO from outlying areas include (see also Figure 29): KCK East to Greater Downtown and Midtown/Plaza. Johnson County Northeast to Greater Downtown, Midtown/Plaza and Red Bridge. Johnson County Southeast to Red Bridge. Liberty to Shoal Creek Valley.
KCATA provides direct service between KCK and downtown KCMO, and connecting service to Midtown/Plaza. Service to and from Johnson County is the responsibility of Johnson County Transit (The JO), which provides only limited service to KCMO. While the development of improved service between Johnson County and KCMO is beyond the scope of this project, the development of transit hubs in a number of new areas will be examined. In this event, the development of transit hubs in Red Bridge, Country Club/Waldo, and/or Midtown/Plaza could provide convenient locations for The JO to provide connections to the KCATA network for continuing service throughout KCMO. Home-Based Work Trips Many major work trip flows (500 daily trips or more) from outside of KCMO are to Greater Downtown. The largest are from (see also Figure 30): Independence East Independence West
Kansas City Area Transportation Authority COMPREHENSIVE SERVICE ANALYSIS
Page 42
Figure 29: KCMO Regional Travel Patterns—All Trip Purposes

Kansas City Area Transportation Authority COMPREHENSIVE SERVICE ANALYSIS
Page 43
Figure 30: KCMO Regional Travel Patterns—Home-Based Work Trips
Kansas City Area Transportation Authority COMPREHENSIVE SERVICE ANALYSIS
Page 44
KCK East KCK West Johnson County Northeast Johnson County Northwest Johnson County Southeast
KCATA provides service from Independence and KCK, and The JO provides limited service from Johnson County to locations other than downtown and Midtown/Plaza. The only major work trip flows to locations other than Greater Downtown are from Johnson County Northeast to Midtown/Plaza and Red Bridge as well as Johnson County Southeast to Red Bridge. In addition, there is demand from Liberty to Shoal Creek Valley and Briarcliff/ Winnwood in the northeastern part of the city. These flows are either not currently served or not served well. However, as described above, the development of new transit hubs in KCMO could provide The JO with opportunities to provide connecting services at those hubs. Currently, no service exists between Liberty and Shoal Creek Valley as well as between Liberty and Briarcliff/Winnwood. SUMMARY OF RESULTS Census data shows population and employment in much of Kansas City’s downtown and inner core areas have declined since the 1990s. In spite of these declines, however, the area remains, by far, the most transit supportive market in the study area. The market strength results from higher overall densities of both jobs and people and the area’s largest populations of transit dependent individuals. Population and employment are increasing outside of the downtown and inner core area, but the numbers – both in terms of absolute numbers and the concentration of people – remain much lower than in the core. In addition, the development patterns in these areas are more suburban than urban and as a result, much less supportive of transit. Consequently, while demand is significant and growing, the transit markets are more difficult to serve. The market analysis also shows that travel patterns are different north and south of the Missouri River. North of the river, travel demand is focused on trips within the Northland rather than travel to downtown Kansas City or other areas south of the river. This indicates that service could be restructured to better serve intra-area trips, potentially developed by orienting service around a series of outlying transit hubs that provide a combination of direct and connecting services, and scheduled connections to MetroFlex services. South of the river, travel demand remains heavily focused on Greater Downtown, Midtown/Plaza, and Country Club/Waldo areas. This indicates that KCATA’s current focus on trips to and from the core area with a combination of radial and crosstown routes is appropriate. In these locations, the overall route structure is sound and service improvements
Kansas City Area Transportation Authority COMPREHENSIVE SERVICE ANALYSIS
Page 45
may be oriented towards travel times, service directness, and overall convenience. Regional markets also offer opportunities. In these areas, similar with the Northland, new markets may be developed through route restructurings, improved use of outlying hubs, and scheduled connections to MetroFlex services.