transit oriented development - valley metro development in phoenix and mesa: developing a policy...
TRANSCRIPT

Transit Oriented Developmentand Proposition 207 in Metropolitan Phoenix
November 2009
United States Environmental Protection Agency

TRANSIT ORIENTED DEVELOPMENT AND PROPOSITION 207 IN METROPOLITAN PHOENIX
In 2007, the city of Phoenix and its partners, Valley Metro Rail and the city of Mesa sought policy analysis assistance to address how to promote transit-oriented development (TOD) along its newly opened light rail and future extensions given the impact of the passage of Proposition 207 (Private Property Rights Protection Act). Over the course of the past 24 months, the U. S. Environmental Protection Agency (US EPA) lead a group of national experts to help the local team and its supporters including the Local Initiative Support Corporation and the Sonoran Institute develop options for encouraging transit oriented development while addressing Proposition 207. The project evolved into a discussion of the most appropriate tools and incentives that localities can use to promote TOD. Five documents were developed as the team’s analysis for this project, each covering some specific aspect and nuance of these tools and how they will be utilized. These documents include: Developing a Policy Toolbox for the Post-Proposition 207 Environment: Transit Oriented Development in Phoenix and Mesa This document serves as the initial “thought piece” for organizing ideas for this project. At the beginning of the Smart Growth Implementation Assistance project, this document was written to frame the issues and provide some perspective about scope of the work. Since the document was meant to serve a purpose early in the process, it was updated to reflect feedback throughout the project, but it was not completely rewritten at the end of the project. Strategic Package of Tools to Promote Transit Oriented Development in Metropolitan Phoenix This document serves a comprehensive summary of the tools that are available and encouraged for use in metropolitan Phoenix to promote transit-oriented development. The document is structured as a matrix in which tools are described and then evaluated against local conditions as well as assessed for their viability in communities around the country. Of all of the documents, this one can best stand alone and serve a broader audience. Encouraging Transit Oriented Development: Case Studies that Work As part of their input into this project, Reconnecting America authored a series of short case studies of TOD tools that have been highlighted in the project. The aim is to describe in some detail a select number of tools and show how each have been used in various cities and settings. Creating these cases, gives readers a tangible account of how and to what degree these tools function and work. Impact of TOD and Smart Growth Incentives on Development in Phoenix This document features an analysis of the fiscal impact of development around transit. The most important consideration here is that this analysis was done as a snapshot – in the spring of 2009 – during a low point in the housing and commercial development market. This fact is noted; yet,

the lessons and results of the analysis transcend this point in time and can be used as a measure for additional analysis. Next Steps to Promote Transit-Oriented Development in Metropolitan Phoenix The purpose of this document is to highlight themes and strategies that elected officials and city staff can consider as next steps for implementation of strategies to promote transit-oriented development. This document does not serve as an executive summary of the entire project, but rather an attempt to take the results of the work and project it into action items and steps for application. These documents are meant to be used as a whole to create a complete picture of addressing TOD in Phoenix, but because of the distinct nature of the individual information presented, each are also intended to stand alone as a resource. In April 2009, the US EPA group conducted a 4 day site visit in Phoenix. The site visit consisted of presenting ideas and findings related to the documents described above. Key meetings during the site visit included a presentation to the Phoenix city council, a training session with staff from Phoenix, Mesa and other municipalities interested in the this project as well as a half-day symposium with local developers and property owners. Of the five documents listed above, drafts of the first four (not including Next Steps to Promote Transit-Oriented Development in Metropolitan Phoenix) were presented. The Next Steps document was written as a response to the work that occurred and serves as a summary of the options for implementation. Questions about this project can be directed to Kevin Nelson, US EPA, [email protected], 202-566-2835.

PROJECT CONTRIBUTORS EPA Team Kevin Nelson, Project Lead John Thomas, Transportation Expert Expert Team Amy Doll, Contract Manager, ICF International Dena Belzer, Principal, Strategic Economics Nadine Fogarty, Strategic Economics Phil Erickson, President, Community Design + Architecture Shelley Poticha, Reconnecting America Gloria Ohland, Reconnecting America Local Team Mike James, City of Mesa Ben Limmer, METRO Sandy Zwick, City of Phoenix Patricia Boland, City of Phoenix Teresa Brice, Local Initiative Support Corporation Donna Bronski, City of Mesa Susan Culp, Sonoran Institute Grady Gammage, Gammage and Burnham Kristin Keener-Busby, State of Arizona Smart Growth Office Deb Sydenham, State of Arizona Department of Commerce Walter Morlock, Urban Land Institute

United States Environmental Protection Agency
Developing a Policy Toolbox for the Post-Proposition 207 Environment
Transit Oriented Development in Metropolitan Phoenix

Transit-Oriented Development in Phoenix and Mesa: Developing a Policy Toolbox for the Post-Proposition 207 Environment
I. Introduction – Transit-Oriented Development (TOD) Policies and Property Values The enactment of Proposition 207 raised an important question: Will its compensation requirements create a barrier to transit-oriented development policies? There are two main reasons why the answer to this question is most likely “no.” First, TOD programs are typically built upon incentives that make developing properties more enticing, many times resulting in the enhancement of property values. Second, several studies including Reconnecting America’s “Capturing the Value of Transit” have quantified the value that public rail investments add to nearby properties. Therefore, in the few cases where land use regulations do reduce the economic value of a property, it could be possible to design the incentives associated with a TOD program to outweigh any potential losses in property value. A formal process could be established to evaluate such claims and exempt properties that can prove a significant loss in property value that cannot be offset by incentives. Quantifying the impact of specific TOD policies is a complex task. For example, some policies reduce developer costs or enable a project to include more developable square footage. Such incentives can be worth a few thousand dollars or several million, depending on the nature of the site and current real estate market conditions. Other TOD policies may directly restrict certain types of new development (e.g., car washes or self storage) around a station. However, this restriction would diminish property value only if there are no transit-compatible alternatives (e.g., an office, retail, or residential project) that would generate as much or more revenue than restricted uses. Yet, the value of TOD is realized at a regional level. When governments and taxpayers invest billions of dollars to build a transit system, it is an imperative of fiscal responsibility to support the investment in transit with land uses that bolster ridership. Essentially, the public good is weighed against the benefits to individual property owners. Some aspects of this approach may be problematic in the Proposition 207 environment, but TOD-supportive policies are still a viable option for the Phoenix area. This complexity raises strategic questions about how TOD policies relate to Proposition 207:
1. What is the scope of Proposition 207 related to provisions typically included in TOD programs?
2. Can a set of TOD policies be bundled to ensure that the property value created by the
transit investment and policy incentives outweigh any diminished value associated with restrictions on land use?
3. How would various approaches to limiting compensation claims affect the rating of
planned system extensions under the federal transit New Starts Program? The three sections that follow address the questions in order. While a cut-and-dried set of answers is not possible, several key insights emerge from exploring each issue.
1

Many effective TOD policies are not land use laws (e.g., support for station area planning, financial incentives, and infrastructure provision) and thus are exempt from Proposition 207.
Other common components of transit overlay zones are, by definition, incentives that add
value (e.g., density bonuses, more flexible parking standards) and would not trigger a compensation claim.
The most problematic component of typical TOD overlay zone regulations, as far as
Proposition 207 is concerned, is the restriction of uses, but even its potential for generating successful claims under Proposition 207 is unclear. It is likely that potential claims would relate to health and safety concerns as well as transportation or traffic control. (Use restrictions could be unbundled from the other overlay zone provisions for this reason. These restrictions could be adopted separately so that a challenge to them would not affect implementation.)
The design standards (e.g., retail frontage, sidewalk width, and shade requirements) in
overlay zones do impose additional development costs, which could arguably reduce property values, but they are relatively modest and easily offset by incentives and the increased value that the design standards may bring to the property. In most cases, good urban design that focuses on pedestrian-supportive environments provides additional value to the site and its users.
While future transit-oriented development plans are not counted toward ridership
forecasts that determine cost effectiveness, a qualitative assessment of transit-supportive land use policies still comprises half of the New Starts rating system. For information about New Starts, see Appendix A.
As METRO proposes expanding the light rail system into areas with less transit-
supportive land use patterns, policies aimed at transforming land use around station areas should become even more important to a favorable overall land use rating for the New Starts criteria.
II. Proposition 207 as a Constraint on TOD Policies Although Proposition 207 is a fairly broad statute with significant implications, it does contain specific language limiting its reach. Table 1 summarizes the key provisions relevant to TOD policies and provides a quick assessment of their potential implications. On one hand, the statute requires compensation for most land use laws that diminish property value. Under a narrow list of conditions, land use laws are protected from compensation claims (ARS § 12-1134, B: 1, 3, 6, 7), but the burden of proof is on local governments to make the case for an exemption (ARS § 12-1134, C). On the other hand, land use laws are defined in a way that places many of the policies associated with TOD programs beyond the scope of the statue (ARS § 12-1136, 3). Finally, it also excludes claims when a property is not directly subject to a newly enacted land use law (ARS § 12-1134, B: 6, 7). This policy ensures that claims cannot be made retroactively to address previous land use changes.
2

These aspects of the statutory language allow TOD policies to be sorted according to the degree to which Proposition 207 may limit their application. At one end of the spectrum are incentive-based tools that are exempt because they are not land use laws: support for station area or corridor planning, financial subsidies, and upgrades to public infrastructure. Specific exemptions are also included in the law that could, depending on how they are interpreted by the courts, protect provisions of TOD overlay zones from compensation claims. For example, design requirements or access management standards in overlay zones, if primarily designed to protect pedestrian and bicyclist safety, would likely be exempt (ARS § 12-1134, B: 1) even if they affect property values. Elements of an overlay zone that serve a “transportation or traffic control purpose” might also qualify for an exemption (ibid). If this were interpreted broadly, use restrictions would be exempt due to their transportation and traffic control purpose of ensuring an adequate ridership base for the light rail. Uses that generate a lot of automobile traffic near the transit stop would certainly have the potential to be a safety and traffic control issue. Similarly, parking caps could be justified by the need to control traffic around station areas. Furthermore, ridership levels are affected by the range of land uses. Office and residential uses generate riders for transit and customers for businesses in the station area, while some businesses, such as self-storage facilities, do not.
3

Exhibit 1 – Key Provisions of Proposition 207: The Private Property Protection Act
Specific Language1 Implication
(ARS § 12-1134, A) Applies only to land use laws that reduce the right to use, divide, sell, or possess “…If the existing rights to use, divide, sell or possess private real property are reduced by the enactment or applicability of any land use law…” “owner is entitled to just compensation”
What does the right to use and possess imply? For example, when something is currently a conditional use (e.g., a drive-through fast food restaurant) rather than a unique land use category, does it have existing “use rights”? This issue relates specifically to the land use and not the form of a structure. Building form issues are considered the section entitled Form-Based Codes as an Alternative Strategy.
(ARS § 12-1136, 3) Specific definition of a land use law “any statute, rule, ordinance, resolution or law enacted by the state or a political subdivision that regulates the use of / division of land, or any interest in land…”
Does “any interest in land” mean that policies such as parking caps, which do not regulate the use or subdivision of parcels, could still be subject to compensation claims? If parking is considered a land use, parking caps would affect the amount of that use.
(ARS § 12-1136, 1) Fair market value defined as the benchmark for compensation “Fair market value means the most likely price…which the land would bring if exposed for sale in the open market.”
This provision might rule out a claim for revenue lost due to a prohibited use unless the property owner can prove it negatively affects the price they would get for the land if they put it on the market. Also, there is no clear language on the burden of proof regarding impacts on fair market value.
(ARS § 12-1134, I) Waiver agreements allowed under the statute “Nothing in this section prohibits the state or any political subdivision from reaching an agreement with a private property owner to waive a claim for diminution in value.”
This provision explicitly protects any opt-in / waiver-based approach to overlay zones.
1 Title 12, Chapter 8 Arizona Revised Statutes § 12-1134, B: 1, 3, 6, 7 (Private Property Rights Protection Act)
4

(ARS § 12-1134, B: 1, 3, 6, 7) Potential exemptions to the compensation requirement 1) “Protection of the Public’s Health and Safety, including… Transportation or Traffic Control…and Pollution Control”
Any overlay zone requirements intended to enhance pedestrian / cyclist safety and improve traffic flow around station areas could be exempt. Other exemptions would include those for developments that make a direct positive impact upon local air quality as well as reduce greenhouse gases as part of a strategy for addressing global warming and climate change. These actions will improve public health, safety, and pollution control. For example, access management standards in an overlay district that limit driveway access onto an arterial where rail stations are located will minimize instances where pedestrians and automobiles will be in the same space leading to a safer pedestrian environment.
3) “Required by Federal Law”
If a court ruled that the Transit Supportive Land Use Criteria in the New Starts Program amounted to a federal requirement, use restrictions might be permitted without compensation for any diminished property value.
6) “Do not directly regulate an owner’s land”
This definition rules out challenges by neighbors claiming that TOD development policies will negatively affect their property values. For example, density bonuses or flexible parking standards could not be challenged by neighboring properties based on a claim that such policies would reduce the neighboring property’s value.
7) “Were enacted before the effective date of this section”
Existing overlay zone policies in Phoenix, Mesa, and Tempe are protected against challenges under Proposition 207. Proposition 207 was adopted in November 2006.
(ARS § 12-1134, C) The burden of proving a land use law is exempt falls on the government
State or political subdivision “that enacted the land use law has the burden of demonstrating that the land use law is exempt pursuant to subsection B.”
Essentially, relying upon any of these exemptions to avoid compensation claims against a TOD land use law requires that the connection to the exempt purpose be direct and clearly provable in court.
5

III. Options for Mitigating Proposition 207’s Impact on TOD Programs This examination of the statutory language suggests a framework for considering TOD policy tools and their vulnerability to claims under Proposition 207. Three general groupings seem most sensible:
1) Policies susceptible to claims for compensation; • Parking caps • Use restrictions in overlay zones
2) Policies where claims are possible, but would be unlikely to show any reduction in property value; and
• Density bonuses • Design guidelines • Expedited development review • Relaxed parking restrictions
3) Policies that are outside the scope of the statute. • Buying available parcels in the open market • Capital funding for infrastructure • Financial assistance for land assembly (without use of eminent domain) • Funding for station area planning and market studies • Tax abatement • Tax exempt bonds • Underwriting development land costs
This framework could translate into a number of approaches to mitigating the impact of Proposition 207 on TOD policies.
• The most conservative approach would be to move forward only with policies that are strictly incentive based.
• A more ambitious approach could implement a “balanced package” of incentives aimed at offsetting any negative property value impacts of overlay zone use restrictions. (see the following section for more explanation of this concept) The potential risk of this approach is that incentives, in many cases, are susceptible to market conditions. There may be times when the housing market is strong enough to need only a small subsidy or incentive to cover the difference in development costs and other times when the difference could be much bigger.
• Another alternative could be to use enforcement waivers2 when a reduction in property value can be demonstrated. This approach would create the flexibility needed to move forward with an overlay zone, even if there is a potential for compensation claims. A
2 See The League of Arizona Cities and Towns “Sample Proposition 207 Waiver Form and Claims Checklist” for additional information about enforcement waivers. www.azleague.org/doc/resources/prop207_sample_waiver_form_checklist.doc
6

formal arbitration process for property owners would limit the potential for lawsuits by creating another way to resolve disputes about property values.
• A hybrid approach could implement the use restrictions through an opt-in mechanism or a more flexible standard such as form-based codes. However, each of these hybrid approaches has drawbacks.
o The opt-in approach runs the risk of creating ineffective overlay zones where too few property owners choose to be part of the zone.
o Form-based codes could ensure that auto-oriented uses do not hinder walkability and access around light rail stations but would not be able to ensure development that generates higher levels of ridership on the system.
• Another approach would require that all policies link directly to impacts upon health, safety, and pollution control. When implemented, developed land that makes walking easier and safer and minimizes driving will be preferred.
Creating a Balanced Package of Incentives The primary challenge of this approach lies in quantifying the value of key incentives, such as density bonuses, reductions in required parking, access to tax-exempt bonding authority, and streamlined review. The value of these policy tools depends on several factors, including the characteristics of the developer, the site conditions, and overall market conditions. Although it is not possible to make precise net impact calculations for all the parcels that would be covered by new overlay districts, it would be possible to evaluate the combination of policies that is most likely to result in a net positive impact on property value for some of the parcels in the proposed phase II alignment. This estimate would only be a snapshot in time, but it is worth considering. The value also depends upon the existing zoning for the properties, the future TOD zoning, the station area typology, and the market conditions at each station. It should be noted that this balanced package of incentives has been developed as a separate stand-alone document that is part of this project called “Strategic Package of Tools to Promote Transit Oriented Development in Metropolitan Phoenix”. The following discussion in this section provides the framework and rationale for the Strategic Package of Tools. Conducting a detailed financial analysis of TOD tools is both technically complex and resource intensive. Therefore, Phoenix and Mesa could develop a short list of key tools to be evaluated in more detail by focusing on policies that have been most effective in other regions. Exhibit 2 summarizes the results of a 2004 national survey of transit agencies3 on which policy incentives these agencies view as most effective. Exhibit 2 shows how agencies rated various policy tools (from least effective, 3.9 on a 7-point scale, to most effective, 5.6) and how frequently the policy was applied.
• For rail systems, support for planning, relaxed parking standards, density bonuses, capital funding (infrastructure), and land assembly were the most common TOD policy tools.
• Nine of the ten most effective policies create very little risk of compensation claims: a) capital funding; b) tax-exempt bonds;
3 Cervero, R. et al. TCRP Report 102, Transit-Oriented Development in the United States: Experiences, Challenges and Prospects, Transportation Research Board. 2004. Figure 4.4, p. 72.
7

c) planning funding; d) land assembly help; e) buying key parcels when they come on the market; f) density bonuses; g) underwriting land costs; h) incentives for subsidized housing; and i) relaxed parking standards. The most effective use of these policies is to group them together so that multiple inputs achieve the same net result.
• The remaining policies are either not permitted in Arizona, not currently in place in Arizona, or would create clear issues relative to Proposition 207.
Exhibit 2 – Application of Transit-Oriented Development Tools4
State and regional agencies could also be critical partners in providing incentives. The national survey of TOD policies also asked transit agencies to rate the most effective forms of assistance they received from other levels of government. Four of the top seven state and regional policies—planning grants, targeted infrastructure funding, tying capital grants to TOD commitments, and locating government buildings near transit—would not pose any risk of a
4 Ibid.
8

challenge under Proposition 207. The remaining three might pose some risk but are not really applicable in Arizona due to policy priorities at the state level.
Exhibit 3 – State and Regional TOD Tools5
Not all of these TOD policy incentives have the same range of uncertainty surrounding their value. Some incentives can vary tremendously based on the characteristics of a site and the market conditions. Others are more straightforward, and their value can be more easily predicted. Given this variation, it is helpful to explore the potential value of specific policies through a few examples of their application. The key test relative to Proposition 207 is how such incentives translate into no decreases in the fair market value of property (ARS § 12-1136, 1). The following is a summary of key incentives that can be applied to Metropolitan Phoenix. Flexible / Reduced Parking Requirements Flexible parking standards for residential and commercial development near transit stations have been adopted in more than half of all rail-based TOD programs.6 There are two primary rationales for reducing the required amount of parking near transit stations: households living near stations own fewer cars, and more workers take transit to jobs located near stations. For residential parking, Reconnecting America7 used Census data to examine auto ownership in transit zones (see Exhibit 4). Its study concluded that households near transit stations consistently own fewer cars. For example, households living near the stations in medium-sized rail systems own 1.2 cars on average, compared with a national average of 1.7 cars per
5 Cervero, R. et al. TCRP Report 102, Transit-Oriented Development in the United States: Experiences, Challenges and Prospects, Transportation Research Board. 2004. Figure 4.5 pg. 75. 6 Ibid. 7 Reconnecting America. Hidden in Plain Sight: Capturing the Demand for Housing Near Transit, Reconnecting America. November 2004. pp. 21.
9
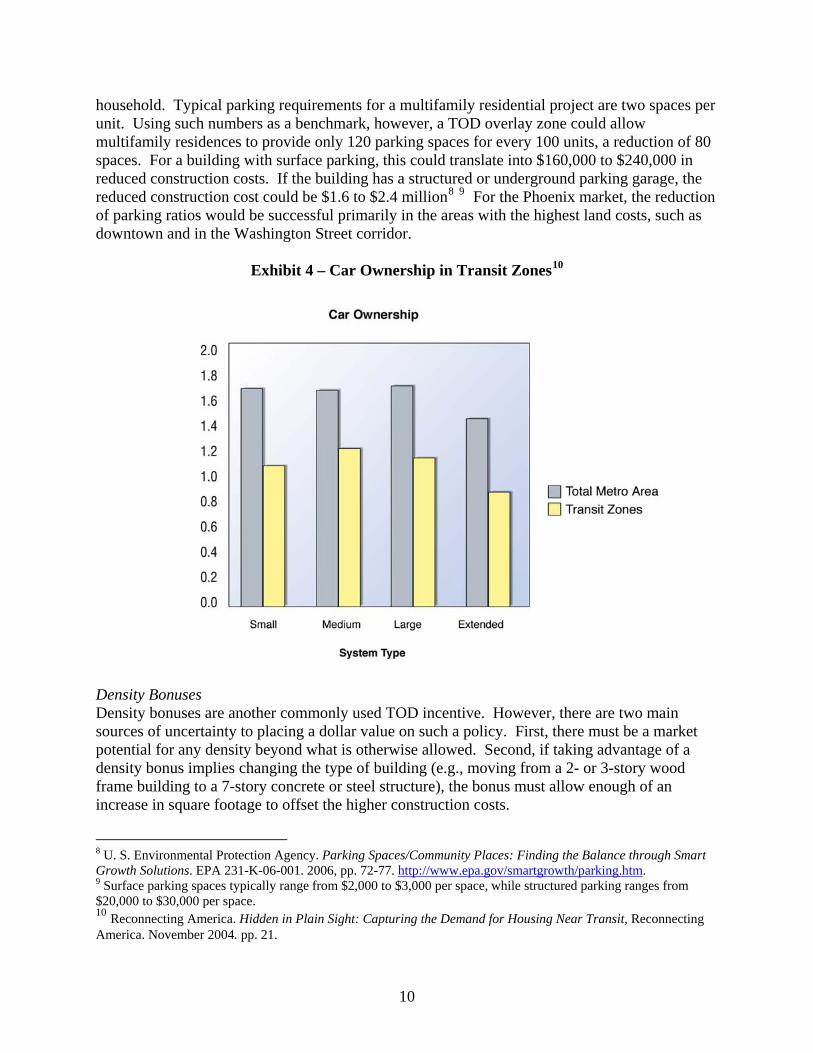
household. Typical parking requirements for a multifamily residential project are two spaces per unit. Using such numbers as a benchmark, however, a TOD overlay zone could allow multifamily residences to provide only 120 parking spaces for every 100 units, a reduction of 80 spaces. For a building with surface parking, this could translate into $160,000 to $240,000 in reduced construction costs. If the building has a structured or underground parking garage, the reduced construction cost could be $1.6 to $2.4 million8 9 For the Phoenix market, the reduction of parking ratios would be successful primarily in the areas with the highest land costs, such as downtown and in the Washington Street corridor.
Exhibit 4 – Car Ownership in Transit Zones10
Density Bonuses Density bonuses are another commonly used TOD incentive. However, there are two main sources of uncertainty to placing a dollar value on such a policy. First, there must be a market potential for any density beyond what is otherwise allowed. Second, if taking advantage of a density bonus implies changing the type of building (e.g., moving from a 2- or 3-story wood frame building to a 7-story concrete or steel structure), the bonus must allow enough of an increase in square footage to offset the higher construction costs.
8 U. S. Environmental Protection Agency. Parking Spaces/Community Places: Finding the Balance through Smart Growth Solutions. EPA 231-K-06-001. 2006, pp. 72-77. http://www.epa.gov/smartgrowth/parking.htm. 9 Surface parking spaces typically range from $2,000 to $3,000 per space, while structured parking ranges from $20,000 to $30,000 per space. 10 Reconnecting America. Hidden in Plain Sight: Capturing the Demand for Housing Near Transit, Reconnecting America. November 2004. pp. 21.
10

The cost figures from the analysis done for sites in the Tempe-Mesa corridor provide a benchmark to illustrate this point.11 When the height of a multifamily residential building goes from 3 to 4 stories, the construction cost per square foot rise by 3 percent. Moving from 6 to 7 stories increases cost per square foot by 13 to 17 percent, depending on what kind of parking is provided. If the net value of the building per square foot does not increase by more than this amount, the density bonus has no value. For office buildings, the increase in density has a much smaller impact on construction costs, since the construction materials change less dramatically—there is only a 1 percent increase in cost per square foot when moving beyond 6 stories. Therefore, a density bonus has a much greater chance of generating increased value on properties suitable for office development. Site and Station Area Planning Spending public funds to support site design and station area plans can also be a valuable incentive. Such planning has benefits in the New Starts rating process and can also add financial value to parcels with redevelopment potential by reducing “entitlement risk” for developers. In particular, if such planning translates into changes to existing zoning—e.g., increased density, reduced parking requirements, and mixed-use development specifically permitted as a use category—then communities could benefit financially for these investments. For example, a study of the Westside light rail line in Portland concluded that the station area planning and implementation of TOD zoning tools increased the value of parcels in advance of the system’s opening. Funding to support traffic impact studies, site design, or other permit reviews required for development approval can also potentially translate into increased land values. In effect, the more that is currently required of developers, the greater the potential opportunity to provide an incentive by defraying such costs for TOD projects.
Expedited Development Review The value of expedited development review is largely tied to two factors: the carrying costs that a potential developer faces and the time an alternative process saves. In other words, if a developer owns a vacant parcel outright, the carrying costs are primarily tied to the monthly taxes he or she pays on the parcel. However, if a developer finances the acquisition of land with a bridge loan, the cost for each additional month it takes to navigate the approval process can be quite costly. Investments for Project Viability Capital funding for infrastructure improvements can also translate directly into increased property value. Many parcels along the light rail corridor may require additional investment to upgrade water, sewer, or electric utilities before they can be redeveloped. If such infrastructure upgrades are financed by connection fees, waiving these fees in TOD zones could be a valuable incentive. Alternatively, waiving fees lowers overall construction costs so that they can be covered by the market value of the unit. This is important for many of the station areas in the corridor where the key aspect will be revenue generation, not reduction of unit prices. 11 Economic and Planning Systems. Memo to Phoenix and Mesa entitled Light Rail Station Area Development Feasibility Analysis and Implementation Recommendations, EPS #16027. May 2007. pp. 1-12.
11
Light Rail Investment and Land Value Premiums The increased land values that results from the public investment in light rail should be considered in any claim of lost property value from a TOD policy such as use restrictions or design standards. Many studies, including Reconnecting America’s Hidden in Plain Sight, have been conducted over the past 15 years evaluating the premium associated with properties near light rail stations. Although the results vary depending on the strength of the real estate market and the nature of the rail system serving the properties, the studies have found that land near light rail stations usually commands a premium. For example, one study found that commercial land value premiums near light rail stations were 30 percent along San Diego’s North Line, 24 percent in San Jose, and 60 percent for some properties in downtown Denver.12 A study in Dallas quantified the increase in property values for land near the light rail line against comparable properties. Land near the light rail stations increased in value 14 to 34 percent, while comparable properties’ value increased by only 3 to 7 percent over a four-year period.13 The time period for consideration of diminished value is strictly the present time when the property is transferred. Values will generally accrue over time and are not always evident at the point when a developer might be ready to build a project. An Opt-in Approach to Overlay Zones Cities such as Phoenix and Mesa may also choose to implement new TOD overlay zones through an opt-in method as a more conservative approach to avoiding Proposition 207 claims. The entire TOD overlay zone could be implemented in this fashion, or simply the provisions most likely to produce compensation claims. For example, the use restrictions on auto-oriented businesses that potentially generate a lot of revenue, such as car washes and storage facilities, could be phased in. Furthermore, the opt-in method could also be place specific, where an argument can be made in terms of increased real estate value, public safety, traffic, etc. The use of this approach could also vary based on station typology. This opt-in feature would need to be paired with incentives to ensure enough property owners participated to make a meaningful overlay zone. The opt-in system would be ineffective if it led to an incoherent patchwork district, such as incompatible uses that constrain values. An example of this would be a car wash adjacent to mixed-use development because it breaks up the pedestrian realm. One basic mechanism for implementation would presumably be an agreement signed by a property owner or developer waiving his or her right to pursue claims under Proposition 207. In return the owner would be entitled to incentives and tools tied to the TOD district similar to those described above. The cities would also have to be ready and able to offer whatever package of incentives they want to make available, including certain permit fee waivers. This isn’t impossible, but it does present a political challenge in terms of getting all of the interests aligned. Another option would be an automatic opt-in triggered by the sale of a property. The statute explicitly states that a property owner must own a property before a law is enacted to be entitled
12 Cervero, R. et al. TCRP Report 102, Transit-Oriented Development in the United States: Experiences, Challenges and Prospects, Transportation Research Board. 2004. Ch.9 13 Ibid.
12

to make a claim (ARS § 12-1134, A). Therefore, a parcel could be opted-in to the TOD overlay zone since the new owner did not possess the property at the time the law was enacted. This in a sense “resets” the restrictions upon the parcel in question. This option would be in addition to the option of a current owner opting in. This would help to accelerate achieving a coherent district. Form-Based Codes as an Alternative Strategy Form-based codes might be an attractive alternative to the current approach to TOD overlay zones. In particular, they would help ensure that development around stations makes walking safe and pleasant and builds ridership without directly restricting uses. Although restricting auto-oriented uses is a more direct path to ensuring transit-supportive station area development, the potential that restriction creates for compensation claims might make form-based codes an attractive alternative. In fact, the current TOD overlay zones adopted in Phoenix include development standards consistent with the concept of form-based codes (see Table 2). Traditional zoning regulates uses, setbacks, and intensities in a designated area. Form-based codes differ in two ways. First, they do not include use restrictions. Second, they set up a detailed block-level framework of standards for street frontage, the configuration of buildings, buildings’ size in relation to one another, the scale of streets, and block size. In other words, the form, scale, and character of development are the primary focus. The regulations are presented in both diagrams and words (see Exhibit 5). Unlike design guidelines or general statements of policy, they are mandatory rather than advisory.14
Exhibit 5: Visual Diagram of a Form-Based Code
Form-based codes would enable overlay zones to focus on placemaking rather than controlling uses and capping intensity in the zone. The most important factor for using form-based codes to promote transit-oriented development is how each building functions and contributes to a sense of community around the transit station.15 A car wash, car dealership, or self-storage facility could be located near a transit station but designed in a way that supports rather than detracts
14 Form-Based Code Institute. www.formbasedcodes.org. Accessed January 17, 2009. 15 Parolek, D. et al. Form-Based Codes: A Guide for Planners, Urban Designers, Municipalities and Developers. John Wiley and Sons, Inc.: New Jersey. 2008. pp. 12-17.
13
from a pedestrian-oriented environment. This approach would not achieve the ridership objectives of direct use restrictions, but it would at least protect the pedestrian environment and make it easy to walk to the station from other parcels, even with predominantly auto-oriented uses. A form-based code can provide significant benefits to a TOD project. First, it provides a design-oriented framework best suited for organizing buildings to create public spaces and accommodating to transit usage. A TOD overlay zone based on a form-based code could also guide and encourage the land uses to meet the criteria in the New Starts rating system.16. Another feature of form-based codes is that it has either no or minimal setbacks, which allows buildings to frame the street and create a more comfortable walking environment. The aim is to encourage transit-supportive uses. Uses are not denied but need to be sited in a manner that contributes to the overall function of the station areas.
Another way to use a form-based code to encourage transit is to consider a graduated strategy that takes into account station typology and proximity to the station within the ½-mile radius station area. For the properties closest to the stations—perhaps 800 feet or 1/8 mile away—public safety, public health, protection of public investment, and market viability issues would be the strongest considerations. The encouragement of transit use depends on the how desirable an environment it is to use. For instance, transit stations that are in the middle of highway right-of-ways typically do not generate as many riders, especially pedestrians, as stations that are integrated into an urban fabric. Application of a form-based code can provide the amenities necessary to achieve the desired urban fabric. When development is focused on the building form versus the usage, amenities such as sidewalks, public open space are presented as part of a overall concept to promote walking and create a sense of place that can attract investors and users. Beyond this radius, the form-based code could be an opt-in strategy. The importance of use restrictions may be different for a station that is more focused on access to other modes (i.e., park and ride, bus transfer, regional rail) than for a station that is more of a destination. Form-based codes have been used to support TOD in several places, including Leander, Texas; Albuquerque, New Mexico; and Dallas, Texas.
16 Supportive Zoning Regulations Near Transit Stations - Land Use Criteria II. c. and Tools to Implement Land Use Policies - Land Use Criteria II. d. Table 3.
14

Exhibit 6 – Overview of Phoenix’s Current TOD Overlay Zone
TOD 1 Overlay Zone Property Value Impacts Use restrictions Prohibited uses including bulk retail, car
washes, gas stations, and storage facilities. Conditional uses including drive-through facilities, fast-food establishments, and grocery stores with building footprints over 50,000 square feet. Existing uses shall not be prohibited until January 2014; then property owners within the district may seek Special Use Permit. Large retail (in excess of 80,000 square feet) shall not front the street with parking lots. Instead, liner buildings shall be required and front pedestrian-oriented streets.
Uses are organized to encourage businesses that attract pedestrians, provide a density that can provide a return on investment, and enable a high percentage of trips by transit. Impacts related to health, pollution, and transportation are considered. Conditions are general concepts versus specific thresholds; property owners may test limits of these requirements to preserve costs. Market conditions may slow the redevelopment of properties that will eventually be special uses (in 2014) to allowable uses. The intent is to eliminate over time uses that are prohibited under the TOD overlay. The Special Use Permit process is the same as rezoning and, while not insurmountable, the process is somewhat complicated and open to public comment. The city of Phoenix might approve Special Use Permits for most businesses who request them. Incentives would help outweigh the small pain of applying for the Special Use Permit. Starting in 2014, the requirement for the Special Use Permit may be changed to reflect new priorities.
15

Development standards
Maximum setback: 12 feet for non-residential and mixed-use 18 feet for residential Sidewalk width: 8 feet; 6 feet in residential areas with a density less than 12 units/acre Minimum building frontage: 75% if 0-500 feet from station 65% if 500-2,000 feet from station
These standards create the parameters for a pedestrian-oriented environment along the light rail corridor. Each element contributes to the creation of a distinct sense of place. This should raise property values. Wide sidewalks and density around the station and businesses encourage people to walk, which provides more customers for businesses.
TOD 2 Overlay Zone Property Value Impacts Use restrictions 8 prohibited uses including car washes,
drive-in businesses, and exterior display of goods. 7 conditional uses subject to 5 conditions including drive-through facilities, fast-food establishments, and grocery stores with building footprints over 50,000 square feet. Other provisions are the same as TOD-1.
Storage facilities, gas stations, and truck stops become permitted uses in TOD-2. The list of allowable uses is the key difference between TOD-1 and TOD-2. The uses that are permitted in TOD-2 are not as pedestrian friendly as the uses in TOD-1. The development standards encourage a level of development consistent with TOD, but will the market deliver these uses or direct them to other locations?
Development standards
Same standards as for TOD-1
Same analysis as in TOD-1.
IV. TOD Policies and the FTA New Starts Evaluation Process Beyond creating better communities for residents, one of the most important reasons for undertaking the review of TOD tools is that promoting TOD improves the city’s chances of receiving federal support to expand the light rail system. The New Starts Program is a highly competitive system for allocating major capital project grants for transit systems. Projects not receiving the highest rating under New Starts have little chance of getting federal funding. The rating system has changed over the past few years, shrinking from a system that rated projects across five criteria to one in which two rating categories, cost effectiveness and transit-supportive land use, are the fundamental rating criteria. Although future TOD near station areas is no longer counted toward the ridership projections underpinning cost effectiveness, TOD policies still play an important role in the rating criteria.
16

FTA guidance also emphasizes that ratings are an “on-going process”, meaning that the evaluation of future proposals may consider conditions associated with existing situations.17 Therefore, because Phoenix’s transit overlay districts were a prominent part of past proposals, FTA may be concerned about any substantial watering down of these provisions for future proposed extensions. “Existing land use” is a component of the rating criteria (see Exhibit 7), which is relevant because the system is planned to expand into northwestern Phoenix and eventually toward Glendale and downtown Mesa. Development in these areas is lower density and has more auto–oriented, single-use land use around stations. Therefore, it becomes even more important for the transit-supportive plans and policies to rate high to balance out the medium rating that the existing land use will probably receive. V. Conclusion This paper describes options communities in metropolitan Phoenix could use to promote transit-oriented development while taking into account impacts related to Proposition 207. Phoenix and the other communities along the light rail corridor are looking for policy options that meet multiple goals, including:
• Promoting and encouraging transit-supportive land uses at transit stops and along the corridor;
• Addressing FTA’s land use criteria through a complement of TOD-promoting tools and incentives; and
• Strengthening property values, in line with the goal of Proposition 207. To achieve these goals, communities will have to creatively use available tools to promote TOD and incentives to that the type of development they want is fiscally viable. Success will come from providing the right tools for the right situation, but it will also depend on cities making significant, long-term investments to transform land use patterns to support current and future transit. Denser development along the corridor, done in a context-sensitive way, will help support transit and other community goals. Other documents in this report will further define how these goals and objectives could be achieved. These include Strategic Package of Tools: Transit Oriented Development in Metropolitan Phoenix, Encouraging Transit Oriented Development: Case Studies that Work, and Impact of Transit Oriented Development and Smart Growth Incentives on Development in Phoenix.
17 U. S. Department of Transportation. Federal Transit Administration. July 2007. FY 2009 New Starts and Small Starts Evaluation and Rating Process p. B-10 Annual Report on Funding Recommendations - FY 2009 New Starts and Small Starts Evaluation and Rating Process.
17

Exhibit 7 - Summary of the New Starts Land Use Rating System Rating Category
and Associated Factors Supporting Factors
I. EXISTING LAND USE a. Existing Land Use
• Existing corridor and station-area development character • Existing station-area pedestrian facilities, including
access for persons with disabilities • Existing corridor and station-area parking supply
II. TRANSIT-SUPPORTIVE PLANS AND POLICIES a. Growth Management • Concentration of development around established
activity centers and regional transit • Land conservation and management
b. Transit-Supportive Corridor Policies
• Plans and policies to increase corridor and station-area development
• Plans and policies to enhance transit-friendly character of corridor and station-area development
• Plans to improve pedestrian facilities, including facilities for persons with disabilities
• Parking policies
c. Supportive Zoning Regulations Near Transit Stations
• Zoning ordinances that support increased development density in transit station areas
• Zoning ordinances that enhance transit-oriented character of station-area development and pedestrian access
• Zoning allowances for reduced parking and traffic mitigation
d. Tools to Implement Land Use Policies
• Outreach to government agencies and the community in support of land use planning
• Regulatory and financial incentives to promote transit-supportive development
• Efforts to engage the development community in station- area planning and transit-supportive development
III. PERFORMANCE AND IMPACTS OF POLICIES a. Performance of Land Use Policies • Demonstrated cases of development affected by transit-
supportive policies • Station-area development proposals and status
b. Potential Impact of Transit Investment on Regional Land Use
• Adaptability of station-area land for development • Corridor economic environment
IV. OTHER LAND USE CONSIDERATIONS (Optional) Exceptional Examples • Historic, environmental, community preservation, etc.
18

Appendix A Detailed Scoring Tables for the New Starts Rating System18
I. EXISTING LAND USE
Existing Land Use Phase of Project Development
Land Use Assessment Ratings
Preliminary Engineering and Final Design
HIGH (5) Current levels of population, employment, and other trip generators in station areas are sufficient to support a major transit investment. Most station areas are pedestrian friendly and fully accessible.
MEDIUM (3) Current levels of population, employment, and other trip generators in station areas marginally support a major transit investment. Some station areas are pedestrian friendly and accessible. Significant growth must be realized.
LOW (1) Current levels of population, employment, and other trip generators in station areas are inadequate to support a major transit investment. Station areas are not pedestrian friendly.
Ratings based on assessment of the following: • Existing corridor and station-area development; • Existing corridor and station-area development character; • Existing station-area pedestrian facilities, including access for persons with disabilities; and • Existing corridor and station-area parking supply.
II. TRANSIT-SUPPORTIVE PLANS AND POLICIES
Growth Management (DOES NOT APPLY TO SMALL STARTS) Phase of Project Development
Land Use Assessment Ratings
Preliminary Engineering and Final Design
HIGH (5) Adopted and enforceable growth management and land conservation policies are in place throughout the region. Existing and planned densities, along with market trends in the region and corridor, are strongly compatible with transit.
MEDIUM (3) Significant progress has been made toward implementing growth management and land conservation policies. Strong policies may be adopted in some jurisdictions but not others, or only moderately enforceable policies (e.g., incentive-based) may be adopted regionwide. Existing and/or planned densities and market trends are moderately compatible with transit.
LOW (1) Limited consideration has been given to implementing growth management and land conservation policies; adopted policies may be weak and apply to only a limited area. Existing and/or planned densities and market trends are minimally or not supportive of transit.
Ratings based on assessment of the following: • Concentration of development around established activity centers and regional transit; and • Land conservation and management.
18 U. S. Department of Transportation. Federal Transit Administration. July 2007. FY 2009 New Starts and Small Starts Evaluation and Rating Process
19

II. TRANSIT-SUPPORTIVE PLANS AND POLICIES
Transit-Supportive Corridor Policies Final Design HIGH (5) Conceptual plans for the corridor and station areas have been developed.
Local jurisdictions have adopted or drafted revisions to comprehensive and/or small area plans in most or all station areas. Land use patterns proposed in conceptual plans and local and institutional plan revisions are strongly supportive of a major transit investment.
MEDIUM (3)
Conceptual plans for the corridor and station areas have been developed. Local jurisdictions have initiated the process of revising comprehensive and/or small area plans. Land use patterns proposed in conceptual plans and local and institutional plan revisions are at least moderately supportive of a major transit investment.
LOW (1) Limited progress, to date, has been made toward developing station area conceptual plans or revising local comprehensive or small area plans. Existing station area land uses identified in local comprehensive plans are marginally or not transit supportive.
Preliminary Engineering
HIGH (5) Conceptual plans for the corridor and station areas have been developed. Discussions have been undertaken with local jurisdictions about revising comprehensive plans. Land use patterns proposed in conceptual plans for station areas (or in existing comprehensive plans and institutional master plans throughout the corridor) are strongly supportive of a major transit investment.
MEDIUM (3)
Conceptual plans for the corridor and station areas are being developed. Discussions have been undertaken with local jurisdictions about revising comprehensive plans. Land use patterns proposed in conceptual plans for station areas (or existing in local comprehensive plans and institutional master plans) are at least moderately supportive of a major transit investment.
LOW (1) Limited progress, to date, has been made toward developing station-area conceptual plans or working with local jurisdictions to revise comprehensive plans. Existing station-area land uses identified in local comprehensive plans are marginally or not transit supportive.
Ratings based on assessment of the following: • Plans and policies to increase corridor and station-area development; • Plans and policies to enhance transit-friendly character of corridor and station-area development; • Plans to improve pedestrian facilities, including facilities for persons with disabilities; and • Parking policies.
20

II. TRANSIT-SUPPORTIVE PLANS AND POLICIES
Supportive Zoning Regulations Near Transit Stations HIGH (5) Local jurisdictions have adopted zoning changes that strongly support a
major transit investment in most or all transit station areas. MEDIUM (3)
Local jurisdictions are in the process of adopting zoning changes that moderately or strongly support a major transit investment in most or all transit station areas. Alternatively: strongly transit-supportive zoning has been adopted in some station areas but not in others.
Final Design
LOW (1) No more than initial efforts have begun to prepare station-area plans and related zoning. Existing station area zoning is marginally or not transit supportive.
Preliminary Engineering
HIGH (5) A conceptual planning process is underway to recommend zoning changes for station areas. Conceptual plans and policies for station areas are recommending transit-supportive densities and design characteristics. Local jurisdictions have committed to examining and changing zoning regulations where necessary. Alternatively, a “high” rating can be assigned if existing zoning in most or all transit station areas is already strongly transit supportive.
MEDIUM (3)
A conceptual planning process is underway to recommend zoning changes for station areas. Local jurisdictions are in the process of committing to examining and changing zoning regulations where necessary. Alternatively, a “medium” rating can be assigned if existing zoning in most or all transit station areas is already moderately transit supportive.
LOW (1) Limited consideration has been given to preparing station area plans and related zoning. Existing station area zoning is marginally or not transit supportive.
Ratings based on assessment of the following: • Zoning ordinances that support increased development density in transit station areas; • Zoning ordinances that enhance transit-oriented character of station-area development and pedestrian access;
and • Zoning allowances for reduced parking and traffic mitigation.
21

II. TRANSIT-SUPPORTIVE PLANS AND POLICIES
Tools to Implement Land Use Policies Final Design HIGH (5) Transit agencies and/or regional agencies are working proactively with
local jurisdictions, developers, and the public to promote transit-supportive land use planning and station-area development. The transit agency has established a joint development program and identified development opportunities. Agencies have adopted effective regulatory and financial incentives to promote transit-oriented development. Public and private capital improvements are being programmed in the corridor and station areas which implement the local land use policies and which leverage the federal investment in the proposed corridor.
MEDIUM (3)
Transit agencies and/or regional agencies have conducted some outreach to promote transit-supportive land use planning and station-area development. Regulatory and financial incentives to promote transit-oriented development are being developed or have been adopted but are only moderately effective. Capital improvements are being identified that support station-area land use plans and leverage the federal investment in the proposed major transit corridor.
LOW (1) Limited effort has been made to reach out to jurisdictions, developers, or the public to promote transit-supportive land use planning; to identify regulatory and financial incentives to promote development; or to identify capital improvements.
Preliminary Engineering
HIGH (5) Transit agencies and/or regional agencies are working proactively with local jurisdictions, developers, and the public to promote transit-supportive land use planning and station-area development. Local agencies are making recommendations for effective regulatory and financial incentives to promote transit-oriented development. Capital improvement programs are being developed that support station-area land use plans and leverage the federal investment in the proposed major transit corridor.
MEDIUM (3)
Transit agencies and/or regional agencies have conducted some outreach to promote transit-supportive land use planning and station area development. Agencies are investigating regulatory and financial incentives to promote transit-oriented development. Capital improvements are being identified that support station-area land use plans and leverage the federal investment in the proposed major transit corridor.
LOW (1) Limited effort has been made to reach out to jurisdictions, developers, or the public to promote transit-supportive land use planning; to identify regulatory and financial incentives to promote development; or to identify capital improvements.
22
II. TRANSIT-SUPPORTIVE PLANS AND POLICIES
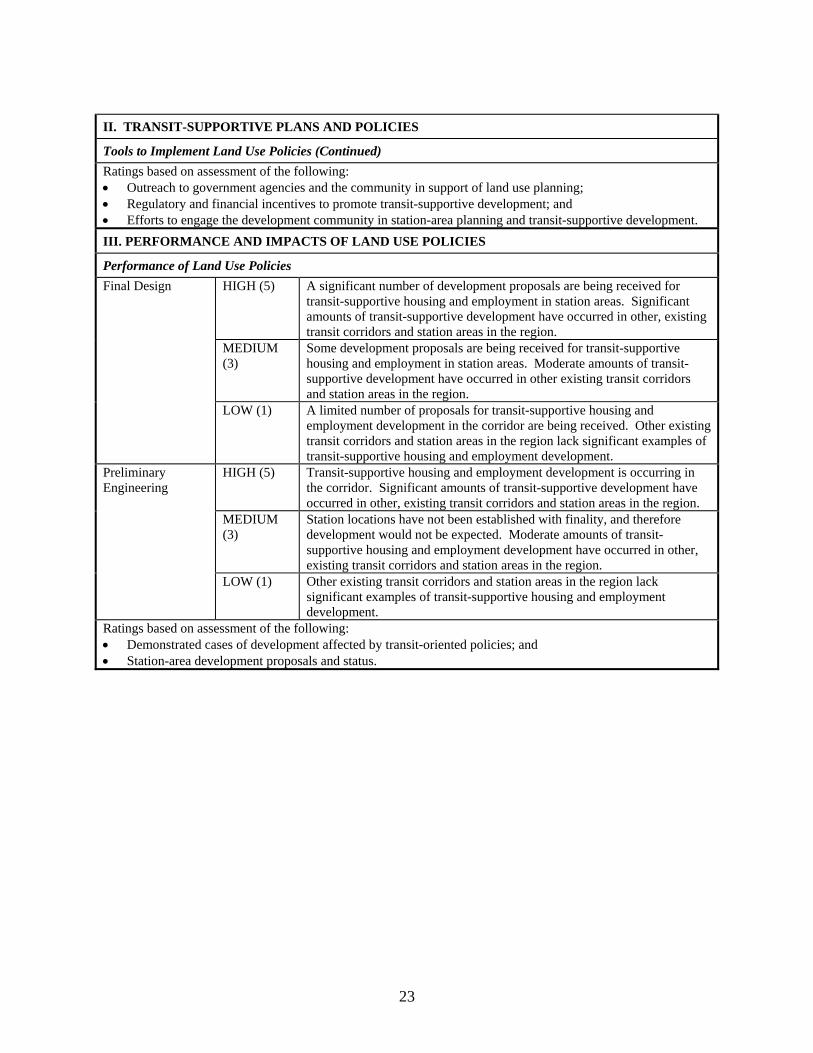
Tools to Implement Land Use Policies (Continued) Ratings based on assessment of the following: • Outreach to government agencies and the community in support of land use planning; • Regulatory and financial incentives to promote transit-supportive development; and • Efforts to engage the development community in station-area planning and transit-supportive development. III. PERFORMANCE AND IMPACTS OF LAND USE POLICIES
Performance of Land Use Policies Final Design HIGH (5) A significant number of development proposals are being received for
transit-supportive housing and employment in station areas. Significant amounts of transit-supportive development have occurred in other, existing transit corridors and station areas in the region.
MEDIUM (3)
Some development proposals are being received for transit-supportive housing and employment in station areas. Moderate amounts of transit-supportive development have occurred in other existing transit corridors and station areas in the region.
LOW (1) A limited number of proposals for transit-supportive housing and employment development in the corridor are being received. Other existing transit corridors and station areas in the region lack significant examples of transit-supportive housing and employment development.
Preliminary Engineering
HIGH (5) Transit-supportive housing and employment development is occurring in the corridor. Significant amounts of transit-supportive development have occurred in other, existing transit corridors and station areas in the region.
MEDIUM (3)
Station locations have not been established with finality, and therefore development would not be expected. Moderate amounts of transit-supportive housing and employment development have occurred in other, existing transit corridors and station areas in the region.
LOW (1) Other existing transit corridors and station areas in the region lack significant examples of transit-supportive housing and employment development.
Ratings based on assessment of the following: • Demonstrated cases of development affected by transit-oriented policies; and • Station-area development proposals and status.
23

III. PERFORMANCE AND IMPACTS OF LAND USE POLICIES
Potential Impact of Transit Project on Regional Land Use Preliminary Engineering and Final Design
HIGH (5) A significant amount of land in station areas is available for new development or redevelopment at transit-supportive densities. Local plans, policies, and development programs, as well as real estate market conditions, strongly support such development.
MEDIUM (3)
A moderate amount of land in station areas is available for new development or redevelopment at transit-supportive densities. Local plans, policies, and development programs, as well as real estate market conditions, moderately support such development.
LOW (1) Only a modest amount of land in station areas is available for new development or redevelopment. Local plans, policies, and development programs, as well as real estate market conditions, provide marginal support for new development in station areas.
Ratings based on assessment of the following: • Adaptability of station-area land for development; and • Corridor economic environment.
24

United States Environmental Protection Agency
Strategic Package of Tools Transit Oriented Development in Metropolitan Phoenix

Strategic Package of Tools to Promote Transit-Oriented Development in Metropolitan Phoenix A successful transit system needs more than a working train line. It requires coordination among municipalities, transit agencies, developers, and property owners to ensure that the system moves people to where they want to go, and that automobile traffic and emissions are reduced. Planning for transit with land uses that support ridership and provide a destination is paramount to making the system viable. Simply put, the Center for Transit-Oriented Development defines transit-oriented development (TOD) as higher-density mixed-use development within walking distance – or a half mile – of transit stations. In metropolitan Phoenix, Proposition 207 provides an additional factor for municipalities to consider while encouraging TOD. In fact, TOD is most successful when a set of tools, mindful of local concerns about property values, is packaged to encourage property owners and developers to develop parcels in a way that embraces pedestrians and mixes uses (residential, commercial, institutional, etc.) to create station areas, neighborhoods, and communities that are rich with amenities. This document summarizes a wide range of tools, both regulatory and non-regulatory, that could be offered to the development community in order to help create and enhance vibrant, healthy communities that support the light-rail transit corridor. The information is described in the following manner:
1. TOD Policy Tool 2. Brief Description of the Tool and Its Purpose 3. Conditions Needed for Applicability 4. Conditions Affecting Expected Value of Tool 5. Viability of the Tool in the Phoenix Region 6. Examples
Not all of these tools can be applied at every station area. Those decisions will be up to the local jurisdiction, based on current and future planning, a determination of the benefits that could be gained from these tools, and consideration of their impacts related to Proposition 207. Different stations and variable contexts will inspire a mixture of tools to be used. This document is to be supplemented by 3 other documents, all to build a case for encouraging TOD with effective and prosperous results:
• Transit-Oriented Development in Phoenix and Mesa: Developing a Policy Toolbox for the Post-Proposition 207 Environment
• Encouraging Transit-Oriented Development in Metropolitan Phoenix: Case Studies that Work • Impact of TOD and Smart Growth Incentives on Development in Phoenix
1

Introduction The TOD tools presented in the table on the following pages are organized in two ways. First, the tools are grouped according to their primary function in defining and supporting the implementation of TOD in the Phoenix region. These functional categories are important for understanding the range of efforts that need to be undertaken by the regional and local agencies and private interests to achieve successful TOD. The functional categories for the TOD tools are: • Strategic Planning (SP): Transit station area planning, unlike other kinds of area plans, must take into account how the
transit station connects to other locations in the entire transit system and the region. Important considerations for assessing the opportunity offered by such connectivity include such factors as:
o Will this station be a destination on the transit line, or will riders more likely originate their trip from this location? o What mix of uses and use intensity are likely to be appropriate given the station’s location and the existing
surrounding development pattern? o Is there much opportunity for new development around the station, or is most of the impact from improved
connectivity likely to be absorbed by existing buildings? o What kind of market momentum already exists in the station area, and is it likely to be viable for new TOD in the
near to mid-term, or is new development several years out? Depending on these local conditions, cities can prioritize how to direct resources for targeted and area-specific planning efforts and for additional investment in various implementation tools.
• Local Visioning and Land Use Policy (LU): These tools shape land use policies for the implementation of TOD, such as
zoning, design guidelines, and parking requirements. Of the tools discussed here, they have the strongest relationship to Proposition 207 because they will lay out acceptable uses of land in station areas. To respect Proposition 207, the tools described here were selected because they can be used in ways that mitigate the issue of property value diminution. These tools provide for flexibility and can help define public needs related to transportation and public health and safety. Many of the tools in this category have a secondary relationship to other functional categories in which these tools create the foundation for implementing other policies; particularly the “Prepare Station Area Plans and Market Studies” tool (LU-1), which would establish the vision and implementation framework for each station area.
• Development Assistance (DA): These tools are focused on directly and indirectly encouraging private investment in TOD
by investing public funds, reducing or removing fees or taxes, and decreasing processing time for development proposals. • Place Making and Access (PM): These tools focus on improving multi-modal access to the transit station and creating an
environment that supports and encourages walking and bicycling in the station area. This is important not only to supporting
2

transit ridership, but to reducing demand for parking and driving in the station area for everyone, whether they have arrived by transit, car, or other means of transportation. These tools have a secondary relationship to land use policy and development assistance.
• Land Assembly (LA): Where there is weak market support for TOD, tools like re-zoning and area specific design guidelines
will probably be insufficient to catalyze new development. In these areas, more direct actions may be required, like acquiring strategic parcels, assembling land that could be sold at a reduced price or held until market demand is stronger, or both. This land could be used to leverage higher density projects and encourage a greater mix of uses.
• Programmatic and Institutional (PI): Public agencies and community-based organizations play a critical role in supporting
TOD implementation through their programs and institutional relationships. Many of these tools have a secondary relationship to land assembly and development assistance tools.
The categories of tools are organized by priority, reflecting the general sequence in which the tools would be deployed: • The first group of tools, “Planning & Visioning,” establish the foundation for use of other tools and would be deployed starting
with the Strategic Planning, followed by the station area plans. Each station area plan should include the basic elements of Tools LU 2A through LU 5C.
• Once the planning and visioning have been completed, the order in which the next group, Implementation, would be deployed will depend on conditions at each station area, as well as local resources as identified in the Station Area Plan. While the Strategic Planning tools should address all of the existing and proposed station areas, the implementation tools will not necessarily apply to or be equally effective in all settings. Decisions about implementation tools and priorities can only be addressed as part of a station area planning process.
• The third group of tools, On-going Programs, applies to ongoing programs and institutional arrangements that could be addressed in the station area planning process or as part of a city or regional planning initiative for TOD.
As part of the April 14-17, 2009, workshop, the EPA team asked stakeholders to confirm the viability of each tool, as described in a draft of this document. Viability is a measure of the ease and potential success of implementation. The matrix identifies the viability of each tool as “positive,” “neutral,” or “negative.” These designations were determined by the EPA team prior to the workshop and confirmed by the local partners, based on the tool’s relation to Proposition 207, public costs, and political will. Tools that are rated as “positive” are those that have the best chance of success based on the existing regulatory and development process. “Neutral” and “negative” viability designate tools that require some additional work to make local conditions appropriate to benefit from these strategies. The TOD policy tools provide a range of ideas that are suitable for the Phoenix region, as well as some ideas that could be considered in the future. During the site visit, the team and the municipal staff discussed using education as a tool to promote TOD. An important component of any community development strategy, education helps stakeholders and the general public understand the process
3

and participate meaningfully, which increases the likelihood of success. In the Phoenix region, education about the tools is essential for public support. While this matrix does not list a tool called “Education,” the consensus of the stakeholders who participated in the team’s site visit was that a formal education process about these tools should be developed for a variety of audiences. Education activity should be coordinated at the staff level, with a focus on showing how each tool relates to stakeholder groups.
4

TOD Tools in the Phoenix Region: Summary Table TOOL PRIORITIES
TOD POLICY TOOLS Planning & Visioning Implementation Ongoing
Programs SP-1 Regional TOD Strategic Plan POSITIVE
SP-2 Citywide TOD Strategic Plan POSITIVE
LU-1 Prepare Station Area Plans and Market Studies POSITIVE
LU-2A, B & C Station Area Rezoning: Rezone Station Areas, Use Restrictions Based on Public Health and Safety and Transportation Impacts, and Optional Overlay Zone POSITIVE OR NEGATIVE
LU-3A & B Land Use Intensity Tools: Density Bonuses and FARs and Building Height Bonuses POSITIVE
LU-4A & B Land Use Standards Enhancement: Form-Based Codes and Design Guidelines POSITIVE
LU-5A, B & C Parking Tools: Revised Parking Standards, Shared Parking, and Parking Districts POSITIVE
DA-1 Fast Track Development Review POSITIVE
DA-2 Capital Funding for Infrastructure POSITIVE
DA-3 Tax Increment Financing REQUIRES STATE LEGISLATION
DA-4 Reduced Impact Fees in Station Areas CURRENTLY INFEASIBLE
PM-1 Streetscape and Pedestrian/Bike Improvements POSITIVE
PM-2 Façade and Site Frontage Improvement Program NEUTRAL
PM-3 Tax-Exempt Bonds NEGATIVE
PM-4 Tax Abatement CURRENTLY INFEASIBLE
LA-1 Joint Development Program NEUTRAL
LA-2 Land Acquisition Loan Funds NEUTRAL
LA-3 Funds for Buying Available Parcels in the Open Market NEUTRAL
PI-1 Business District Association or Business Improvement District POSITIVE
PI-2 Marketing Plan POSITIVE
PI-3 Livable Communities Program NEUTRAL
PI-4 Community Development Corporation (CDC) Lead Efforts CURRENTLY INFEASIBLE
PI-5 Housing Trust Funds CURRENTLY INFEASIBLE
5

TOD Policy Tool Brief Description of Tool and Its Purpose
Conditions Needed for Applicability
Conditions Affecting Expected Value of Tool
Viability of the Tool in Phoenix Region
Examples
STRATEGIC PLANNING TOOLS SP-1 Regional TOD Strategic Plan
Regional TOD Strategic Plans give cities and regional agencies, including the transit operator and metropolitan planning organization or council or governments an opportunity to consider all of the stations in the transit network and to evaluate what each will contribute in terms of ridership and the potential for future TOD. These plans should address: who lives or works in the station area and how population and/or employment has changed over time; current land use mix; future development opportunity; market strength; and potential for near-, mid-, or long-term development.
The regional agencies should work with the cities to define the general station area types, assign these types to specific areas, and set priorities for creating station area plans.
This type of planning helps to align the interests of the various actors necessary to implement effective TOD, including developing consensus about the expected pattern of development along various transit lines and the rate at which these areas are likely to build out.
Overall Viability = Positive Strategic planning is a catalytic tool that can set the course for development throughout the region. During the April 2009 workshop, non-profits rated regional strategic planning as the most viable tool, with strong support from other sectors. It was identified as the second most viable tool by all respondents. While stakeholder support is helpful, viability depends on elected officials and city staff to prioritize resources to enable implementation.
In 2009, the Baltimore region is worked on a strategic plan that will identify which stations should be the focus of near-term investment, what tools should be used to facilitate TOD, and what role various actors will play in implementing TOD. This planning process is being facilitated by a non-profit and includes: State of Maryland, Baltimore City, Baltimore County, Citizens Planning and Housing Association, and Baltimore Neighborhood Collaborative Funding for this process came from local and national foundations that are supporting TOD to help revitalize distressed neighborhoods and focus future growth around transit.
SP-2 Citywide TOD Strategic Plan
The objective of a Citywide TOD Strategic Plan is similar to that of the regional plan, but in this case a key activity
A staff person or people who are tasked with implementing TOD and who have the authority to convene and facilitate work with
Having the ongoing commitment to TOD implementation and the right staff resources aligned to facilitate this process is critical to the
Overall Viability = Positive Strategic planning at the city scale is a critical element of TOD
The city of Denver used a strategic planning process to prioritize investments and organize roles and responsibilities for
6

TOD Policy Tool Brief Description of Tool and Its Purpose
Conditions Needed for Applicability
Conditions Viability of the Affecting Expected Value of Tool
Tool in Phoenix Examples Region
is to bring together all of the city departments that would be involved in implementing future station area plans to be sure that they understand their role in facilitating TOD. In addition, the city can conduct more intensive screening and prioritization to filter which station areas will be targeted for early action and which are more appropriate for future investment.
other staff across multiple departments should coordinate the strategic planning process.
long-term success of TOD.
implementation. During the workshop, attendees identified “citywide TOD Strategic Plan” as the most effective tool. Planning at the city scale can help Phoenix better understand its needs and direction.
implementing TOD across a variety of city departments. The plan helped the city get organized and develop a work program for station area planning and some of the other supporting efforts, such as zoning, parking, and affordable housing. The city of Charlotte, North Carolina, has two staff people dedicated to facilitating TOD, even though these people are not responsible for the station area planning. Charlotte considers these staff positions critical to the success it has had with TOD, which includes several thousand units built or under construction near the newly opened South (Blue) line.
7

TOD Policy Tool Brief Description of Tool and Its Purpose
Conditions Needed for Applicability
Conditions Viability of the Affecting Expected Value of Tool
Tool in Phoenix Examples Region
LAND USE POLICY TOOLS LU-1 Prepare Station Area Plans and Market Studies
Station area plans establish an overall vision for the entire transit district, indicating the type of desired development, appropriate mix of land uses, and likely public amenities that will be provided by both the public sector and individual development projects. The station area planning needs to take into consideration the function of the station and surrounding area as part of the regional transit network (e.g., as a destination or origin station). 1 This vision allows property owners and developers to understand what uses and building types may be allowable for their properties and
The region will need a dedicated source of funding for these station area planning efforts. Many regions use flexible transportation funds to pay for transit station area planning. The region would have to make a commitment to this. The potential for this funding approach could be determined through discussions with Maricopa Association of Governments and cities in the region during the preparation of the Regional TOD Strategic Plan (Tool SP-1).
The planning process should engage area residents, particularly in defining the vision, as well as developers, property owners, business owners, and advocacy groups who have a stake in the area. This outreach process has two functions: to get input about the area’s future, and to educate the participants about the area’s potential. Without this education, people may be unaware of the potential that exists and how to achieve the vision.
Overall Viability = Positive These tools have been developed by city staff and funded, yet these initiatives are targeted to be eliminated due to budget constraints. Therefore, to make this tool viable, the region will have to find an alternative source of funding, such as regional transportation funds.
Phoenix, Mesa, and Tempe all have funded these activities. Westside Station Area Planning (Portland, OR)2 Bay Area (CA) (San Leandro, South Hayward BART, Glen Park, San Francisco)3 City of Denver: Station Typologies, Station Area Plans (Draft Alameda Station Area Plan and Sheridan Station Area Plan)4 Denver Region5
1 Reconnecting America and the Center for Transit-Oriented Development Station Area Planning: How to Make Great Transit-Oriented Places. February 2008, http://www.reconnectingamerica.org/public/display_asset/tod202?docid=301. 2 TOD Advocate. TOD Case Study, Portland, OR. http://www.todadvocate.com/pdxcasestudy.htm. Accessed February 23, 2009. 3 Reconnecting America. http://www.mtc.ca.gov/planning/smart_growth/tod/TOD_Study_Nov_draft.pdf. Accessed April 15, 2009. 4 City of Denver. TOD in Denver, http://www.denvergov.org/TOD/HomePage/tabid/395229/Default.aspx. March 23., 2009. 5 Denver Regional Council of Government. Transit-Oriented Development, http://www.drcog.org/index.cfm?page=TransitOrientedDevelopment. Accessed February 23, 2009.
8

TOD Policy Tool Brief Description of Tool and Its Purpose
Conditions Needed for Applicability
Conditions Viability of the Affecting Expected Value of Tool
Tool in Phoenix Examples Region
provides certainty about what other kinds of development will occur in the area. Providing such certainty allows developers to build towards a collective vision instead of having each project responsible for its own amenities. Conducting such a planning exercise in conjunction with real estate market analysis grounds the vision in reality and allows implementation to build off of existing or emerging market momentum.
LU-2A Station Area Rezoning: Rezone Station Areas
Create new zoning in the station areas that restricts some uses and allows new ones that prioritize activities that generate ridership. This may be done through creation of new zoning designations or
Station area rezoning requires a clear rationale for excluding uses. Criteria must be based on transit ridership potential and level of vehicle traffic generated in critical pedestrian zones around a station (e.g., within ¼ mile of the station or near critical
Existing uses that are not supportive of ridership. Uses that meet TOD objectives from a design standpoint, but do little to generate ridership. Market demand for the types, intensities, and amount of land uses provided in the new zoning.
Overall Viability = Negative or Positive Rezoning could potentially be problematic under Proposition 207 if the restricted use (e.g., gas station or storage facilities) produces more income for the landowner than
Denver6 Salt Lake City: TC-75 Transit Oriented District and MU Mixed Use District for example.7 Minneapolis, MN8
6 City of Denver. TOD Economic Analysis and Market Study, http://denvergov.org/HomePage/EconomicDevelopmentandTOD/tabid/425422/Default.aspx. Accessed February 23, 2009. 7 For the zoning ordinance language go to the Salt Lake City [web site at http://www.slcgov.com/ced/planning/pages/zoningordinance.htm and search for “transit oriented development.” Zoning maps are also available, such as the Central Community map at http://www.slcgov.com/ced/planning/pages/mapofplanningcomm.htm. 8 City of Minneapolis. Approved City Plans, http://www.ci.minneapolis.mn.us/cped/plans.asp and http://www.ci.minneapolis.mn.us/lrtrezoning/tod-haiwatha-01.asp, Accessed on March 18, 2009.
9

TOD Policy Tool Brief Description of Tool and Its Purpose
Conditions Needed for Applicability
Conditions Viability of the Affecting Expected Value of Tool
Tool in Phoenix Examples Region
application of existing zoning designations that meet the goals for TOD; using zoning overlays is another possible technique, as discussed in the next tool.
intersections). The station area should have a clearly defined and appropriately scaled area of influence to ensure effective application of new zoning.
ridership-generating uses such as multifamily housing, office, or smaller-scale retail. Implementing this option with a provision for property owners to apply for a “binding waiver of enforcement” could make it more viable. This would create a formal process through which impacts on “fair market value” could be evaluated and would establish a controlled mechanism for mitigating Proposition 207 claims without a lawsuit.
LU-2B Station Area Rezoning: Use Restrictions Based on Public Health and Safety and Transportation Impacts
Zoning restrictions can be designed to discourage uses or features that generate harmful impacts (e.g., noise or noxious odors) and/or uses that generate high levels of automobile or semi-truck traffic (e.g., big-box retail, gas stations, or industrial or warehousing uses), which would discourage walking and transit ridership and create hazards in a station area given
A clear justification for what uses are allowed in a particular zoning district based on public health, safety and transportation impacts.
New uses or restrictions must protect public health and safety and encourage multimodal transportation.
Overall Viability = Negative If public health and safety and transportation impact issues are not effective, use restrictions might trigger Proposition 207, especially if property owners perceive the restrictions as lowering their property values. Legal review is critical to determine extent of takings. This restriction
The team could not find any examples of use restrictions in a place with legislation such as Proposition 207. Much research and documentation has been completed documenting the public health (both direct physical health and benefits associated with better air quality) of walking and TOD. But this research would be a new approach in application to Proposition 207.
10

TOD Policy Tool Brief Description of Tool and Its Purpose
Conditions Needed for Applicability
Conditions Viability of the Affecting Expected Value of Tool
Tool in Phoenix Examples Region
the high levels of pedestrian activity that transit generates.
might make the most sense as an overlay.
LU-2C Station Area Rezoning: Optional Overlay Zone
Overlay zones create a separate set of requirements that amend existing zoning in specific areas. Some uses are restricted to prioritize activities that generate significant ridership, while others that support ridership are encouraged. Overlay zoning can be applied to parcels in an area when the overlay is adopted, but in this case, the overlay could be defined as optional zoning. Property owners could elect to use the overlay when they seek to develop or revitalize their properties.
The city should take care to make the uses and requirements of the overlay zoning as attractive as possible while achieving the goals of TOD. The city could encourage property owners to opt for the overlay. Other incentives such as financial tools could be important in encouraging use of the overlay.
Making the zoning optional decreases the certainty that the new development will be compatible with surrounding development and will achieve the vision for the station area. This could make development that uses the overlay less attractive to property owners and therefore less valuable and effective as TOD. The tool’s value will also be affected by market demand for the types, intensities, and amount of land uses described in the overlay zoning.
Overall Viability = Positive or Negative Overlay zoning should not be an issue under Proposition 207 as the overlay would be optional – the property owner has to choose to participate. The main challenge to the viability of opt-in overlay zones is the possibility that an insufficient number of property owners will choose to be included. Without a critical mass of included parcels, such overlay zones will be ineffective.
City of Austin, TX (Development Review Checklist)9 (voluntary) Charlotte, NC10, (required for most types of TODs although there are also separate voluntary TODs) Tempe, AZ11 (required) Vancouver, WA12 (voluntary, incentivized) South Salt Lake City, UT13 (voluntary, incentivized)
9 City of Austin. Transit-Oriented Development (TOD) Interim Regulations Development Review Checklist for Zoning, Subdivision and/or Site Plan Cases, http://www.ci.austin.tx.us/planning/tod/downloads/InterimRegs_for_web.pdf. Accessed February 23, 2009. 10 Charlotte-Mecklenburg Planning Commission, TOD/TS/PED Update. http://ww.charmeck.org/Planning/Rezoning/TOD-TS-PED/TOD_Presentation(11162006).pdf. Accessed May 14, 2009. 11 City of Tempe, AZ, Zoning and Development Code, Amended June 1, 2006. Chapter 6 – Transportation Overlay District, http://www.tempe.gov/ZONING/ZDCode/TOC.pdf. Accessed February 23, 2009. 12 City of Vancouver, WA, Municipal Code Title 20 Land Use and Development (Zoning) Chapter 20.550 Transit Overlay District, landuse.law.pace.edu/landuse/documents/laws/reg10/VancouverWATOD.doc. Accessed February 23, 2009. 13 South Salt Lake City Municipal Code, Chapter 17.66, Transit Oriented Development (TOD) Overlay District, www.envisionutah.org/resourcesfiles/22/South%20Salt%20Lake%20TOD%20Code.doc, Accessed March 18, 2009.
11

TOD Policy Tool Brief Description of Tool and Its Purpose
Conditions Needed for Applicability
Conditions Viability of the Affecting Expected Value of Tool
Tool in Phoenix Examples Region
LU-3A Land Use Intensity Tools: Density Bonuses
Density bonuses can promote mixed-use and compact development while creating the land use intensity that can efficiently support public services and transit usage. Density bonuses grant developers the opportunity to increase the number of units in a development beyond that which is typically allowed by zoning in exchange for providing a public amenity from which the community can benefit.14 Density bonuses are established to relieve developers the cost burden of an inclusionary housing ordinance that mandates affordable unit set-asides.
Coordination with affordable housing goals and benchmarks for achievement.15 Information regarding conditions should be clear and uniformly applied to a variety of development proposals. Where appropriate, inclusionary units should be constructed within walking distance of the transit station, as lower-income households are less likely to own cars and more likely to use transit than higher-income households.
Land cost, property values, and rents determine the true value of increased density. For example, if a project’s economic fundamentals justify the higher construction cost per square foot that comes with moving from a wood frame structure with surface parking to a concrete structure with underground parking, then a density bonus permitting additional units will be highly valuable.16
Overall Viability = Positive The viability depends on land values and rents at individual stations. Current values are important, but anticipated values over the next 5 to 10 years may be a more appropriate measure for density bonus policies. It is critical to consider the application of these land use oriented tools as part of the station area planning process. This and other tools are only appropriate in certain station locations due to existing and projected conditions.
Ballston Metro Station, Arlington, VA17 Bethesda and Silver Spring, Montgomery County, MD18 San Diego, CA19
14 Smart Growth Network. Getting to Smart Growth: 100 Policies for Implementation. October 2003. [ 15 Shoemaker, D. with Center for Transit Oriented Development Tools for Mixed-Income TOD.. 2006, http://www.reconnectingamerica.org/public/show/tools. 16 Utter, M. The Match Game: Bringing Together Affordable Housing and Transit Villages. Urban Land Institute,, http://ww.deltaorg.com/news-uli_winter_05.html 2005. 17 Arlington County, Virginia. National Award for Smart Growth Acheivement. http://www.co.arlington.va.us/Departments/CPHD/planning/docs/CPHDPlanningDocsGLUP_metrocorridors.aspx 18 Montgomery County, Maryland. History of Moderately Priced Dwelling Units, http://www.montgomerycountymd.gov/content/dhca/housing/housing_P/mpdu/history.asp. Accessed May 12, 2009. 19 City of San Diego. San Diego Municipal Code, http://docs.sandiego.gov/municode/MuniCodeChapter14/Ch14Art03Division07.pdf. Accessed May 12, 2009.
12

TOD Policy Tool Brief Description of Tool and Its Purpose
Conditions Needed for Applicability
Conditions Viability of the Affecting Expected Value of Tool
Tool in Phoenix Examples Region
LU-3B Land Use Intensity Tools: FARs and Building Height Bonuses
Increased floor area ratios (FARs) and building heights allow more activity to be provided on a given parcel, which is consistent with the goals of TOD. If the uses are marketable and the buildings and parking are affordable, increases in FAR and building heights will create more land and development value. Similar to residential density bonuses, commercial intensity bonuses are often linked to the provision of public amenities, such as open space, access improvements, or community or cultural facilities.
Building height needs to be calibrated according to allowable densities and zoning. May require infrastructure upgrades to support increased density. FARs and building heights should be achievable in the foreseeable future so that they do not encourage unreasonable land value expectations (as has happened along some portions of Central Avenue in Phoenix). They should also be acceptable to the surrounding neighborhoods.
Market demand for density and intensity level afforded by more intensive use of land area.
Overall Viability = Neutral Unclear, related to market and public viability of potential intensities and establishing the public benefit/amenity that is required for the bonus.
In Seattle, downtown and adjacent areas offer a green building density bonus for LEED Silver or higher and other amenities (e.g., public open space, public atrium, transfer of development rights, child care, public restrooms, green street stormwater improvements, and transit station access).20 Fairfax County, VA, also has a green building density bonus program.21 In Vancouver, WA, developments can receive FAR and building height bonuses in addition to base zoning bonuses if TOD design criteria are satisfied.22
LU-4A Land Use Standards Enhancement: Form-Based Codes
A form-based code is a method of regulating development to achieve a specific urban form. Form-based codes create a predictable public realm by controlling
Ability to integrate form-based code into existing regulatory framework or adopt through overlays. City officials and staff, property owners, and
The extent to which a form-based code reduces the need for design review and approvals by the Planning Commission will be key to its success as an incentive for TOD.
Overall Viability = Positive A form-based code has been established for downtown Phoenix, but its effectiveness is still to be determined.
Leander, TX, has a Smart Code that includes elements of a form-based code.24 In the East Colfax Area Plan in Denver, much of the plan takes a more
20 City of Seattle. City Green Buillding, http://www.seattle.gov/DPD/GreenBuilding/Commercial/IncentivesAssistance/default.asp. Accessed May 12, 2009. 21 Arlington County. Environmental Services, http://www.co.arlington.va.us/departments/EnvironmentalServices/epo/EnvironmentalServicesEpoIncentiveProgram.aspx. Accessed May 12, 2009. 22 City of Vancouver, WA, Municipal Code Title 20 Land Use and Development (Zoning) Chapter 20.550 Transit Overlay District, http://landuse.law.pace.edu/landuse/documents/laws/reg10/VancouverWATOD.doc.
13

TOD Policy Tool Brief Description of Tool and Its Purpose
Conditions Needed for Applicability
Conditions Viability of the Affecting Expected Value of Tool
Tool in Phoenix Examples Region
physical form primarily, with a lesser focus on land use.
Form-based codes address the relationship between building façades and the public realm, the form and mass of buildings in relation to one another, the location and design of parking, and other building form and site planning issues. They may also address the scale and types of streets and blocks.
The regulations and standards in form-based codes, presented in both diagrams and words, are keyed to a regulating plan (i.e., a zoning map) that designates the appropriate form, character and scale of development, rather than only the type of land use.23
developers would have to accept and understand the focus on built form as opposed to land use and its value to achieving effective TOD.
It needs to make the approvals process more straightforward and result in high-quality and marketable TOD.
The implications of Proposition 207 for a form-based code are likely similar to rezoning and overlay tools. A property owner might argue that the application of a form-based code could reduce property values; see Proposition 207 discussions in LU-2A, 2B, and 2C, Station Area Rezoning tools.
standard area planning approach, but the plan did result in the creation of two “Main Street” zoning districts that use a form-based code.25 Albuquerque, NM, has several form-based code zoning designations, including “TOD-Major Activity Center” and “TOD-Community Activity Center.” 26
23 Form-Based Codes Institute. http://www.formbasedcodes.org/, Accessed May 12, 2009. 24 City of Leander, Texas. Leander SmartCode, http://www.leandertx.org/pdfs/Leander SmartCode 8-02-05.pdf. Accessed April 20, 2009. 25 Denver Business Journal. Colfax Avenue: Denver Main Street Taking on New Life, http://www.denvergov.org/Portals/130/documents/M S Zone District Fact Sheet 12 12 05.doc and http://www.bizjournals.com/denver/stories/2005/04/25/focus1.html. Accessed May 12, 2009. 26 City of Albuquerque. AlbuquerqueGreen, http://www.cabq.gov/albuquerquegreen. Accessed May 19, 2009.
14

TOD Policy Tool Brief Description of Tool and Its Purpose
Conditions Needed for Applicability
Conditions Viability of the Affecting Expected Value of Tool
Tool in Phoenix Examples Region
LU-4B Land Use Standards Enhancement: Design Guidelines
Station area design guidelines can help ensure that new development or redevelopment of existing sites and buildings is pedestrian friendly, attractive, and connects the neighborhood to the transit station. TOD design guidelines often address the design of parking (including landscaping and other buffers around lots), pedestrian furniture, signage, ground-level building façade design and materials, and respect for neighborhood spaces. TOD projects could also incorporate low-impact development techniques, such as multi-level or covered parking structures with green roofs and other water harvesting and stormwater management best practices.27
Flexibility in allowing innovative practices that can be applied outside of boundaries of regulations.
If the design guidelines are optional, they may not have much weight or effectiveness, except to the degree that their use can expedite planning approvals of projects by giving more discretionary review responsibilities to staff and minimizing the need to take projects through design review and planning commission review. Applying design guidelines in many cases results in the streamlining of the development review process.
Overall Viability = Neutral Existing city of Phoenix TOD-1 and TOD-2 zoning overlays include some design guidelines, such as shade and signage on sidewalks.
Massachusetts Smart Growth/Smart Energy Toolkit Design Guidelines28 Bay Area Rapid Transit Station Area Plans (CA) (San Leandro, South Hayward, Glen Park, San Francisco)29 Dublin Transit Village Design Guidelines, Dublin, CA: these guidelines were prepared with funding from a non-profit and have been used by the city in addition to the specific plan that was adopted for the transit village. City of Denver: Station Typologies, Station Area Plans (Draft Alameda Station Area Plan and Sheridan Station Area Plan)30
27 State of Massachusetts. Smart Growth/Smart Energy Toolkit, http://www.mass.gov/envir/smart_growth_toolkit/pages/mod-tod.html. Accessed May 12, 2009. 28 State of Massachusetts. Smart Growth/Smart Energy Toolkit, http://www.mass.gov/envir/smart_growth_toolkit/pages/mod-tod.html. Accessed May 12, 2009. 29 Reconnecting America. Policies and Incentives to Encourage TOD in the Bay Area, http://www.mtc.ca.gov/planning/smart_growth/tod/TOD_Study_Nov_draft.pdf. Accessed April 25, 2009.
15

TOD Policy Tool Brief Description of Tool and Its Purpose
Conditions Needed for Applicability
Conditions Viability of the Affecting Expected Value of Tool
Tool in Phoenix Examples Region
Similar to station area plans, design guidelines make the city’s expectations for the quality of development clear to residents and others, as well as help assure developers that they are investing in an area that will have consistently high-quality development.
LU-5A Parking Tools: Revised Parking Standards
Parking standards could be revised to: 1) allow developers to provide fewer spaces for uses in station areas; 2) create standards for shared parking among separate uses; 3) allow on-street parking to count toward required spaces; and 4) limit the total number of parking spaces required to increase the feasibility of mixed-income housing and mixed-use development by lowering project costs.31
Revising parking standards would require a parking strategy that sets parking in an amount and configuration appropriate to demand given the high level of transit access. Appropriate parking levels can encourage transit use, walking, and bicycling. The city would determine the appropriate amount of parking given levels of transit use and access and whether each station area is a local or a regional draw.
The type of parking shapes the fundamental value of the incentive – it is more valuable with structured parking ($20,000 to $30,000 per space) than with surface parking ($1,000 to $2,000 per space). Parking strategies are more effective as part of an integrated set of strategies (e.g., reduced impact fees and street improvements to facilitate walking and transit access, density and FAR bonuses).32
Overall Viability = Positive The appropriate level of flexibility depends on the type of station, the current parking supply and the nature and function of the land uses. City staff will need to review and change parking standards appropriately.
Phoenix TOD1 and TOD2 Portland, OR Bay Area, CA Washington, DC San Diego, CA33
30 City of Denver. TOD in Denver, http://www.denvergov.org/TOD/HomePage/tabid/395229/Default.aspx. Accessed May 20, 2009. 31 Douglas Shoemaker and Center for Transit-Oriented Development. August 2006. 32 Transportation Research Board. TCRP Report 128: Effects of TOD on Housing, Parking and Travel, 2008. 33 City of San Diego. San Diego Municipal Code, http://docs.sandiego.gov/municode/MuniCodeChapter14/Ch14Art03Division07.pdf. Accessed May 12, 2009.
16

TOD Policy Tool Brief Description of Tool and Its Purpose
Conditions Needed for Applicability
Conditions Viability of the Affecting Expected Value of Tool
Tool in Phoenix Examples Region
LU-5B Parking Tools: Shared Parking
The parking that is needed for a specific land use varies by time of day and day of the week. Shared parking aims to reduce total parking demand and the incremental cost of providing parking, rather than reducing the amount of parking required for individual uses. This is done by providing parking that is accessible to a mix of uses (e.g., businesses, institutional or civic uses, residences) and that satisfies the varying needs of the uses at different times. The maximum amount of parking provided is determined by the time of day and day of the week where the combined parking demand of all the uses is highest.
Established system for property owners and businesses to support shared parking. Development regulations would need to allow shared parking.
Value depends on prevalence of existing surface parking lots, where shared parking is not encouraged or allowed.
Overall Viability = Positive This concept needs better understanding. A few local examples to illustrate the market saturation for this idea include: Arizona State University’s downtown campus and Valley Metro Transit Center (Paradise Valley Mall).34 Parking tools are discussed further in ”Impact of TOD and Smart Growth Incentives on Development in Phoenix”35
Mesa, AZ36 Dr. Martin Luther King Jr. Plaza, Miami, FL37 Lindbergh City Center, Atlanta, GA38,39 Berkeley, CA40 MacArthur Transit Village, Oakland, CA41
34 Valley Metro Rail. Sycamore/Main Street, http://www.valleymetro.org/bus/Transit_Centers/College_Ave.htm . Accessed May 14, 2009. 35 The document referenced is one of four publications created in the project. 36 “Mesa Strives for Main Street Renaissance,” Sonu Munshi, East Valley Tribune, November 29, 2008. http://www.eastvalleytribune.com/story/131472 37 Denver Regional Council of Governments, February 2009. 38 California Department of Transportation. Statewide Transit-Oriented Development (TOD) Study, Factors for Success in California, Parking and TOD: Challenges and Opportunities, http://www.drcog.org/documents/Parking%20and%20TOD.pdf. Accessed April 25, 2009. 39 Parking Spaces/ Community Places, Finding the Balance through Smart Growth Solutions. EPA. http://www.epa.gov/smartgrowth/parking.htm]. 2006.
17

TOD Policy Tool Brief Description of Tool and Its Purpose
Conditions Needed for Applicability
Conditions Viability of the Affecting Expected Value of Tool
Tool in Phoenix Examples Region
LU-5C Parking Tools: Parking Districts
Parking could be provided in a shared parking lot or structure to provide all or part of the parking needed for the uses in a district. Businesses and, sometimes, residents in the district typically pay for at least a portion of the maintenance and operating costs of the parking and possibly for its construction. Managers of the parking district calculate the appropriate distribution of shared parking for the existing conditions.
Identify parcels that could benefit from having all or some of their parking removed from their property and where opportunities exist for a large parking structure, such as a major shopping center, a station park-and-ride facility, or other publicly owned land. The uses should be compatible with parking that is somewhat removed from the use; for example, most residents will want to have parking near their homes.
Areas with relatively small parcels where on-site structured parking is particularly challenging to build. Another factor is the sensitivity of economic impacts of development compared to anticipated parking costs.
Overall Viability = Neutral Effective parking districts are currently viable approaches in several downtowns – Phoenix, Tempe, Glendale, Scottsdale, and others. Regional shopping centers could use “district” parking.
Downtown Redwood City, CA, has instituted extensive parking management and parking pricing strategies.42
40 Metropolitan Planning Commission. Reforming Parking Policies to Support Smart Growth Toolbox/Handbook. June 2007. http://www.mtc.ca.gov/planning/smart_growth/parking_seminar/Toolbox-Handbook.pdf. 41 Alameda County CMA TOD Technical Assistance Program: Shared Parking Case Study: MacArthur TOD May 17, 2007. http://www.accma.ca.gov/pdf/talu/TOD_TAP_SharedParkingPresentation_051707.ppt. 42 Redwood City. Downtown Redwood City Parking Management Plan, http://shoup.bol.ucla.edu/Downtown%20Redwood%20City%20Parking%20Plan.pdf . Accessed April 16, 2009.
18

TOD Policy Tool Brief Description of Tool and Its Purpose
Conditions Needed for Applicability
Conditions Viability of the Affecting Expected Value of Tool
Tool in Phoenix Examples Region
DEVELOPMENT ASSISTANCE TOOLS DA-1 Fast Track Development Review
Creating streamlined development review and building permitting processes, administered by city staff, for projects meeting specific criteria can reduce project financing costs for developers and make TOD more financially attractive. The financial benefit of the expedited review could provide an additional basis for arguing that new zoning does not violate Proposition 207.
Willingness of the local jurisdiction to create a streamlined process or, in some cases, a “green tape” program for TOD. This might be met with protest from non-TOD projects.
If the criteria to qualify for expedited review are too loose, it may be difficult to maintain a transparent review process that is true to the intent of the development standards or other criteria. Could be linked to zoning overlay, with only those projects that opt for the overlay receiving the expedited review.
Overall Viability = Positive Precedent exists in Phoenix for such a policy. Implementation would require: 1) pre-application conferences between planning staff and developers and 2) prioritizing staff time and resources to ensure a streamlined process for projects that qualify.
BART Hayward Station, CA Douglas County, GA Austin, TX43
DA-2 Capital Funding for Infrastructure
There is no single source of funds designed to facilitate transit-oriented development at station areas. The sources of capital funding are the same as those used for regular municipal infrastructure development. The funding challenge is to use these resources to maximize the potential development
Several funding sources are needed as part of a comprehensive, targeted funding strategy. A targeted funding strategy will allow jurisdictions to link funding for infrastructure with the likely beneficiaries of the proposed improvement. This allows jurisdictions to extend their limited resources and lets
The key condition for infrastructure funding is the availability of various funds that can be used. Depending on political will and community support, available incentives may positively impact the value of tools.
Overall Viability = Positive Viability depends on availability of state and regional funds which is prioritized by the state. Once funds are available, cities can prioritize within their local bond programs by various departments or a centralized department.
New Starts Communities; Congestion Mitigation and Air Quality; and Transportation, Community and Systems Preservation
43 City of Austin. S.M.A.R.T Housing, http://www.ci.austin.tx.us/ahfc/smart.htm Accessed March 23, 2009.
19

TOD Policy Tool Brief Description of Tool and Its Purpose
Conditions Needed for Applicability
Conditions Viability of the Affecting Expected Value of Tool
Tool in Phoenix Examples Region
opportunities in a station area.44
them benefit from the increased value created by the public investment.
DA-3 Tax Increment Financing
Tax increment financing (TIF) is commonly used by cities to pay for infrastructure or other improvements to spur new development and reinvestment in areas that need revitalization, but where market forces are weak. The amount of tax revenue flowing to all of the taxing entities, including the city, school districts, and the state, is fixed at a base year level. The increment -- any increase in actual tax revenues above the base year -- is redirected to the TIF district. In some states, like California and Illinois, the tax increment is based on property taxes. In
Should the Arizona legislature consider legislation to enable TIF, certain elements would make the legislation more useful for promoting TOD than typical TIF enabling legislation: • Allow any area within
½ mile of a transit station to be eligible for TIF designation. In most states, areas must meet certain standards for blight to justify TIF designation and, although many transit zones need investment to spur TOD, they often do not meet the blight standards.
• Allow cities to create a continuous TIF district along a single transit line, incorporating all of
Because TIF in Arizona would be based on sales tax, only areas with potential for considerable retail development would probably be appropriate for TIF districts, unless a single district could be created along an entire transit line. Special legislation would be required for individual agreements. Two examples are Rio Nuevo in Tucson45 and a redevelopment district in the city of Casa Grande.46
Overall Viability = Requires State Legislation It is currently not legal to establish new TIF districts in Arizona, although a few areas have districts that were formed prior to the legal challenges that ended the practice in the state. However, some groups in Arizona, such as the Maricopa Association of Governments, League of Arizona Cities, city of Tucson and the Downtown Phoenix Partnership, have proposed passing state enabling legislation for TIF to help make Arizona cities more competitive with their counterparts elsewhere in the
The California legislature has passed a law allowing transit-oriented TIF districts. The governor vetoed the bill as part of recent problems with the state budget, but, the legislation is expect to pass again next time it comes up for a vote. The language in this bill could serve as a model for the Arizona Legislature. The city of Dallas created a single TOD TIF district, connecting multiple station areas.47
44 Puget Sound Regional Council. “Financing Transit-Oriented Development.” http://www.psrc.org/projects/tod/funding.htm. Accessed April 12, 2009. 45 Downtown Tucson. Rio Nuevo, http://www.downtowntucson.org/investment/rionuevo/. Accessed July 10, 2009. 46 Arizona State University. Tax Increment Financing (TIF) and Urban Revitalization in Arizona, http://design.asu.edu/hcdr/documents/unintended_consequences/UC_63_PLA_TaxIncrementFinancing.pdf. Accessed April 12, 2009. 47 All Business. Dallas Creates First Tax Increment Financing District Dedicated to Multi-Station Transit, http://www.allbusiness.com/legal/property-law-real-property-zoning-land-use/11730031-1.html. Accessed May 17, 2009.
20

TOD Policy Tool Brief Description of Tool and Its Purpose
Conditions Needed for Applicability
Conditions Viability of the Affecting Expected Value of Tool
Tool in Phoenix Examples Region
other states, including Colorado and Arizona, the increment is based on sales taxes.
the station areas in one district. This would allow for sharing increments among the station areas along the line, rather than creating individual districts around each station area.
• Copy TIF rules enacted in other states that allow other taxing entities, such as school districts, to continue to capture some portion of the increment.
• Set aside some portion of the increment to support construction of affordable housing.
nation. If statewide enabling legislation were passed, TIF funds could be used to encourage TOD projects. Potential conflicts with Proposition 207 will be understood when applied.
DA-4 Reduced Impact Fees in Station Areas
Some cities charge $10,000 to $20,000 per residential unit to cover the cost of additional infrastructure. Waiving or reducing such fees can be a significant incentive, particularly for projects that provide
A clear fee schedule that includes reduced fees in station areas. Fiscal analysis justifying fee reductions may also be required.
Tied directly to the level of impact fees assessed and the extent to which they are waived or reduced with a station area.
Overall Viability = Currently Infeasible Development impact fees are not assessed by Phoenix in light rail phase 1 or phase 2 station areas. Mesa does not have transportation impact fees and exempts
Montgomery County, Maryland Affordable Housing Task Force48 Bernalillo County, New Mexico (Albuquerque) Affordable Housing Impact Fee Waiver Procedures49
48 Montgomery County. Affordable Housing Task Force, http://www.montgomerycountymd.gov/content/DHCA/community/pdf/rr-ahtf.pdf. Accessed April 12, 2009. 49 City of Albuquerque. AlbuquerqueGreen, http://www.bernco.gov/upload/images/zoning_building_planning/affordable_housing_proc.pdf Accessed May 19, 2009
21

TOD Policy Tool Brief Description of Tool and Its Purpose
Conditions Needed for Applicability
Conditions Viability of the Affecting Expected Value of Tool
Tool in Phoenix Examples Region
more affordable housing options. Fees are usually reduced or eliminated when an application is made illustrating the number of affordable units that will be built.
these areas from stormwater impact fees. Impact fees could be considered for future extensions.
22

TOD Policy Tool Brief Description of Tool and Its Purpose
Conditions Needed for Applicability
Conditions Viability of the Affecting Expected Value of Tool
Tool in Phoenix Examples Region
Place Making and Access Tools PM-1 Streetscape and Pedestrian/Bicycle Improvements
The public realm of the streets and other civic spaces in a station area are the glue that holds a TOD together and creates places where walking is comfortable and enjoyable. One method for encouraging private investment in a station area is to enhance the public investment in the transit system by making to local streets. Enhancements could include aesthetic and transportation improvements to existing streets and the creation of new bicycle and pedestrian connections.
Availability of capital funding to design and construct improvements (some of the funding tools discussed in the Strategic Package of Tools could be used to fund these improvements).
To be most effective, streetscape and pedestrian/bicycle improvements should be complemented by development that provides the desired mix and intensity of uses, creating a supportive relationship between the buildings and the street.
Overall Viability = Positive Success depends on the urban form including sidewalks, signage, lighting, safety provision associated with each station area. The more pedestrian amenities, the better for encouraging transit riders.
The Alameda County, CA, Congestion Management Agency has invested in streetscape improvements around BART (commuter rail) stations in the county to support private investments in the areas, programming nearly $6 million in 2006.50 Denver Ave, Portland, OR51
PM-2 Façade and Site Frontage Improvement Program
Provide low- or no-interest loans or grants to revitalize existing building façades and lot frontages to make streets in the station area more appealing
Some station areas may have more of a focus on revitalization of existing buildings and sites to support more pedestrian activity.
The desired improvements need to be affordable and show a return on investment for owners to be willing to take out a loan to make improvements.
Overall Viability = Neutral Most cities around the country use tax increment or general fund revenues to pay for these programs.
Scottsdale, AZ, Downtown Covered Walkway and Façade Improvement program52 Berkeley, CA Fruitvale Transit Village,
50 Alameda County Congestion Management Agency. Bicycle Program, http://www.accma.ca.gov/pages/HomeBicyclePlan.aspx. Accessed April 20, 2009. 51 Portland Devleopment Commission. Downtown Kenton Denver Avenue Streetscape Plan, http://www.pdc.us/pdf/ura/interstate/kenton/denver-avenue-streetscape-plan-draft-011008-lowres.pdf. Accessed April 12, 2009.
23

TOD Policy Tool Brief Description of Tool and Its Purpose
Conditions Needed for Applicability
Conditions Viability of the Affecting Expected Value of Tool
Tool in Phoenix Examples Region
to pedestrians. A condition of the loan program would be acceptance and compliance with design standards and guidelines for the façade or frontage improvements. The Phoenix Industrial Development Authority might be an appropriate partner to fund façade improvement programs.
The level of intensity and value in existing development justifies its preservation and improvement and its ability to contribute to a transit-supportive environment. Most applicable in areas with a traditional neighborhood business district, not a strip mall or other retail center oriented around a parking lot.
Because Arizona cites currently cannot use TIF, a façade and site frontage improvement loan program could be difficult to implement in the Phoenix area. Although Scottsdale has had such a program in its downtown, funding was recently eliminated and these grants are no longer available.
Oakland, CA: The Fruitvale Development Corporation (the non-profit developer of the transit village at Fruitvale BART) also used a façade improvement and building renovation program to support revitalization for more than 100 properties along the International Boulevard
PM-3 Tax-Exempt Bonds
Tax-exempt bonds are issued by a municipal, county, or state government whose interest payments are not subject to federal income tax or, sometimes, state or local income tax. This tool is typically paired with Low Income Housing Tax Credits to build affordable housing units. Timeframes for affordability are established through state preferences.
The funding for bonds must be available, based on available capital from investors. For general issue bonds, the public needs to have sufficient interest and cash available to purchase bonds.
Market variations will determine the success of tax-exempt bonds; furthermore constraints exist at the municipal level due to meeting affordable housing requirements
Overall Viability = Negative This tool could be used as part of LA-1 Joint Development. Phoenix already uses General Obligation bonds for affordable housing loan programs and for some redevelopment.
The state of California has used tax-exempt bonds to fund transit projects including Ohlone-Chynoweth in San Jose. Many development projects require at least types of funding.53 Illinois encourages the use of tax-exempt bonds with Low-Income Housing Tax Credits to achieve affordable housing.
53 California Department of Transportation. Statewide Transit-Oriented Devleopment Study: Factors for Success in California, http://transitorienteddevelopment.dot.ca.gov/PDFs/TOD%20Study%20Exectutive%20Summary.pdf. Accessed April 12, 2009.
24

TOD Policy Tool Brief Description of Tool and Its Purpose
Conditions Needed for Applicability
Conditions Viability of the Affecting Expected Value of Tool
Tool in Phoenix Examples Region
Tax-exempt bonds can also be a tool for commercial development.
PM-4 Tax Abatement
Tax abatement for TOD has been established to support high-density housing and mixed-use developments affordable to a broad range of the public on vacant or underused sites. The exemptions support TOD projects by reducing operating costs through a ten-year maximum property tax exemption.
Tax abatement programs are typically established for targeted areas of the community. Conditions typically specify the project size, scope and density.
The categorization of public benefits by city officials will determine affected impacts upon tool value.
Overall Viability = Currently Infeasible Arizona cities do grant property tax abatements, which can be a significant incentive for development projects. Further analysis should be completed to evaluate whether tax abatement could offset any perceived decrease in property values as a result of enacting TOD overlay zoning. Tax abatement is possible only in certain redevelopment areas and potentially for future extensions.
The city of Portland, Oregon has used tax abatement for encouraging multi-family housing in proximity to transit.
25

TOD Policy Tool Brief Description of Tool and Its Purpose
Conditions Needed for Applicability
Conditions Viability of the Affecting Expected Value of Tool
Tool in Phoenix Examples Region
LAND ASSEMBLY TOOLS LA-1 Joint Development Program
Joint development programs formalize public- and private-sector cooperation in planning, design, and construction for a development project that will occur on transit agency-owned land, but will be developed by a private-sector partner. These projects could include sale of air rights above a transit facility, a long-term lease, or a land sale. In some cases, the transit agency will receive full market value for the transaction, but in others, the transit agency may be required to write down the value of its interest to promote TOD.
Comprehensive knowledge of market conditions and pro forma analysis for specific stations. Concern related to getting the project to make a profit, or at the minimum, cover its costs. A clear joint development policy should consider the benefits of both ridership and revenue for the transit agency and a process for developer selection managed by staff with real estate development experience and with the help of consultants as needed.
The balance of risk-reward for joint-development is born by the public and private sector, which can be unpredictable.. Joint development programs can be important in spurring additional station area development if it is used as a catalyst for early development projects that set an example and can shift the local market conditions.
Overall Viability = Neutral Tempe has shown this method is viable and effective, yet other challenges exist for Phoenix and Mesa based on prioritization of this tool from stakeholders.
Portland, OR54 San Francisco, CA Santa Rosa, CA WMATA, Washington, DC McClintock Station55
LA-2 Land Acquisition Loan Funds
Cities assemble various loan funds around the country to assist developers in acquiring land for affordable housing.
A viable source of funding and a mechanism to pay back funds if appropriate.
Available funds for land assembly. Willingness of property owners to work in a public-private
Overall Viability = Neutral Based on city, state, and federal funds and priorities.
Portland, OR Hiawatha Line, Minneapolis, MN (Land Acquisition RFP)56
54 Metro. Welcome to Metro, http://www.metro-region.org/article.cfm?ArticleID=140. Accessed April 12, 2009. 55 Denver Regional Council of Governments. TODay Workshop #2. Making the Vision Reality, http://www.drcog.org/documents/Starnes_Financing%20TOD%20presentation.pdf. Accessed April 12, 2009. 56 City of Minneapolis. RFP for Hiawatha Light Rail Transit (LRT) Land Assembly Fund, http://www.ci.minneapolis.mn.us/cped/hiawatha_land_assembly_rfp_home.asp. Accessed April 12, 2009.
26

TOD Policy Tool Brief Description of Tool and Its Purpose
Conditions Needed for Applicability
Conditions Viability of the Affecting Expected Value of Tool
Tool in Phoenix Examples Region
These funds have not necessarily been targeted to TODs, but many nonprofits are now considering focusing more directly on TOD. These funds are generally for affordable housing projects only, and the loans have been relatively short term, allowing the developer to acquire land before lining up all of its funding sources for the project. Once the “permanent sources” are secured, some of that money is used to pay back the land acquisition loan. Capitalization for these loan funds have come from a combination of sources, including foundations, banks, and various state and municipal sources. Although federal transportation dollars cannot be used for land acquisition, MPOs can work with the Federal Government to devise a suitable acquisition program.
A system for prioritizing parcels to be assembled, if coordinated from a municipal source. Incentive programs for land assembly are encouraged if assembly is outside a public-private partnership. A system for prioritizing parcels to be acquired.
partnership. Fund creation is often led by foundations that pay for the upfront costs. Local Initiative Support Corporation has participated in forming several such funds and could potentially play this role in the Phoenix area as well. Motivation of groups like Urban Land Institute to help support land assembly for TOD. Viability also depends on the provision of community benefits and how the land banking account is established.
Los Angeles New York Charlotte, NC (South Corridor Land Acquisition Fund)
27

TOD Policy Tool Brief Description of Tool and Its Purpose
Conditions Needed for Applicability
Conditions Viability of the Affecting Expected Value of Tool
Tool in Phoenix Examples Region
LA-3 Funds for Buying Available Parcels in the Open Market
Unlike the loan fund described in LA-2, these funds can be used to assemble land and create catalyst TOD projects in locations where the market is not yet viable for higher density housing projects. They can also be used to secure land that will be appropriate for TOD in the future, but where current market pressures are likely to result in near-term development that is not transit supportive.
Source of patient capital that could be used for land banking rather specific developer-sponsored projects. An entity, such as a city or non-profit organization, needs to have the capacity to acquire and hold the land until it is suitable for development.
Parcels that are vacant/underused and of sufficient size to be able to support a critical mass of development.
Overall Viability = Neutral There is no existing source of funding for a land assembly fund, but if there is interest, a consortium of foundations and governmental agencies could form a fund, as is being considered in the Bay Area and the Twin Cities. The city of Phoenix Housing Department has acquired a site for TOD affordable housing.
Tyson’s Corner, VA Minnesota Transit Improvement Area Accounts
28
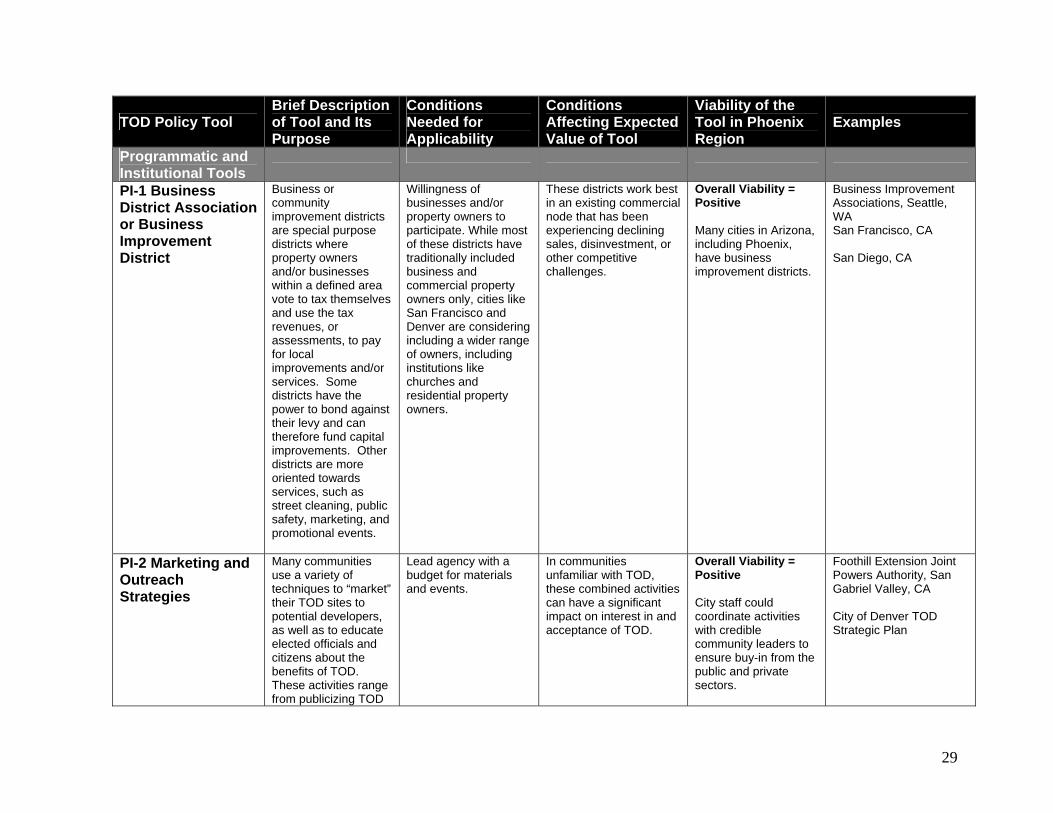
TOD Policy Tool Brief Description of Tool and Its Purpose
Conditions Needed for Applicability
Conditions Viability of the Affecting Expected Value of Tool
Tool in Phoenix Examples Region
Programmatic and Institutional Tools
PI-1 Business District Association or Business Improvement District
Business or community improvement districts are special purpose districts where property owners and/or businesses within a defined area vote to tax themselves and use the tax revenues, or assessments, to pay for local improvements and/or services. Some districts have the power to bond against their levy and can therefore fund capital improvements. Other districts are more oriented towards services, such as street cleaning, public safety, marketing, and promotional events.
Willingness of businesses and/or property owners to participate. While most of these districts have traditionally included business and commercial property owners only, cities like San Francisco and Denver are considering including a wider range of owners, including institutions like churches and residential property owners.
These districts work best in an existing commercial node that has been experiencing declining sales, disinvestment, or other competitive challenges.
Overall Viability = Positive Many cities in Arizona, including Phoenix, have business improvement districts.
Business Improvement Associations, Seattle, WA San Francisco, CA San Diego, CA
PI-2 Marketing and Outreach Strategies
Many communities use a variety of techniques to “market” their TOD sites to potential developers, as well as to educate elected officials and citizens about the benefits of TOD. These activities range from publicizing TOD
Lead agency with a budget for materials and events.
In communities unfamiliar with TOD, these combined activities can have a significant impact on interest in and acceptance of TOD.
Overall Viability = Positive City staff could coordinate activities with credible community leaders to ensure buy-in from the public and private sectors.
Foothill Extension Joint Powers Authority, San Gabriel Valley, CA City of Denver TOD Strategic Plan
29

TOD Policy Tool Brief Description of Tool and Its Purpose
Conditions Needed for Applicability
Conditions Viability of the Affecting Expected Value of Tool
Tool in Phoenix Examples Region
sites through brochures and websites, to educational lectures, tours, and other events.
PI-3 Livable Communities Program
Regional planning agencies can use a portion of their discretionary transportation funds to support projects that would otherwise not be funded, but that demonstrate desirable public benefits typically related to transportation and land use, such as: - Strengthen the link between transit planning and community planning, including land use policies and urban design supporting the use of transit and providing physical assets that better meet community needs. - Improve access to transit particularly for minority and low-income residents. - Increase access to employment, education facilities,
Policies need to be established to connect the provision of affordable housing with eligibility for transportation improvement funds. Need to develop program goals and evaluation criteria that assess how projects address those goals.
Federal, state, and local matching funds, as well private development interest to leverage livable communities funding. Extent of flexible funding that is available for Maricopa Association of Governments to commit to a Livable Communities program.
Overall Viability = Neutral Maricopa Association of Governments would administer goal/priority development, funding, and program oversight for the Livable Communities program(s).
Metropolitan Transportation Commission, Bay Area, CA – this program includes planning and construction grants as well as a Housing Incentive Program (HIP) which rewards governments that build housing, particularly affordable housing, near transit hubs. Metropolitan Council, Minneapolis/St Paul, MN, Livable Communities Act of 1995. Organization provides funding and assistance to communities to develop affordable and lifecycle housing.57 METRO TOD Development and Centers Program, Portland, OR58
57 Metropolitan Council. Livable Communities Grant Program, http://www.metrocouncil.org/services/livcomm.htm. Accessed May 20, 2009. 58 Metro. Transit-oriented development, http://www.metro-region.org/index.cfm/go/by.web/id=140. Accessed May 20, 2009.
30

TOD Policy Tool Brief Description of Tool and Its Purpose
Conditions Needed for Applicability
Conditions Viability of the Affecting Expected Value of Tool
Tool in Phoenix Examples Region
and other community destinations through community-oriented, technologically innovative transit services and facilities. - Leverage resources available through other federal, state, and local programs and private non-profit and for-profit assets.
PI-4 Community Development Corporation (CDC) Lead Efforts
Community Development Corporations (CDCs) are non-profit entities with the broad mission of community revitalization. These organizations typically have a geographic focus and undertake a range of activities to improve both physical and social conditions in their target area. CDCs have taken the lead in developing TOD projects in many cities around the country and have been successful largely because they have access to other funding sources than for-profit developers and can take on more challenging projects.
A CDC willing to become actively engaged in funding projects around transit.
In station areas that are suffering from disinvestment and/or have a significant low-income population, CDCs can have a major impact by developing TOD projects that could not be produced by for-profit developers.
Overall Viability = Currently Infeasible There are few local CDCs that have the capacity to develop TODs. Education and outreach must be developed with these CDCs to ensure that they are knowledgeable about TODs.
Seward ReDesign Minneapolis Fairmont Line, Boston
31

TOD Policy Tool Brief Description of Tool and Its Purpose
Conditions Needed for Applicability
Conditions Viability of the Affecting Expected Value of Tool
Tool in Phoenix Examples Region
PI-5 Housing Trust Funds
Housing trust funds are a dedicated source of funding for affordable housing. These funds are typically established by a governmental agency, such as a state, county, or city, and have some permanent source of revenue. Revenues can come from some form of tax or from an impact or linkage fee. Contributions from foundations and other donors can also be used for housing trust funds. However, these funds are publically administered and are not typically dependent on philanthropy for support.
A dedicated revenue source and an explicit goal to fund affordable housing near transit. Many housing trust funds are not necessarily directed towards transit-oriented locations, even though these offer the best long-term value for low- to moderate-income households.
The fund’s size is the biggest determinate of its impact. The more funding available, the more significant the impact.
Overall Viability = Currently Infeasible Currently, the city of Phoenix supports its affordable housing program through GO bonds and HOME Program and Community Development Block Grants funds. State housing funds are typically restrictive and can only be used for “gap” financing. The Housing Trust Fund is still viable for TOD, but other sources need to be generated.
City of Berkeley State of Illinois: contributes a portion of its real estate transfer tax to its housing trust fund Columbus/Franklin County, OH Affordable Housing Trust
32

United States Environmental Protection Agency
Encouraging Transit Oriented Development Case Studies that Work
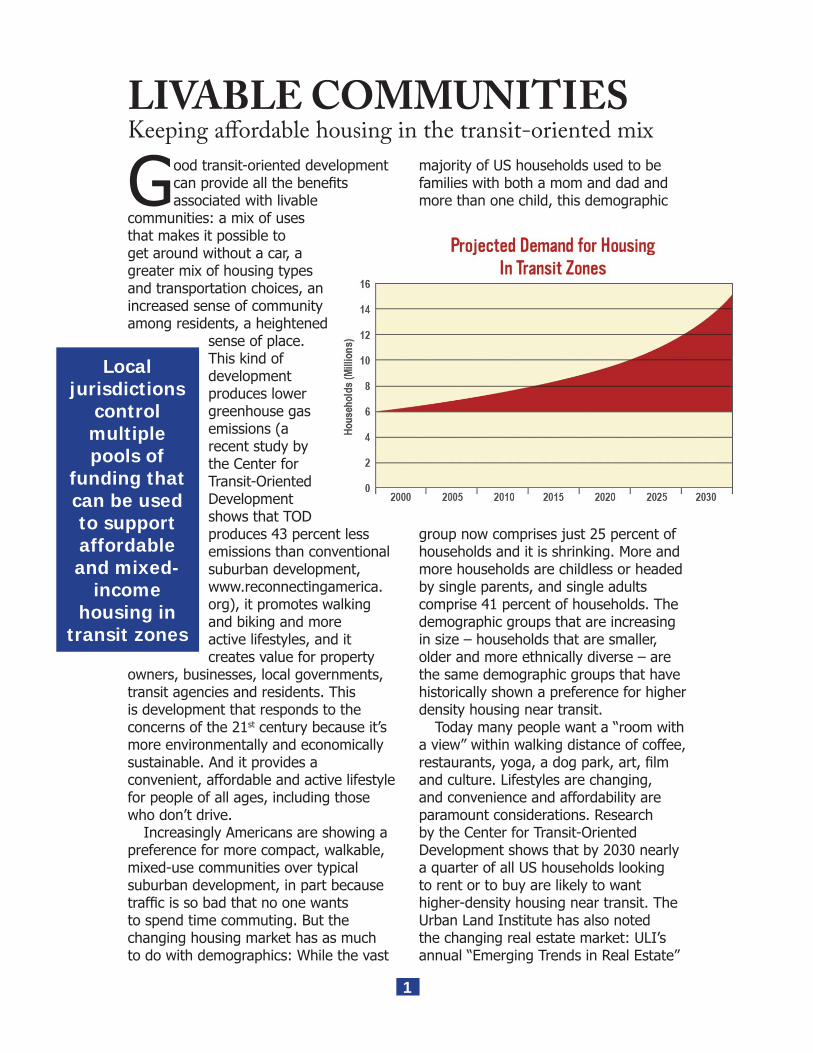
Good transit-oriented development can provide all the benefi ts associated with livable
communities: a mix of uses that makes it possible to get around without a car, a greater mix of housing types and transportation choices, an increased sense of community among residents, a heightened
sense of place. This kind of development produces lower greenhouse gas emissions (a recent study by the Center for Transit-Oriented Development shows that TOD produces 43 percent less emissions than conventional suburban development, www.reconnectingamerica.org), it promotes walking and biking and more active lifestyles, and it creates value for property
owners, businesses, local governments, transit agencies and residents. This is development that responds to the concerns of the 21st century because it’s more environmentally and economically sustainable. And it provides a convenient, affordable and active lifestyle for people of all ages, including those who don’t drive.
Increasingly Americans are showing a preference for more compact, walkable, mixed-use communities over typical suburban development, in part because traffi c is so bad that no one wants to spend time commuting. But the changing housing market has as much to do with demographics: While the vast
majority of US households used to be families with both a mom and dad and more than one child, this demographic
group now comprises just 25 percent of households and it is shrinking. More and more households are childless or headed by single parents, and single adults comprise 41 percent of households. The demographic groups that are increasing in size – households that are smaller, older and more ethnically diverse – are the same demographic groups that have historically shown a preference for higher density housing near transit.
Today many people want a “room with a view” within walking distance of coffee, restaurants, yoga, a dog park, art, fi lm and culture. Lifestyles are changing, and convenience and affordability are paramount considerations. Research by the Center for Transit-Oriented Development shows that by 2030 nearly a quarter of all US households looking to rent or to buy are likely to want higher-density housing near transit. The Urban Land Institute has also noted the changing real estate market: ULI’s annual “Emerging Trends in Real Estate”
LIVABLE COMMUNITIESKeeping aff ordable housing in the transit-oriented mix
Local jurisdictions
control multiple pools of
funding that can be used to support affordable and mixed-
income housing in
transit zones
1

report has ranked locations near transit as a best bet for investors fi ve years in a row.
Moreover, transit is proven to generate value that can be captured and reinvested in communities because it concentrates development and business activity and the tax base in a way that allows for focused value capture strategies. Tried and true value capture strategies include: property and sales taxes, real estate lease and sales revenues, farebox revenues, fees on everything from parking to business licenses, joint development, special assessment districts and public-private partnerships.
The Rosslyn Ballston Corridor in Arlington, VA, illustrates how TOD can accommodate tremendous development in a livable community that provides benefi ts to both new and existing residents. This was a declining low-density commercial corridor 30 years ago when the local government decided to focus development around fi ve closely spaced rail stations, working with residents and the private sector. Despite
The Rosslyn Ballston Corridor in Arlington, VA, illustrates how TOD can accommodate tre-mendous development in a livable community that provides benefi ts to both new and existing residents. This was a declining low-density commercial corridor 30 years ago when the local government decided to focus development around fi ve closely spaced rail stations. Despite the enormous amount of development that has occurred, single-family neighborhoods have been preserved just a short walk away.
the enormous amount of development that has occurred, single-family neighborhoods have been preserved just a short walk away, and there has been only a modest increase in traffi c. The overall results have been extraordinary:.The assessed value of land around
stations increased 81 percent in 10 years;.8 percent of county land generates .33 percent of county revenues – allowing Arlington to have the lowest property tax in Northern Virginia;.50 percent of residents take transit to work; 73 percent walk to stations.
Shifting demographics and the changing real estate market have opened up an unprecedented window of opportunity to channel growth into livable communities near transit. This opportunity should be exploited since it is increasingly clear that one of the most sustainable, low-cost, long-term solutions to a host of pending problems – including climate change and dependence on foreign oil -- is public-private investment in neighborhoods where people don’t have to drive.
2

Station area plans are conceptual or specifi c plans for the areas around transit stations or along
transit corridors. There is some variation in what these plans contain, but they all lay out the basics, including zoning, design standards, parking requirements and information about transit access and bike and
pedestrian circulation. The most effective plans have a clear time frame and strategy for implementation, such as an investment or infrastructure improvement plan that has clearly identifi ed funding
sources. Station area plans work best for encouraging TOD when there are signifi cant development opportunities such as a large surface parking lot or other underutilized land; they are far less useful for development of a limited scope. Detailed station area planning efforts are especially important for high-priority sites.
VISIONING NEW STATIONS
Station area plans that are based on a visioning process with community input can help set standards and expectations before projects are proposed, smoothing the way for the approval of appropriate development. This certainty and predictability can help ensure that projects will be approved without delay or community opposition ̶ both of which increase risk and result in increased development costs. The community
should be involved in determining what public infrastructure is needed, the desired mix of uses, whether there
should be public space and what kind, as well as other design considerations. In some cases plans may be advanced enough to allow for “by-right” zoning that can greatly expedite the time it takes to move from project conception to construction.
The developer of Mission Meridian Village in South Pasadena, just north of downtown Los Angeles, solicited the input of residents before building what was a relatively high-density mixed-use TOD project in a historic single-family neighborhood that had long resisted development. By cultivating their interest, input and enthusiasm he succeeded in getting their support for what became a catalytic and immensely popular development that activated and improved the entire neighborhood. Similarly, the neighborhood surrounding Highlands Garden Village, a mixed-income, mixed-use urban infi ll project near downtown Denver, provided signifi cant input on the project design,
STATION AREA PLANNINGGetting the most out of transit-oriented development
Detailed station area plans help
leverage the potential of transit-oriented
development
The neighborhood surrounding Highlands Garden Village, a mixed-in-come, mixed-use urban infi ll project near downtown Denver, provided signifi cant input on the project design, greatly enhancing its success.
3

greatly enhancing its success. In both instances community input resulted in a design that located new single-family homes on the sides of the development that faced existing single-family homes, with more density and commercial space facing the commercial streets. The result was a truly sensitive design that integrated signifi cant density a into single-family neighborhood.
Some elements of station area plans may be proscriptive, such as prohibitions on auto-oriented retail, or prescriptive, such as a provision that 50 percent of groundfl oor space should be devoted to retail. Other elements can be “permissive.” For example, the developer may have the option of providing a certain feature, but it is not required. The challenge lies in fi nding the right balance between what is optional and what is required with the goal of ensuring that the plan will result in a successful project, but not scare developers away. Planners and policymakers should be careful not to let perfection get in the way of the good.
While some plans are custom-designed for specifi c stations, a “transit district” or “transit village” overlay zone can be applied more generally to ensure that plans or projects near stations meet certain criteria including a mix of uses, a pedestrian orientation, or a standard
of affordability. A “fl oating” TOD overlay zone offers more fl exibility; it can be applied when the opportunity arises instead of pre-zoning the site before the market is ready – which can cause land speculation and higher costs, as well as diffi culties for existing property owners.Transit agencies and cities should consider the corridor as well as the station area, and balance overall considerations about system performance with each station area plan. Considering the corridor as well as the station allows local governments to identify those stations that should serve as parking lots for commuters, and those that should be developed as high-activity nodes. Parking ratios can be reduced as neighborhoods near stations develop. At BART’s Fruitvale station in Oakland, for example, parking was reduced to allow for a higher density, mixed-use, mixed-income transit village that was developed by a local community organization. The lower parking requirements reduced development costs, which reduced the cost of housing and commercial space, resulting in a vibrant mixed-use pedestrian corridor with high-quality public space and plazas leading from the BART station to Fruitvale’s nearby commercial center.
The developer of Mis-sion Meridian Village in South Pasadena solicited the input of residents before building what was a relatively high-density mixed-use TOD project in a historic single-family neighborhood. By cultivat-ing their interest, input and enthusiasm he suc-ceeded in getting their support for what became a catalytic and immensely popular development that activated and improved the entire neighborhood.
4

land around the station, building or rehabilitating 1,000 housing units and a new “green” station building that houses
a child care center and retail, creating a comprehensive mixed-use development. The cities of Chicago and San Diego were both supportive of these developments but had prioritized development in neighborhoods where it was easier to attract developers. Bethel New Life had to buy land, develop the housing and negotiate with the city, developers and the transit agency in order to realize their vision. Financing came together through a combination of loans, grants, tax credits to make the deal work.
Similarly, four CDCs have come together in Boston to build mixed-income transit-oriented projects along the Fairmount commuter rail line to help ensure that gentrifi cation doesn’t displace current residents. The combination of a strong housing market and improvements to the commuter rail line -- including
COMMUNITY EFFORTFollowing the lead of community-based organizations
Community Development Corporations
play an important
role in neighborhoods
bypassed by the market
Community development corporations (CDC) can use transit-oriented development to
bring about comprehensive and lasting revitalization in neighborhoods and increase affordability because families that use transit spend less money on transportation. Community development
corporations can play an especially important role in neighborhoods that have been bypassed by the market and that aren’t a high priority for local governments or transit agencies by initiating projects that will benefi t the community.
Community support for a CDC’s efforts can go a long way toward convincing lenders to invest in and retailers to move into a community. It may be possible, for example, to attract an otherwise reluctant vendor, such as a grocery store, if community members say they will support the store.
TOD success stories
There are many TOD success stories involving CDCs: San Diego’s transit-oriented Barrio Logan neighborhood was developed by a community services organization, as was the Lake-Pulaski neighborhood in Chicago, where a CDC named Bethel New Life made an El station the anchor for its revitalization efforts. Beginning with $10,000 raised from a church congregation, Bethel New Life has since assembled and brokered
The Dudley Village project developed by the Dorchester Bay Economic Development Corporation in Boston will bring 50
afforable housing units to Roxbury.
5

better service and new infi ll stations -- had prompted developers to build market-rate housing in what had been high-poverty transit-dependent neighborhoods. The four CDCs mobilized support for the transit improvements, raised funds for planning and development capacity, and are developing projects near the new stations that provide affordable units and economic development opportunities for lower-income residents.
Perhaps the most famous example of a CDC-led TOD effort is the Fruitvale BART (Bay Area Rapid Transit) station near Oakland, California. This large mixed-use mixed-income TOD project grew out of community resistance to BART’s plan to build a parking garage between the BART station and the Latino neighborhood’s commercial center, which the community worried would hasten the decline of the already distressed neighborhood. BART withdrew the plan and agreed to work with the neighborhood on an alternative. The Spanish-speaking Unity Council, which had led the opposition, became the developer, working with a variety of federal and local partners to build the project. Fifteen years later, the Fruitvale “transit village” links the commercial center and BART station with a pedestrian corridor and plazas lined with shops, offi ces, apartments and community services – the village includes a clinic, child development center, senior center and library.All of these examples illustrate how TOD can be used to catalyze neighborhood revitalization, ensure affordability, leverage public and private investment, provide more choices for residents, increase transit ridership, reduce traffi c and pollution, and enhance the economic and environmental sustainability of a
neighborhood. There are also some lessons learned: In each of the examples discussed above there were effective public-private-nonprofi t partnerships, effective leadership, public involvement, creative fi nancing, quality design and construction and -- perhaps most importantly -- perseverance.
The Fruitvale BART station in Oakland, a large mixed-income TOD project, grew out of community resistance to BART’s plan to build a parking garage between the BART station and the Latino neighborhood’s com-mercial center, which the community worried would hasten the decline of the already distressed neighbor-hood. The Spanish-speaking Unity Council became the developer, working with a variety of federal and local partners to build the project.
6

Parking mandates crafted for single land uses overestimate the parking needs of development
near transit and undermine opportunities for higher-value uses. Providing parking is expensive – estimated to cost from $20,000 to $40,000 per space in a parking structure and as much as $60,000 or more per space in high-value real estate markets like San Francisco. Because parking requirements can
drive the budget for TOD projects, parking becomes a key factor in determining real estate prices.
Local parking standards are usually set in accordance with the Institute of Transportation Engineers trip generation and parking forecasts. The ITE model, however, is based on suburban examples where parking is typically inexpensive and plentiful, and because surrounding
low-density uses make travel by car necessary. The Center for Transit Oriented Development’s database of transit systems and TOD shows that, in contrast, homeowners in walkable communities with a mix of uses and good transit access own 43 percent fewer cars than those who live in suburban communities.
There’s increasing proof that TOD projects generate less traffi c. The Transit Cooperative Research Program (TCRP) released new research in 2008 by PB PlaceMaking, Robert Cervero of UC-Berkeley, the Urban Land Institute and the Center for TOD that shows that transit-oriented housing produces just half as many car trips as conventional suburban development. The study counted the number of cars driving
across pneumatic tubes stretched across the driveways of 17 transit-oriented housing projects in Philadelphia, Washington D.C., the San Francisco Bay Area, and in Portland, OR. The research was intended to provide guidance for an update of the ITE trip generation and parking generation rates.
ECONOMICS OF PARKING
Reducing parking requirements can increase the feasibility of mixed-income and mixed-use development, and from a design perspective largely determines if there is space for retail, childcare or other nonresidential uses. Consider, for example, a one-acre parcel zoned for up to 100 units of residential development. A parking requirement of two spaces for each residential unit would consume 320-350 square feet per space at a cost of $20,000 to $40,000 per space. Reducing the requirement to 1:1 would allow the project to save as much as $2 million. By reducing the parking requirement to 0.75:1, enough ground fl oor space would be available to allow
RIGHT-SIZING PARKINGTaking advantage of transit-oriented development
Housing in transit-oriented
developments produces as much as 50 percent less traffi c than
conventional developments
7

for a childcare center and 10,000 square feet of retail.
Similarly, the TCRP study showed that under the right conditions lowering residential parking ratios by 50 percent for TOD projects near high-quality transit service could provide for increases in residential density of between 20 to 33 percent and a savings to the developer ranging from 5 to 36 percent. The TCRP research suggests that reducing residential parking ratios for TOD makes sense and would help these projects realize the expected community benefi ts by limiting traffi c, encouraging walking and biking and transit use, making TOD housing prices more affordable by limiting project costs, and providing room for higher-value uses.
COUNTING TOD TRIPS
In addition, neighborhoods may be more likely to support density near transit if they understand that TOD produces fewer trips than conventional development. The savings to developers
Higher-densities in transit-oriented developments are often not enough to make them pencil out. The lower line shows that a developer would require subsidies in order reach densities of more than 35 units per acre and 25 units per acre would be the optimal density. But if the higher rents a project near transit can demand and the lower development costs from reduced parking are added to the equation, the site’s profi table maximum moves to the 90 units per acre range.
can be passed on to consumers in the form of more affordable housing. Lower parking ratios will help promote transit ridership. And less parking will mean that TOD projects are more compact and sustainable.
In Evanston, IL, for example, recent multifamily residential developments included a minimum of 1.25 spaces for housing units that are one bedroom or smaller and 2 spaces per unit for three or more bedrooms. But an onsite survey to determine whether all these parking spaces were actually used found an actual parking demand of 0.8 spaces to 1.18 spaces per unit. As a result, Evanston planners proposed reducing parking requirements and shifting from a per-bedroom rule to a per-square-foot rule that will range from one parking space for an 800 square-foot-unit to 1.5 spaces for 1,500 square feet or more.
For more information see: Parking Spaces/Community Places: Finding the Balance through Smart Growth Solutions. http://epa.gov/smartgrowth/parking.htm
8

Parking policy is every bit as important to creating vibrant, pedestrian-friendly mixed-use
districts as streetscapes, parks and high-quality public space, because it largely determines whether a neighborhood is compact and walkable. Shared parking is a valuable tool because it provides for a more cost-effi cient use of parking resources, and
frees up land for higher-value uses, creative site planning and landscaping – all of which will enhance the vibrancy, appeal and value of the development.
Shared parking is a parking management policy that allows for parking
spaces to be shared by more than one user, since most parking spaces are only used some of the time and many parking facilities include many unused spaces with patterns of usage that follow predictable daily, weekly and annual cycles. For example, an offi ce complex can effi ciently share parking facilities with restaurants or theaters, since offi ces require maximum parking during weekdays, while restaurants and theaters require maximum parking in the evenings and weekends. As a result, it is estimated that the total amount of parking can be reduced 40-60 percent.
One of the best ways to provide shared parking is to build shared parking facilities rather than having each building
provide private off-street parking, thereby allowing each public space to serve many users and destinations. It is estimated that 100 public parking spaces
can be the equivalent of 150 to 250 private parking spaces, and developers or building owners can be asked to pay in-lieu fees to fund construction of these public parking facilities. On-street parking is also easy to share since it’s so visible and convenient, but in order to make this work the on-street parking must be managed for maximum use, particularly in busy commercial centers, by limiting the time to two hours or less, or applying short-term pricing. Parking can also be shared among a group of employees or residents: For example, 100 employees or residents can usually share 60-80 spaces since not all employees will drive to work at one time.
AGREEING TO SHARE PARKING
Shared parking is typically implemented by municipal governments, with sharing arrangements made between individual facility developers
SHARED PARKINGMaking parking work 24/7 in mixed-use districts
Shared parking is
most effective when land uses have
signifi cantly different
peak parking characteristics
WEEKDAY EVENING WEEKENDShared parking works best with multiple destinations with different peak parking demand periods.
9

and managers. Some local jurisdictions incorporate language in local ordinances to permit and even encourage shared parking. These jurisdictions allow shared parking to meet minimum parking requirements for uses located in the same building and also permit off-site shared parking arrangements to meet on-site requirements for complementary uses within a defi ned area. These location requirements are typically based on acceptable walking distances. San Diego’s municipal code, for example, states that shared parking facilities must be located within 600 feet of the uses served, while Eugene, Oregon, and Los Angeles both allow for 1,320 and 1,500 feet, respectively.
IN-LIEU PARKING FEES
The city of Long Beach recognizes that parking is expensive and consumes valuable land, and allows for shared parking and in-lieu parking fees. For example, the city’s minimum parking requirements
would have required a proposed 162-room downtown hotel to provide 302 spaces, costing an estimated $4.83 million, making the project fi nancially infeasible. In the interest of encouraging urban revitalization the city agreed to lower the parking requirements to 218 and allow the developer to pay in-lieu fees of $3,000 per space for a quarter of these spaces plus an additional $50 per space per month to cover parking operating and maintenance expenditures. The revised parking requirements provided a savings of more than $2 million to the developer and has facilitated the revitalization of the surrounding area, increased pedestrian traffi c, generated approximately $300,000 in property tax revenues and helps to support Long Beach’s downtown.
The seven-story Gaia complex in downtown Berkeley, less than a block from the Berkeley BART station and the University of California-Berkeley campus, was allowed a height bonus in exchange for providing a performance and arts space. In addition to the cultural space, there is a cafe on the ground fl oor, a rooftop garden and a solarium as common ar-eas. The 91-unit project has 42 spaces in parking lifts along with space for car sharing and bike stor-age facilities.
10

Most U.S. cities regulate development through conventional or Euclidean
zoning, the primary purpose of which is to segregate incompatible land uses and accommodate the movement and storage of vehicles. But these codes date back to concerns about the industrialization of American cities at the
turn of the last century and aren’t as relevant to the economic realities of cities today. Demographics in America are changing. Whereas
the family was the major demographic group in the 1950s, making the suburban single family home popular, singles and “non-family” households (single-parents, empty nesters, friends living together) have become the new majority. These households are much more interested in multi-family housing types -- including the loft and live-work space and condo – in lively mixed-use neighborhoods that are walkable.
Mixed-use zoning has become popular as a result, and mixed-use districts are often overlaid on the conventional zoning grid through creation of special zones or districts. But this is a makeshift strategy and doesn’t change the underlying requirements of auto-dependent planning, and many cities are instead turning to form-based codes to achieve more vibrant and human-scaled neighborhoods.
Form-based codes, in contrast to
conventional codes, focus on the architectural and urban “form” of the built environment, and regulate key aspects such as building heights and
setbacks, windows and doors, the street and sidewalks. The intent is to get all of these elements to work together to create a desirable public realm and allow for the complexity, diversity and fl exibility that can create dynamic and vibrant neighborhoods.
FLEXIBILITY IN CODES
Form-based codes are much more user-friendly than the typically complex and oft-amended conventional codes, which are composed of lengthy text and numerical descriptions. Form-based codes, in contrast, use charts and illustrations with the intent of simplifying the code; they depict desired outcomes through the use of two- and three-dimensional drawings and diagrams. Most importantly, form-based codes allow for much greater fl exibility
AESTHETIC ZONINGEmphasizing form over use to create human-scale places
Physical form and beauty of a city are defi ned by
the sum of its public spaces
One of the earliest codes was created for the new town of Seaside, Florida, in the 1990s. It was subsequently recognized as one of the most
important planning efforts of the post-World War II era.
11

with regard to the uses located in the buildings so that property owners can adapt to changing market conditions, and to allow the mix of uses to change over time. They also simplify and streamline the planning process, thereby appealing to both cities and developers.
Form-based codes focus on the relationships between building facades and the public realm, the form and mass of buildings in relation to one another, and the scale and types of streets and blocks. The primary concern is the impact on the public realm or right of way, in acknowledgement of the fact that architectural design, how buildings relate to the street, and walkability are important elements in creating places that people want to visit -- which is why form-based codes focus on enforcing these elements instead of on restricting uses.
BUILT-IN INCENTIVES
One of the earliest codes was created for the new town of Seaside, Florida, in the 1990s and was subsequently
The former Safeway site on Columbia Pike will include an 188-unit rental apartment build-ing. Approximately 34,340 square feet of retail and 14,650 square feet of offi ce space will be included on the ground fl oor and mezzanine. There will be 408 parking spaces on three below-ground levels; at least 107 of which are non-reserved and shared for visitors and shoppers. The project also includes 79 bicycle parking racks. The project is in compliance with the Form Based Code and consistant with the goals of the Columbia Pike Initiative.
recognized as one of the most appealing and important planning efforts of the post-World War II era. Arlington, VA, adopted an optional form-based code for Columbia Pike in 1998 that incentivized its use by expediting projects that met code requirements – thereby prompted a wave of development. It has been lauded as providing for up-front citizen consultation, less regulation, quicker approvals, and for making development less expensive (less parking, expedited approvals), which has allowed for the construction of more workforce housing. Denver is also adopting a form-based code to help implement the city’s recent comprehensive plan, which directs higher-density development along public transit corridors in the hopes of promoting ridership.
12

A public-private partnership is a contractual agreement between a public agency (federal, state or
local) and a private sector entity that leverages the skills and assets of both with the goal of delivering a service or development for public benefi t. Public-private partnerships are especially useful for leveraging private investment in transit-oriented development, they are
more fl exible than joint development arrangements, and they don’t require pub-licly owned land – though, as with joint development, each partner brings some-thing to the deal. Local gov-ernments, for example, can help assemble land, rezone it, and fund environmental remediation with a grant from the federal govern-ment. Private investment can also be leveraged if a local government provides an in-kind match, in-lieu-of fees, or gap fi nancing.
Local governments can be particu-larly effective in incentivizing the kind of development they want by working with developers to mitigate the four risks as-sociated with in the development pro-cess: They can help with entitlement risk by bringing communities to consensus on a station area plan that creates predict-ability for both the community and the developer, and by expediting the review process. They can help with construction risk by prioritizing inspection services for TOD, and by vetting contractors. They can help with fi nancing risk by working with local banks to provide lower-cost mezzanine loans, a type of debt used for commercial and multifamily construction that is typically very expensive.
Government can also help with the
marketing of the fi nished development, advertising its proximity to transit, for example. Lenders typically want to be “taken out,” or paid off, as quickly as possible by a mortgage. If marketing helps sell the units more quickly, transit access can help develop-ers secure fi nancing more quickly, lower-ing the costs at the end of the proj-ect. This cost savings can help subsi-dize below-market-rate units, or pay for pedestrian amenities like parks and plazas and streetscapes. DART in Dallas has done a particularly good job of us-ing transit to market TOD. The agency’s real estate department reaches out to developers, providing them with a basic market analysis for sites near stations, including information about demograph-ics, land ownership, characteristics of the surrounding communities. Some cities, like Portland, have made infrastructure investments -- including parks, sidewalk improvements, and transit stop enhance-ments – to increase the curb appeal and marketability of larger developments.
Local governments can also help with predevelopment costs, which are typi-cally hard to fi nance, especially if the land to be developed has to be held for several years until it is developable because of zoning or design issues. Local governments can help by provid-
COLLABORATIONLeveraging public-private partnerships for better results
Melding of public
and private goods is a
progressive, pragmatic solution to
the practical diffi culty of
getting things done.
Portland’s Pearl District streetcar
13

ing patient capital from funding sources such as redevelopment funds. They can also provide funding for public parking and therefore become an equity part-ner in the development. Value capture strategies and zoning incentives includ-ing density bonuses can be used to fund affordable housing and infrastructure.
One of the best examples of a highly successful public-private partnership that used transit to leverage large-scale redevelopment is Portland’s Pearl Dis-trict, a new neighborhood built along a streetcar line. The streetcar was built to connect two large parcels of vacant industrial land north and south of down-town. The city struck a deal with the owner of 40 acres: The city would build the streetcar past his property and make other improvements if he would up-zone his property from 15 dwelling units per acre to 125. This was in the early ‘90s, when there was no market for this kind of development, but today it is the city’s densest and most popular neighbor-hood, and at build-out it will be home to 10,000 residents and 21,000 jobs. The streetcar was subsequently extended to the second vacant parcel, the South Wa-terfront, where an even more ambitious redevelopment effort is underway.
This private investment – an estimated
$3.5 billion in 2008 – helped the city meet several public goals and objectives, including accommodating a signifi cant number of new housing units within the city’s urban growth boundary. The result:
10,000 units of housing, one quarter • of which is affordable;4.6 million square feet of commer-• cial space within two blocks of the streetcar;Portland’s 20-year housing goal was • met in just 7 years on one-tenth the projected land;A record number of building permits • were issued 7 years in a row;
Properties closest to the streetcar were developed at 90 percent of permit-ted density, compared to 43 percent of allowable density at 3 blocks and further away.
The Portland streetcar proved to be a public investment that attracted private investment that helped the city meet many public goals including affordable housing, very high-quality streetscapes and parks and plazas, and which generated a high volume of business activity for downtown. The streetcar has been so successful in stimulating development that there are now at least 60 US cities trying to follow Portland’s example by building streetcars.
One of the best examples of a successful public-private partnership that used transit to lever-age large-scale redevelopment is Portland’s Pearl District, a neighborhood built along a street-car line. The streetcar was built to connect two large parcels of vacant industrial land north and south of downtown.
14

Generally speaking, transit agencies or cities cannot create transit-oriented neighborhoods that
generate high ridership and achieve other public goals on their own. They aren’t likely to own enough land at stations to create truly catalytic projects, and their real estate departments
may lack the necessary staff, resources and/or sophistication. However, many transit agencies and cities do enter into joint development with private
development partners on publicly owned land to ensure that it is built with uses that will support transit ridership, or development that supports other public goals including affordability and the revitalization of neighborhoods. Private developers bring their own resources, including additional property, and expertise to joint development projects, which can result in more successful development.
Research shows that transit can add signifi cant value to land near stations. Developing the land maximizes that value and can yield signifi cant revenues from long-term ground leases, rents or sales, as well as increased property and sales taxes and farebox revenues, and provide increased revenues from fees on everything from parking to business licenses. All these revenues can be used to fund additional improvements for the neighborhood in which the station is
located, or to support additional transit investments. Moreover, transit agencies have found that joint development is a
cost-effective way to help ensure higher ridership – much more so than building costly parking structures or providing feeder bus service.
There are challenges, however. One key issue is the disposition of land. Many transit agencies prefer to lease their land rather than sell it outright, which can have a critical impact on the cost of fi nancing. Lenders and equity providers perceive more risk with deals in which the land is not permanently secured to the real estate improvements they make. The cost of joint development is high to begin with – because of the added time and complexity of these projects – and the added cost of fi nancing makes it hard to make these projects pencil out.
There may also be the thorny question of providing replacement parking for transit users – which has killed the fi nancial feasibility of many joint
JOINT DEVELOPMENTLeveraging agency land to improve TOD prospects
The most common joint development arrangements
are ground leases and operation-
cost sharing A tripartite agreement among the MBTA, Massport, and a developer in South Boston led to construction of a new underground Silver Line BRT station.
15

development projects. With the cost of structured parking estimated at between $20,000 and $40,000 a space, the requirement to replace a large surface parking lot with structured parking in order to make room for development can price most projects out of the box. In the recognition that joint development projects may be the highest and best use for transit agency properties, many transit agencies that engage in joint development are abandoning their one-for-one replacement parking policies for more fl exible guidelines that allow replacement parking to be moved to other stations along a corridor.
JOINT-DEVELOPMENT EXAMPLES
The Washington Metropolitan Area Transit Authority (WMATA), the Massachusetts Bay Transportation Authority, and BART in the San Francisco Bay Area are among the transit agencies that have aggressively pursued joint development opportunities. In one of the more interesting and complicated joint development deals, BART’s $70 million West Dublin station is being built in part with $15 million generated
The Washington (D.C.) Metropolitan Area is, by far, the nation’s leader in transit joint development. The region presently has some 30 joint development projects, including such notable air-rights developments (and revenue generators) as this Bethesda station project.
by the pre-payment of lease revenues on development planned for 18 acres around the station. Other project partners included the state DOT, the council of governments, congestion management agency, and the cities of Dublin and Pleasanton, which surround the station and owned some of the land.
The Massachusetts Bay Transportation Authority has also been selling and leasing land near stations to private developers, and taking an equity interest in the development. At the Ashmont Square Station, for example, the MBTA entered into an agreement with a developer to build 150 units of housing on agency land. Proceeds were used to help fund construction of a new parking structure with 5,000 spaces near the station. MBTA also entered into an agreement with Massport and a private developer to construct a new underground Silver Line BRT station at the World Trade Center complex in South Boston, with each each development partner contributing something to the deal.
16

Land assembly can be a challenge when developing pedestrian-friendly transit-oriented neighborhoods.
Neighborhoods around stations are often built-out, sometimes with transit-unfriendly uses, there may be few vacant or underutilized lots, and sites that are
developable may be small, disconnected and not under the control of any one owner. Exceptional TOD projects require large sites, and large sites reduce construction costs, provide
for a more even quality of building design, and ensure a phased build-out that will maximize profi ts. For all of these reasons some local governments use their land assembly powers to acquire sites and then sell or donate the land to the development team. The power to assemble land provides leverage for public agencies, giving them greater say in decisions about the kind of development that should be built.
There are a number of innovative land assembly and fi nancing techniques that are being employed, including making the planning of infrastructure investments and land assembly concurrent. Land acquisition or land-banking funds are being considered in many cities to enable the early purchase of land around stations or along transit corridors while the land is still affordable. Development fees, fl exible state transportation and housing funds,
and grants from corporate and family foundations can be a source of capital for land acquisition.
There are barriers to land assembly, of course, including the fact that property owners may be unwilling to sell or have unrealistic expectations about what their properties are worth, given the speculative rush that can accompany the construction of a new transit line. Moreover, it takes a long time to assemble sites and then get them entitled, zoned, platted and approved for development, and there are legal issues surrounding the use of eminent domain. Many developers are not able to handle the holding costs of long-term or even medium-term site assembly and entitlement, which is why the help of public agencies is often necessary.
Because of these diffi culties, brownfi eld sites, underutilized commercial and industrial sites, and redevelopment project areas offer
LAND ASSEMBLYPackaging a project to leverage development opportunity
Local governments
can help package and
assemble land for
development purposes
Charlotte’s Scaleybark station is surrounded by large industrial and com-mercial sites that are ready to be redeveloped, making it well suited for
catalytic TOD projects
17

some of the best opportunities for TOD because they make large-scale development possible. For example, the City of Baltimore was able to offer 30 acres for redevelopment as TOD around the Metro station at Center Square. These sites link the Metro station to a light rail station surrounded by city and county offi ces and cultural attractions. Land assembly is also a major element of the Atlanta Beltline effort to turn more than 20 miles of mostly unused railroad tracks and adjacent land into an “emerald necklace” of parks, workforce housing and mixed-use development on either side of a transit line looping around the city.
REDEVELOPMENT AND TRANSIT
In Philadelphia, land assembly has been deemed so important to the stabilization and rebuilding of neighborhoods that the city has implemented a new approach driven by redevelopment considerations. The city has nearly 60,000 vacant parcels, but few are large enough to support signifi cant and catalytic development that can spur other projects. So the city has begun acquiring large quantities of vacant land, and by holding title will be
Philadelphia has the third largest rail system in the United States but stations are dominated by auto-oriented uses. In addition, the Temple Regional Rail station and elevated rail line separate Temple University in North Philadelphia from the Asociacion de Puertorriqueos en Marcha (APM) community, which has long struggled to revitalize after population loss.
able to market the land in accordance with neighborhood plans and dispose of the properties without the delays associated with a more piecemeal approach.
Land swaps are another option that can help clear the way for development of critical sites near stations. At the Fruitvale BART (Bay Area Rapid Transit) station, for example, the developer needed to assemble all the parcels of land at the site under single ownership. BART owned the land, but couldn’t part with the property because of a long-standing policy requiring the agency to retain ownership of the land for long-term planning. The problem was addressed through a land swap in which the developer was awarded a 96-year lease on the land in return for a parcel the developer owned behind the transit station as well as several nearby vacant parcels owned by the City of Oakland. This swap gave the developer proprietary rights to the entire development site without reducing the value of BART’s land assets near the transit station.
For more information, see: Tools for Mixed-Income TOD, Douglas Shoemaker with the Center for Transit Oriented Development
18

Housing trust funds establish a stable and steady source of funding for affordable housing
outside of the unreliable political budgetary process, enabling jurisdictions to provide developers with a dependable funding source. These funds are typically established by the city, county or state via legislation or ordinance.
While there are different constitutional or procedural issues that determine how this can be done in each jurisdiction, nearly 600 funds have been
established in 43 states in the country, generating more than $1.6 billion a year to support housing needs. State housing trust funds are the most signifi cant source of money, and are usually funded with proceeds from the real estate transfer tax or documentary stamp tax. Cities typically use developer fees. Counties have a more diffi cult time fi nding a funding source, but they are well-positioned to provide broad support for affordable housing outside municipal boundaries.
PURCHASING AFFORDABILITY
Housing trust funds are used for a variety of purposes, including the construction and maintenance of affordable housing, homebuyer assistance, homeless shelters, gap fi nancing (for projects where other funding sources leave a gap requiring
additional resources), loans for developers, and/or matching funds used to leverage private investment. One of
the appeals of a city-controlled fund is that it can be tailored to the particular needs and opportunities of a community.
Targeting these resources to sites near transit is especially important because transit-oriented development provides increased affordability. The American Public Transportation Association estimates that households that live near transit and use it can save $9,499 a year on transportation compared to households that drive (www.apta.com). Research by the Center for Transit-Oriented Development shows that households living in walkable, mixed-use neighborhoods near transit spend about 16 percent less on transportation than households that live in conventional suburban development (www.reconnectingamerica.org). For these reasons, trust funds and well as other affordable housing resources should be used around stations and along transit corridors to preserve existing affordable
HOUSING TRUST FUNDSPreserving aff ordable housing near transit
Socio-economic diversity enhances
community stability and sustainability
The City of Charlotte purchased property at Scaleybark station, which is surrounded by large industrial and commercial sites, to
ensure that development remains affordable.
19

housing, to purchase rental properties for permanent use as affordable housing, and/or to build new affordable housing.
Charlotte, North Carolina, established an Affordable Housing Trust Fund to provide public funding to private developers in exchange for affordable units using a competitive bid process. The City Council set aside $10 million for the fund in 2001, and voters then approved another $35 million. The city has the fl exibility to make the funds available as either a loan or grant for land acquisition or construction. By 2007 the fund had enabled the construction or rehabilitation of more than 2,800 units, more than half of which were for households earning below 30 percent of area median income. This number included 223 units of new affordable ownership housing, more than 900 new multifamily rental units, nearly 600 rehabilitated multifamily rental units, and more than 1,100 units for households with special needs. The average subsidy per unit was less than $14,000 and sometimes included other affordable housing funds.
AFFORDABLE HOUSING
Land acquisition funds or land banking funds can also be used to secure sites near transit for affordable housing or transit-oriented projects while the land is still affordable. This is especially important now because changing demographics in the U.S. – households are older, smaller and more diverse – are boosting the demand for housing in these locations, driving up the price of real estate near stations. Land acquisition or land banking funds can also be used to acquire existing housing in order to preserve affordability in neighborhoods where gentrifi cation is a threat.
Development fees, fl exible state transportation and housing funds, and grants from philanthropic organizations are often used to create land acquisition
funds.The city of Charlotte has also established a land acquisition fund to purchase land near the stations planned along its South Corridor light rail line to ensure the development of mixed-income, mixed-use TOD. The City Council capitalized the fund with an initial grant of $5 million. It is jointly managed by Coldwell Banker Commercial, the Charlotte Area Transit System, and several city departments. The fi rst site, the Scaleybark station area, was purchased with the help of the city’s Housing Trust Fund, and development is required to meet a minimum affordable housing threshold.
Land acquisition funds or land banking funds can also be used to secure sites near transit for affordable housing or transit-oriented projects while the land is still affordable. This is espe-cially important now because changing demo-graphics in the U.S. are boosting the demand for housing in these locations, driving up the price of real estate near stations.
Produced by Reconnecting America on behalf of the Local Initiatives Support Corporation
20

United States Environmental Protection Agency
Impact of TOD and Smart Growth Incentives on Development in Phoenix

2 9 9 1 S H A T T U C K A V E N U E # 2 0 3 | B E R K E L E Y , C A L I F O R N I A 9 4 7 0 5 | P : 5 1 0 . 6 4 7 . 5 2 9 1 | F : 5 1 0 . 6 4 7 . 5 2 9 5 | S T R A T E G I C E C O N O M I C S . C O M
Date: March 17, 2009
To: Kevin Nelson, EPA Teresa Brice, LISC Susan Culp, Sonoran Institute
From: Strategic Economics
Subject: Impact of TOD and Smart Growth Incentives on Development in Phoenix
Introduction
With the recent opening of the Metro light rail system and plans for future expansion, it is important to consider how this new transit impacts development opportunities and property values near new transit stations. This memorandum is designed to offers insight about the feasibility of transit-oriented development (TOD), as well as the potential positive impact of tools that can be used to support TOD in the metropolitan area. The results are intended to assist policymakers, property owners and developers as they consider ways to promote TOD in neighborhoods along the light rail within the context of the legal restrictions imposed by Proposition 207. In certain cases, simply rezoning properties for uses that are more transit supportive could diminish property values. Thus, communities in the Phoenix area will need to draw upon a wide array of tools that encourage TOD and positively impact both property values and development potential.
Following this introduction, this memo includes:
• A discussion of the different scales of TOD and the residential building types that might be developed near new and planned light rail;
• A discussion of the possible benefits of a variety of policy tools to promote TOD that are being considered in the Phoenix metropolitan area that may help to enhance property values and development potential.
• The results of a financial analysis that looks specifically at how transit and TOD-supportive policies and plans can improve the feasibility of a range of building types.
The financial analysis focuses on the potential for new development along the 19th Avenue segment of the northwest extension or in the Apache Boulevard/Main Street corridor in Phoenix, however the findings are applicable in a general way to other neighborhoods near transit. The financial feasibility analysis builds on detailed work conducted by Economic and Planning Systems, including an analysis of development feasibility in station areas in Mesa and Tempe (May 2007), and an analysis of development feasibility at stations along the future Northwest LRT Extension (March 2008).
MEMORANDUM

-2-
Scales of Transit-Oriented Development (TOD)
Transit-oriented development (TOD) is typically defined as higher-density development within walking distance of a transit station that contains a mix of uses such as housing, jobs, shops, restaurants and entertainment. While the term is often used to describe individual new development projects, it can also refer more broadly to a mix of uses in a station area, usually defined as the area within a half mile of a transit station (within an easy walking distance). The goals of TOD are to:
• Increase “location efficiency” so people have the option to walk, bike and take transit rather than using an auto;
• Boost transit ridership and minimize traffic;
• Provide a rich mix of housing, shopping and transportation choices;
• Generate revenue for the public and private sectors and provide value for both new and existing residents; and
• Create a sense of place
TOD is frequently associated with high-density mixed-use development; however this kind of project is unlikely to occur at every transit station along a transit corridor. Successful TOD exists at a variety of scales, ranging from relatively low-density residential neighborhoods that offer access to jobs via transit to higher-density downtowns with a mix of residential, employment, retail and entertainment uses. Figure 1 illustrates this range of TOD places, and shows the relationship between residential density, regional connectivity and transit frequency.
FIGURE 1: A TOD TYPOLOGY
Source: Center for Transit Oriented Development.
TOD Type Land Use MixTypicalHousing Density Regional Connectivity Frequencies
Office Center
Urban Entertainment High
Multifamily Housing Hub of Radial System
Retail
Residential MediumRetail Access to downtown,Class B Commercial subregional circulation
Primary Office Center
Urban Entertainment
Multifamily Housing
Retail
Residential
Neighborhood Retail
Local Office
Residential Low 25‐30 minutes
Neighborhood Retail Access to a Center Demand responsive
HighAccess to downtownSubregional hub
MediumAccess to suburban centers
> 60 units per acre < 10 minutes
> 7 units per acre
>12 units per acre20 minutes peak30 minutes off‐peak
> 20 units per acre10 minutes peak20 minutes off‐peak
10 minutes peak10‐15 minutes off‐peak
> 50 units per acre
UrbanDowntown
UrbanNeighborhood
Suburban Neighborhood
SuburbanCenter
NeighborhoodTransit Zone

-3-
The Phoenix metro area is already experiencing new development that suggests a shift to more transit-supportive neighborhoods. A significant amount of new residential development has occurred in areas around the light rail line, much in advance of it. New luxury apartment and condominium projects in the downtown range from 3 to 4 story mixed-use buildings to high rise projects. The area near Arizona State University has also been the focus for new housing, including student apartments and urban loft style condominiums. While the real estate market is currently suffering, it is reasonable to expect that this type of development will continue once the market recovers.
The financial analysis focuses on potential development in the 19th Avenue and Apache Boulevard/Main Street corridors, where current development patterns do not fit easily into a single category of transit-oriented places, and where little new residential development has occurred recently. Most of the existing residential development in these neighborhoods is relatively low-density, and closer to the kind of development described in the categories “neighborhood transit zone” or “suburban neighborhood”. However, the frequency of transit service and direct access to regional centers suggests that parts of these neighborhoods could transform over time to include the kind of moderate-density development that is typically found in the “urban neighborhood” category. This category consists of neighborhoods that are well-connected to regional centers for entertainment, shopping and employment. Typical residential building types range from townhomes to five or six story residential or mixed-use buildings.
Residential Building Types and Development Feasibility
Based on the typology above, it seems likely that parts of the two corridors are likely to experience some increase in density, as transit makes the area a more appealing place for residential development. Most of the recent residential development outside of downtown Phoenix and Central Tempe is relatively low density, consisting of single family homes, townhomes and low-rise multifamily development. These building types have relatively low construction costs because they can be built using Type V or Type III (wood frame) construction. Wood frame construction is generally possible up to five stories, above which it is necessary to move to concrete or steel frame construction. These building types are generally more expensive to construct, and are less common outside of high-value urban centers.
Another factor that has a major impact on building costs is parking. In many lower-density residential projects, parking can be provided in carports or in a surface lot, which is relatively inexpensive for a developer. For buildings that are four or more stories, it is usually necessary to provide a parking structure. This can consist of either a podium (an above-grade or sub-grade garage beneath the residential units), as a separate structure, or as an internal garaged “wrapped” with residential and retail development. Because the cost to build structured parking spaces can be very high (usually at least $20,000 per space), it can have a major impact on project feasibility. As a result, residential or mixed-use projects with structured parking must be able to achieve considerably higher price points on a per square foot basis than lower density projects. On the flip side, however, these larger development projects also have the potential to generate much higher project revenues, due to the increased number of units.
The financial analysis later in this memo focuses on a range of building types that are possible using wood frame construction and a variety of parking options, ranging from surface or carport parking to parking structures. These building types are illustrated in Figure 2 on the following page, and described below.
Townhome with surface parking: these two-story buildings with surface or carport parking typically have an average density of 20 units per acre.
Townhome with tuck-under garage: individual townhomes incorporate parking in “tuck-under” garages” at the surface level. Because parking is incorporated within units, this type of project can achieve higher densities than one with surface parking (about 30 units per acre).

FIGURE 2BUILDING TYPE MATRIX
Building type Townhome TownhomeMultifamily2‐3 stories
Multifamily2‐3 stories
Multifamily4‐5 stories
Surface parkingTuck‐under/
garageSurface/carport
GaragePodium/garage
20 30 35 45 75
Wood frame
Urban block/"Texas donut"
Wrapped garage
90
Wood frame
Example
Parking
Approx. density/acre
Wood frame Wood frame Wood frame Wood frame Wood frame over concrete
podium
Minimum lot size 0.4 acres 0.25 acres 1 acre 0.7 acres 0.4 acres
9 high rise life safety
8
7 wood frame construction
6
5
4
3
2
1
Source: Strategic Economics, Community Design + Architecture.
Wood frame, concrete structure
3 acres
building stories
Construction type

-5-
Multifamily, 2-3 stories with surface parking: these multi-unit buildings typically consist of flats, sometimes in multiple buildings oriented to a courtyard. Parking is provided in surface lots or in carports. Multifamily, 2-3 stories with garage: this building type is the same as above, but can achieve higher densities due to a shared parking garage.
Multifamily, 4 to 5 stories over a podium: this building type consists of wood-frame construction over a concrete garage. This type of parking is usually more expensive than a stand-alone parking structure.
Urban block with wrapped garage: known in some regions as the “Texas donut”, this consists of a building or group of buildings that wrap around a shared parking garage. This building type requires the largest minimum lot size, about 1 acre. Because of the larger size and stand-alone parking garage, this kind of development is less costly on a per-square foot basis than a multifamily building with podium parking.
Impact of Transit and TOD-Supportive Policies on Development Feasibility
Transit and TOD-supportive land use policies can influence project feasibility in two main ways: by increasing achievable rents or sales prices and by reducing development costs. These impacts are discussed below.
The “Transit Premium”
Studies show that demographic and cultural changes in the US increasingly favor more compact development with convenient access to transit and urban amenities.1 Americans are increasingly prioritizing the advantages provided by neighborhoods near transit, including economic savings to households, reduced carbon emissions, healthier lifestyles, fewer traffic accidents, and reduced suburban sprawl. This trend is reinforced by a demographic shift toward smaller households, including a growing number of “empty nesters”, singles and non-family households who are more likely to value living in a walkable urban neighborhood. Demographic and cultural changes are resulting in a growing interest in cities and urban lifestyles, which means that there is increased demand for the kind of neighborhoods that are most likely to be served by transit. These trends are only reinforced by recent spikes in oil and gas prices.
New development can be designed to maximize the transit premium that can be achieved at any particular location because proximity to transit is an amenity that people are willing to pay for in the form of higher sale prices or rents. There is no standard premium that can be expected for housing near transit, because achievable sales prices and rents are influenced by a wide variety of factors. However, it is clear that development in areas with frequent connections to multiple centers for employment and entertainment achieve higher premiums compared to neighborhoods with less frequent service or reduced accessibility to desirable destinations.
CTOD recently conducted a survey of previous studies on this topic, summarized in Table 1. The findings of these studies indicates that for single family residential, the property value premium has ranged from two percent in San Diego (1992) to 32 percent in St. Louis (2004). For condominiums, the premium ranged from two percent to 18 percent in San Diego (2001), while for rental apartments the range was zero to four percent in San Diego (2001) to 45 percent in Santa Clara County (2002).
1 See, for example, Hidden in Plain Sight: Capturing the Demand for Housing Near Transit, Center for Transit-Oriented Development, 2004.

-6-
It should be noted that many of these studies are dated, and there is reason to believe that the desirability of properties near transit is likely increasing, given changing demographics, rising gas prices, and renewed interest in urban lifestyles.
TABLE 1: SUMMARY OF FINDINGS FROM VALUE PREMIUM STUDIES
Source: Capturing the Value of Transit, Center for Transit Oriented Development, 2008.
TOD-Supportive Policies
Figure 3 shows a range of TOD-supportive policy tools that are being contemplated in the Phoenix metropolitan area, and ways that they might contribute to improved development feasibility in the form of higher revenues or reduced costs.2 These tools are described in detail in a separate document, Strategic Package of Tools to Promote Transit Oriented Development in Metropolitan Phoenix. The matrix shows that there are several ways that TOD-supportive policies have the potential to enhance the feasibility of development, some in both direct and indirect ways. The policies are discussed below according to the three main categories used in the Strategic Package of Tools document: planning and visioning tools, implementation tools, and ongoing programs.
Planning and Visioning Tools
Planning efforts and land use guidelines provide a vision for future development that can provide developers some certainty about the kind of development that is desired by the public sector and/or local community. This certainty has the potential to reduce risk – and cost - for a developer, who otherwise might have to spend additional time and effort securing project entitlements. In some cases, planning efforts include detailed market and financial analysis that developers can use in planning for new development, also reducing cost.
2 Note: while these policies have the potential to contribute to development feasibility, it is not true in all cases. Moreover, many TOD projects rely on a combination of multiple policy tools and funding mechanisms.
Land Use
Single Family Residential +2% to +32%(San Diego Trolley, 1992) (St. Louis MetroLink Light Rail, 2004)
Condominium +2% to +18%(San Diego Trolley, 2001)
Apartment +0% to +45%(San Diego Trolley, 2001) (VTA Light Rail, 2004)
Office +9% to +120% (Washington Metrorail, 1981) (VTA Light Rail, 2004)
Retail +1% to +167%(BART, 1978) (San Diego Trolley, 2004)
Range of Property Value Premium

FIGURE 3: POTENTIAL IMPACT OF POLICY TOOLS ON PROJECT FEASIBILITY (Page 1 of 2)
Policy ToolIncrease
RevenuesDecrease
Costs NotesRegional TOD Strategic Plan X X
Citywide TOD Strategic Plan X X
Prepare Station Area Plans & Market Studies X X
Station Area Rezoning: Rezone Station Areas, Use Restrictions Based on Public Health and Safety, and Transportation Impacts, and Optional Overlay Zone
X X
Land Use Intensity Tools: Density Bonuses and FARs & Building Heights Bonuses XIncreased allowable density and heights can result in higher revenues from development where higher density projects are feasible.
Land Use Standards Enhancement: Form Based Codes and Design Guidelines XLike planning efforts, design guidelines can provide more certainty about the future character and quality of a neighborhood, and increase revenues from development.
Parking Tools: Revised Parking Standards, Shared Parking, and Parking Districts XPolicies that reduce the amount of parking required within individual development projects can have a major impact on
Planning efforts can provide more certainty for a developer about the future vision for a neighborhood, reduce entitlement risk, provide valuable information about the market, and help to align resources to support development.
Plan
ning
and
Vis
ioni
ng T
ools
g g g g p p j j pproject costs.
Fast Track Development Review X Expedited review results in lower "soft" costs for a developer.
Capital Funding for Infrastructure X This funding can help to fund infrastructure costs that would otherwise need to be borne by a developer.
Tax Increment Financing - REQUIRES LEGISLATION X Same as above.
Reduced Impact Fees in Station Areas - CURRENTLY INFEASIBLE X Reduced impact fees result in decreased costs for a developer.
Streetscape and Pedestrian/Bike Improvements X Enhanced "placemaking" and neighborhood amenities can make nearby development more valuable.
Façade and Site Frontage Improvement Program X Same as above
Tax Exempt Bonds X This funding can help to fund infrastructure costs that would otherwise need to be borne by a developer.
Tax Abatement - CURRENTLY INFEASIBLE X Tax abatement can be used to offset development costs.
Joint Development Program X XJoint development programs can make properties available for development and can facilitate development through public-private partnerships and innovative financing techniques.
Land Acquisition Loan Funds XLand Acquisition Loan Funds can reduce property acquisition costs or holding costs that would otherwise be borne by the developer, and assist with site assembly.
Funds for Buying Available Parcels in the Open Market X Same as above.
Impl
emen
tatio
n To
ols

FIGURE 3: POTENTIAL IMPACT OF POLICY TOOLS ON PROJECT FEASIBILITY (Page 2 of 2)
Policy ToolIncrease
RevenuesDecrease
Costs Notes
Business District Association or Business Improvement Districts X The presence of a BDA or BID has been found to have a positive impact on nearby residential properties.
Marketing Plan While a marketing plan has no direct impact on project costs or revenues, it can make developers aware of TOD opportunities.
Livable Communities Program X
The program can help make funds available for planning and urban amenities that improve neighborhood access and quality, and increase revenues for nearby development projects.
Community Development Corporation (CDC) Lead Efforts - CURRENTLY INFEASIBLE X
CDC's can take the lead in developing projects that include affordable housing or other community needs; these projects often have access to project subsidies and other funding sources that reduce overall costs.
Housing Trust Funds - CURRENTLY INFEASIBLE X This dedicated source of funding for affordable housing can be d d j
n/a
Ong
oing
Pro
gram
s
Housing Trust Funds - CURRENTLY INFEASIBLE X used to reduce project costs.
Source: Strategic Economics, Community Design + Architecture, US EPA.

-8-
At the same time, planning efforts also have the potential to increase revenues for a developer. In some cases, current zoning does not allow for the kind of development that is most likely to benefit from the introduction of transit. Tools that allow for TOD land uses, such as station area plans or zoning overlays, will have a direct impact on project feasibility by allowing for new development that could not otherwise be built.
As discussed above, higher-density building types are more expensive to build than lower-density ones such as single family homes or townhomes. Where higher-density development can generate enough revenues to offset these higher costs, however, it has the potential to generate much greater profit for a developer. The presence of urban amenities and neighborhood character can play a key role in contributing to the viability of these higher density development types. For example, a recent study by Johnson Gardner found that neighborhoods that include local-serving businesses that help make neighborhoods more “walkable” and offer needed services – such as grocers, florists, art galleries or cafes – have a positive impact on property values (and expected rents or sales prices for new development).3 Planning efforts can play an important role in enhancing and preserving neighborhood character and encouraging desirable neighborhood amenities.
One of the most direct ways that planning tools can impact development feasibility is by reducing the amount of parking that is required within an individual development project. In most parts of the country, the cost of structured parking is at least $25,000 per space, and underground parking can cost as much as $65,000 per space (compared to about $5,000 per space for surface parking). These costs can easily make or break a development project.
Studies show that households near transit require less parking, and many cities are reducing parking requirements for new housing near transit.4 Parking reductions not only result in lower overall development costs, but can also increase the amount of space that is available for revenue-generating development. The analysis later in this memo considers the impact of reducing parking from two to one space per unit.
Implementation Tools Many implementation tools are geared to help provide neighborhood amenities that generate value for surrounding properties. These include streetscape and pedestrian/bike improvements, and façade and site frontage improvement programs. A recent study by Susan Wachter at the University of Pennsylvania found that improvements to urban corridors (such as 19th Street or Apache Boulevard), reduction of vacant properties, and “green” investments in streetscape and open space, can increase the value of nearby homes – in some cases by more than 20 percent.5
A variety of tools can also be used to reduce or offset development costs, which can also have a positive impact on project feasibility. Expedited development review can reduce costs for a developer by reducing overhead costs and costly time delays. Tools such as tax exempt bonds and capital funding for infrastructure can assist with financing needed project infrastructure that would otherwise be borne by the developer.
Tools that assist with land acquisition, such as direct provision of funds to purchase parcels or land acquisition loan funds, can also reduce developer costs by reducing acquisition costs or holding costs, or by facilitating land assembly needed for new development.
3 Johnson Gardner, Urban Living Infrastructure, prepared for Oregon Metro in June 2007. 4 For example, Urban Land Institute, Developing Around Transit, 2004. 5 The Determinants of Neighborhood Transformations in Philadelphia, Identification and Analysis: The New Kensington Pilot Study, Susan Wachter, The Wharton School, University of Pennsylvania, 2005.

-9-
Ongoing Programs Ongoing programs that help to promote successful neighborhoods can also improve the feasibility of TOD. For example, the University of Pennsylvania study mentioned above found that homes located in areas with Business Improvement Districts (BIDs) were worth 30 percent more than homes in other areas, because neighborhoods with successful neighborhood-serving business districts are more desirable to live in. Programs such as the Livable Communities Program can also help to support quality neighborhoods and provided needed urban amenities that can increase revenues for TOD. Impact on Development Feasibil i ty in the Current Market
Strategic Economics conducted a financial analysis to illustrate how the presence of transit and TOD-supportive policies can improve development feasibility and make higher-density development more profitable for a developer. The analysis considers the impact of a combination of increased project revenues and reduced development costs, focusing on the range of building types shown previously in Figure 2. The costs and revenues in the “baseline scenario” (i.e., current market conditions) are compared to the costs and revenues under a “TOD scenario” that can achieve higher revenues and benefit from reduced development costs.
Revenue Assumptions
As described above, the presence of transit and TOD supportive planning, “placemaking”, neighborhood-serving retailers, and infrastructure and access improvements can all have positive impacts on project revenues. Figure 4 shows the impact of a 20 percent revenue premium – in this case, 20% higher rents - on the range of building types, on a per-unit basis (the value generated by one unit within the building). This revenue increase could result from a combination factors described earlier in the memo, such as corridor improvements, pedestrian and bike improvements, streetscape and other “greening” efforts, or other neighborhood amenities.
Revenues in the analysis are calculated assuming all development consists of rental apartments. The baseline value is based on average current market rents. The total value per unit, or “revenue”, is calculated using a capitalization rate. It should be noted that the average size of a townhome unit is assumed to be larger than other building types, and therefore per-unit revenues are higher.
Development Cost Assumptions
Policy tools can help to reduce development costs in a variety of ways, including shortening the timeframe for development by facilitating project entitlements, funding needed infrastructure, and assisting with land acquisition. Reduced parking requirements are one of the most widespread mechanisms used by local governments to promote TOD – and also one of the most effective. The analysis considers the impact of reducing parking from two spaces per unit to one. It also incorporates assumptions about how reductions in parking can result in greater development potential, as space that would otherwise be used for parking is “freed up” for additional housing units.
Figure 5 shows the impact of reduced parking on the development costs for different building types, on a per-unit basis. The figure compares the average cost of a unit of each building type (including parking) in the current market (the “baseline” scenario), to the per-unit cost of each building with a reduced parking ratio. The development costs include all costs to develop a building, including land costs, construction costs, and “soft” costs such as building permits, fees, legal costs and marketing. Changing the parking requirement results in a significant reduction in costs for all building types, but the impact is greater for building types with more expensive parking types, such as a parking structure or podium garage.

FIGURE 4PER UNIT VALUES ‐ IMPACT OF 20% REVENUE PREMIUMRental Units
$0
$50,000
$100,000
$150,000
$200,000
$250,000
$300,000
Townhome,surface pkg
Townhome,garage
Multifamily2‐3 stories,surface pkg
Multifamily2‐3 stories, garage
Multifamily4‐6 stories,podium pkg
Urban block, wrapped
pkg structure
Baseline Revenue Premium
FIGURE 5PER UNIT DEVELOPMENT COSTS ‐ IMPACT OF REDUCED PARKING
$0
$50,000
$100,000
$150,000
$200,000
$250,000
$300,000
Townhome,surface pkg
Townhome,garage
Multifamily2‐3 stories,surface pkg
Multifamily2‐3 stories, garage
Multifamily4‐6 stories,podium pkg
Urban block, wrapped
pkg structure
Baseline Reduced Parking

-11-
Impact on Development Feasibility
In the current real estate market very few projects are able to move forward, in part because developers are finding it very difficult to secure project financing, and also because expected prices and rents are not high enough to compensate for the costs of development. Figure 6 shows the expected relationship between costs and revenues for a range of unit types in the current market (the “baseline” scenario). These are the same revenues shown in the previous chart, but this time they compare revenue costs. As shown, under current market conditions, costs exceed revenues for all building types, which means that all types are infeasible.
Figure 7 shows the combined impact of reduced parking and increased revenue due to the presence of transit. In this scenario, the value of townhome development exceeds the cost to develop it, which means that it would be profitable for a developer to undertake. More expensive building types remain infeasible, however the gap between costs and revenues is considerably reduced.
Figures 8 and 9 show the combined impact for each building, rather than on a per-unit basis. The revenue increase needed to make each of the building types feasible under both the “baseline” (current market) and TOD (increased revenues and reduced costs) scenarios is presented in Table 1. As shown, in the baseline scenario, rents would need to increase between 10 and 66 percent in order to make the building types feasible for a developer to build. Assuming higher rents and reduced parking ratios based on the presence of new transit and TOD-supportive policies, rents would need to increase between 0 and 23 percent.
As rents rise, it is interesting to note the likely sequence of development that could become feasible. Townhomes are the most likely to become feasible in the short term due to their relatively low construction costs. Over time, two- to three- story apartment buildings would also become feasible, followed by apartments built on an urban block. This urban block development type with a wrapped parking structure requires a larger parcel size, a minimum of about 3 acres. The last building type to become possible is a 4 to 6 story building with parking beneath, due to the higher cost of providing podium parking. Therefore, given the constraints of Proposition 207, communities should look to deploy a comprehensive approach to planning for TOD that utilizes a full array of tools to optimize the potential for increasing property values.

FIGURE 6PER UNIT DEVELOPMENT COSTS AND REVENUES ‐ BASELINE SCENARIORental Units
FIGURE 7
$0
$50,000
$100,000
$150,000
$200,000
$250,000
$300,000
Townhome,surface pkg
Townhome,garage
Multifamily2‐3 stories,surface pkg
Multifamily2‐3 stories, garage
Multifamily4‐6 stories,podium pkg
Urban block, wrapped
pkg structure
Development Costs Revenues
FIGURE 7PER UNIT DEVELOPMENT COSTS AND REVENUES ‐ TOD SCENARIO( TOD Scenario = Reduced Parking Ratio + 20% Revenue Premium)Rental Units
$0
$50,000
$100,000
$150,000
$200,000
$250,000
$300,000
Townhome,surface pkg
Townhome,garage
Multifamily2‐3 stories,surface pkg
Multifamily2‐3 stories, garage
Multifamily4‐6 stories,podium pkg
Urban block, wrapped
pkg structure
Development Costs Revenues

FIGURE 8TOTAL DEVELOPMENT COSTS AND REVENUES ‐ BASELINE SCENARIORental Units
FIGURE 9
$0
$5,000,000
$10,000,000
$15,000,000
$20,000,000
$25,000,000
Townhome,surface pkg
Townhome,garage
Multifamily2‐3 stories,surface pkg
Multifamily2‐3 stories, garage
Multifamily4‐6 stories,podium pkg
Urban block, wrapped
pkg structure
Development Costs Revenues
FIGURE 9TOTAL DEVELOPMENT COSTS AND REVENUES ‐ TOD SCENARIO( TOD Scenario = Reduced Parking Ratio + 20% Revenue Premium)Rental Units
$0
$5,000,000
$10,000,000
$15,000,000
$20,000,000
$25,000,000
Townhome,surface pkg
Townhome,garage
Multifamily2‐3 stories,surface pkg
Multifamily2‐3 stories, garage
Multifamily4‐6 stories,podium pkg
Urban block, wrapped
pkg structure
Development Costs Revenues

TABLE 2REVENUE INCREASE NEEDED TO MAKE DEVELOPMENT FEASIBLEBaseline and TOD Scenarios
Townhome, surface pkg
Townhome,garage
Multifamily2‐3 stories,surface pkg
Multifamily2‐3 stories, garage
Multifamily4‐5 stories,podium pkg
Urban block, wrapped
pkg structure
Increase in Revenues Needed to Make Project Feasible
Baseline Scenario 13% 10% 45% 51% 66% 50%
TOD Scenario 0% 0% 16% 16% 23% 14%
Rent per SF Needed to Make Project Feasible
Baseline Scenario $1.47 $1.43 $1.88 $1.96 $2.15 $1.95
TOD Scenario $1.30 $1.30 $1.51 $1.51 $1.59 $1.48
Source: Strategic Economics and EPS.

Next Steps to Promote Transit-Oriented Development in Metropolitan Phoenix
United States Environmental Protection Agency

Next Steps to Promote Transit-Oriented Development in Metropolitan Phoenix Background After years of waiting for the right opportunity, Metropolitan Phoenix found an appropriate alignment of political will, funding, consumer interest, and support from the development community to encourage the approval and construction of light rail.. In this decade, the country has seen several rail systems open – in Houston, Charlotte, and the Twin Cities – with many others in the planning stages. As the largest city in the country without a rail transit system, Phoenix had been waiting for this service. According to METRO, the light rail served an average 30,600 riders per day during January 2009, 15% the amount projected during planning phases.1 In April 2009, the average daily ridership was over 37,000. METRO anticipates that these figures can be maintained and increased as the system matures and continues to grow. Yet, in order to maintain interest and ridership, strategies need to be developed and implemented to continue to spur investment in transit oriented development through public policy and incentives. The purpose of this project is to create the system for success by aligning public policies with land use incentives to encourage development around transit stations, thereby increasing ridership and keeping the system viable over the long term. Through the U.S. Environmental Protection Agency’s (EPA) Smart Growth Implementation Assistance Program, the cities of Phoenix and Mesa, along with METRO, applied for assistance to encourage transit-oriented development (TOD) while considering constraints associated with Private Property Rights Protection Act (Proposition 207) passed by the voters in 2006. In its most basic form the definition of TOD is intense, comprehensive development around transit stations. The 2002 publication, Transit Oriented Development: Moving from Rhetoric to Reality explores how to define TOD in the 21st century including a focus on location efficiency, value recapture, livability, financial return, choice and efficient regional return.2 A team of national smart growth experts, including Strategic Economics, Community Design and Architecture, and Reconnecting America, worked with staff from Phoenix, Mesa, and METRO. Other partners included the Urban Land Institute Arizona, the Phoenix office of Local Initiatives Support Corporation, the Sonoran Institute, Gammage and Burnham, and the Lincoln Institute for Land Policy. This project, at its core, is about promoting TOD. Of course, with the Center for Transit Oriented Development represented in this project through Strategic Economics and Reconnecting America, the analysis conducted for this project benefited from a comprehensive archive of all things TOD. While this project sought to help the Phoenix metropolitan region promote TOD, as with all Smart Growth Implementation Assistance projects, the results and lessons learned are
1 Metro News Release, February 18, 2009 http://www.valleymetro.org/images/uploads/lightrail_publications/090218_January_ridership_nr.pdf 2 Belzer, D. and Aulter, G. Transit-Oriented Development: Moving from Rhetoric to Reality. The Brookings Institution Center on Urban and Metropolitan Policy, June 2002. p. 8-16. http://www.reconnectingamerica.org/public/display_asset/bestpractice021
1

broad enough to be applied to communities all over the country. In fact, any city or region that currently has a transit system could benefit from the products that have been produced. Any city or transit system can go through the matrix in the Strategic Package of Tools and determine the viability of each tool for their existing conditions. Each tool is described, along with the conditions needed to apply it and the conditions affecting its expected value, so that a range of communities can benefit. These places will experience varying results, which is to be expected. Other products from this project, including the Case Studies and the Impact of TOD and Smart Growth Incentives on Development, could be valuable to communities around the country as well. To address the parameters of encouraging TOD in metropolitan Phoenix, the project team (including the EPA expert team and local contacts) created four distinct products that address various issues raised in this work. These are:
• TOD in Phoenix and Mesa: Developing a Policy Toolbox for the Post-Proposition 207 Environment;
• Strategic Package of Tools to Promote TOD in Metropolitan Phoenix;
• Encouraging TOD in Metropolitan Phoenix: Case Studies that Work; and
• Impact of TOD and Smart Growth Incentives on Development in Phoenix.
Each of these sections provides a building block to establish and maintain the light rail in Phoenix. The ideas discussed in each of the sections are primarily intended to address issues related to the Phoenix metro, but also can be used as examples and best practices for application in communities around that country that are trying to promote TOD. Communities that use these reports should be encouraged to use these in cooperation with the private sector to better understand the tools that can be used and how each stakeholder can benefit from the application of these resources. In April 2009, the city of Phoenix hosted a workshop to review these project components. Over four days, the expert and local teams met with a variety of stakeholders, including the mayor and city council members, municipal staff, and developers. The aim was to get feedback from these stakeholders about methods for encouraging TOD and to assess the most effective strategy for creating public policies that support these methods. In particular, the team wanted to find out what tools could be implemented to promote TOD and what roadmap or strategy decision-makers could follow to achieve successful implementation. This memo provides some ideas for next steps to encourage TOD around light rail stations. Description of Stakeholder Roles and Contributions For this project, public and private organizations were brought together to give input on policies and strategies to promote TOD in the Phoenix region. Beyond the partners mentioned above mentioned, this project attracted public and private entities to collaborate with city staff and
2

think about how their work affects not only their organizational objectives, but also the strategies and goals of other organizations. At the beginning of the workshop, the city council was viewed as the agenda setter for policy. The mayor and city council identified their priorities for encouraging TOD and suggested a process for its adoption, such as focusing resources toward station area planning. Prioritizing actions tells city staff and other stakeholders how and where to devote time and resources, including identifying the tools that will promote incentives for transit. Based on direction from the city council, staff conducted a training session with the EPA team to discern the viability of TOD tools given market conditions, political will and the overall viability of each tool. Staff review of these tools is but one facet of understanding how and to what extent these tools will be effective. Private-sector developers are another crucial component of this work. They contribute by “ground-truthing” the concepts and values that staff have indentified as the incentives for TOD, based on direction from city council. During the workshop, developers wanted to know how they could use tools that have already been offered as solutions along with those being considered. Two other partners contributed to the overall project: the Maricopa Association of Governments and the Smart Growth Interagency Committee (SGIC). Both of these groups provided overarching perspectives that go beyond the implementation of TOD in metropolitan Phoenix and speak to how the metropolitan area will continue to grow. The SGIC brings together different state government agencies. While each agency individually may not focus on smart growth, collectively, the staff who serve on this committee have a strong interest in and influence on smart growth. Their influence can assist in determining how some incentives can be coordinated with other resources. Tools for Promoting TOD During the workshop, each stakeholder group was asked to designate the tools they felt were most viable for the implementation of transit–oriented development around the metropolitan area. While the sample size was small, the results did indicate the priorities for each stakeholder group. Workshop participants were asked to rate 23 tools described in the Strategic Package of Tools for TOD in Metropolitan Phoenix section of this report based on how effective the tools would be in implementing TOD in the region. The scale for the rating was: 1= Problematic, 2 = Not Useful, 3 = Neutral, 4= Somewhat Useful, 5= Essential. Exhibit 1 shows the average rating for each tool. Exhibit 2 shows how the results differed among the stakeholder groups. Although the response rate among participants in the technical workshop was low, some results can be gleaned from the survey. For example, the three developers who completed the survey all rated “Capital Funding for Infrastructure” and “Tax Increment Financing” as “Essential,” while these tools received an average “Somewhat Useful” rating from other participants. The city staff, consultants, non-profit representatives, and elected officials all rated “Strategic TOD Planning” and other land use-specific policy tools as the most effective.
3

4
Exhibit 1 Elected officials and city staff believe that the way to ensure the viability and stability of TOD is to start with planning. During the workshop, other types of planning and visioning tools were described as tools for providing a framework for future development investment. Incentives related to taxes and tax packages tended to have less support than other tools. To maximize the effectiveness of tax tools, staff and elected officials could consider launching an education campaign regarding their use.
Business District Association or Business Improvement Districts
Façade and Site Frontage Improvement Program
Streetscape and Pedestrian/Bike Improvements
Community Development Corporation Initiatives
Buying Available Parcels in the Open Market
Reduced Impact Fees in Station Areas
Station Area Plans & Market Studies
Land Use Standards Enhancement
Capital Funding for Infrastructure
Fast Track Development Review
Livable Communities Program
Land Acquisition Loan Funds
Regional TOD Strategic Plan
Citywide TOD Strategic Plan
Joint Development Program
Land Use Intensity Tools
Tax Increment Financing
Station Area Rezoning
Housing Trust Funds
Tax Exempt Bonds
Tax Abatement
Marketing Plan
Parking Tools
Average Rating of 23 TOD Tools(1 = Problematic to 5 = Essential)
0 1 2 3 4 5
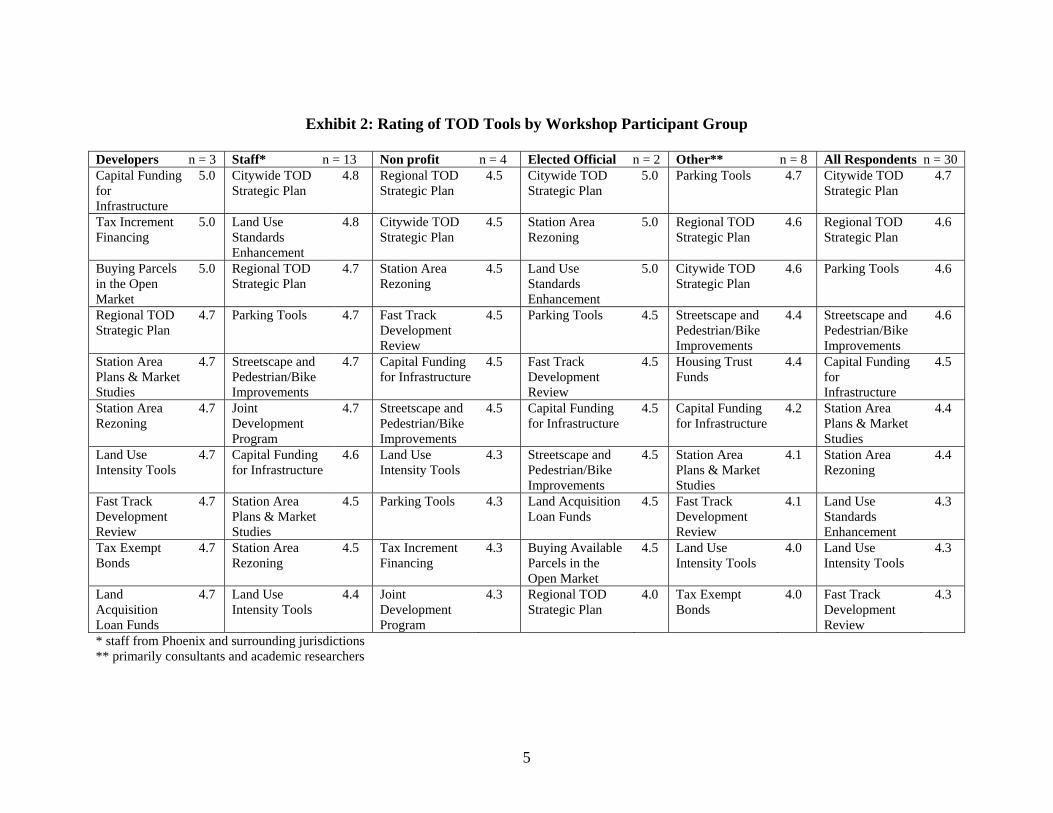
5
Exhibit 2: Rating of TOD Tools by Workshop Participant Group
Developers n = 3 Staff* n = 13 Non profit n = 4 Elected Official n = 2 Other** n = 8 All Respondents n = 30 Capital Funding for Infrastructure
5.0 Citywide TOD Strategic Plan
4.8 Regional TOD Strategic Plan
4.5 Citywide TOD Strategic Plan
5.0 Parking Tools 4.7 Citywide TOD Strategic Plan
4.7
Tax Increment Financing
5.0 Land Use Standards Enhancement
4.8 Citywide TOD Strategic Plan
4.5 Station Area Rezoning
5.0 Regional TOD Strategic Plan
4.6 Regional TOD Strategic Plan
4.6
Buying Parcels in the Open Market
5.0 Regional TOD Strategic Plan
4.7 Station Area Rezoning
4.5 Land Use Standards Enhancement
5.0 Citywide TOD Strategic Plan
4.6 Parking Tools 4.6
Regional TOD Strategic Plan
4.7 Parking Tools 4.7 Fast Track Development Review
4.5 Parking Tools 4.5 Streetscape and Pedestrian/Bike Improvements
4.4 Streetscape and Pedestrian/Bike Improvements
4.6
Station Area Plans & Market Studies
4.7 Streetscape and Pedestrian/Bike Improvements
4.7 Capital Funding for Infrastructure
4.5 Fast Track Development Review
4.5 Housing Trust Funds
4.4 Capital Funding for Infrastructure
4.5
Station Area Rezoning
4.7 Joint Development Program
4.7 Streetscape and Pedestrian/Bike Improvements
4.5 Capital Funding for Infrastructure
4.5 Capital Funding for Infrastructure
4.2 Station Area Plans & Market Studies
4.4
Land Use Intensity Tools
4.7 Capital Funding for Infrastructure
4.6 Land Use Intensity Tools
4.3 Streetscape and Pedestrian/Bike Improvements
4.5 Station Area Plans & Market Studies
4.1 Station Area Rezoning
4.4
Fast Track Development Review
4.7 Station Area Plans & Market Studies
4.5 Parking Tools 4.3 Land Acquisition Loan Funds
4.5 Fast Track Development Review
4.1 Land Use Standards Enhancement
4.3
Tax Exempt Bonds
4.7 Station Area Rezoning
4.5 Tax Increment Financing
4.3 Buying Available Parcels in the Open Market
4.5 Land Use Intensity Tools
4.0 Land Use Intensity Tools
4.3
Land Acquisition Loan Funds
4.7 Land Use Intensity Tools
4.4 Joint Development Program
4.3 Regional TOD Strategic Plan
4.0 Tax Exempt Bonds
4.0 Fast Track Development Review
4.3
* staff from Phoenix and surrounding jurisdictions ** primarily consultants and academic researchers

Next Steps Based on the workshop and input from stakeholders, the team developed some next steps that local partners can consider to help encourage TOD in the region. These next steps are presented as options for consideration; decisions about implementation are solely up to elected officials and staff from Phoenix and Mesa. Potential next steps include: During the course of the project, the project team and local stakeholders developed a list of 23 tools and incentives that could be implemented in Phoenix and Mesa as well as other communities. Examples include: parking reductions in the downtown; draft station area plans; and TOD Overlay District design standards. Education and outreach is an important, over-arching tool that was not specifically analyzed by the expert team. There was consensus during the workshop that developers, other staff beyond those that attended workshop meetings, and the general public could benefit from informal and formal education. Staff at the cities and METRO could increase its focus on training and information exchanges to help developers and the public better understand how development decisions are made. Also, staff could put together a briefing on the topic of Proposition 207 and the promotion of transit-oriented development or a “tools roadshow” for interested parties in the metropolitan region or throughout the state. The goal is to demonstrate the benefits and features of TOD to constituents. With more education about TOD, more informed voices will create further demand and opportunities for increased enhancement of development around transit stations. Successful implementation of tools that promote TOD in Phoenix will require collaboration. Building partnerships with both usual and unlikely partners will help spur interest and support for the light rail and for development projects around key stations. Staff from several cities that are not on the current or future light rail alignments attended the staff training session to learn more about TOD and the tools that are available to them, even if their transit system is focused around buses rather than light rail. The tools presented in this project primarily addressed issues associated with light rails transit stations, yet, many of these tools can be applied to bus routes, more as strategies for development of transit corridors versus specific nodes. The state—especially the Smart Growth Interagency Committee—could provide important leadership for specific tools and initiatives. Another step worth considering is increasing capacity for implementation. Before this project began, the cities of Phoenix and Mesa were using a variety of tools to encourage TOD. The tools used locally were evaluated and discussed in Strategic Package of Tools to Promote TOD in Metropolitan Phoenix (a section of this final report). These tools were being used to spur development at key stations appropriate to its location, such as downtown stations along Central Avenue with a range of office and housing options or restaurants and entertainment uses near Chase Field. Currently, the city of Phoenix promotes transit-oriented development through its two zoning overlay districts, TOD 1 and TOD 2. These overlays provide a zoning structure to encourage uses appropriate for higher densities and a structure for encouraging pedestrian friendly uses and design standards that can make the foundation of successful TOD. Higher densities and a mix of uses are the foundation of a successful TOD.. According to staff at
6

METRO and the city of Pheonix, the most viable implementation tools are “Fast Track Development Review” and “Capital Funding for Infrastructure.” Staff would need to determine how to incorporate these tools with other implementation tools such as joint development, land acquisition and façade improvement that have been found to be effective in other markets. Next, institutionalization of programs and incentives that support TOD can assist advocates in ensuring that demand is realized and that capacity to accommodate TOD exists. Support for TOD incentives and promotion of policies that encourage developers and property owners to understand that TOD is the preferred development model is needed. This step would require local staff to serve as “circuit riders,” going around to different partners and providing information, training, and leadership to interested cities and organizations. This consistent checking-in with partners and educating them about current and projected trends will ensure that innovative TOD practices will continue to be at the forefront of the development conversation. The more communities understand how these tools can be used, the better the prospects for TOD will become. Taking the steps described above can help make transit-oriented development successful. To provide a comprehensive framework for implementation, communities might consider the adoption of form-based codes to create a regulatory framework to encourage the type of development appropriate for station areas. Form-based codes do not dictate or regulate the land use; rather, as the name implies, the code designates the building forms that are most appropriate for the area. For example, downtown stations might have higher building densities that those stations in industrial areas along Washington Street closer to the airport. Not designating land uses could ameliorate any tension that might exist with respect to Proposition 207 due to property owner’s perception regarding the value of their land under different policy scenarios.. A secondary purpose of this smart growth implementation assistance project is to provide ideas about how to promote TOD for the extensions of the light rail system. In other words, city staff wanted to address the need that all planning for future extensions incorporates the most current Federal Transit Administration (FTA) guidelines for land use and cost effectiveness. During the course of the project, this issue was addressed with representatives from FTA. The section of this report called TOD in Phoenix and Mesa: Developing a Policy Toolbox for the Post-Proposition 207 Environment includes a discussion about the FTA New Starts evaluation process. Specifically, while future TOD near station areas is no longer counted toward the ridership projections that underpin the cost-effectiveness calculation, TOD policies still play an important role in the rating criteria. FTA’s land use criteria are addressed through a complement of TOD-promoting tools and incentives. Future consideration could be given to ensure that the TOD goals for metro Phoenix are in sync with FTA’s objectives.
7

Next Steps Lessons and Directives What are the key lessons for these next steps?
• Through this project the team learned that Proposition 207 is not the impediment that many thought it would be when it was passed in December 2006. However, it must be considered carefully because the impact of its passage and application creates questions about how best to encourage growth and development while protecting property values.
• Not every tool will be appropriate at every location, and the tools cannot be effective
without appropriate zoning.
• It will be important to keep partners informed about how TOD in the Phoenix area is evolving. The issue of affordable housing is important across the country. While this project did not directly address affordable housing, the application of TOD tools needs to consider how affordable units will be encouraged at stations throughout the system. LISC, Arizona APA and Urban Land Institute were all involved in this project to ensure that local planning, housing and community development issues are considered throughout this project. Their input should be incorporated into future public policy.
• The cities can also use existing resources in new ways. For instance, the city of Phoenix’s
property database could help staff better understand where opportunities exist for TOD investment. Prioritizing these sites could help the city use its resources more effectively as developments come online.
• The cities could set up corridor working groups with staff, developers, and other
interested parties to discuss and map out how development tools would be used, consistent with the goals in the cities’ strategic planning processes. These groups could consider existing developments and the appropriate scale and intensity of development as they work on additional planning for the station area.
• The existing municipal partnership consists of Phoenix and Mesa, but reaching out to
include Tempe in the partnership could be very helpful. Tempe’s location on the light rail line is critical for the long-term success of TOD in the region. When the cities present a united front to promote these tools and encourage TOD, the incentives and the private sector response to them will be stronger.
Near-Term Market Success Near-term successes can be extrapolated from the work that has already been accomplished and can guide other efforts that could be addressed in a short timeframe. Furthermore, the lessons learned from these successes can be applied to other communities around the country that are trying to implement TOD.
8

First, the data and support provided in the various sections of this report can be applied to the successful TOD projects at Roosevelt, Montibello, and other demonstration projects. These projects have illustrated how tools and incentives can both encourage TOD and work within the confines of Proposition 207. The Strategic Package of Tools to Promote TOD in Metropolitan Phoenix itself represents a near-term market success because of the depth and breadth of tools examined. While these ideas were culled from national experts who reviewed what is working in cities across the country and has national application for TOD implementation, this resource was specifically designed for Phoenix. This type of summary of TOD tools does not exist anywhere else, and it could serve as the model for what to consider as a starting point for TOD implementation. Communities around the nation could implement and support TOD by applying these tools, adapting them to fit local needs and to appeal to local stakeholders. Beyond the resources of tools and incentives, another important area of consideration is the location of the station. Specifically, the half-mile radius around a station provides a critical view of not only existing conditions, but the potential for build-out based on what the market can support. Success lies with understanding this potential, as the city of Phoenix does, and aligning policies to ensure that this potential is met. Phoenix, Mesa, and METRO understand what to promote in many station areas along the alignment. Matching the market analysis with specific tools can spur the projected growth. The cities and METRO could start this process by revisiting the station area plans to compare what had been planned with the potential for the station. A final topic that has resonance in this conversation is the impact of access improvements. For this component, a near-term success would be gathering the information that is needed to determine what improvements are necessary to increase the value and performance of specific sites. Access improvement strategies cover various access types: urban, urban with parking, multimodal, multimodal-auto reliant, and auto dependent.3 Categorizing stations by these access types and designated strategies and tools that fit these objectives will assist in the development of this concept and ultimately will help make these stations successful. Environmental Benefits The benefits of TOD can be described as social, community, fiscal, health as well as environmental. Quality of life is typically regarded as a good marker for benefits related to TOD. Living in a neighborhood that allows one to drive less and walk, bike and use public transit more increases physical activity and offers a safer living environment. As such, TOD is regarded a promising approach to providing a more livable and sustainable future. Other benefits, which tend to be more specific, can include reduced road expenditures, preservation of open space, and lower parking costs are generic to any program that reduces sprawl and automobile usage, and more specifically, VMT (vehicle miles traveled). A recent California study of TOD has measured some additional impacts. Here we highlight those that contain a specific environmental benefit. For instance, the study claims that TODs can 3 TOD Decision-Making: One Size Does Not Fit All, presentation at New Partners for Smart Growth Conference, February 7, 2008 http://www.smartgrowthonlineaudio.org/np2008/026-b.pdf
9

help households reduce rates of greenhouse gas emissions by 2.5 to 3.7 tons per year for each. Because of its location, design, and density the Uptown District TOD in San Diego was estimated to have 20% less emissions per household compared with households in nearby developments.4 A similar study could be undertaken in metropolitan Phoenix to illustrate similar figures. Other studies suggest that residents in a pedestrian friendly community walked, bicycled, or rode transit for 49% of work trips and 15% of their non-work trips, 18- and 11-percentage points more than residents of a comparable automobile oriented community. Finally, a study found that in metropolitan areas with TOD households near transit stops own an average of 0.9 cars, compared to an average of 1.6 cars in the metro regions as a whole. Also, only 54% of residents living in TOD’s commute by car, compared to 83% in the regions as a whole.5 Conclusion Transit spurs development, and development spurs transit. The interconnection is apparent in transit-rich communities like New York, Chicago, and San Francisco. Places like Charlotte, North Carolina; Salt Lake City, Utah; Richmond, Virginia; and now Phoenix are making transit work for them. This project started with a question about viability—that is, how robust can Phoenix’s light rail system be when the city needs to consider the rights of private property owners? In other words, will the efforts to assemble the right mix of uses that encourage transit ridership be in concert with the realities of Proposition 207? The truth is that, even in a down market, there are positive signs that show that transit and the land uses that support it are brimming with life. The areas around the light rail stations provide transit options, increase access to affordable housing, create distinctive and attractive places, and deliver environmental benefits through compact development. The opening of the light rail in December 2008 represents a new era for what is possible in the Phoenix region. People are getting out of their cars, experiencing the corridor on foot, and discovering the benefits of living and working near transit. The agenda and charge for moving forward is clear. Key local staff and stakeholders, including elected officials, have realized the benefits of investing in transit. This report provides options for how to turn those investments into long-term solutions.
4 Parker, T, Arrington, G., McKeever, M, and Smith-Heimer, J. Statewide Transit-Oriented Development Study: Factors for Success in California. Sacramento: Department of Transportation, 2002, p. 94-95. 5 New Tools for Building Wealth: Linking Affordable Housing to Transit, PowerPoint presentation , Accessed November 10, 2009, http://www.reconnectingamerica.org/public/show/newtoolsppt
10