transit-oriented displacement? the san jose flea market
TRANSCRIPT

Transit-Oriented Displacement?The San Jose Flea Market and the Opportunity Costs of Smart Growth
The Center for Community Innovation (CCI) at UC-Berkeley nurtures effective solutions that expand economic opportunity, diversify housing options, and strengthen connection to place. The Center builds the capacity of nonprofits and government by convening practitioner leaders, providing technical assistance and student interns, interpreting academic research, and developing new research out of practitioner needs.
University of California Center for Community Innovation316 Wurster Hall #1870Berkeley, CA 94720-1870
http://communityinnovation.berkeley.edu
May 2011
AuthorsSean Campion and April Mo
Cover PhotosLeft photo - Flickr user Canada Good. Right photo - fleaportal.com

Table of Contents
Chapter 1: Introduction and Background 1Chapter 2: Methods 6Chapter 3: Survey Results and Discussion 8Chapter 4: Transit Village Market Study 19Chapter 5: Recommendations and Areas for Further Study 33Conclusions 36References 37Appendix A 40Appendix B 49Appendix C 51

1
As California’s population continues to expand and places like the Bay Area metropolitan region experience new development pressures, land use and transportation planners, economic development agencies and policy makers must carefully weigh the economic and environmental benefits and costs of growth. If we focus new growth in higher-density developments served by public transit, what might be the impacts of such “smart growth” on low-income households, the racial diversity of communities, and the viability of small or family-owned businesses? In San Jose, the largest city in the Silicon Valley high-tech industry cluster, there has long been pressure to better match housing availability – for workers of all income levels – with jobs availability. Such efforts seek to reduce the time workers must spend commuting to and from their jobs, mitigate the air pollution and global warming effects of such automobile travel patterns, preserve greenfield lands in less urbanized locales, improve quality of life for workers, and prevent worker productivity declines attributable to burdensome commute times. These goals can, however, get buried under the counter-pressures a city faces to retain and expand its job base, while also increasing tax revenue from non-residential developments such as retail power centers or office parks (Elmer et al. 2006).
Toward these multifaceted ends, San Jose has joined a growing number of cities that are experimenting with transit-oriented development around light or heavy fixed-rail transit stations. Over the long run, the city is looking forward to the addition of four new BART stations that will comprise the commuter rail agency’s Silicon Valley extension into Santa Clara County. The first of these four San Jose stations will be built at the site of the current San Jose Flea Market in the Berryessa neighborhood.
The San Jose Flea Market, which celebrated its 50th birthday in 2010, has significant historical, cultural and economic significance to the city, its owners, the surrounding neighborhood, and the customers and sellers that make use of it, many of whom are low- middle-income, immigrant and/or minority residents of the city and region. Although by some measures, the Flea Market could never have been deemed a permanent land use, it has undoubtedly played more than a fleeting role as
a commercial center over its decades-long lifespan. For vendors, it has been an entrepreneurial test ground and a small business incubator (Picazo 2009), and it probably has the highest concentration of small businesses in one location than anywhere else in Silicon Valley (Pizarro 2010). And for shoppers, it offers a wide variety of goods and services, including produce, at low – and in some cases bargainable – prices. It is likely that a significant proportion of Flea Market customers would not be able to afford shopping for comparable items at other, more established retail developments. Following announcement of BART’s plans to place a station at the Flea Market site, the city performed studies pursuant to and produced a plan calling for conversion of the Flea BART station. The city, and the owner-operators of the Flea Market, will need to proceed on these plans with deliberation and thought, and consider the disruptive effects the market’s abolishment or relocation may have on not only the economic well-being of its merchants, employees and patrons, but also on the social fabric of their communities.
This report investigates the cultural, historical and economic role of the Flea Market in the San Jose region, and the possible economic and equity impacts to both sellers and customers of its potential dissolution or relocation. It also discusses the market potential for the future transit village that has been planned for the Flea Market site, and suggests some management and policy considerations in light of the Flea Market’s current performance and possible future shifts of both its economic and land-use contexts.
Historical Background
In 1960, George Bumb opened the San Jose Flea Market for weekends-only business on an abandoned 35-acre cattle lot with 20 sellers. He was in the solid waste/landfill business, where he was witness to the types of things people were discarding, and his flea market idea was inspired by the nascent swap meets in Southern California (The San Jose Flea Market 2010). From the beginning, George Bumb involved his family in the business. They helped to staff the first management office – which also served as a concessions stand for sandwiches, basic beverages and
Chapter 1: Introduction and Background
Photo credit: sfchamber.visitortourist.info.com

2
candy – a Catholic school he built and operated on the Flea Market site from 1978 to 2004, and eventually a jewelry stand near the main entrance of the Flea Market, American Precious Metals (Harper 1999).
Today, the Flea Market comprises 120 acres in total, roughly 80 of which is devoted to two surface parking lots. It now also operates on Wednesdays, Thursdays and Fridays, in addition to the weekends, and averages 300 sellers on weekdays and 1,200-1,500 sellers on weekends. Food op-tions have proliferated to 30 snack bars, kiosks and sit-down restaurants offering both American and ethnic fare, as well as roving motorized snack and beverage (including beer-on-tap) carts. Shoppers now can choose from a wide variety of goods and services on offer, from produce to col-lectibles, from engraving services to massage sessions, and from fine jewelry to home improvement tools. On week-ends, visitors can also enjoy live music performances and children’s rides, and the occasional craft show, health fair or auto display.
The San Jose Flea Market is still family-owned and man-aged under the entity The Flea Market, Inc. More than one hundred full- and part-time service, construction, mainte-nance, security and clerical staff are employed at the Flea Market. Current ownership of the Flea Market is shared among a few of George Bumb’s sons, and other family members continue to own vendor stalls, work at food carts and hold managerial positions with The Flea Market, Inc.
Monthly vendors – those that pay monthly rent for a specific stall that they operate 1-5 days every week – are provided with on-site inventory storage facilities. Daily vendors, who do not have a regular selling schedule, arrive with their wares at the start of the day and rent stalls from on-site management on a first-come first-served basis. Prior to this spring, the Flea Market had “free sell” days only on the first weekend of every month. Now, it appears manage-ment has been experimenting with more free-sell week-ends, as well as free-sell weekdays.
Customer parking fees are $2 on Wednesdays and Fridays, free on Thursdays, and $5 on weekends. Vendors must also pay for parking if they arrive after 8:00 am, regardless of day of the week. Management and security personnel circulate around the market and parking areas to ensure customers are having a safe and enjoyable shopping experi-ence, that vendors are located in their assigned stalls and not engaging in unauthorized sales activity, and that the parking lots are free of illicit activity. On weekends, extra personnel and city police are also dispatched to help direct the traffic of automobiles in and out of the parking lots and main roads.
Public transit access exists currently of four bus lines – op-erated by the Santa Clara County Valley Transportation Au-thority (VTA) – that have stops at or near the Flea Market site. These bus routes provide direct connections between the Flea Market and downtown San Jose (to the southwest),
Eastridge Mall (to the south), Campbell/Los Gatos (to the south), and the Great Mall of Milpitas (to the north).
Institutional Context
The impetus for plans to repurpose the San Jose Flea Market acreage began in August 2000, when Santa Clara County voters approved a 30-year $0.50 transit sales tax to pay for public transit capital improvements, including a BART extension. By 2007, after several iterations, the Santa Clara Valley Transportation Authority (VTA), got approval on the requisite environmental review documents. The designs call for the Berryessa BART facility to feature an at-grade station, parking lots and a parking structure, and new access roads from both Berryessa and Mabury Roads. Under consultation with the Federal Transit Administration (FTA), the VTA applied for New Starts funding, the federal government’s primary financial resource for supporting locally planned, implemented and operated transit infrastructure capital investments.
At the time in 2007, the Bumbs’ flea market land was zoned for agricultural use. When the family learned the VTA will likely need to acquire some of their property, and that the city’s vision was for transit-oriented housing and retail to be built around the station, they decided to apply for a zoning change. One expected outcome of a zoning change is that any acreage the family will need or choose to sell, either to VTA or to a developer, will be appraised at a higher value under a non-agricultural zoning designation than under an agricultural designation. In consultation with the city’s planning staff, the Bumbs pursued amendments to the general plan and zoning ordinance that would change their flea market parcels to Planned Development (PD) zoning. With word spreading that the Flea Market was to be redeveloped into a transit village around a BART station – but with no mention of continued Flea Market operations in any of the site plans or sketches – community-based organizations began efforts to educate and organize Flea Market vendors so as to give them a voice in the decisions being debated in the rezoning process. Citizens for Environmental and Economic Justice was formed as the organizing and public voice entity for the vendors. In partnership with the Hispanic Chamber of Commerce Silicon Valley, this group attempted to establish a Flea Market Merchants’ Association. Although such an association did not formally get off the ground, the partners were still successful in gathering vendors for periodic meetings, arranging meetings between the vendors and city officials, and submitting position statements and requests in the planning process for the Flea Market site’s redevelopment.
At a May 2007 City Council meeting, where the proposed rezoning of the Flea Market site was on the agenda for a Council vote, hundreds of merchants and their supporters showed up to express their concern about a potential shut-

3
down of the market. The City agreed it would do what it could to identify an alternative site for the Flea Market and postponed its vote on the rezoning. Following this meeting, there were additional City Council and Planning Commission meetings, also well-attended by Flea Market vendors and supporters, as well as community meetings hosted by the city and the Bumbs’ development consultant.
Over the course of the following months, various memos were exchanged and resolutions adopted regarding future Flea Market site development. Among these, the Planning department recommended that Flea Market vendors be given 12 months’ notice of any relocation. The mayor and Councilmember Kansen Chu, who represents the district in which the Flea Market is located, also made a series of recommendations for the conditioning of the rezoning approval (Reed and Chu 2007). These conditions included that the Flea Market continue to operate at least until early 2010, that 80 percent of net residential area north of Berryessa Road (i.e., the main parking lot) be under construction before any residential construction begins south of Berryessa Road (where the market is located), that the developer be fully responsible for funding and constructing traffic mitigations related to the project, that there will be regular updates about development activity to the City and the vendors, that new development seek to achieve LEED Silver rating, and that the developer consider the inclusion of affordable housing. Since these were recommendations, it remains unclear which, if any, of them will be fulfilled, especially considering the tepidity of the housing development market currently, which tends to exacerbate the hesitation among lenders and investors to sign onto projects that do not fit the existing mold of a neighborhood.
In August 2007, the City approved the rezoning of the Flea Market site to A(PD), meaning the base district zoning of the property remains agricultural, however the PD zoning authorizes the development of a “mixed use transit village” on the Flea Market parcels. In March 2008, the City approved Master Planned development permits – including for single-family homes – for the acreage north of Berryessa Road. A vesting tentative map permit for the northern parcels was approved in December 2010. The Bumbs began talks with Safeway to anchor the commercial portions of the site, but the discussions never progressed due to the recession. (For a more detailed discussion, see the market study in Chapter Four.)
In November 2008, Santa Clara County voters approved Measure B, a 30-year $0.125 sales tax increment to fund the operations and maintenance of the BART extension, contingent upon sufficient matching state/federal funds. This significantly improved the standing of VTA’s New Starts application with the FTA. In the spring of 2011, the VTA received confirmation of final design phase funding from New Starts, which means utility work and land acquisition can commence, and that the remaining funding needed for project completion is all but guaranteed (Slayer 2011).
Literature Review
To get an understanding of how previous scholars have treated the subjects of open-air markets and transit-oriented development (TOD) – either in combination or as separate topics – we conducted a literature review of books, journal articles, and reports by governmental and non-governmental institutions focused on flea markets and other open-air, public markets and bazaars, as well as transit-oriented development. We sought literature that either directly or indirectly addressed the questions of how flea markets function culturally and economically in a local or regional economy, the prevalence of mixed-use TODs that incorporate flea markets or any other similar retail formats, the effect of new retail development on existing retail establishments, and the impact of retail revitalization projects on low-income and immigrant communities.
Public Markets
Public markets have existed as long as there have been cities. From the agora of Ancient Greece to Paris’ Les Halles to New York’s Union Square Greenmarket, markets have been important civic, social and commercial places within the urban landscape. After falling out of favor during the mid-twentieth century, public markets have recaptured the attention of planners, scholars and activists in recent years. Researchers like Alfonso Morales have written about the role that markets play within urban communities as community and economic development tools, as well as vibrant and vital places. Morales finds that markets contribute to quality of life as “third places” –popular, inclusive gathering places that are located outside of homes and workplaces (Morales 2009).
But markets have other, more tangible benefits as well. Markets provide opportunities for full-time self-employment or supplemental income for vendors, and low-cost consumer goods generate considerable consumer surpluses for low-income shoppers (Morales, Balkin and Persky 1995). From an urban design and development perspective, markets help to activate underutilized or vacant land or draw shoppers to struggling commercial districts. The Project for Public Spaces has found that public markets often act like retail anchors by drawing shoppers not only to the market itself, but to surrounding businesses as well (PPS 2003).
Markets also promote public health and food security by offering fresh, affordable produce in accessible locations (Morales 2009). Particularly in so-called food deserts, public markets can be part of a quick, low-cost strategy to bring food security to underserved neighborhoods. It can also encourage greater linkages within regional economies, especially between rural and urban areas (PPS 2002) and deepen linkages between formerly disinvested neighborhoods and marginalized populations with the formal economy (Morales, Balkin, and Persky 1995).
Markets can generate substantial economic benefits,

4
particularly for low-income, immigrant and minority entrepreneurs, who often lack access to traditional forms of capital. Public markets serve as business incubators for new businesses, allow existing entrepreneurs to experiment with minimal risk, and become a vehicle for individual and family self-empowerment (Morales 2009). They are not merely tools for increasing economic activity in traditionally capital-poor communities; they can create opportunities for upward mobility and asset building (PPS 2002).
Public markets and street vending also provide opportunities for self-employment to workers who face limited employment options in formal labor markets. Valenzuela (2006) argues that self-employment and contingent work, which includes street vending, can best be explained through labor market disadvantage theory. Micro-entrepreneurship and self-employment in informal market activities are often responses to a general lack of opportunity caused by barriers to employment, including disability, ethno-racial or age discrimination, lack of human capital, or undocumented status. Self-employment often requires minimal resources and skills and has low barriers to entry. As a result, many workers, particularly in immigrant communities, turn to self-employment in the face of unemployment, underemployment or irregular, low-paying opportunities in the formal economy (Bates 1997, Ong and Miller 2002, Hum 2006). Employment options for immigrant workers, in particular, tend to be concentrated in specific sectors that are dominated by informal hiring networks (Hum 2006). Particularly within Asian immigrant communities, this concentration often leads to wage suppression and exploitation within ethnic labor markets. Workers in these markets have limited options for employment outside their ethnic communities due to poor English language skills and limited social networks (Zhou 1998, Chin 2003). As a result, many turn to self-employment as a survival strategy.
Light and Rosenstein (1995) argue that these survivalist entrepreneurs can be categorized according to the reasons they turn to self-employment. Value entrepreneurs, the first category, choose self-employment for non-monetary reasons such as pride, the status conveyed by business ownership, or the ability to control their work hours. Disadvantaged entrepreneurs, in contrast, turn to self-employment because it promises higher returns on labor than they would earn in a salaried position. These workers are motivated primarily by economic reasons and limited employment opportunities elsewhere.
Transit-Oriented Development
Higher-density, mixed-use developments that are within walking distance of transit stations and are designed and built to be friendly to non-motorized forms of transport are relatively new and uncommon in the western United States. As early as the 1970s, professionals in the built environment, such as Peter Calthorpe and Andrés Duany, began advocating for more compact cities as an alternative
to the type of sprawling, auto-oriented development that the federal government had theretofore directly and indirectly encouraged through interstate highway construction programs and housing insurance and mortgage underwriting policies. Unlike growth controls or growth boundaries, smart growth starts with the premise that it is unrealistic to deny or indefinitely put off urban growth and instead seeks to implement a range of development and conservation strategies that help protect the natural environment and increase the attractiveness, economic vitality and social diversity of our communities (EPA 2010).
Transit-oriented development (TOD) is a form of smart growth that refines the development strategy as one that aims specifically to boost transit ridership. It locates and designs residences so that they are within a walkable radius (a half-mile is a common benchmark) of the transit station, includes pedestrian and bicycling facilities, and lays out street patterns and parking locations so that they calm or reduce auto traffic. TOD also provides a rich mix of housing and shopping choices, generating revenue for the public and private sectors while creating a sense of place and providing value for both new and existing residents. (CTOD 2010) TOD is to be distinguished from transit-proximate development, in that TOD affirmatively incentivizes walking, biking, transit use as alternatives to driving through design, pricing and/or subsidy strategies, and community and employer programming (Replogle 2003). Most TODs, about 90 percent, are built around and served by heavy, light or commuter rail. Eight percent are served by bus and 1-2 percent by ferry (Cervero 2004). They can be found and built in both central city as well as suburban locations.
Since there are no federal- or state-level statutes dedicated to TODs, and only California and New Jersey have passed official expressions of support for “transit villages” (but with little to no funding or regulatory programs to go along), the actual planning and implementation of TODs occurs in an ad hoc fashion involving local planning departments, economic development agencies, transit agencies, community or business groups, private developers and investors, and in some cases regional transportation commissions (Cervero 2004).
Most research on TODs has focused on questions relating to the effectiveness of such developments in actually reducing auto trips and vehicle miles traveled, plus the potential reductions in greenhouse gases due to changed auto use patterns (for example, Cervero and Kockelman 1997, and Handy 1996). Ewing and Cervero (2010), in a meta-study of literature addressing the nexus between the built environment and travel patterns, found that for TODs, destination accessibility (ease of access from a particular residential location to local or regional trip destinations, which include employment, recreation, shopping, or service centers) and design (street connectivity, site design, and quality of the pedestrian realm) had the highest propensity to reduce vehicle miles traveled.

5
Some studies have also examined evidence on the impact TODs have on nearby real estate values (Bernick et al. 1994, Cervero and Duncan 2002, Song and Knaap 2004). There are many case studies of specific projects, describing the impetus, strategies and funding for, and lessons learned from, TODs (Cervero et al. 1993, Tam 2003, McNeal and Doggett 2007, etc.).
There are far fewer studies or articles specifically addressing the success of retail and commercial components of TODs. Cervero et. al. (1993) identifies demographic, geographical/infrastructural and institutional/regulatory opportunities; as well as economic, political and structural and barriers, to transit-based development in California. Written during a time of economic challenges, it pays special attention to barriers to housing growth, in general, as a prominent factor in the challenges to building at all, much less building in a transit-oriented fashion. In a study where trip mode was the primary concern, Boarnet (2010) finds that in terms of suburban Los Angeles, pedestrian-oriented centers (as opposed to corridors) better promote walking not only because of street layout, but also because of the presence of neighborhood-serving retail and commercial activities. There was still some trade-off for trip modes, however, as the concentration of neighborhood commercial activities in these centers was only economically sustainable by those businesses “importing” customers – and therefore car trips – from residents beyond the quarter-mile-radius pedestrian shed.
Tam (2003) conducts a market analysis and identifies the types of retail – grocery and small neighborhood-serving business – that would do well at a proposed MacArthur BART Transit Village, but her work and recommendations are very specific to the context of that portion of Oakland, Calif. Grady and LeRoy (2006) present and synthesize several case studies of TODs that have provided economic benefits to low-income families and workers, but does not specifically call out the potential for the TOD planning and building process to accommodate or be beneficial for low-income, small entrepreneurs such as flea market vendors (likely because there were no case studies with this specific attribute available).
Thus, to our knowledge there are, so far, no studies that deal specifically with the interaction between TODs and on-site flea markets – or, for that matter, any type of open-air market or bazaar. However we can conclude from what has been studied that the higher the density at a TOD the larger the retail square footage that can be supported, but the trade-off will be that the larger the retail at a TOD the more likely that shoppers will want or need to arrive by car. If the one of the goals of a TOD is to reduce automobile trips, retail should be broken up into smaller, neighborhood-serving tenants, perhaps anchored by a medium-sized grocer or pharmacy. Moreover, a TOD next to the San Jose Flea Market will need to consider its commercial/office tenant mix carefully.
Displacement and Gentrification from New Retail Development
Similarly, there have been few studies on the relationship of retail development and community revitalization more generally, particularly on the question of how new investments affect county- or regional-level retail employment, sales and establishments. Most reports to date have focused on the effects of Walmart on local economies, though these studies have produced mixed results. Neumark et al. (2007) found that the opening of a Walmart has a negative effect on county-level retail employment and earnings, though other researchers have found that the opening of a new Walmart store increases county-level retail employment (Basker 2005).
Theoretically, in the absence of new demand, new retail development may shift economic activity from one center or neighborhood to another without creating a net increase in sales or employment. This can have a positive effect if new stores open in historically low-income communities, particularly in cases in which retailers have disinvested from urban or low-income communities based on imperfect information about their aggregate market spending potential (Porter 1999). If new retail developments are concentrated in middle-income and upper-income neighborhoods, however, low-income communities will continue to lose out on potential sales and property tax revenue, as well as the vital retail services and jobs that newer, more efficient stores can offer.
New neighborhood retail developments also appear to have a strong relationship with the attraction and retention of middle-income households, though it still is not clear whether retail services attract new residents or if retailers respond to patterns of residential change (Chapple and Jacobus 2009). This effect may be explained by the power of retail to shape how existing residents and outsiders perceive certain neighborhoods, both positively and negatively.
Depending on the retail mix, new development projects can also create a sense of “retail exclusion,” in which some populations feel uncomfortable or unwelcome in certain shopping environments. Freeman (2006) found that existing lower-income residents in gentrifying neighborhoods appreciated the arrival of basic retail services like supermarkets and drug stores, but felt marginalized by other retailers that targeted higher-income groups or shoppers from outside the neighborhood. In many cases, these shoppers will turn to informal markets to purchase major items. Even if they would have preferred to shop at a mainstream retailer, these consumers choose informal markets based on price, inaccessibility, or linguistic and cultural barriers (Williams and Windebank 2002).

6
Photo credit: fleaportal.com
The initial purpose of this report was twofold: characterize the economic and social importance of the San Jose Flea Market for its vendors and customers, and analyze the impacts on these groups of the proposed BART extension and a possible transit village development directly on the Flea Market site. More than halfway into our research and analysis period, the Bumb family informed us, the Hispanic Chamber of Commerce of Silicon Valley and other community and business groups that they had no foreseeable plans to shut down or relocate the Flea Market. Citing the family’s attachment to the Flea Market, the difficulty of finding affordable land parcels of adequate size in the region, and the expectation that the market’s business would rebound and flourish with the completion of the BART station, spokesperson Theresa Bumb explained the Flea Market is, for the time being, “not going anywhere” and that the management team was working on ways to better communicate these intentions more widely.
Given these changed circumstances, it became logical and necessary to shift our research and analysis focus somewhat. The methods overview presented here accounts for this reorientation and can be represented by the following two overarching research questions:1. Who are the users and beneficiaries of the San Jose Flea Market and what is the social, cultural, historical and economic importance to them of the market?2. What is the near-term feasibility of the transit village development proposed for the Flea Market site, and if there are no foreseeable plans to cease or move the Flea Market what can be done to improve its attractiveness as a future BART-accessible destination?
Research Design and Objectives
Our research tasks are categorized by which of the above questions they address.
Research Question 1
To produce and collect the data for this question, we executed three tasks:a. Survey of Flea Market customersb. Survey of Flea Market vendorsc. Interviews with the land-owning family, community and business groups, city and VTA officials, and scholars of open-air markets.
For the survey of customers, we gathered 277 responses to a 15-item questionnaire administered on-site during a weekend in November 2010. The questionnaire asked customers about their mode of travel to the Flea Market, their shopping habits, their attitudes about the Flea Market, and some demographic information. Professional and academic colleagues, as well as personal friends, helped us to translate the survey into Spanish, Vietnamese and (Mandarin) Chinese. We hired seven UC Berkeley undergraduate students as work-study research assistants, each with the ability to speak a language other than English. Six of these assistants worked with us on the surveying weekend to gather customer survey responses via in-person interviews. The seventh assistant coded the survey responses into a database. (See Appendix A for a copy of the questionnaire as well as an in-depth discussion of the survey methodology.) We shared the results of the customer survey with the Bumb family in early 2011.
The survey of vendors also used a written questionnaire, but it served as more of an “interview script” to facilitate more loosely structured conversations with vendors. The written interview script contained questions intended to gauge their motivations for going into flea market vending, logistical and economic characteristics of vendors’ operations, their relationship with the city and regulating agencies, and their awareness of and opinions about the impending Berryessa BART station and development. Over three visits during the Spring of 2011, we completed 29 interviews with different vendors by visiting them onsite and engaging them in open-ended conversations conducted in their first language (English, Vietnamese, Spanish or Cantonese). As a result, the vendor interviews were much less structured – and thus longer in duration for each respondent – than the customer surveys. (The following chapter discusses the results of both surveys. See Appendix A for methodological details on the surveys.)
We have conducted in-person or telephone interviews with Theresa Bumb; VTA, San Jose Planning, San Jose Economic Development and San Jose Department of Transportation staff; Councilmember Kansen Chu; Dennis King of the Hispanic Chamber of Commerce of Silicon Valley; Alfonso Morales, urban planning faculty and flea market researcher at the University of Wisconsin, Madison. These interviews
Chapter 2: Methods

7
covered topics like updates on plans (relating both to the Flea Market redevelopment and to the BART extension project), how the plans inform the city’s vision for future housing and economic growth, opinions on the viability of continued Flea Market operation, and the impact the current economic recession has had on plans and timelines.
Research Question 2
To ascertain the near-term feasibility of the transit village development proposed for the Flea Market site, we conducted an analysis of the market potential for the single-family attached housing and commercial/office mixed use planned for the site, particularly on the north side of Berryessa Road. This market analysis effort, presented in Chapter Four, gathered pertinent demographic and economic information about the Berryessa neighborhood and surrounding region, referenced the development plans that have been detailed and approved for the transit village, and synthesized market information provided by the real estate industry.
Finally, in light of the feasibility of transit village develop-ment plans, and the Bumb family’s decision to keep the market in operation where it is, we developed a set of recommendations. These are informed by the customer and merchant surveys, onsite observations at the Flea, conver-sations with the varied stakeholders mentioned above and insight from writings about other flea markets or informal, open-air markets. The recommendations are broken down
into sections for the Flea Market’s management, the City of San Jose and the merchant population at the Flea.
This analysis will ultimately feed into a set of recommenda-tions that Urban Habitat can use to advocate in favor of a more inclusive TOD project that will be a win-win prospect for all parties, including the land owners, potential master developers, the City of San Jose and the Flea Market’s cus-tomers and vendors.
Urban Habitat is a partner in the Great Communities Collaborative (GCC), which supported this research project. The Great Communities Collaborative is a cooperative partnership of four Bay Area non-profit organizations – Greenbelt Alliance, the Nonprofit Housing Association of Northern California, TransForm, and Urban Habitat – and the national organization Reconnecting America that is dedicated to ensuring that the San Francisco Bay Area is made up of healthy, thriving neighborhoods that are affordable to all and linked to regional opportunities by a premier transportation network. The GCC is supported by foundation partners, including the San Francisco Foundation, the East Bay Community Foundation, the Silicon Valley Community Foundation. The partnership also works with UC Berkeley’s Center for Community Innovation, which provides technical assistance to support Bay Area non-profit and government organizations address housing, community and economic development problems.

8
Photo credit: Flickr user Canada Good
Customer Survey
We conducted a survey of the Flea Market customers because we wanted to know who they were, why and how they used the Flea Market, and the level of awareness an anticipated utilization patterns among them of the future Berryessa BART station. Here we present the most relevant results from the customer survey. Complete details about the survey, including the questionnaire itself and all results data, can be found in Appendix A.
Some of the results from the customer survey aligned with our expectations about shoppers of the San Jose Flea Market. The first of these is that, given the limited nature of public transit serving the Flea Market site, and the preponderance of surface parking, we were not surprised to find that only five percent of weekend shoppers accessed the market via a non-auto mode. Since surveyors were located inside the market, however, the sample may have underrepresented shoppers who arrived by public transportation. Secondly, produce and apparel ranking as the top two categories of goods for which shoppers visit the Flea Market also made sense, given the central and prominent location of Produce Row stalls, and the large number of vendors either focused on selling or mixing into their wares clothing, shoes, handbags, jewelry and watches, sunglasses and other personal accessories.
Who the Customers Are
Seventy-eight percent of shoppers self-identify as Latino (or Hispanic), a very high share compared to the share for the City of San Jose as a whole, 31.5 percent.1 The proportion is also much higher than that of the residents of the Berryessa neighborhood, which stands at about 12 percent (see Chapter Four).
When asked where they lived, those responding with
1 American Community Survey 2005-2009 Five-year Estimates
ZIP codes in San Jose made up approximately one-third of all responses. Including other Santa Clara County, San Mateo County and some Alameda County cities captures a much more convincing majority of Flea Market shoppers. Another notable finding is that in 2000, the share of Latino residents relative to the total population within these ZIP codes was 29.9 percent, less than half the rate found in our sample of Flea Market shoppers. This suggests that even though the Flea Market is a regional attraction, it currently serves specific ethnic niches within the Bay Area retail market.
Q13. How do you identify your race or ethnicity? Ethnicity Responses Share Latino 215 78% Asian 20 7% White 18 7% Other 14 5% African-American/Black 5 2% Non-response 2 1% Total 274 100% Q11. What is the ZIP Code where you live? City Responses Share San Jose 103 38% Hayward 14 5% Redwood City 11 4% Mountain View 7 3% Salinas 7 3% Fremont 6 2% Newark 6 2% East Palo Alto 5 2% La Selva Beach 5 2% Greenfield 4 1% Milpitas 4 1% Pleasanton 4 1% Santa Clara 4 1% South San Francisco 4 1% All Others 65 24% Invalid 24 9% Total Responses 273 100%
The age distribution and household size of the customer base suggests a high ratio of families among the shoppers. While our survey did not specifically ask if the respondents’ household was a family unit, our
Chapter 3: Survey Results and Discussion
Q12. What is your age?
0%
5%
10%
15%
20%
25%
30%
Per
cent
of r
espo
nses
Age

9
observations over several visits to the Flea Market, including visits on weekdays, confirmed the popularity of the Flea Market with families, particularly families with young children.
Q10. How many people live in your household?
0
10
20
30
40
50
60
70
1 2 3 4 5 6 7 8 9 10
Num
ber o
f Res
pons
es
Persons in Household
When asked about household income, a substantial percentage of respondents declined to provide an answer. Among those who did select an answer, more than half had 2009 household incomes of less than $50,000, and one-quarter earned less than $25,000 per year.
Q14. What was the total income from all members of your household in 2009? Income Category Responses Share Less than $25,000 67 24% $25,000-$49,999 74 27% $50,000 - $100,000 39 14% $100,000+ 30 11% Non-response 67 24% Total 277 100%
This indicates a customer base of low- and moderate-income shoppers and is consistent with the finding that a full 67 percent of customers regard price as an important factor in their decision to shop at the Flea Market.
In sum, the customer base of the San Jose Flea Market can be described as predominantly low- and middle-income Latino households that reside outside the Berryessa neighborhood and, in many cases, even outside of San Jose. Given this narrow market niche, it is possible that the many Latino households choose to shop at the Flea Market over
traditional retailers for many reasons, including a unique and affordable product mix, friendly and familiar vendors, the preponderance of Spanish-speaking retail clerks, a unique cultural environment, or a sense of exclusion at mainstream retailers.
Q3a. In terms of the things you shop for, how important is price in your decision to shop here, rather than somewhere else? Share Important 67% Somewhat Important 21% Not Important 12% Not Sure / Don’t Know 0% Total Responses 100% How Customers Use and Regard the Flea Market
On the weekend we surveyed, we found that most shoppers visit the Flea Market with less-than-weekly frequency. It is possible that surveying on a weekday would have resulted in a higher percentage of weekly shoppers, especially since parking is cheaper on weekdays (and with higher frequency visits one could save some money by only going on weekdays) and the crowds are smaller on weekdays (making the shopping experience more convenient for a frequent customer who knows what s/he needs to buy). Q1a. How often do you come to the Flea Market? Frequency Share Weekly 41 15% At least once per month 122 44% Less than once per month 69 25% First time 44 16% Total Responses 276 100%
For many of the respondents we encountered, the value of the Flea Market experience was not only in low prices for goods and services, but also in the opportunity to have a “day out” in a setting that is not easy to find in the Bay Area. As the word cloud figure below indicates, the Flea Market offers a venue where people can bring their children, meet friends, get some fresh air and exercise, and partake in the entertainment or recreational amenities on offer.
Q5. Other than shopping, what else do you enjoy doing at the Flea Market? (open-ended response format) The most common responses were walking, music, people, eating, kids, recreation, food, exercise, performances.
Created with wordle.net

10
The value that many visitors place on the particular atmosphere and experience the Flea Market offers also became apparent when they were asked if they would shop at the site if it were converted into a conventional shopping center. Fifty-eight percent of respondents indicated disinterest or uncertainty about visiting the site if the Flea Market were not in operation.
In fact several respondents chose to elaborate their responses to the above question. Some examples of these include the following:
Probably, but I would rather have it stay the way it is. - Female, 68 I would hate to see the Flea Market go! - Male, 47 Maybe, if the prices [at the shopping mall] are right. - Male, 31 Maybe. But shopping malls are expensive. - Male, 55 No. I’ve been coming to the flea since I was 4, even when I lived in Manteca. There’s so much history and culture here. You come for the socializing, too. And because it’s open-air, it doesn’t feel as crowded as a mall. - Female, 29 I don’t know. There are so many shopping malls already. I wouldn’t need to come this far to go to a shopping mall. -Female, 52
In addition to price, atmosphere and family-friendliness, we also identified that for a majority of customers the distance to the Flea Market from their homes is either “important” or “somewhat important.”
1
Q3b. In terms of the things you shop for, how important is distance from home in your decision to shop here, rather than somewhere else? Share Important 36% Somewhat Important 26% Not Important 36% Not Sure / Don’t Know 3% Total Responses 100% Given responses to the question about distance from home,
it is not surprising that a majority of shoppers also would cease to patronize the Flea Market if it were moved to a location outside of San Jose. Q6. Would you continue to shop at this flea market if it were moved to…?
Yes No Not Sure Total
Another site in San Jose, such as the County Fairgrounds? 58% 23% 20% 100% A site outside San Jose, such as Gilroy? 20% 62% 18% 100% In sum, while low prices are a consideration for Flea
Market shoppers, many of them also value the market for functioning as a unique, quasi-public space that is not replicated in shopping centers or other destinations customers may find closer to home. While they may not visit the market with high frequency, they seem willing to spend longer amounts of time during each visit in order to take advantage of these non-purchasing amenities on offer.
Customers’ Knowledge of and Opinions of Future BART Service
Finally we wanted to gauge awareness of and opinions on expected usage of the Silicon Valley BART extension, particularly the anticipated Berryessa Station.
Almost all respondents knew what BART was, however more than half had never used the system before. Moreover, ridership is not frequent among those who have used the system. This is unsurprising, given the home locations of many respondents in cities to which BART currently does not extend.
When asked if they would use BART to visit the Flea Market once the Berryessa Station is up and running, 57 percent said they would. Moreover, just over half of that group said they would visit the Flea Market more often
Q9. How many people live in your household?
0
10
20
30
40
50
60
70
1 2 3 4 5 6 7 8 9 10
Num
ber o
f Res
pons
es
Persons in Household
1
Q7 & Q8, consolidated
Question Yes No Maybe/
Not Sure Total Have you ever ridden BART? 44% 56% 1% 100% If yes, would you say you ride it frequently? 21% 74% 5% 100% When the station is complete, would you use BART to come here? 57% 30% 14% 100% If yes, would you shop here more often? 58% 26% 16% 100%

11
with a BART station in place. These are higher percentages than the representation of customers’ home cities that are actually served by BART, so it is possible some respondents gave answers they thought were socially desirable rather than ones that reflected the reality of whether their points of origin for trips to the Berryessa Station also had BART stations.
Social desirability bias may also have been in play in the three-part question asking customers about the importance of certain factors in their decision to shop at the Flea Market. Two of those factors – price and distance from home – were already explored above. The third, access by public transportation, had the following response pattern:
1
Q3c. In terms of the things you shop for, how important is access by public transportation in your decision to shop here, rather than somewhere else? Share Important 42% Somewhat Important 9% Not Important 45% Not Sure / Don’t Know 4% Total Responses 100% The split between respondents who thought access to
public transportation important versus those who thought it unimportant was almost right in the middle. Given the data we have already discussed regarding shoppers’ travel mode to the Flea Market, their home locations not being highly correlated convenient transit stop locations, we had expected there would be a higher percentage of shoppers who do not think access to public transportation is important in their decision to shop at the Flea Market. If the respondent ceased thinking only about themselves and their own shopping choices when the word “public” was heard, they may have given the answer that made most sense from a public-welfare point of view (i.e. that access to public transportation is an important option for other shoppers).
The lesson here seems to be that it would be very difficult at this stage to predict with any certainty what the BART usage patterns of Flea Market patrons will be. While most respondents acknowledged the broader benefits of the BART extension, this is not a predictor of eventual mode-shift away from private automobile travel to and from the Flea Market site. The focus of this study is not to estimate such an effect, but a study that did revolve around this question would do well to survey customers on ridership patterns both before and after the completion of the new station (presuming the Flea Market remains where it is up to and beyond the opening of the new station).
Vendor Survey
Our survey results are based on interviews with 29 vendors conducted over the course of three selling days (two Wednesdays, a Friday and a Saturday) in February and March 2011. As shown in the tables below, we attempted to interview a representative sample of vendors by category and ethnicity, in addition to vendors who sell at the Market four days per week versus those who sell only on weekends. Given the scope of our project, we chose to focus only on vendors who sell at the Flea Market year-round, as they will be affected more directly should the Market be displaced by a new development project. As a result, the analysis does not consider occasional or one-time vendors, or those who sell at the Flea Market’s “free sale” days.2 Full results from the survey can be found in Appendix A.
Photo credit: Urban Habitat
To inform our sampling strategy, we compiled an inventory of stalls at the Flea Market by retail category. This inventory is presented in Tables 1 and 2, below. (The inventory counts stalls rather than vendors as a proxy for total occupied square footage. For the full vending census, see Appendix B.) Many vendors occupy multiple contiguous stalls, particularly in the furniture section, where vendors have covered showrooms.
The Flea Market offers a wide range of consumer goods including convenience items like produce and personal care products, which shoppers typically purchase close to home, as well as comparison items like furniture, automobiles and clothing, for which shoppers are willing to travel a greater distance for specialized products or bargain prices. Particularly in produce and apparel, many vendors offer specialty goods that cater to the Latino market. Apparel is the most common retail category at the Flea Market; other major sectors include furniture, produce, household goods, and automotive sales.
2 To stave off competition from Craigslist and Ebay, the Flea Market’s management has begun offering free sale days, in which unused spaces are offered on a first-come-first-served basis to sellers at no charge.

12
Table 1. Inventory of Occupied Stalls Category Spaces Share Apparel 455 43% Furniture 123 12% Food (incl. Produce) 81 8% Household/Home Goods 80 8% Miscellaneous 57 5% Auto Accessories 51 5% Toys 44 4% Personal Care 39 4% Electronics 35 3% Gift 22 2% Tools 21 2% Video Games/Music 17 2% Services 13 1% Plant 10 1% Art 6 1% Luggage 4 0% Pets 2 0% Bicycles 2 0% Appliance 1 0% Car Dealer 1 0% Sporting Goods 1 0% Total 1,065 100%
Table 2. Interview Subjects by Category Category Count Apparel 12 Produce 4 Household Goods 3 Toys 3 Personal Care 2 Furniture 2 Art 1 Electronics 1 The vendors themselves reflect the diversity of San Jose.
Though there is no master list of vendors broken out by ethnicity, it appears that the market is evenly divided between Asian and Latino vendors, with Mexican and Vietnamese being the most common ancestries. It is also notable that even though the Flea Market caters to a predominantly Latino customer base, the vendor population is more diverse.
Table 3. Interview Subjects by Ethnicity Ethnicity Count Latino 11 Vietnamese 11 Chinese 3 Korean 1 Indian 1 White 1 Our interviews also included an equal amount of
permanent and weekend-only vendors. This is an oversample relative to the total vendor population. According to data from The Flea Market, Inc., between 20 to 25 percent of vendors sell four days per week.
Q7. How many days per week do you sell at the market? Days per Week Count 2 12 3 2 4 14
Table 4. Sellers by Day of Week Day of Week Sellers Open Wednesday 300 Friday 300 Saturday 1,200 Sunday 1,500
Source: San Jose Flea Market Personal Histories
Reflecting the tension expressed in the literature, the survey suggests that the Flea Market has attracted an equal number of “value entrepreneurs” and “disadvantaged entrepreneurs.”
Value entrepreneurs are motivated to sell at the Flea Market for non-monetary reasons. As suggested by Morales (2009), many interview subjects began vending because they enjoy the process of selling goods and running their own business. Others had personal connections to the market through family connections or from working as employees for other vendors. Some were attracted by the flexibility offered by vending, including low costs of entry and the ability to control their work hours. The market also provides dedicated space for street vending, which is often looked upon unfavorably in most commercial areas. The Flea Market’s central location within the Bay Area’s largest city can also be considered a positive pull factor.
For many vendors, however, the Flea Market represents an opportunity for self-employment in the face of unemployment or underemployment. These disadvantaged entrepreneurs are typically immigrants who possess low levels of human capital and have encountered difficulty in competing on the formal labor market. Many vendors suggested that they turned to selling at the Flea Market after being unable to find permanent employment due to lack of job openings or barriers like low levels of educational attainment, poor English language skills or old age.
Q2. Tell me about how you decided to become a Flea Market merchant? Reason Count Unemployed 11 Likes Selling 7 N/A (employee) 3 Extra Money 3 Doesn't Speak English Well 3 Family 2 Low Entry Costs 2 Had Been Employee 2 Flexibility 1
For both groups, however, the Flea Market offers an opportunity for permanent, long-term employment. The majority of vendors we interviewed have been selling at the market for more than five years, with a number having sold there for decades. All but one sell at the market year-round and all but four sell only at the San Jose Flea Market. The Flea Market is the primary source of income for the majority of vendors interviewed, though a number of them live in households with other income earners. Several older

13
vendors live with their adult children and continue to work.
Q11. Is this your only source of income? If no, what else do you do? Response Count Yes 18 Yes, but has family income 5
No 5 To put these self-employment opportunities in greater
context, we also profiled California’s self-employed immigrant workforce using data from the 2005-2009 American Community Survey’s Public Use Microdata Sample. The results are shown in Table 5 below. The data show that there are distinct variations among Latino, Chinese and Vietnamese labor markets, even within the realm of self employment and entrepreneurship. Across all immigrant groups in California, including the three groups included in this analysis, self-employment fails to lift a substantial number of workers out of poverty. Fifty-three percent of all immigrant entrepreneurs earned less than $25,000 per year, and 38 percent earned less than $15,000, which is less than the expected before-tax annual income of a minimum wage worker.3 One third face difficulties with the English language, while 31 percent lack a high school diploma. Self-employment does produce a positive effect on unemployment. The unemployment rate for self-employed workers was 4.3 percent, approximately 45 percent lower than the statewide unemployment rate of 7.9 percent. Even though many workers struggle to earn a living wage, self-employment appears to be effective at reducing unemployment.
Table 6 shows the top sectors and industries represented among self-employed immigrants, first aggregated for California as a whole and then broken down into the three ethnic groups on which we are focused. Self-employment options for Latino immigrants are heavily concentrated in low-wage, low-skill industries. Over half are employed 3 The ACS data may underestimate personal income from infor-mal labor, which survey respondents typically do not report as income either for tax purposes or in demographic surveys.
in just four industry sectors: construction, domestic household work, landscaping and child care services. In part, this reflects the overall demographics of this group. More than half of self-employed Latino immigrants lack a high school diploma and 46 percent either speak little or no English. As a result, average annual earnings for Latinos are $28,166 (2009$), and 45 percent earn less than $15,000 annually.
The Chinese immigrant self-employment market is bifurcated between high-skill and low-skill workers.4 Although restaurants and construction are the two largest sectors by employment, there are a number of self-employed Chinese immigrants working in financial services, professional services and medicine. This partly reflects the higher rates of educational attainment among Chinese immigrants – nearly 60 percent have a college degree or higher. The Chinese immigrant self-employment market is also considerably less concentrated in specific industries and occupations than the Latino and Vietnamese markets. For Chinese workers, the top 10 industries account for 43 percent of all jobs, and the top 10 occupations account for 38 percent of all jobs. This is considerably less concentrated than the market for Latino workers, for whom the top 10 industries and occupations account for 73 percent and 58 percent of all jobs, respectively. For Vietnamese workers, the top 10 industries and occupations account for and 55 percent and 48 percent, respectively.
Vietnamese immigrant self-employment options are heavily concentrated in personal care retail, food services, construction and landscaping. Thirty-five percent of immigrants have at least a college degree, but the Vietnamese labor market is less bifurcated than the Chinese market. Vietnamese immigrants are relatively evenly split among low-, middle- and high-levels of educational attainment, though the most common occupations tend to be lower-skill jobs.4 This category includes all immigrants of Chinese descent, including those from Hong Kong, Taiwan, mainland China and elsewhere.
Photo credit: metroactive.com Photo credit: jenni-isms.com

14
1
Table 5. Demographic Profile, Self-Employed Foreign-Born Workers in California, 2005-2009 California Hispanic Chinese Vietnamese Total Foreign-Born Workforce 7,012,092 3,881,740 544,593 262,238
Self-Employed Workers 845,877 403,202 64,473 32,093 Self-Employment Rate 12.1% 10.4% 11.8% 12.2% Average Age 49.5 42.8 48.8 45.0 Sex
Male 60.3% 58.6% 57.7% 55.3% Female 39.7% 41.4% 42.3% 44.7%
Educational Attainment No High School 31.3% 54.5% 14.1% 22.1% High School 20.6% 22.2% 15.4% 21.2% Some College 14.5% 12.0% 11.7% 21.2% College Degree 22.5% 8.6% 36.0% 25.8% Advanced 11.1% 2.8% 22.8% 9.7%
Employment Status Unemployment Rate 4.3% 5.2% 2.5% 2.8% Not in Labor Force 13.3% 11.8% 15.5% 14.6%
Average Income $43,540 $28,166 $55,079 $44,396 Total Earnings
Loss 0.7% 0.4% 1.0% 0.8% No Income 7.9% 7.2% 9.6% 8.1% <$15,000 28.9% 38.1% 22.1% 26.2% $15,000-$24,999 16.0% 19.8% 11.9% 14.7% $25,000-$34,999 11.7% 12.1% 12.2% 13.8% $35,000-$49,999 10.4% 9.0% 12.1% 12.5% $50,000-$74,999 9.8% 6.8% 10.7% 9.2% $75,000-$99,999 4.7% 2.7% 6.0% 5.2% $100,000+ 9.8% 4.0% 14.3% 9.7%
Ability to Speak English Very Well 31.5% 23.3% 34.2% 27.9% Well 25.6% 27.3% 30.9% 36.4% Not well 22.2% 31.2% 22.8% 27.9% Not at all 8.3% 15.2% 5.1% 3.6% Speaks Only English 12.3% 3.1% 7.0% 4.3%
Source: American Community Survey, 5-Year Sample, 2005-2009

15
1 T
able
6.
To
p 1
0 I
nd
ust
ry a
nd
Occ
up
atio
n G
rou
ps,
Sel
f-E
mp
loye
d F
ore
ign
-Bo
rn W
ork
ers
in C
alif
orn
ia,
20
05
-20
09
C
alif
orn
ia
H
isp
anic
Ch
ines
e
Vie
tnam
ese
To
p 1
0 I
nd
ust
ries
S
ecto
r S
har
e
Sec
tor
Sh
are
S
ecto
r S
har
e
Sec
tor
Sh
are
Con
stru
ctio
n 13
.6%
Con
stru
ctio
n 18
.8%
Res
taur
ants
and
Oth
er
Food
Ser
vice
s 10
.0%
Nai
l Sal
ons
10.9
%
Priv
ate
Hou
seho
lds
8.9%
Priv
ate
Hou
seho
lds
16.6
%
C
onst
ruct
ion
9.3%
Bea
uty
Sal
ons
10.2
%
Land
scap
ing
Ser
vice
s 5.
9%
La
ndsc
apin
g Ser
vice
s 10
.6%
Rea
l Est
ate
7.2%
Res
taur
ants
6.
9%
Res
taur
ants
and
Oth
er
Food
Ser
vice
s 5.
1%
C
hild
Day
Car
e Ser
vice
s 7.
3%
Sec
uriti
es
2.6%
Con
stru
ctio
n 6.
8%
Chi
ld D
ay C
are
Ser
vice
s 4.
6%
Ser
vice
s to
Bui
ldin
gs
and
Dw
ellin
gs
5.5%
Man
agem
ent,
Sci
entif
ic,
and
Tech
nica
l Ser
vice
s 2.
6%
La
ndsc
apin
g Ser
vice
s 6.
5%
Rea
l Est
ate
3.9%
Truc
k Tr
ansp
orta
tion
3.5%
Chi
ld D
ay C
are
Ser
vice
s 2.
3%
Rea
l Est
ate
4.7%
Ser
vice
s to
Bui
ldin
gs
and
Dw
ellin
gs
3.3%
Res
taur
ants
and
Oth
er
Food
Ser
vice
s 3.
5%
O
ther
Sch
ools
and
In
stru
ctio
n 2.
3%
Aut
omot
ive
Rep
air
and
Mai
nten
ance
2.
8%
Truc
k Tr
ansp
orta
tion
2.6%
Aut
omot
ive
Rep
air
and
Mai
nten
ance
3.
3%
C
ompu
ter
Sys
tem
s D
esig
n an
d Rel
ated
Ser
vice
s 2.
3%
O
ffic
es o
f D
entis
ts
2.8%
Aut
omot
ive
Rep
air
and
Mai
nten
ance
2.
4%
Rea
l Est
ate
2.0%
Arc
hite
ctur
al,
Engi
neer
ing
and
Rel
ated
Ser
vice
s 2.
2%
Pr
ivat
e H
ouse
hold
s 2.
0%
Bea
uty
Sal
ons
2.3%
Bea
uty
Sal
ons
1.5%
Bea
uty
Sal
ons
2.1%
Chi
ld D
ay C
are
Ser
vice
s 1.
7%
T
op
10
Occ
up
atio
ns
C
ateg
ory
S
har
e
Cat
ego
ry
Sh
are
C
ateg
ory
S
har
e
Cat
ego
ry
Sh
are
Mai
ds a
nd H
ouse
keep
ing
Cle
aner
s 8.
9%
M
aids
and
Hou
seho
ld
Cle
aner
s 17
.3%
Man
ager
s of
Ret
ail S
ales
W
orke
rs
6.4%
Mis
c. P
erso
nal A
ppea
ranc
e W
orke
rs
12.1
%
Man
ager
s -
Ret
ail S
ales
W
orke
rs
5.4%
Gro
unds
and
M
aint
enan
ce W
orke
rs
9.2%
Rea
l Est
ate
Bro
kers
and
Sal
es A
gent
s 5.
3%
M
anag
ers
of R
etai
l Sal
es
Wor
kers
6.
9%
Chi
ld C
are
Wor
kers
5.
2%
C
hild
Car
e W
orke
rs
8.4%
Man
ager
s of
Non
-Ret
ail
Sal
es W
orke
rs
5.0%
Gro
unds
Mai
nten
ance
W
orke
rs
5.7%
G
roun
ds a
nd
Mai
nten
ance
Wor
kers
5.
1%
C
onst
ruct
ion
Labo
rers
6.
2%
Fo
od S
ervi
ce M
anag
ers
4.9%
Hai
rdre
sser
s, H
airs
tylis
ts,
and
Cos
met
olog
ists
5.
2%
Con
stru
ctio
n La
bore
rs
3.8%
Truc
k D
rive
rs
4.2%
Mis
c. M
anag
ers
4.0%
Man
ager
s of
Per
sona
l Ser
vice
Wor
kers
3.
8%
Mis
cela
neou
s M
anag
ers
3.1%
Man
ager
s of
Ret
ail S
ales
W
orke
rs
2.8%
Chi
ef E
xecu
tives
3.
3%
Rea
l Est
ate
Bro
kers
3.
3%
Dri
ver/
Sal
es W
orke
rs
and
Truc
k D
rive
rs
3.0%
Pain
ters
, C
onst
ruct
ion
and
Mai
nten
ance
2.
7%
C
hild
Car
e W
orke
rs
2.3%
Mis
c. M
anag
ers
3.0%
Fo
od S
ervi
ce M
anag
ers
2.7%
Ret
ail S
ales
pers
on
2.6%
Ret
ail S
ales
pers
ons
2.2%
Food
Ser
vice
Man
ager
s 2.
9%
Rea
l Est
ate
Bro
kers
and
Sal
es A
gent
s 2.
7%
C
arpe
nter
s 2.
2%
Ph
ysic
ians
and
Sur
geon
s 2.
2%
D
entis
ts
2.6%
M
anag
ers
of N
on-R
etai
l Sal
es W
orke
rs
2.5%
Jani
tors
and
Bui
ldin
g C
lean
ers
2.1%
Acc
ount
ants
and
Aud
itors
2.
1%
Ret
ail S
ales
pers
ons
2.5%
Sou
rce:
Am
eric
an C
omm
unity
Sur
vey,
5-Y
ear
Sam
ple,
200
5-20
09

16
The Business of Street Vending
The vendor survey also asked merchants about various aspects of their businesses. These questions are intended to assess overall business confidence, estimate profitability and sales productivity, and understand the vendors’ supplier networks and employment patterns.
Business Confidence
The merchants surveyed were generally pessimistic about the current business climate at the market. Their open-ended responses were coded into one of five categories, shown in the table representing those responses, below. Of the 26 responses to the question, 20 responded that business was slow or very slow. Only one, an apparel vendor, suggested that his business was doing well. Several vendors noted that they have observed a decline in both the total number of shoppers and the amount that shoppers spend at the market.
1
Q9. How has business been for you lately? Response Count Very Good 0 Good 1 Mixed 5 Slow 15 Very Slow 5
When asked about their primary customer base, nearly all vendors suggested that shoppers choose the Flea Market because it offers a variety of items at substantial discounts to retail prices. In combination with the findings of the customer survey, this suggests further that Flea market shoppers are price sensitive, and that it generates a considerable consumer surplus for its low-income customer base.
1
Q21. Why do you think your customers shop here? Response Count Cheap goods 20 Not sure 4 Language/Friendly merchants 2 Unique products 2 Because they are poor 2 Environment 1 Variety 1
To verify whether this is true, we assembled a market basket of items available for sale at the Flea Market and compared their prices to the same product or a near substitute at a retail store or online retailer. As Table 7 shows, on average, items for sale at the flea market sell for 45 percent less than elsewhere, and savings can be found in all product categories. (The full market basket is included in Appendix B.)
1
Table 7. Market Basket Comparison Category Average Savings Apparel 48.4% Furniture 50.0% Personal Care 37.6% Plants 52.7% Produce 46.8% Toys 34.3% Market-Wide 45.1%
It is counter-intuitive that a market catering to price-sensitive shoppers would struggle during a recession, though there are a number of possible explanations for why this would be the case. Several vendors mentioned that customers are dissuaded by the parking charge. Others complained the Flea Market does not do enough advertising. It is also possible that attendance declined after the Bumb family proposed to redevelop the market, though the Bumbs have not published historical attendance data. Additionally, Latino immigrants, who constitute the market’s primary customer base, have been among the groups hit hardest during the recession. Latino unemployment in California was 12.9 percent in 2009 according to the 2009 ACS one-year sample, compared with a state-wide average of 11.3 percent. At the same time, it is possible that mainstream retail environments are becoming more culturally sensitive to the Latino market, and that the number of Latino consumers compelled to shop at the Flea Market due to social exclusion is correspondingly declining over time.
Employment
The majority of vendors report that they employ at least one worker at their stands. A plurality staff their stands with family members, including spouses, children and siblings. A number of the Vietnamese and Chinese vendors also hire Spanish-speaking clerks to assist them. The survey also suggests that produce and furniture vendors employ the largest number of clerks. Furniture is unique in that many of the stall owners are absentee owners who rely on employees to manage their businesses at the Flea Market.
1
Q17. How many people work for you here at the Flea Market? Response Count None 6 Family 9 1 4 2 2 3 3 4 3

17
Expenses
Rent is by far the most commonly cited expense, as it is the vendors’ only major fixed cost. Monthly rents at the market range from $275 for an uncovered space to $875 for a corner stall in Produce Row. Assuming that most stalls are approximately 350 square feet, this is the equivalent of a monthly full-service rent of $0.75-$2.50 per square foot. By comparison, the average triple-net asking rent for San Jose brick-and-mortar retail space at the end of 2010 was $1.89 per square foot per month (Terranomics 2010).
Vendors at the Flea Market also operate on month-to-month leases, which offer both advantages and disadvantages. The lack of long-term leases helps vendors to be flexible, encourages new vendors to sell at the market, and limits liabilities for poorly capitalized businesses. The lack of leases, however, also means that vendors have no long-term security in their locations. The monthly rents are also fixed payments that do not vary by season, customer attendance or weather. Since the market has cut weekday operations to three out of five days, vendors have fewer days to cover their expenses, and a rainy weekend or month can severely limit sales revenue.
1
Q15. What are your (biggest) expenses? Responses Count Rent 15 Inventory 3 Permits/Taxes 2 Transportation 2 Labor 1
Supplier Networks
Vendors report that their supplier networks stretch across California and, both directly and indirectly, across the world. Many vendors, particularly in the apparel and toy sectors, report that their wholesalers are located in Los Angeles. Produce vendors all source their goods at wholesalers in the South Bay or San Francisco/San Mateo Peninsula. One produce vendor reported that her family owns a farm, but most produce comes through wholesale distribution networks. Overall, at least half of all revenue leaks out of San Jose to wholesalers outside the city.
1
Q5. Is/Are your supplier(s) in San Jose? If not, where? Response Count Los Angeles 9 San Jose 7 Varies 3 Self 3 "Local Wholesale" 3 Asia 1 California 1 San Diego 1 Mexico 1
The survey also asked vendors about their sales in a typical week. Though the question was intended to gather information about gross revenue, most vendors who answered the question responded by giving their typical profits. Based on the interviews, it appears that most vendors earn between $100 and $250 in profit per week per stall. Produce vendors appear to be the most profitable, with most vendors earning close to $250 per stall. A produce vendor with two stalls would earn approximately $26,000 per year in profits. Apparel vendors, who earn closer to $185 per stall per week on average, would earn $19,240 per year with two stalls. All other vendors appear to be less productive, earning on average $100 to $150 per week. At $150 per week for two stalls, a vendor would earn $15,600 per year.
By way of contrast, a minimum-wage worker in California earns $16,000 per year, before taxes, for working 2,000 hours. For most vendors, then, selling at the Flea Market offers an opportunity to earn more than they would at a full-time minimum-wage job. For workers who faced unemployment, under-employment or employment in sub-minimum wage conditions, the earnings are even more attractive. We can see these comparisons quite clearly in Table 8.
Table 8. Comparison of Before-Tax Income from Vending versus Minimum Wage Employment Occupation Productivity/Wage Weekly Annual Produce Vendor1 $250/stall/week $500 $26,000 Apparel Vendor1 $185/stall/week $370 $19,240 Other Vendor1 $150/stall/week $300 $15,600 Minimum Wage Employment2 $8.00/hour $320 $16,000 1 Assumes vendors rent two stalls and sell four days per week, year round. 2 Assumes minimum wage of $8.00 per hour, 2,000-hour work year. Economic Impact
According to an analysis of the impact of household income changes using IMPLAN, an economic impact modeling software application, every dollar of income earned by Flea Market vendors has an induced multiplier effect of 0.52. This means that every dollar earned, assuming it is spent within Santa Clara County, will induce an additional 52 cents of economic activity within the county. If there are 300 full-time vendors earning an average of $20,000 per year and an additional 900 weekend-only vendors earning an average of $10,000 per year, total earnings of Flea Market vendors would amount to approximately $15 million annually. This income, as it is spent in the local economy, will in turn induce an additional $7.8 million in spending each year, generating a total annual impact of at least $22.8 million in income in Santa Clara County. The largest beneficiaries of this income are industries that meet basic necessities, including housing, food, medical care, utilities and education.

18
Interaction with the Public Sector
The survey also asked vendors about their opinions on the proposed BART extension and how they interact with state and local governments.
Despite the flurry of media coverage and organizing that occurred in late 2000s, most vendors we spoke with expressed a general sense of indifference to BART. Some vendors, citing lackluster sales, expect to retire before the station is completed, while others are skeptical that it will be built. Vendors who expressed more direct opinions were evenly divided between those who worried about displacement and those who were hopeful that BART would bring more shoppers to the market. In general, though, the BART extension project appears to be an abstract concept to most vendors, particularly given a completion date many years in the future.
1
Q19. Have you heard about the proposal to build a new BART station here? If yes, what do you think about it? Response Count Indifferent 16 Displacement 4 More people 4 Skeptical 2 Has Not Heard 1
Vendors expressed similar indifference about their interactions with the City of San Jose and other levels of government. Few reported difficulty in securing the
business and tax licenses necessary to sell at the Flea Market. The only negative responses were from produce vendors, who, when asked, said that they do not accept payments from food assistance programs through the federally-funded Supplemental Nutrition Assistance program. Unlike many farmers’ markets in the Bay Area, the Flea Market does not have a central point-of-sale/scrip system that would allow program-assisted shoppers to use their EBT cards at the market. By 2004, most states had moved to electronic debit card disbursement of federal assistance funds like the food stamp program (Pear 2004). Flea Market produce vendors said that they had encountered difficulty in dealing with the bureaucratic requirements to participate in the program. Most also do not have access to a phone line, which is necessary to process payments from a state-issued EBT card.
Q22. Do you feel like the city government supports you as a small business owner/ entrepreneur? Has permitting and licensing been easy? Has business start-up or development training or assistance ever been offered to you? Do they seem sensitive to your needs? Response Count Indifferent/No Interaction 22 Some Problems with Tax Board 2 Language Issues 1 Easy to Work With 1 Unlicensed 1
1
Table 9. Induced Impacts of Household Income Changes, Top 15 Industries Sector Multiplier Imputed rental activity for owner-occupied dwellings 0.07 Real estate establishments 0.06 Private hospitals 0.05 Offices of physicians, dentists, and other health practitioners 0.03 Food services and drinking places 0.02 Electric power generation, transmission, and distribution 0.02 Telecommunications 0.02 Wholesale trade businesses 0.01 Medical and diagnostic labs and outpatient and other ambulatory care services 0.01 Monetary authorities and depository credit intermediation activities 0.01 Private junior colleges, colleges, universities, and professional schools 0.01 Retail Stores - Food and beverage 0.01 Legal services 0.01 Retail Nonstores - Direct and electronic sales 0.01 Total Induced Effect 0.52

19
While the focus so far has been the recent and current significance of the Flea Market to its customers and vendors, owners and other stakeholders, we also wanted to understand whether other uses of the land – particularly the uses that the landowners have proposed in a master planned development – are more or less viable than operation of the Flea Market. After describing the regional and neighborhood-scale demographic and economic contexts in which the Flea Market site is situated, this section presents details about the “transit village” development that has been proposed (and partially permitted), discusses the financial and market feasibility for each of the main land uses proposed, and considers the short- and long-term viability of the transit village development.
Summary of Area and Neighborhood
Santa Clara County
San Jose is the seat of Santa Clara County, which is located at the southern end of the San Francisco Bay Area in
California. The county includes 15 incorporated cities and towns. An agricultural economy during the time of the Spanish missionaries, Santa Clara shifted toward high-tech as early as the 1930s, when Hewlett Packard was founded. The first high-tech boom, which gave rise to the area’s “Silicon Valley” moniker, was underway by the late 1950s, and development to accommodate these firms and housing for their employees led to rapid subdivision and urbanization of much of the northern part of the county by the 1990s. Today, Santa Clara County is the headquarters for such companies as Apple, Hewlett Packard, Google, Yahoo, eBay, Intel and many others. Table 10 lists Santa Clara County’s largest employers in 2010.
The county has an extensive freeway system, a separate system of expressways, as well as a system of streets dominated by four- and six-lane arterials. The Santa Clara Valley Transportation Authority operates a light-rail system and bus services. The county is also served by Caltrain commuter rail, connecting it to San Francisco via San Mateo County, and the ACE Train, which connects it to Stockton to the east. The county’s single international airport is located in San Jose.
Chapter 4: Transit Village Market Study
1
Table 10. Major Employers in Santa Clara County, 2010 Employer Name Location Industry AAA Affordable Tutoring Santa Clara Tutoring Adobe Systems Inc. San Jose Computer Software Advanced Micro Devices Inc. Sunnyvale Computer Hardware & Components Apple Inc. Cupertino Computer Hardware & Components Avago Technologies LTD San Jose Electronics Cadence Design Systems Inc. San Jose Computer Hardware & Components Cafe Adobe San Jose Food Services California's Great America Santa Clara Amusement/Theme Parks &
Arenas/Stadiums Christopher Ranch LLC Gilroy Agriculture Christopher Ranch LLC San Jose Computer Hardware & Components E4E Inc. Santa Clara Consulting El Camino Hospital Mountain View Healthcare Flextronics International Milpitas Electronics Fujitsu IT Holdings Inc. Sunnyvale Computer Hardware & Components Syngenta Flowers/Goldsmith Seeds Gilroy Agriculture Hewlett-Packard Cupertino Computer Hardware & Components Hewlett-Packard Co. Palo Alto Computer Hardware & Components HP Pavillion at San Jose San Jose Amusement/Theme Parks &
Arenas/Stadiums Intel Corp. Santa Clara Computer Hardware & Components Kaiser Permanente Medical Center San Jose Healthcare Microsoft Corp. Mountain View Computer Software National Semiconductor Corp. Santa Clara Computer Hardware & Components Net App Inc. Sunnyvale Computer Hardware & Components Santa Teresa Community Hospital San Jose Healthcare V.A. Medical Center - Palo Alto Palo Alto Healthcare Source: America's Labor Market Information System, (ALMIS) Employer Database, 2011 1st Edition.

20
City of San Jose
The City of San Jose has a total of area of 178 square miles and its 2010 population count was 945,942, a six-percent increase from the 2000 population count. The city bills itself the “heart of Silicon Valley,” although until the last decade or so, it has been better known for its suburban, bedroom community-style, single-family residential subdivisions than for clusters of high-tech employers. Today, its top employers include Cisco Systems, IBM, eBay, Hitachi, Sanmina-SCI, Adobe Systems and non-tech employers like San Jose State University, the San Jose Unified School District and area hospitals (City of San Jose 2011a). The city has a daily newspaper, the San Jose Mercury News, a system of public libraries, several museums, one team in the National Hockey League (San Jose Sharks) and one team in Major League Soccer (San Jose Earthquakes).
Berryessa Neighborhood
During the era of Spanish rancheros, Rancho Beryessa (original spelling) was owned by a family of brothers. When the ranchero era ended, it was mainly subdivided into apricot orchards, owned by families of Latino and Portuguese descent. Most of the old apricot orchards became part of subdivisions in the early 1970’s. (BCAC)
The predominant development pattern since subdividing began has been, as with many suburban communities in the state, single-family homes on large lots, accompanied by the occasional single-story, surface parking-dominated neighborhood shopping center. According to San Jose Councilmember Kansen Chu, who represents the district, the neighborhood has served as a bedroom community to workers who have jobs in Silicon Valley.
Figure 1. San Jose in the regional context
San Jose is situated in the southern portion of the Bay Area. The yellow box represents the area depicted in the aerial view in Figure 2 later in this chapter.

21
Market Analysis
Key Demographic and Economic Indicators
Table 11 provides a comparison across Santa Clara County, the City of San Jose and the Berryessa neighborhood of demographic indicators commonly found in market analyses for development.
Some key observations from this data – many of which are corroborated by the authors’ conversation with Councilmember Kansen Chu (2010) – are:• The Berryessa neighborhood is home to a high
percentage of immigrants and their families. The percentage of the neighborhood’s population that is foreign-born is significantly higher than in both the city and the county.
• The proportion of Berryessa adults aged 25 or older who have attained a bachelor’s degree is higher than
it is for both the city and the county. At the same time, the proportion that has less than a high school diploma is lower than for the city and county, suggesting a population that strives for post-secondary educational attainment.
• The Berryessa neighborhood is home to a disproportionately high number of Asian residents, more than twice the proportions as the county or the city. The neighborhood has fewer white-only and Hispanic/Latino residents than either the county or city.
• There is a strong family orientation among Berryessa residents, reflected both in the proportion of households that are families (85%) and a larger average household size than both the City and the County.
• The fact that the neighborhood is made up predominantly of single-family, detached homes may help to explain both the higher median household income and the higher ratio of owners to renters in the
1
Table 11. Demographic and Housing Profile, 2000
Santa Clara County
City of San Jose Berryessa*
Population 1,682,585 945,943 42,118 Age Cohorts
0-9 14% 15% 14% 10-14 7% 7% 7% 15-24 13% 14% 12% 25-34 18% 18% 18% 35-44 18% 18% 19% 45-54 13% 12% 14% 55-64 8% 8% 8% 65-74 5% 5% 5% 75+ 4% 3% 3%
Median Age 34.0 32.6 34.5 Race/Ethnicities
Non-Hispanic/Non-Latino White 44.0% 35.8% 18.7% Black 2.5% 3.2% 2.4% American Indian/Alaska Native 0.3% 0.4% 0.4% Asian 25.4% 26.6% 63.4% Native Hawaiian/Pacific Islander 0.3% 0.3% 0.3% Some other race alone 0.2% 0.2% 0.2% Two or more races 3.2% 3.4% 2.5%
Hispanic/Latino (any race) 24.0% 30.2% 12.1% Nativity
U.S. born 65.9% 63.1% 46.4% Foreign born 34.1% 36.9% 53.6%
Educational Attainment (in those aged 25+)
Less than HS diploma 16.6% 21.7% 15.9% HS diploma and/or Associate degree 42.9% 46.8% 44.3% Bachelor's degree 24.0% 20.8% 27.8% Higher than Bachelor's degree 16.4% 10.7% 12.0%
Households Total 565,863 276,598 12,022 Average Household Size 2.92 3.20 3.55 Family Households 69.9% 73.6% 84.8%
Median Household Income $74,335 $70,243 $88,314 Housing Tenure
Housing Units Total 579,329 281,841 12,098 Owner-occupied 58.5% 60.7% 76.0% Renter occupied 39.2% 37.5% 23.4% Vacant 2.3% 1.9% 0.6%
Median Home Value $446,400 $394,000 $385,813 *Census tracts included: 503803, 504307, 504311, 504314, 504316, 504317, 504319 and 504321 Source: U.S. Census 2000, Tables DP-1, DP-2, DP-4, P7 and QT-H1

22
Berryessa neighborhood. Land used for this type of housing is unavailable for use for rental housing, and single-family homes typically require higher incomes to afford than rental housing.
The data and observations so far are based on the 2000 U.S. Census. At the time of this writing, publicly available 2010 Census data is very limited. We do, however, note the following:• The projected population increase for the City of San
Jose for the period 2000-2010 was 14.3% (San Jose Planning 2007). The actual growth (from 894,943 in 2000, to 945,942 in 2010) has been 5.7% (U.S. Census 2010).
• The degree to which the projected population was overestimated is even more pronounced at the neighborhood level. The population for Berryessa (same Census tracts as used in Table 11 above) is reported as 43,405 for 2010. This represents just a 3.1% increase in the neighborhood’s population since 2000.
• According to Census 2010 data, the vacancy rate for all housing units was 2.4% in the Berryessa neighborhood. This is a notable increase from the 0.6% vacancy rate in 2000.
The 2010 data that has so far become available is not inconsistent with the trends that would be expected given the economic depression the entire country has recently been experiencing. However, given the preliminary nature of the 2010 data, this analysis should be revisited and elaborated when full and accurate 2010 Census data, as well as 2010 American Community Survey five-year estimates, become available.5
5 Several jurisdictions have recently taken action, or are consider-ing doing so, to challenge the accuracy of the Census’s redistrict-ing counts (Bloomekatz 2011). The Census Bureau has already admitted to, and corrected, an error in the population counts for two New Hampshire jurisdictions (Cronin 2011).
Site Characteristics and Proposed Development
The site is located in the Berryessa neighborhood, in the northeastern portion of the City of San Jose. It is approximately two miles’ straight-line distance from San Jose’s border with Milpitas, to the north. It is less than 1.5 miles’ drive from the nearest access ramps for both the U.S.-101, to the west, and the I-680, to the east. The site comprises nine gross parcels (one is a one-acre parcel that is deed-restricted as it houses a Santa Clara Valley Water District raw water supply pipe).
The parcels lay on both the north and south sides of Berryessa Road, bounded on the east by Union Pacific Railroad tracks and on the west by Coyote Creek. North of Berryessa Road, the site comprises paved surface parking and non-permanent storage facilities. South of Berryessa Road is the Flea Market itself – with both semi-permanent and permanent structures and utilities – as well as another paved surface parking lot. All existing structures and most (if not all) of the existing parking surfaces would need to be demolished to make way for the new transit village as it is proposed.
The site’s neighboring land uses are single-family residences and a municipal golf course to the north, light industrial to the east, heavy industrial to the west - including an asphalt/gravel plant, a metal reclamation yard, asphalt recycling and warehouses - and a city-owned storage yard to the south. The former Union Pacific Railroad right-of-way borders the southeastern side of the site with two industrial parks and new single-family residential development beyond to the east. The site’s topography is flat, with zero to minimal slope throughout.
Summary of Zoning and Related Regulations
Figure 2 shows the Flea Market redevelopment site outlined in red. The surrounding land uses are also indicated.
The Flea Market site is outlined in red. Major freeways are traced in purple.
Figure 2. San Jose Flea Market Site, Aerial View

23
The site is base-zoned agricultural (A). In 2007, the city approved a Planned Development (PD) zoning change for the site, thus making the zoning for the site A(PD). San Jose’s PD zones are overlay zones, which means they are combined with a base zoning district. PD districts are individually designed to meet the needs of the territory so zoned, and must be adopted by a zoning ordinance which incorporates a corresponding general development plan for the entirety of the subject property. Development of the property can occur only pursuant to a PD permit or, alternatively, the base zoning district.
San Jose approved the PD permit for the Flea Market site in December 2010. The permit is valid for four years, extendable by a permit adjustment or execution on permits to construct site improvements. The PD permit specifies, for the whole site of approximately 120 gross acres, up to 2,818 residential units (at up to 30-40 dwelling units/acre) and up to 365,622 square feet (s.f.) of mixed-use commercial/office space. Because the site includes Penitencia Creek and abuts the juncture of Penitencia Creek and Coyote Creek, the PD suggests minimum elevation standards for the lowest floor (including basements) of any newly constructed building as well as building support (mechanical) systems in order to avoid flood damage. The project is required to contribute financially to, or execute the phased construction of, expansions and improvements to several nearby roads and intersections. The project must construct street improvements along Berryessa and Mabury Roads. Additionally, each phase of development requires a PD permit that includes detailed project information (e.g.,
fully developed site plans, elevations, landscape plans, information on unit count and type, required parking, lighting, etc.). The project must attain minimum green building certification of LEED Silver. The project is not required to include affordable housing, and plans sketched out so far show that none will be provided.
A vesting tentative map permit has been approved for the parcels north of Berryessa Road, henceforth referred to as the North Village. It specifies 6.2 acres of single-family residential development, 11.9 acres of multi-family residential (up to 30 DU/acre), 9.8 acres of mixed-use commercial and office, and 9 acres for a school/public park and 10 acres along Coyote Creek for public open space. There is not yet a more detailed tentative map for the south side of Berryessa, but the zoning sets aside space for the new BART station, bus terminals and access roads, and BART parking (garage and surface). The South Village will also have multi-family residential (with higher densities than the North Village), mixed-use office/commercial space, and public open space along both Coyote Creek and Penitencia Creek.
Given that development plans for the north side of Berryessa Road are much further along than for the south side, the market feasibility discussion presented here focuses on the North Village. Using one of the blocks that is to contain attached townhouses and stacked flats, we provide a detailed analysis for residential development. We also offer overviews of the market feasibility of commercial and office development for the North Village.
Figure 3. Land Use Map, Flea Market, and Surrounding Parcels
Source: San Jose Planning Division 2011b

24
North Village Proposal
The North Village PD permit specifies:1. 122 units of single-family, detached homes, each on typical lot sizes of 3,200 or 1,700 s.f.2. 112-128 units of 2- and 3-bedroom single-family attached townhouses and stacked flats, ranging in size from 1,169 s.f. to 1,831 s.f. per unit3. 120,700 s.f. of mixed-use commercial/office building space, on a site area of 10.7 acres. This neighborhood shopping center would be anchored by a 64,000-s.f. single-story commercial tenant and provide an estimated 545 off-street parking spaces.4. Nine acres, or 392,040 s.f., for a future school and public park site
See the Figure 4 for the approved proposed North Village site plan. Figure 5 shows the lot and right-of-way dimensions for Block 4.
The plan allows for either 7- or 8-unit buildings. To present the case that will both allow the developer to sell more units and the city to realize higher density around a proposed transit station, we assume the development will move forward using 8-unit buildings. The figure below shows the intended floor plans for 8-unit buildings. The block would have eight of these three-story buildings, resulting in 64 units on the whole block. For more detailed unit floor plans and elevation drawings, see Appendix C.
Residential Market Analysis
Our residential demand analysis centers on Block 4 because attached housing is not the predominant residential type in San Jose, yet it is more consistent with TOD ideals of compactness, higher density and household diversity than single-family detached housing. Given the city’s vision of incorporating more TODs and smart growth characteristics into its neighborhoods, a North Village feasibility study that is focused on the attached housing aspects of the proposal could become informative for future such proposals for residential development that align with the city’s vision.
Demand
Our demand analysis (see Appendix C) shows that in San Jose, there will be 5,000-6,000 additional housing units demanded each year for the next four years. If Berryessa’s share of San Jose housing units – 3 percent – remains constant, and we assume the same proportion for demand for new units in Berryessa, then for the next four years the market will demand 150-180 new housing units each year in Berryessa. This translates to 600-720 new units by 2014, which is when the PD permit for North Village expires. This suggests there is enough demand for the market to absorb both the single-family detached and multi-family units proposed for North Village.
Figure 4. North Village Site Plan
Source: San Jose Department of Planning, Building & Code Enforcement, Planning Division, 2008

25
Figure 5. North Village Townhomes/Condos, Block 4 Dimensions
Source: San Jose Department of Planning, Building & Code Enforcement, Planning Division, 2008
Source: San Jose Department of Planning, Building & Code Enforcement, Planning Division, 2008
Figure 6. North Village Block 4 - Eight-unit Building Plan

26
Table 12. Selected Existing Townhome/Condo Developments In or Near Berryessa Neighborhood Name of Project Location
Year Built DUs Unit Type(s) Sales Price
Area in Square Feet
Price per Square Feet Status
Min Max Min Max Min Max Flea Market Transit Village (subject site)
Berryessa Rd btwn Lundy & Oakland Rds -
65 (Block
4 only)
2 BR stacked condos, 2- and 3-BR townhouses
1,169 1,831 Approved
Montclair Townhomes
Mabury Rd @ King Rd
2007
91 2 and 3 BR condos
$320,000 $675,000 1,292 1,871 $248 $361 Sold Out
Mariani Square Townhomes
Jackson St @ 7th/9th St
2004 166 45 1 BR lofts, 114 2 BR townhomes
$557,000 $647,000 1,300 1,500 $428 $431 Sold Out
Autumnvale Townhomes
N. Capitol Ave @ Trade Zone Blvd
2008 104 3 BR condos $483,000 $584,000 1,536 1,812 $314 $322 Sold Out
MetroPark Townhomes
McKee Rd @ N. Capitol Ave
2005 21 3 BR condos $550,000 $594,000 1,547 1,826 $356 $325 Sold Out
Baton Rouge Condos
N. Capitol Ave @ Mabury Rd
2005 92 2, 3, and 4 BR condos
$520,000 $601,000 1,504 1,669 $346 $360 Sold Out
Creekside Condos
N. Capitol Ave btwn Berryessa & Mabury Rds
2006 113 2, 3, and 4 BR condos
$536,000 $656,000 1,270 1,615 $422 $406 Sold Out
Source: Public Record via Zillow.com
1
Table 13. Selected Proposed Townhouse/Condo Projects In and Near the Berryessa Neighborhood
Project Name Location
Driving Miles to FM DUs proposed
Retail Proposed Status
Pepper Lane Berryessa Rd & Jackson St
1.0 371 two- and three-BR townhomes
30,000, plus a drive-thru pharmacy
Approved in 2007. Construction has started on first phase (299 units), which should be selling by early summer
Cornerstone Apartments
N. 10th St & Hedding St
1.3 53 two- and three-BR townhomes, affordable
None Under construction and currently leasing.
Messina Gardens Condos
N. Capitol & Mabury
2.3 46 two- and three-BR townhomes
None Approved but construction not yet started. Waiting for approval of more units for second phase.
River Oaks Condos River Oaks Pkwy & Research Pl
5.7 490 one- and two-BR condos
None Rezoning approved but project dropped before PD permit step.
Hyundai Site Mixed Use
Montague Expy & N. 1st
6.6 575 townhomes 2,700 Approved but developer dropped it in 2008 due to recession.
Sources: San Jose Planning Division 2011c, author interviews with project contacts and Google Maps.
Existing Supply
As indicated in Table 12, some of the more recent townhouse/condo developments hit the market in the boom years before our current recession. The six developments we selected as comparison projects total 587 units for the townhouse/condo market in and around the Berryessa neighborhood. Three of them are located along a VTA light rail line (along N. Capitol Avenue), and Montclair Townhomes is located a short drive or moderate walk to the proposed Berryessa BART station.
Pipeline Supply
For pipeline supply we looked at five permitted but as yet uncompleted projects, presented in Table 13. As can be expected during these times of tight credit, investor wariness and relatively high unemployment, the only
project that is near completion and actively going through a leasing process is the 100-percent affordable Cornerstone Apartments townhome development. The other projects have either been shelved or are moving along at a much slower pace due to lack of equity investment or a need to reconfigure the development and thus permits to more efficiently capitalize on land costs.
Transportation-Related Competitiveness
Given the San Jose’s goals to improve public transit service and connections in the city, and its vision of accommodating household growth in more compact transit-oriented developments, we decided to evaluate the competitiveness of the North Village townhomes to comparables (both the existing and pipeline projects already covered) on transportation-related factors.

27
Figure 7. Map of Selected Existing and Pipeline Condo/Townhome

28
Table 14. Comparison of Parking Provision, Distance to Freeways and Distance to Transit*
Project Name DUs Parking Provision Number of Spaces
Spaces / DU
Miles to Freeway
Miles to Transit
Subject Site Flea Market Transit Village, North Village Block 4
64 Attached garages 112 1.75 1.28 0.15**
Completed Projects Montclair Townhomes 91 Attached garages 150 1.65 1.29 0.24 Mariani Square Townhomes 114 Attached garages 205 1.80 0.95 0.62 Autumnvale Townhomes 104 Attached garages 152 1.46 0.57 0.18 MetroPark Townhomes 21 Attached garages 21 1.00 0.28 0.21 Baton Rouge Condos 92 Attached garages 116 1.26 0.80 0.42 Creekside Condos 113 Attached garages 133 1.18 0.53 0.16 Projects in Pipeline Pepper Lane 371 Attached garages, on-
street surface 1,015 2.74 0.40 0.70
Messina Gardens Condos 46 Attached garages, off-street surface
77 attached
25 off-street
2.22 1.05 0.32
Hyundai Site Mixed Use 575 Attached garages 890 1.55 1.82 0.34 River Oaks Condos 490 Attached garages 750* 1.53 1.80 0.64 Cornerstone Apartments 54 Attached garages 108 2.00 0.47 0.75 * Fixed-guideway transit stations only ** Assumes Berryessa BART station. Before the BART station opens, or if it does not materialize, the distance would be 1.57 miles to the nearest VTA Light Rail station. Sources: San Jose Planning Division 2011c, author interviews with project contacts, Google Maps, and Bing Maps
Predictably, if the Berryessa BART station is completed, the North Village townhomes will be the most competitive from the point of view of access to a fixed-guideway transit stop. Moreover, this translates into improved transit access to the entire five-county region that would eventually be served by BART, not just Santa Clara County and minor portions of San Mateo and Alameda Counties, as is the case with VTA’s light rail.
However, the North Village’s expected parking ratio will be higher than all but one of the existing competitors. This may help the project’s future marketing in light of the fact that it is also further away from freeways than existing competitors, but is inconsistent with the city’s goals of growing in a more compact and less auto-dependent fashion. In addition, the trade-off for developers is less saleable building space. With less parking the project may yield a higher number of dwelling units from which the developer or owner can earn sales revenue.
Summary of Costs (North Village, Block 4)
To gauge how desirable it would be for a developer and potential investors to undertake development of just the 64 units of stacked condos and townhomes in the North Village, we ran data about the project details and current market conditions through a pro forma. The detailed pro forma, which includes assumptions about market trends and cost components, can be found in Appendix C. Below is a summary of the key costs and feasibility numbers from the pro forma:
• Total Project Cost: $35.4 milliono Land Cost: $0.43 milliono Hard Costs: $28.2 milliono Soft Costs: $4.4 milliono Sales Costs: $2.4 million• Expected return on equity (ROE): 6.3%• Expected internal rate of return (IRR): -19.4%• Months to complete unit sales: 16
Given these numbers, the project is not a total loss, but does not represent a very competitive alternative for an investor’s money. The project’s IRR of 5.7% cannot compete with 13.8% total return achieved by the Dow Jones Industrial Average in 2010. A sensitivity analysis on the pro forma finds that, all else held constant:• If the land cost is reduced to $0 (which would be the case of it is donated or offered on ground-lease basis), the ROE reaches 87 percent and the IRR 20 percent.• If the per-square-foot construction cost can be reduced from $255 to $101 (through increasing the number of units per acre or downgrading the construction quality or on-site amenities), the ROE reaches 79 percent and the IRR 15 percent.• If the absorption rate increased from four units sold per month to 8 units sold per month, ROE jumps to 54 percent but IRR declines to -27 percent.
Since these none of these scenarios is likely to occur, developers should wait until market conditions improve before going all in on this project. Indeed, in an interview, one investor flatly stated that in San Jose there is

29
currently “no market for townhomes.” The Pepper Lane developer explained that that project’s 2007 approvals came at “a horrible time” in terms of available financing. Consequently, four years later, the developer is only now ramping up on the first phase of its construction.
The local market for townhomes may improve at a more or less rapid rate than in the region or the state overall due to the expected completion of the BART station. It is not within the scope of this report to analyze or predict such market movements, but interested developers and investors should take this dynamism into consideration as they continue to observe the economy. The Bumb family should be expected to be aware of all of these market factors, and this may be a major factor in their decision to keep the Flea Market operating indefinitely – for now.
Mixed-Use Commercial/Office Market Analysis
The proposed mixed-use commercial/office portion of the North Village development is depicted below.
With 120,700 s.f. of gross leasable area (GLA) proposed, the North Village shopping center would be of larger-than-average size for a neighborhood shopping center.6 Most such centers that have been built to date, however, do not include second-floor office space, which accounts
6 The largest U.S. neighborhood shopping centers in 2004 had approximately 92,000 s.f. in GLA in 2004 (ULI 2004).
for 9 percent of the GLA proposed at North Village. The North Village center would be anchored by a 64,000-s.f. tenant, likely a supermarket or large pharmacy. The North Village’s commercial GLA translates into 2.8 acres, which represents 7 percent of the 40 acres currently operated as the vending area of the Flea Market.
The North Village shopping center would not, of course, be entering a retail-free market. The Berryessa neighborhood is much like many other suburban communities in California in that it does not have a central business district, but instead is characterized by convenience and neighborhood shopping centers scattered between single-family or low-density residential subdivisions. While these centers provide neighborhood residents with the convenience goods and personal services they need, they are relatively homogeneous in the variety and quality of goods and services provided (e.g., there won’t be a significant difference in the types of milk, or their pricing,
between the Safeway in the northeast part of the neighborhood and the Trader Joe’s in the southwest). In addition, they are not meant to attract consumers from beyond a 10- to 15-minute drive (ULI 2004). The map below provides a visual sense of the distribution of the area’s shopping centers and their major anchor tenants.
Table 15 provides a count, by category, of the neighborhood-serving retail landscape around the Flea
Figure 8. North Village Commercial Building Layout Plan
Source: San Jose Department of Planning, Building & Code Enforcement, Planning Division, 2008

30
Market site. Since a lease with an anchor tenant is often what attracts potential in-line retailers to consider leasing at a shopping center, it makes sense to evaluate what specific anchor tenant might be interested in the space. The following site and market characteristics are relevant to this evaluation:• The 64,000-s.f. anchor pad is larger than most supermarkets, but too small to house something like a Costco or typical-sized Walmart.• The single warehouse retailer accounted for in the table above is Costco. The store is 1.7 miles’ driving distance from the Flea Market.• Of the six supermarkets accounted for in the table above, two are conventional western supermarkets (Safeway and Save Mart), one is geared toward the Asian
market and the remaining three are geared toward the Latino market.• The median size of a national-chain pharmacy/drugstore is approximately 10,000 s.f. (ULI 2004). Although the anchor pad for the North Village might be able to accommodate a pharmacy alongside a smaller-format supermarket, it does not appear to be designed to do so (given the single delivery bay), and in any case the neighborhood already has five pharmacies.
Given these factors, and some of the neighborhood demographics already reviewed, one idea is to attract a natural foods supermarket. Given the existing mix of grocers in the neighborhood, there is potentially an unmet natural-/organic-foods niche.
1
Table 15. Common-type Neighborhood Commercial Establishments, Berryessa Neighborhood Spatial extent: 2-mile radius around Flea Market address (1590 Berryessa Rd.) Category Tenant Type Number of Stores Goods and Merchandise Restaurants 279 Grocery 40 Dry Cleaning 21 Gas Station 15 Supermarket 6 Pharmacy 5 Warehouse 1 Personal Services Salons & Spas 48 Accountants 39 Banks & Credit Unions 29 Medical & Therapy 21 Dental 18 Insurance Agents/Offices 12 Video/Media Rental 10 Mail Services 7 Source: yelp.com 2011
Figure 9. Map of Major Retailers in Shopping Centers Surrounding Flea Market Site
Created with Google Earth

31
There are, however, many uncertainties. A basic analysis of the estimated demand, in dollars expended annually, for supermarket goods, and the estimated supply, in square footage of existing stores, for the entire city of San Jose indicates there may not be “room,” for more supermarkets in the short-term. For both 2010 and 2014 (using the ABAG projection of the city’s population), the results show the supply of supermarkets in San Jose exceeds demand. See Appendix C for details.
Even if the analysis had shown excess demand for supermarkets in the city, several factors may diminish the prospects for a natural goods tenant in the Berryessa neighborhood. The high proportion of immigrant residents in Berryessa may present marketing and messaging challenges, and capturing market share in the presence of existing ethnic-serving grocers may prove difficult. Freeman (2006) and Williams and Windebank (2002) have found that new retail developments can create a sense of exclusion among certain immigrant consumers, particularly in the case of retailers that appear to target higher-income shoppers or shoppers from outside their community. (See the discussion of “retail exclusion” in the Literature Review in Chapter One.)
The new development, coupled with BART, could put additional pressures on rents in the Flea Market or even capture some of the spending that would otherwise have occurred in the Market. Given these concerns, and the Bumb’s stated preference to keep the Flea Market open as long as possible, it is important that any new retail center be designed and tenanted so as to complement the Flea Market’s existing customer base and vending business.
Aside from these socioeconomic concerns, the physical attributes of the site may not be ideal. The anchor tenant pad proposed for North Village is quite a bit larger than the median size – 46,000 s.f. – of U.S. supermarkets (FMI 2011). It is unclear whether a single anchor tenant would be able to make use of the 64,000 s.f. offered. Also, the site is not located directly at, nor is it visible from, the major freeway intersections. The site exhibits right-turns in-and-out convenience for residents to the east who head west on Berryessa Road for their work commutes (likely in the morning given Silicon Valley’s employment centers are primarily west of here) or errand-running trips. For those heading east from the rest of Silicon Valley, most likely for weekday commute-to-home trips when doing grocery shopping might be more convenient, access from Berryessa Road into and out of the center would necessitate a series of left or U-turns. Further investigation is needed to determine whether these are indeed the traffic patterns and whether this would dissuade an anchor retailer from locating at the Flea Market site.
The importance of these factors may change with the presence of the residential units proposed for North Village, and will depend on whether the new BART station is already operating by the time the retail space is going to lease. The prospects for landing an anchor tenant, and the
overall success of the commercial space for North Village, will also vary depending on the continued operation the Flea Market just across the street. A more detailed market analysis for commercial development should be carried out before the determination of what types of commercial, and which specific tenants, would work at North Village.
Office
It is unusual for a suburban neighborhood shopping center to include office spaces, and more so for those office spaces to be on the second floor. Since the principal activity for this mixed-use site, as evidenced by the floor space allocations, remains commercial, we are going to assume that the market demand for the commercial space will be a predicting proxy for the demand for the 10,800 s.f. of office space. In other words, since it is unlikely that the center will be built without a commitment from an anchor tenant, there is little value in carrying out a demand and feasibility analysis for the office market for this mixed-use project.
Given the types of office tenants that would likely be able to make use of the North Village’ propose office space – neighborhood-oriented services such as accountancies, insurance agents, attorneys, real estate, or dental, vision or other small medical offices – we do not expect the office component of the development to generate a significant number of new jobs. The types of office tenants that would bring significant concentrations of jobs would be better served by the office/flex-space campuses located just to the northwest of the Berryessa neighborhood, an office/industrial area the city is trying to intensify and revitalize (City of San Jose 2009).
Summary
A full market study that includes the detailed demand and supply analyses, as well as financing considerations, for all portions and types of land uses proposed by the PD would result in more concrete estimates that the developer community might find useful and actionable. However, we do not attempt such a detailed analysis given the actual focus of our study, our space constraints, as well as acknowledgment that market estimates become less reliable the farther into the future they attempt to forecast demand and supply. Because the “transit” aspect of this proposed transit village - the new BART station - is not expected to come to fruition until 2018 at the earliest, market conditions and the region’s economy could change significantly during the intervening seven years, making today’s projections unreliable by the time development is ready to occur.
Moreover, it may take many more than seven years for development to “be ready” to occur, even after the opening of the BART station, and that development may not turn out looking exactly like the City or the landowners have envisioned and planned for. There is uncertainty, including on the part of Councilmember Chu, that single-family attached housing on the north side or even denser

32
residential development on the south side will appeal to households considering a move into the Berryessa neighborhood. If the market for medium-density housing fails to materialize, the likely outcome is that the land will continue not to be redeveloped or there will be pressures to build single-family detached units, in keeping with the development pattern that has already been established as marketable in the area.
If residential density remains low, there may not be enough population in the trade area to justify neighborhood shopping center anchor tenants to set up shop on the commercial portions of the site, especially considering nearby competition. And, as stated earlier, without a commitment from a large anchor, the smaller in-line tenants are unlikely to follow along.
If the experiences at existing BART stations that have been targeted for transit-oriented development is any
indication, the Transit Village at the Flea Market site should not be taken as guaranteed. The developments around the Fruitvale station has been completed, but it was heavily subsidized by the Oakland Redevelopment Agency and other government sources, as well as charitable contributions, and included affordable housing and community services. Union City’s BART TOD is still under construction and comprises all affordable rental units. The transit village for the MacArthur BART station in Oakland broke ground in May 2011, and also includes affordable units. Although the Flea Market plan is not required to include affordable housing, it may become more financially feasible for medium- or high-density development to move ahead with inclusion of affordable housing – including rental units. Eventual ridership observations at the Berryessa Station will provide insight into how attractive developers will find the site for market-rate transit-oriented development.

33
Recommendations
Given what we have learned about the social and economic importance of the Flea Market to customers and vendors, as well as the owning family’s plans to keep the market open indefinitely, we turn now to recommendations for making the most out of proceeding with continued Flea Market operation. The following recommendations are divided between those for The Flea Market, Inc., those for the Flea Market merchants, and those for the City of San Jose. They are presented with the ultimate goal of improving the Flea Market experience for shoppers, thereby enhancing business and revenues for vendors, and improving vendors’ participation in and contribution to San Jose’s small business network.
Recommendations for Flea Market Ownership
• Allow diversification of food items and onsite food prep - Current selection of concessioned food is limited, of questionable quality and somewhat expensive. The selection of food could reflect the “foodie” culture of the Bay Area, a culture that values experimentation and ingredients that are minimally processed or organic. It should also reflect the wide ethnic and cultural diversity of San Jose and Silicon Valley. There are potentially many talented chefs among the vendor population, or among the city’s immigrant communities in general, who would flourish in the food services industry if they only had a low-overhead place to enter the market. Only a small number of customers mentioned that they come to the Flea Market intending to buy prepared food, and the category lagged significantly behind produce, which was the most popular retail category among Flea Market customers. This suggests that there could be significant pent-up demand for prepared food.
• Consider special events like Eat Real (food truck gatherings) or regular/permanent food-vending operations like Brooklyn’s Red Hook Ball Fields – Given the success of such events around the Bay Area and elsewhere, accommodating them at the Flea Market could boost customer attendance and increase profits for The Flea Market, Inc.
• Parking charge - Many vendors identified the parking fee charged to customers as a significant disadvantage of the Flea Market’s management model. Indeed, the $5 weekend charge could cancel out the savings a shopper who seeks produce on the weekend could achieve by buying from the Flea’s Produce Row instead of a nearby supermarket. Both the weekend and weekday rates are high enough that customers - most of whom, again, are lower-income - must plan to visit, either because they are looking for specific things to buy or because they have decided with friends or
family on the Flea as a gathering spot for an upcoming get-together. The parking charges, thus, discourage spontaneous or last-minute decisions to stop by the Flea Market. This is unfortunate because spontaneous or last-minute visitors may be willing to spend as much as planned-visit shoppers.
• Reconsider and/or Audit Staffing Levels - One vendor has observed that on-site staff who are supposed to be “security guards” seem to outnumber the need for them, such that when this vendor sees them they are usually strolling in pairs making small-talk with one another. An audit of non-vending staff at the Flea Market may reveal areas where management can be saving money, and these savings can be reinvested into infrastructure and/or utilities improvements, or passed off to vendors in the form of lowered rents or to customers in the form of reduced parking charges.
• Improved and More Frequent Communication
» Internal Communications with Vendors – Several vendors reported that Flea Market “meetings” were sporadic and infrequent. Having regular meetings and correspondence (i.e. an internal newsletter) with the monthly-rent vendors would allow management to understand their needs more clearly and serve to build more trust. If management would like to pursue regular in-person meetings, they should give plenty of notice to the vendors of when such meetings will happen and be as specific as possible about discussion items to be covered at each meeting. This will help prevent attendance drop-out among vendors who don’t understand why their presence at meetings would be valuable or are dissuaded from attending by their friends in the vendor population who believe the discussions won’t be any use to them.
» Better communications with vendors would also help more of them know of plans to keep the Flea Market in place indefinitely, anticipate how the opening of the BART station could be beneficial to vendors and, thus, understand the possible advantages of staying in business through these challenging economic times, rather than giving up their businesses because they lack any idea what the future may hold.
» External/Public Communications – Some aspects of the Flea’s external communications are out of date or lack consistency. For example, as of mid-February 2011, every Wednesday and Friday became free-sell days for daily vending spaces. Management posted this information on the Flea’s Facebook page on February 15, so a visitor to the online social networking site or to the Flea’s website (which has embedded a “recent updates” feed from its Facebook page) would
Chapter 5: Recommendations and Areas for Further Study

34
know about this change in operations – if they were on these websites around the time of the Facebook announcement. However, from the “Vendors” page of the Flea’s website, one would still think that there is a charge to rent daily spaces on Wednesdays and Fridays. Another example is the recent addition of Thursdays to the Flea’s open days, plus the fact that every Thursday will offer both free stalls to daily vendors as well as free parking for customers. This was announced with a March 24, 2011, posting on the Flea’s Facebook page, but is not reflected on the Flea’s website.
» Language accommodations: There should be Spanish, Vietnamese and Chinese interpretation/translation assistance for internal communications, whether they are in-person meetings or printed correspondences. Some vendors complained that language accommodations have been inadequate in the past. For external communications, there should at minimum be Spanish language translations of all web pages, online documents and marketing materials, given the percentage of Latino customers.
• Marketing the Flea Market – Convey to the shopping and recreating public that it is a “destination” worthy of getting off the BART for.
• Coordination of a “clearinghouse” of Supplemental Nutrition Assistance Program/CalFresh services – Flea Markets with produce vendors can qualify as SNAP retailers. To qualify, the market manager and the produce vendors must establish a Farmers’ Market Business Association (FMBA). All the vendors would have to do is sign up to join the FMBA. The existing SJFM management would administer the point of sale and market scrip system in accordance with state regulations, and distribute proceeds back to the vendors through the FMBA. The Flea Market could also partner with local non-profits involved in food access issues, such as United Way Silicon Valley, to fund and promote the program.
• Rethink/Clarify strategy for vendor recruitment - Several vendors complained that the abundance of free-sell days unfairly increased competition within the market and put vendors who pay monthly rent at a disadvantage with regards to pricing.
• Better coordination with City to use and promote the Flea Market as a small business incubator site.
Recommendations for the City of San Jose
• Better coordination with FM to use/promote FM as incubator site: Many cities across the country are increasingly supporting incubator spaces to help develop new businesses. The City may be able to take advantage of the Flea Market’s existing infrastructure
and public profile to provide support for emerging entrepreneurs. Given the existing mix of existing vendors at the San Jose Flea Market and at other market and retail-oriented incubators elsewhere, the SJFM could be used to help incubate new businesses in retail, food service and the arts.
• Business entrepreneurship and training services outreach: The City has several programs related to helping small businesses get started and flourish in San Jose. Some of the City’s resources are related to assistance with compliance with regulations, others are programs in small business counseling, rebate, training, etc. Judging from our vendor interviews, the majority of Flea Market entrepreneurs have little to no knowledge of these services, much less how to access and take advantage of them. The City should increase efforts to educate vendors about, and encourage their utilization of, these services.
• Plans for incorporating vendors into other parts of economy if FM closure becomes imminent: This contingency plan could include finding a new location for the market elsewhere or helping non-store retailers transition into brick-and-mortar locations.
• Help establish and provide on-going support to worker centers – Worker centers are community-based, non-profit intermediary organizations that provide support services and advocate on behalf of low-wage, typically immigrant workers, including day laborers, street vendors, domestic workers. Currently, there appear to be two organizations that either operate workers centers or engage in similar advocacy work in San Jose: the St. Joseph Day Worker Center, and Working Partnerships. A worker center could potentially benefit not only the Flea’s vendors, but other immigrants and people of color in low-wage contingent jobs or self-employment (Fine 2005).
• Help promote the Flea Market as a unique destination in the region, especially in run-up to the BART station opening.
Recommendations for Flea Market Vendors
• Organizing as a way to more effectively deal with owners, the city – Self organizing into a cooperative or a merchants’ association could help the disparate vendors to identify as a group and organize around shared values and goals. The group would also help them to overcome perceptions that their problems are unique and personal, rather than collective. An organization, regardless of structure, can also take on a number of functions commonly provided by workers centers, including advocacy and cooperative business assistance programs such as financial planning, accounting and tax assistance, legal aid, health care, ESL and/or Spanish language classes, and microcredit facilities.

35
Areas for Further Study
As evidenced by our review of the literature, the number of formal studies into the many facets of temporary or semi-permanent, open-air markets in the United States has been modest, if not minimal. Our study of the San Jose Flea Market attempts to contribute to the body of work available, but many questions remain. The research avenues suggested below would contribute to the knowledge about both the San Jose Flea in particular as well as American flea markets and bazaars more broadly.
• Further sampling for the Customer Survey to specifically target the people who visit the Flea Market on foot, bicycle or via public transit.
What geographic range is covered by their home locations? Are their motivations for visiting the market different than drivers’, and do they exhibit different browsing and purchasing habits? Do they have a higher level of awareness of the future BART station and transit village plans, and/or stronger opinions about it? Do they differ significantly from drivers in terms of race, age, household size or household income?
• A more detailed historical analysis of the vending mix at the San Jose Flea Market.
For how long has it been dominated by apparel and produce? Over time, what have other top categories been? Did the shifting of the ratios parallel shifts in the broader consumer market, i.e. were there more furniture vendors before IKEA landed in California? Did the Flea have more electronics vendors before the advent of category-killers like Best Buy? Did the shrinking of the spatial vending area coincide with the growth in online retailers like Amazon.com and eBay or Craigslist?
• A comparison of the San Jose Flea Market to other Bay Area flea markets frequented by customers.
How do the other flea markets compare to the San Jose Flea Market in terms of size, number of vendors, days/seasons of operations, management format and opportunities for on-site activities other than shopping? How are their goods and services categories similar to or different from that of the San Jose Flea Market’s? How do they compare in terms of public transit (in-)accessibility? What similarities or differences are there in their customer bases?
• Interviews with residents in the Berryessa neighborhood.
Why did they choose to move to the neighborhood and how do they feel about having the Flea Market as
a neighbor? How do they feel about the future BART extension and how do they expect to use (or not) the future Berryessa station? What are their preferences for redevelopment alternatives (or status quo) of the Flea Market site?
• How to integrate a permanent open-air market into a transit village project.
Neither the rezoning of the Flea Market site for a mixed-use transit village nor the approved site plan for the north parking lot specifically address whether the Flea Market will be retained on-site. Future plans for the redevelopment of the market should address the future of the Flea Market by insisting that the urban design of the site can accommodate a significant open-air public market. Additional care needs to be taken in the design of new brick-and-mortar retail space so that the new retail development is symbiotic with the open-air market, rather than competitive with the market or hostile to its presence.
• Updated and more in-depth analysis of the market demand for, and competition with, the residential units proposed for the North Village as well as the rest of the Flea Market planned development.
As mentioned in Chapter 4, by the time the housing market regains pace, the market analysis performed here may be out of date and inaccurate. Continued observation of the market is needed, as is a more fine-tuned analysis into the particular types of housing units that will sell well in the Berryessa neighborhood. The analysis should also be assessed against the City of San Jose’s goals to both accommodate future population and household growth, as well as grow “smart” by putting more housing and jobs at or near multi-modal transportation hubs.
• Comparison case studies of flea markets in other parts of the U.S.How are customer bases similar or different? What makes those markets popular? Do merchants at those markets share the same motivations for going into vending? What industries dominate the communities in which those flea markets are sited?
• Health Impact Assessment of the transit village development plan.What role does the Flea Market, particularly its Produce Row, play in the health and well-being of the customers who shop there? What about its physical and mental/social health impacts for customers who use the Flea Market for recreational or social purposes? If the Flea Market were to be moved or eliminated, what would the physical, mental and social health impacts be of such a change and which of the market’s users would be most affected?

36
The San Jose Flea Market is a unique institution that has considerable cultural, social and economic significance for residents of Northern California. Over the past five decades, it has evolved into something much more than just a market for inexpensive new and used consumer goods. It has become a vital, family-oriented public space, particularly for Latino and Asian immigrants. It is home a unique retail environment with goods and services not found elsewhere in the Bay Area, and in a shopping environment that accommodates people of all walks of life. Over the years, it has become a job center that accommodates hundreds of local entrepreneurs, most of whom are San Jose residents and low- and moderate-income immigrants. For hundreds, if not thousands, of other workers, the market provides part-time jobs in street vending, retail sales, security, maintenance, food service and janitorial work. Even though it may not be as visible as Ebay or Hewlett Packard, the Flea Market is one of San Jose’s largest employers and is possibly its largest source of jobs for immigrants and people of color.
Yet the site is also located adjacent to the proposed Berryessa station on the Silicon Valley BART extension. This report has detailed the importance of the market to its customers and vendors. The site, however, is also home to 120 acres of undeveloped, transit-accessible land that could accommodate significant new mixed-income housing that will serve future residents of San Jose.
As the San Jose Flea Market enters its sixth decade of operations, it faces the dilemma of how to adapt for the twenty-first century. Increasingly, this means not only diversifying its offerings to compete with Ebay and Craigslist, but also figuring out how to accommodate local, regional and state goals toward smart growth. Going forward, the challenge is not only to help the San Jose Flea Market adjust to a new consumer environment, but also to accommodate the idea of the open-air public market into a master planned transit village. It is the challenge of preserving existing community assets while simultaneously providing the foundation for a more sustainable future, both for the Flea Market’s existing and future customers.
ConclusionsConclusionsConclusions
Photo credit: sfchamber.visitortourist.info.com

37
Basker, E. 2005. “Job Creation or Destruction: Labor Market Effects of Wal-Mart Expansion.” The Review of Economics and Statistics. Vol. 87, No. 1. 174-183.
Bates, T. 1997. “Entrepreneurship as a Route to Upward Mobility among the Disadvantaged.” Race, Self-Employment, and Upward Mobility: An Illusive American Dream. Baltimore: The Johns Hopkins University Press. 201-224.
Bernick, M., R. Cervero, and V. Menotti. 1994. Comparison of rents at transit-based housing projects in northern California. Berkeley: Institute of Urban and Regional Development, University of California. Working paper No. 624.
Berryessa Citizens Advisory Councill. 2011. Website. http://bcaconline.org/index.html.
Bloomekatz, A. 2011. “California cities threaten to challenge census, which shows little growth.” Los Angeles Times. April 24. http://latimesblogs.latimes.com/lanow/2011/04/cities-threaten-to-challenge-census-after-numbers-show-little-population-growth.html.
Boarnet, M.G. et al. 2010. Retrofitting the Suburbs to Increase Walking: Evidence from a Land-use-Travel Study. Urban Studies. 2011 48: 129-159.
Bridges, B. 2011. (Real Estate Development Partner at Wilson Meany Sullivan.) Interview with April Mo on May 2.
Bumb, T. 2011. (Spokesperson for The Flea Market, Inc.) Interview with Sean Campion and April Mo on February 22.
Center for Transit-Oriented Development. 2010. Website. http://ctod.org/portal/.
Cervero, R., M. Bernick, and J. Gilbert. 1993. Market Opportunities and Barriers to Transit-Based Development in California. Working Paper 621. Berkeley: Institute of Urban and Regional Development, University of California.
Cervero, R., and K. Kockelman. 1997. Travel Demand and the 3 Ds: Density, Diversity, and Design. Transportation Research D. 2D, 3: 199-219.
Cervero, R., and M. Duncan. 2002. Transit’s Value-Added Effects: Light and Commuter Rail Services and Commercial Land Values. Transportation Research Record. 1805. Paper No. 02-2273.
Cervero, R. et al. 2004. Transit-Oriented Development in the United States: Experiences, Challenges, and Prospects. TRCP Report 102. Washington: Transportation Research Board.
Chapple, K., and R. Jacobus. 2009 “Retail Trade as a Path to Neighborhood Revitalization.” In Urban and regional Policy and its Effects, eds. Nancy Pindus, Howard Wial, and Harold Wolmn. Washington: Brookings. 19-68.
Chu, K. 2010. (San Jose City Council Member, District 4.) Interview with April Mo on December 10.
Cronin, P. 2011. “Census error gave wrong Hampton population.” Seacoastonline.com. April 22. http://www.seacoastonline.com/apps/pbcs.dll/article?AID=/20110422/NEWS/104220324/-1/NEWSMAP.
Elmer, V., A. Thorne-Lyman, and D. Belzer. 2006. Fiscal and Land Use Policy in California: A Case Study of the San Jose Employment Land Conversion Analysis. Berkeley: Institute of Urban and Regional Development, University of California.
Fine, J. 2005. “Worker centers: Organizing communities at the edge of the dream.” EPI Briefing Paper #159. December 14. http://www.epi.org/publications/entry/bp159/.
FMI (Food Marketing Institute). 2011. Supermarket Facts. Webpage. http://www.fmi.org/facts_figs/?fuseaction=superfact.
Freeman, L. 2006. There Goes the Hood: Views of Gentrification from the Ground Up. Philadelphia: Temple University Press.
Grady, S., and G. LeRoy. 2006. “Making the Connection: Transit-Oriented Development and Jobs.” Good Jobs First. March. http://wwww.goodjobsfirst.org/sites/default/files/docs/pdf/makingtheconnection.pdf.
Handy, S. 1996. Urban Form and Pedestrian Choices: Study of Austin Neighborhoods. Transportation Research Record. 1552: 135-144.
Harper, W. 1999. “Family Feud.” MetroActive. July 1-7.
Hum, T. 2006. “New York City’s Asian Immigrant Economies: Community Development Needs and Challenges. Jobs and Economic Development in Minority Communities, eds. Paul Ong and Anastasia Loukaitou-Sideris. Philadelphia: Temple University Press. 176-212.
King, D. 2011. (Executive Director of the Hispanic Chamber of Commerce Silicon Valley.) Interviews with April Mo on January 28 and February 25.
References

38
Klein, N. 2011. (Deputy Director of San Jose’s Office of Economic Development.) Interview with Sean Campion and April Mo on February 2.
Lander, M. 2011. (Project Planner at HMH Engineers.) Interview with April Mo on April 28.
Light, I., and C. Rosenstein. 1995. Race, Ethnicity, and Entrepreneurship in Urban America. Hawthorne, NY: Aldine de Gruyter.
McNeal, A.R., and R.P. Doggett. 2007. Bethesda, other areas, use public transit stations for neighborhood renewal. Cities and Cars: A handbook of best practices. 54-58.
Morales, A. 2011. (Professor of Urban and Regional Planning at the University of Wisconsin, Madison.) Interview with Sean Campion and April Mo on February 17.
Neale, C. 2011. (Vice President of Development at The Core Companies.) Interview with April Mo on May 2.
Neumark, D., J. Zhang, and S. Ciccarella. 2008. “The effects of Wal-Mart on local labor markets.” Journal of Urban Eco-nomics. Vol. 63, No. 2. 405-430.
Ong, P., and D. Miller. 2002. “Economic Needs of Asian Americans and Pacific Islanders in Distressed Areas.” Working Paper #38. Ralph and Goldy Lewis Center for Regional Policy Studies. July.
Picazo, R., H. Servin, and A. Kwak. 2009. La Pulga, a short-film: BART Threatens the San Jose Flea Market. Urban Habitat.
Pineda, M. 2011. (Deputy Director of San Jose’s Department of Transportation.) Interview with Sean Campion and April Mo on February 2.
Pizarro, S. 2010. “After 50 years, San Jose Flea Market seems to be growing in value.” San Jose Mercury News. October 13.
Porter, M. 1995. “The Competitive Advantage of the Inner City.” Harvard Business Review. Vol. 73, No. 3. May-June. 5-71.
Prevetti, L. 2011. (Assistant Planning Director of San Jose’s Office of Planning, Building, and Code Enforcement.) Inter-view with Sean Campion and April Mo on March 11.
Reed, C., and K. Chu. 2007. Memo to [San Jose] City Council regarding PDC03-108 (Flea Market Rezoning). City of San Jose. August 10.
Replogle, M. 2003. “Clean Air and Transportation: Vital Concerns for TEA-21 Reauthorization.” Testimony presented at the Committee on Environment Public Works; Subcommittee on Clean Air, Climate Change and Nuclear Safety. U.S. Sen-ate. March 13. http://edf.org/documents/2698_Testimony03_03.pdf.
Salum, E. 2011. (Acquisitions & Entitlement Manager at Pulte Homes Corp.) Interview with April Mo on April 29.
San Jose, City of. 2009. North San José Area Development Policy Neighborhoods Plan. November. http://www.sanjoseca.gov/planning/nsj/docs/NSJ_Neighborhoods_Plan.pdf.
San Jose, City of. Department of Planning, Building & Code Enforcement, Planning Division.
———. 2008a. The San Jose Flea Market North Village Vesting Tentative Tract Map (Condominium Purposes), PT08-019. Prepared by HMH on March 17.
———. 2008b. Planned Development Permit for a Mixed-Use Commercial Transit Village on the San Jose Flea Market – North Village, PD08-027. Prepared by HMH on March 28.
———. 2011a. (San Jose) Fact Sheet. May.
———. 2011b. Zoning Map.Sections 51 and 67. January 14 update.
———. 2011c. Development Activity Highlights and Five-Year Forecast (2012-2016). February.
San Jose, City of. Office of Economic Development. 2010. San Jose Economic Strategy 2010-2015. http://www.sjeconomy.com/publications/gfb2w/Strategy.Final.2010.pdf.
Slayer, O. 2011. (Transportation Planner with the San Jose Department of Transportation.) Interview with April MoonMarch 16.
Song, Y., and G.J. Knaap. 2004. Measuring the effects of mixed land uses on housing values. Regional Science and Urban Economics. Vol. 34, Issue 6. (November): 663-680.
Tam, E.G. 2003. Market analysis for the MacArthur Bart Transit Village project. Berkeley: University of California.
Terranomics Retail Services. 2010. “Santa Clara Retail Report: Year-End 2010.” http://www.terranomics.com/research.asp?Report=Santa+Clara+County+Shopping+Centers+Report+Mid%2DYear+2010%2Epdf&DisplayName=Santa+Clara+Shopping+Centers+Report+Year%2DEnd+2010.
The San Jose Flea Market, Inc. 2010. The San Jose Flea Market. Website. http://sjfmskins.t-worxsite.com/home.aspx.
ULI-the Urban Land Institute. 2004. Dollars & Cents of Shopping Centers: 2004. Washington: ULI.

39
U.S. Environmental Protection Agency. 2010. Smart Growth. Website. http://www.epa.gov/dced/index.htm.
Valenzuela, A. 2006. “Economic Development in Latino Communities: Incorporating Marginal and Immigrant Workers.” Jobs and Economic Development in Minority Communities, eds. Paul Ong and Anastasia Loukaitou-Sideris. Philadelphia: Temple University Press. 141-158.
Williams, C.C., and J. Windebank. 2002. “The ‘Excluded Consumer’: A Neglected Aspect of Social Exclusion?” Policy and Politics. Vol. 30, No. 4. 501-513.
Zhou, Y. 1998. “How do Places Matter? A Comparative Study of Chinese Ethnic Economies in Los Angeles and New York City.” Urban Geography. Vol. 19, No. 6. 531-533.

40
Appendix A

41
Topics covered by the survey
The purpose of the customer survey was to gather infor-mation about customers’ personal characteristics (facts) and their past and present activity patterns (behaviors). More specifically, we were seeking to identify different user groups, and how these groups access and use the flea market in different ways. We speculated that such group-ings could include residents from the surrounding neigh-borhood versus regional shoppers, regular shoppers versus occasional shoppers, shoppers from different socioeconom-ic and ethnic groups, shoppers who arrived by car versus those who arrived by bus or bike or walking, etc.
Flea Market Customer Survey
Customer Survey Questionnaire
Introduction/Pitch: • Hello, my name is _________. I am a UC Berkeley student doing a survey on transportation
to and usage of the flea market. May I ask you some questions? • Great – thank you. I have a short set of questions. As we go through, I will record your
answers for you. 1) [A] How often do you come to the flea market?
□ Weekly □_______ times/month
□_______ times/year
□Almost never // This is first time (0-‐2 times/year)
[B] How did you get here today? □ Car □Drove self □Dropped off
□Bus □Bike □Walked □other: ________________
[C] Is this your usual way of getting here? □ Yes □ If not, by:_______________________________________________
2) What things do you usually shop for here? [If this is first time:] What are you shopping for today? [Check all that apply. Show Answer Categories Card, allow respondent to point out answers.] □ Produce (fruits, nuts, vegetables, spices; fish)
□ Apparel, Accessories, Jewelry
□ Furniture, Home & garden supply
□ Toys, Music, Games, Movies
□ Electronics, Appliances
□ Food/ Beverage (Prepared, concessions)
□ Gifts, collectibles, antiques, art
□ Personal care, Cosmetics
□ Tools, Hardware, Auto supply
□ Services (e.g. massage, repairs, engraving)
□ Other: ________________________________________________________________
Since we were focused on gaining insight into several as-pects of the economic and social impacts of the flea market, and we wanted to avoid survey fatigue, we did not pur-sue the whole gamut of topics that could have also been included in the survey. This would have included broader or more detailed information on where else customers shop (we had just one question about other flea markets they visit), their employment status or occupation, whether or not a customer had ever sold anything at the flea market, or their familiarity with the public transit options and routes for accessing the flea market.

42
3) [A] In terms of the things you shop for, how important is price in your decision to
shop here, rather than somewhere else? □ Important □ Somewhat
important □ Not important □ Not sure
[B] In terms of the things you shop for, how important is distance from home in your decision to shop here, rather than somewhere else? □ Important □ Somewhat
important □ Not important □ Not sure
[C] In terms of the things you shop for, how important is access by public transportation in your decision to shop here, rather than somewhere else? □ Important □ Somewhat
important □ Not important □ Not sure
4) Do you frequent any other flea markets in the Bay Area, such as the San Jose
Capitol Flea Market? □ No, this is the only flea market I frequent. □ Yes, the other flea market(s) is/are:
5) Other than shopping, what else do you enjoy doing at the flea market? [E.G. Eating at the restaurants, recreation for kids, watching music performances, selling, talk to friends, attend health or craft fairs]
6) [A] Would you continue to shop at this flea market if were moved to another site in San Jose, such as the County Fairgrounds in south San Jose? □ Yes □ No □ Maybe/Probably/Not sure
[B] What if it were moved to a site outside of San Jose, for example to Gilroy? □ Yes □ No □ Maybe/Probably/Not sure
7) [A] Have you ever used BART?
□ Yes □ No □ Maybe/Probably/Not sure
[B] If Yes, would you say you use BART frequently? □ Yes □ No □ Maybe/Probably/Not sure
8) You might already be aware there will be a BART station here in the future.
[A] When the station is complete, would you use BART to come to this flea market for shopping? □ Yes □ No □ Maybe/Probably/Not sure
[B] If Yes, would you shop at this flea market more often if there is a BART station here? □ Yes □ No □ Maybe/Probably/Not sure
9) If this site were turned into homes and a shopping mall, would you come here to
shop? □ Yes □ No □ Maybe/Probably/Not sure

43
Great. Now, to better understand the results of our survey, I need some basic demographic information. 10) How many people are in your household? _________________
11) What is the zip code where you live? __________________
12) What is your age? __________________
13) How do you identify your race or ethnicity? [Check all that apply. Write in
elaborations.] □ African-‐American/Black □Asian □Latino □White □ Other:_________________
14) What was the total income from all members of your household in
2009? [Show Answer Categories Card.] Please include wages from work, side jobs, social security payments, gifts, etc. □ <$25,000 □$25,000-‐$49,000 □$49,000-‐$98,000 □$99,000 or more
Inform participant that the interview is done. Thank him/her for their time. Surveyor: Please mark whether respondent is: □ Female □ Male □ Unsure
Sampling Strategy
Given the diversity of the customer base, we expected we would face multiple language, literacy and cultural barriers. We anticipated that language barriers and issues of trust could affect response rates and lead to non-response bias. To mitigate against these effects and try to capture as wide a range of customers as possible, we had our survey translated into Spanish, Vietnamese and Chinese, and hired five student research assistants who could deliver the survey in one of these non-English languages. We also had, for one day, the help of a volunteer who is a native Spanish speaker.
The definition of a flea market “customer” is broad both demographically and temporally, but we obviously were only able to survey those that enter the flea market on the same dates we went there to survey and during the same season, not those who will visit at different times of the year. Likewise, we were only be able to survey the customers who visited the flea market at the same time of day that we were there, not any that visited earlier or later on the same day. Our sampling method therefore had elements of purposive and convenience sampling. We may be able to generalize our results to the customer sub-populations to the extent that they visit the market during similar times of the week or of the year that we made our surveying runs.
We also employed a modified version of the quota sampling method by stationing survey takers at the flea market’s bus stop, parking lot and pedestrian entrance.
This method helped us to identify and survey the minority of shoppers who arrived by public transportation or on foot. We considered placing survey takers at a variety of strategic locations within the market, such as the produce section, the furniture section and the entertainment areas, to survey customers who shop for specific items or those who use the market as recreation for themselves and/or their families. In the end, we were able to use this stationing method to some extent, after we met and talked with the manager and owner of the flea market and were allotted three spaces in differing sections of the market (Produce Row, The Pavilion and a section of miscellaneous, weekends-only vendors) from which to conduct our survey.
Another option was to survey customers using a purely probabilistic sampling method by intercepting every Nth customer at strategic points throughout the market, but there were at least two problems with this method: (1) flea market security personnel not allowing our survey takers to be stationed at locations ideal for this kind of sampling, and (2) certain individuals getting counted as the Nth customer more than one time but having taken the survey the first time they were intercepted.
Survey Mode
For our customer survey, the most appropriate survey mode was short in-person interviews done on-site.
The main drawback for each of the other possible modes is that they would have required some kind of master list

44
of names with contact information. There isn’t any pre-existing list of all the market’s customers over time (this would be nearly impossible, logistically, to compile), and even if the company managing the flea market kept such a list it might not have been politically or economically feasible to get this list from them.
Specific to the Internet (or email) survey mode, preliminary visits to the flea market indicated that some segments of the customer population may not be as well connected to the web as, say, the Berkeley student population. Even if younger generations of customers’ family members are Internet and email savvy, they are not necessarily the ones making the purchasing decisions of their household.
Phone and mail modes would have saved time and labor costs, but with a printed mail-in survey there may have been challenges related to illiteracy among certain segments of the customer population, and with phone calls we may not have been able to build the level of trust an in-person interview afforded.
Pretesting
On a Sunday in October 2010, we conducted a pre-test of our customer survey at the Berkeley Flea Market, located in the parking lot of the Ashby BART station.
We did not observe any obvious problems among our three test cases with regard to question comprehension.
One respondent experienced difficulties with memory retrieval when asked what she shops for at the flea market (Q. 2). As a result, we decided to show all possible answer categories for this question, as well as the question about household income, on a separate piece of paper that the surveyor keeps with them at all times. The respondent would point to their choice(s) on this card, and the surveyor would mark them on his/her survey sheet. In the end, we had these separate cards available, but the survey takers found it was easier and more efficient simply to show them the categories printed on the main survey sheet, instead of fussing with the answer card.
Judgment formation may have been somewhat of an issue for the question asking whether respondents would continue to shop at the flea market if it were moved to someplace else in Berkeley. This is likely due to the fact that Berkeley is a small city that is already built out, surrounded by communities that are similarly urbanized, without large tracts of land that serve as potential flea market grounds. San Jose has a much larger geographical footprint and we anticipated there would not be the same initial uncertainty among respondents to this question at Berryessa.
The pre-test also revealed that an original version of Q. 3 was quite difficult from the surveyor’s standpoint to ask. The original question was worded as follows:
If the flea market were not here, how difficult would it be for you to shop for those items at other places based on:
Distance from your home? (Easy) 1 2 3 (Difficult)
Access to transportation? (Easy) 1 2 3 (Difficult)
Prices? (Easy) 1 2 3 (Difficult)
Other factor:____________ (Easy) 1 2 3 (Difficult)
Bias and Error
Coverage Error
Our survey only captured the customers present at the flea market at the specific time and the specific day that our research team was there. We could not identify shoppers who shop at different times (early morning or late night) or only at specific times of the year. Similarly, because we were limited by market policy to certain spaces within the market, we may have missed the kinds of shoppers who purposefully avoid those sections or simply were not shopping that day for things sold in those sections.
Sampling Error
We may not have a representative proportion of responses from shoppers who arrived by bus, bicycle or on foot. Given the limited staff resources we had, there was a trade-off between getting as many responses as possible from our stations within the flea market, versus stationing two or three surveyors who speak the range of possible languages that would be spoken by the small number of customers who arrive/depart by bus (which would mean they are idle for a large part of the time since bus arrivals on the weekends are every 30-90 minutes depending on the route). At any rate, given the Flea Market’s strict non-solitication policy, we were also restricted to several dedicated sites within the market.
Nonetheless, based on our first impressions, we believe the large majority of shoppers arrive by car. Though we may not be able to draw conclusions about the shopping habits of bike/ped visitors and public transit users, we can still point to the fact that the flea market is largely an auto-oriented venue.
Non-response Error
We have identified several unit non-response issues. One of these relates to the very small sample of Asians surveyed. Although our sample size of Asians plus other non-Latinos is likely representative of the actual weekend patronageatthe flea market, within the subset of non-Latino respondents the proportion of Asian respondents does seem low. We believe this is due to cultural reticence against sharing personal information with strangers, language barriers (we had two Vietnamese speakers and a Mandarin speaker, but not Cantonese or Tagalog speakers), and perhaps age (the older Asians were much less likely to speak English, thus confounding the language barrier

45
issue).As already alluded to, there may also have been systematic non-response from older (55+ years of age) flea market customers. Due to physical limitations, older shoppers may keep to sections of the market where they know they can find what they are looking for, rather than spend several hours strolling through the whole of the market. This would mean that older shoppers may have been less likely to pass by our survey “stations.” On the other hand, even if they had happened to pass by our stations, they may have been less likely to agree to participate in our survey if they dislike talking to younger people, which of course would confound the cultural and language barriers for those who also don’t speak English, Spanish or Vietnamese. It is also possible that younger shoppers were more willing to talk to our college-aged survey team, or that our survey team was more likely to approach shoppers closer in age to them.
A third type of unit non-response relates to visitors who may have been in too much of a hurry to do the survey. We, in fact, did get a fair share of people who stated being in a hurry as their reason for declining to participate, but we had no way of determining the honesty of these claims. But for those who really were, and usually are, in a hurry, the risk is that they are among those most likely to care about the flea market and be detrimentally affected by it moving.
Our ratio of female respondents to male respondents is likely lower than the true population. This may have had to do with sampling error in that our male survey administrators may have felt more comfortable approaching the male of a couple or family where both the man and woman were present. We may also have underrepresented monolingual Spanish-speaking shoppers (who form a large majority of the Latino customer base) on our first survey day, when we had no fluent Spanish speakers among our team.
We suspect that item non-response may have affected several questions. We found that some survey respondents were unwilling to disclose their income. Among the non-responders, we also do not know how likely shoppers at different income levels are to decline to provide their income. There were also cases where the respondent did not know the answer to the household income question.
Measurement Error
Some customers were unwilling to disclose their incomes, as discussed above. However, many respondents may have given their personal income rather than their household income. A number of respondents also gave their weekly or monthly income, rather than annual income. Though this will complicate our analysis of how shoppers at different income levels use the market, it is likely that most of these respondents fall into the lowest income category, since most report earning $500 per week or less.
A number of respondents also either did not know their ZIP code or gave partial or incorrect responses, including four-digit and six-digit responses.
Social Desirability Bias
For our questions about customer attitudes toward BART, although many shoppers had not ever used BART, majorities of them responded that they would take BART to come to the flea market and would shop more often if the line were extended. These respondents may be overstating their willingness to use public transit, especially if they are aware of or understand the social desirability of reducing auto travel and vehicle emissions. The share of customers responding positively vastly outnumbers the share that lives along or near the proposed BART corridor, so their eventual use of the BART extension might not actually reflect the responses they gave.

46
Flea Market Vendor Survey
Topics Covered by the Survey
The purpose of the vendor survey was to learn about not just the financial and logistical workings of the flea market from a merchant’s point of view, but also about what characterizes the people who decide to go into this unique type of business endeavor.
Because the “story” each vendor has behind their motivation to go into flea market vending can be very different from that of the next vendor, and because there covered.
Vendor Interview Script
1. How long have you been selling at the Flea Market? 2. Tell me about how you decided to become a Flea Market merchant?3. Had you considered vending anywhere else?4. How did you decide to sell (category of good/service sold)? How did you initially go about finding your goods? Is that how you do it today?5. Is/Are your supplier(s) in San Jose?a. If not, where is/are your supplier(s)?6. Is this your only stall?7. How many days per week do you sell at the market? 8. Are you here year-round?9. How has business been for you lately?10. Do you vend anywhere outside of this flea market? If so, where?11. Is this business your only source of income? If no, what else do you do?12. Do you live in San Jose? a. If yes, what neighborhood?b. If no, where?13. What are your sales for a good day/week at the Flea Market? What about a bad day/week?14. Are you making money? (Are you meeting costs? Making any kind of profit?)15. What are your biggest business expenses?16. How many people work for you here at the Flea Market?a. Are any of them family members?17. If you were managing this flea market, would you make any changes to the way it operates to improve business?a. If yes, what changes do you have in mind?18. Have you heard about the proposal to build a new BART station here? a. How do you think it will affect your business?19. (For produce section only) Do you take food stamps/WIC?a. If no, why not?b. If yes, what percent of your customers use them?20. Why do you think your customers shop here (i.e., instead of at a big-box, or chain, store)?21. What is your interaction with the city government like? Has permitting and licensing been easy? Has business start-up or development training or assistance ever been offered to you? Do they seem sensitive to your needs?
is usually proprietary information involved in a private business enterprise, the approach we took with the vendor interviews was very different than that we employed for the customer survey. We designed the vendor interviews to be more open-ended conversations. We prepared an interview script (below), which served mainly to remind the interviewer what information s/he needed to get, but ultimately letting the interviewer decide exactly how to word the questions and in what order the topics would be

47
Survey Mode
For the vendor interviews, the most appropriate mode was on-site, in-person, one-on-one conversations with each vendor.
We had considered conducting focus groups, but decided against this mode because of our limited time and budget. Even if we had managed to coordinate the gathering of adequate numbers of vendors over a series focus groups, the ethnic – and therefore lingual – diversity of the vending population may have led to some members being more or less reticent about speaking up than others. In focus groups, it is easy for the conversations to be led and shaped by the most gregarious speakers, but it was important for us to hear as wide a range of stories as we could about each vendor’s motivations and experiences. If we had not already formulated our research questions, a focus group may have been useful in helping us to identify issues to examine. But we already knew our questions and simply needed individual vendors’ responses to them.
The other mode we considered was interviewing by telephone. This would have been a back-up strategy if the on-site, in-person mode was not yielding responses at the rate hoped for. We prepared the team of interviewers to be ready to ask vendors who either got through part of the interview, or who did not want to answer questions on the spot but were willing to receive a follow-up call or visit, for names and phone numbers. As it turned out, we ultimately did not need to employ this strategy, as vendors were either unwilling to engage in the interview at all or were willing to get through all the topics of questionnaire in one interview.
Pretesting
We did not carry out a strict pretest of the vendor interview script since, unlike the customer survey, the vendor interviews were meant to be looser-structured conversations where the interviewer was encouraged to change the wording or order of questions as s/he saw fit to keep the vendors’ attention and interest, and develop their trust.
On the first day of vendor interviews, however, we did have interviewees regroup after each team had done their first one or two interviews. It was during this day-of regrouping that we informally discussed any problems with question comprehension. We found that for Q. 15, vendors don’t usually think of anything but rent, so interviewers needed to prompt them by suggesting other types of business expenses to think about. We also found that Q. 21 was sometimes difficult for vendors to comprehend and/or for interviewers to reword for the benefit of vendor comprehension. For neither of those two questions, however, were the difficulties so insurmountable as to justify eliminating them from the interview script.
A question we did eliminate was one that asked if the vendor owned any real property in San Jose. The reactions we got of the vendors we did ask this of indicated this was information that was too private to share with researchers they had never met before. The interview script above reflects this elimination.
Sampling Strategy
Language barriers and issues of trust were our main concerns in proceeding with the vendor interviews. In February 2011, we performed a visual “census” of the vendor population from which we determined that, other than English, the languages most spoken by the vendors would be Spanish, Vietnamese, Chinese and Korean. We also determined that the stall spaces were roughly categorized into the following types of merchandise:
Census of Vendor Stalls
Category Stalls Share
Apparel 455 46% Furniture 123 12% Household/Home Goods 80 8% Miscellaneous 57 6% Auto Accessories 51 5% Toy 44 4% Personal Care 39 4% Electronics 35 4% Gift 22 2% Tools 21 2% Video Games/Music 17 2% Services 13 1% Food 12 1% Plant 10 1% Art 6 1% Luggage 4 0% Pets 2 0% Bicycles 2 0% Appliance 1 0% Car Dealer 1 0% Sports 1 0%
Total 996 100%
Our strategy was to get approximately 30 responses, with categorical proportions roughly equal to the vendor census and across the main languages. We re-engaged two of the student research assistants we had hired – one a Vietnamese speaker and the other a Spanish speaker – as well as a Spanish-speaking volunteer and a Cantonese-speaking volunteer.
Although the Flea Market’s management offered to provide us the names and contact information of a handful of vendors, which would have facilitated snowball (but very non-random) sampling, that information never came through. Instead, on the three dates in March 2011 that we visited the market to conduct the vendor interviews,

48
we employed a convenience sampling method – though “convenience” was circumscribed by the language skills we had on hand each particular day and the proportions we aimed to get among the goods categories.
Bias and Error
Coverage Error
Our interviews captured the vendors open for business on the specific dates and times of day our research team visited the Flea Market to do vendor interviews – a Friday in the late afternoon, the following Saturday in the middle of the afternoon, and a Wednesday two weeks later in mid-afternoon. We attempted to sample from all geographical areas of the Flea Market, but with a limited research staff time available, we could not guarantee that we sampled from every corner.
We also did not interview daily vendors – that is, those vendors who don’t rent the same stall(s) on a monthly basis, but rather only come on days they have items to sell. We thought there would be too much variation in this group of vendors. One might vend only in the summer; another might vend whenever s/he has merchandise, regardless of the weather or season; another might be willing to vend on a Saturday or Sunday, when daily selling spaces come with a rental fee; another might only be willing to vend on days when daily selling spaces are free (currently Wednesdays, Thursdays and Fridays).
Sampling Error
Although we attempted to vary the vendors we interviewed by merchandise category in the same proportions as our vendor census showed, and we were generally successful with the most common categories, there were some categories for which we did not get any interviews. We were limited by time and resources, which was compounded by the fact that in some cases
when we found vendors that seemed like good interview candidates, they were consistently too busy with customers to be approached about our survey. In addition, on the Wednesday that we went, it was a rainy day, so the pool of vendors who were open for business was a very limited, self-selecting group of vendors both typically open on Wednesdays and willing to brave the inclement weather that day. It was only on that Wednesday that we had our Cantonese-speaking volunteer, which would explain any shortfall in the proportion of responses achieved from Chinese vendors.
Non-response Error
Although we did not find a difference in the rate of refusal to participate in our survey between different ethnicities of vendors, we did find that the vendors on the Saturday were less willing to be interviewed than those we approached on the weekdays. This unit non-response could be due to the fact that, with more customers on weekends, the vendors are busier with sales or potential sales transactions and have less patience or interest in unrelated activities.
In terms if item non-response, we found some vendors either decided not to respond to, or chose “I don’t know” to certain questions. The questions for which we got this response most often were those asking about the financial details of the vendors’ business operations, and the question asking vendors about their interaction with city government.
Measurement Error
For those vendors who did provide the financials of their business operations, there was some variation in what units of time they used (i.e., per week versus per month) and what type of income they used (i.e., revenues versus profits). We have standardized their responses to a common temporal measurement – weekly figures – and used this as the basis for estimates for our economic analysis.

49
Appendix B

50
Vendor Census(See table in Appendix A.)
Market Basket
Item Flea’s pre-
tax price ($) Unit Alternative source
Alt. source pre-tax price
($) Bananas 0.79 Per lb. Safeway 0.79 Mango 1.00 Each Safeway 1.25-1.99 Lemon 0.25 Each (5/$1) Safeway .50-.99 Pineapple 2.50 Each (2/$5) Safeway 4.99
Lime 0.10 Each (10/$1) Safeway 0.99
Yellow Onion 0.50 Per lb. Safeway 1.79 Tomatillo 1.49 Per lb. Safeway 1.99 Grapes 0.99 Per lb. Safeway 2.99-3.50 Roma Tomato 1.49 Per lb. Safeway 2.99 Japanese Eggplant 1.69 Per lb. Safeway 3.99 Apple 0.99 Per lb. Safeway 1.49-3.99 Senco air-powered stapler (medium-wire) - display/pre-discount price 95.00 Each Home Depot
99.00 - 299.00
Senco air-powered stapler (medium-wire) - vendor-offered discount price 70.00 Each n/a n/a
Racing TeamZ battery-remote controlled toy car (Ferrari style) 12.00 Each Target (MaxTech brand) 24.99 JanSport solid color standard-size backpack 20.00 Each Sports Authority 29.99 Oakland A's baseball cap (flat bill style) 10.00 Each Sports Authority 32.00 F.A.B. Starpoint Hello Kitty children's backpack 15.00 Each Amazon.com 30.00 Baby Phat embroidered logo (large, front) cap-sleeve drawcord waist shirt (women's) 13.00 Each babyphat.com 29.00-44.00
Dove bar soap 15.00 14-count bundle Amazon.com 20.35
Nike Santa Cruz men's shoes 60.00 Per pair eBay.com 69.99
Biolage shampoo 16.00 1-liter bottle Target 22.00
Biolage shampoo 11.00 13.5-fl.oz. bottle Target 16.00
M.A.C. blush in "Gingerly" 5.00 0.2 oz. compact Amazon.com 14.50
Mens Levi's 501 jeans 20.00 Each Kohl's 64.00
8 pc. Living room set (Sofa, loveseat, chair, coffee table, two end tables, ottoman, and misc. table or chair) 649.00 Each set
La-Z-Boy Furniture Galleries (pre-negotiated price range for fabric, non-reclining pieces; negotiation means another 5% discount; sleepers add another $300)
5,000.00 - 6,000.00
2 pc Living room set (Sofa and loveseat)
400.00 - 650.00 Each set
La-Z-Boy Furniture Galleries (pre-negotiated price range for fabric, non-reclining pieces; negotiation means another 5% discount; sleepers add another $300)
2,200.00 - 2,500.00
Complete bedroom set - double or queen (some with mattress) 850.00 Each set
Macy's - Pleasant Hills 3-piece queen set regular price 2,037.00
Small Potted Cactus 1.00 Each Orchard Supply Hardware 2.49-3.99 Anthurium ("Flamingo Flower") 10.00 Each Orchard Supply Hardware 12.99 Small bamboo in pot 2.50 Each 99 Ranch 4.90 Large bamboo in pot 4.00 Each 99 Ranch 18.90

51
Appendix C

52
Conceptual Elevations for Block 4 Townhomes/Condos Buildings
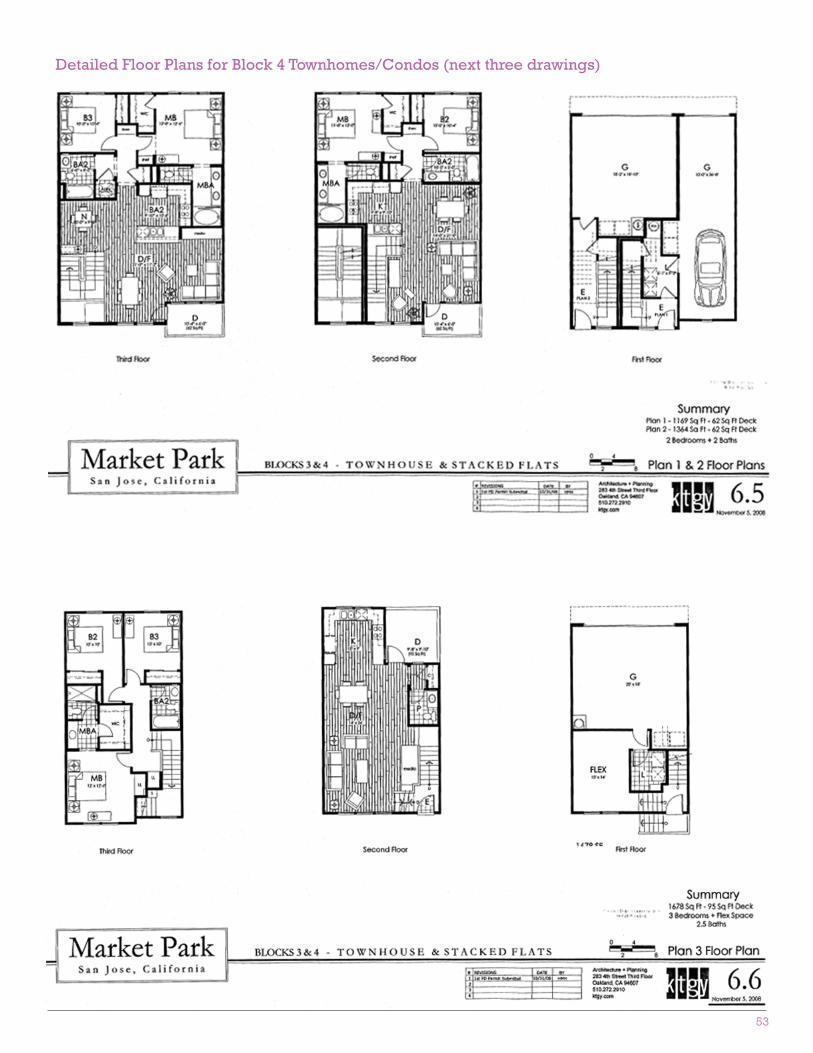
53
Detailed Floor Plans for Block 4 Townhomes/Condos (next three drawings)

54
San Jose Baseline Data Baseline Data
2000 Population 893,889 2000 Households 276,598 2000 Owners 170,825 2000 Renters 105,592 2000 Vacant Ownership units 714 2000 Vacant Rental Units 1,929 Normal Vacancy Rate - Owners 2.0% Normal Vacancy Rate - Renters 5.0% Calculated Rates
2000 Avg. HH Size 3.23 2000 Ownership Rate 61.8% 2000 Owner Vacancy Rate 0.4% 2000 Renter Vacancy Rate 1.8% Projections (from ABAG)
2014F Population* 1,040,536 Steps
Calculate 2014F HHs 321,975 Calculate 2014F Owners 198,850 Calculate 2014F Renters 123,126 Excess Vacancies: Owner (2,717) Excess Vacancies: Renter (3,447) Increase in Ownership Demand 30,741 Increase in Rental Demand 20,981
Source: U.S. Census 2010 population data; ABAG 2009 projected population for 2015 to calculate a simple annual change rate
Residential Unit Demand Analysis & Projections

55
Dem
and-‐to-‐Supply Analysis for North Village Residential
H
isto
rica
l T
ren
ds
Pro
ject
ion
s
2000
20
01
2002
20
03
2004
20
05
2006
20
07
2008
20
09
2010
20
11
2012
20
13
2014
D
EM
AN
D A
NA
LYS
IS
Es
timat
ed
Ann
ualiz
ed
Job
Gro
wth
4,
971
4,97
1 4,
971
4,97
1 4,
971
4,97
1 4,
971
7,46
2 7,
462
7,46
2 7,
462
7,46
2 7,
462
7,46
2 7,
462
Estim
ated
H
H D
eman
d (a
t 2
job/
HH
) 2,
486
2,48
6 2,
486
2,48
6 2,
486
2,48
6 2,
486
3,73
1 3,
731
3,73
1 3,
731
3,73
1 3,
731
3,73
1 3,
731
Spi
llove
r D
eman
d (f
rom
ou
tsid
e m
arke
t ar
ea)*
0
0
0 0
0 0
0 0
0 0
0 0
0 0
0 E
stim
ated
A
nn
ual
ized
D
eman
d
2,48
6 2,
486
2,48
6 2,
486
2,48
6 2,
486
2,48
6 3,
731
3,73
1 3,
731
3,73
1 7,
685
7,68
5 7,
685
7,68
5
S
UP
PLY
AN
ALY
SIS
1. S
tart
s
17
01
2669
13
00
911
470
2250
15
00
1500
20
00
2. P
erm
itted
&
App
rove
d
250
3.
Pro
pose
d or
Bui
ld-o
ut
250
4. P
roje
ct in
Q
uest
ion
25
25
5.
Tre
nd
25
0 25
0 T
ota
l E
stim
ated
S
up
ply
0
0 0
0 0
0 17
01
2669
13
00
911
470
2500
17
50
1775
22
75
SU
PP
LY-D
EM
AN
D B
ALA
NC
E
2,
486
2,
486
2,
486
2,
486
2,
486
2,
486
78
5
1,06
2
2,43
1
2,82
0
3,26
1
5,18
5
5,93
5
5,91
0
5,41
0
MA
RK
ET
PE
RFO
RM
AN
CE
Vac
ancy
Rat
e (%
) 1.
86
1.86
1.
86
1.86
1.
86
1.86
1.
86
1.90
1.
86
1.86
1.
86
1.86
1.
86
1.86
1.
86
*Spi
llove
r as
sum
ed t
o be
0 t
o ar
rive
at
a co
nser
vativ
e es
timat
e of
ann
ualiz
ed d
eman
d.
Sou
rces
: ABAG
201
0; C
ity o
f San
Jos
e 20
09;
City
of
San
Jos
e 20
10;
Cal
iforn
ia D
epar
tmen
t of
Fin
ance
201
0

56
Concept Plan # units S.F./unit TOTAL Source: 2 BR (Plan 1) 16 1,169 18,704 HMH 2008 2 BR (Plan 2) 16 1,364 21,824 3 BR (Plan 3) 16 1,678 26,848 3 BR (Plan 4B) 16 1,831 29,296 Common Area 0.14 13,534 TOTAL 64 110,206 Parking 48 112 Costs ITEM PER UNIT UNIT TYPE TOTAL (unless specified) Land Cost $428,276 Site size 78,408 s.f. Soft Costs Architectural/Engineering 6% of hard costs $1,552,157 Appraisal $15,000 Soils/Enviro/Testing $25,000 Organizational costs $65,000 Consultants $25,000 Survey $15,000 Approvals $50,000 Legal $20,000 Permits & Impact Fees 5.0% of project value $1,402,864 Geotechnical $50,000 Title & Recording $20,000 Construction Period Taxes $141,105 Testing & Inspections $15,000 Financing costs $571,870 Other 10% of soft costs $396,800 TOTAL SOFT COSTS $4,364,795 Hard Costs Grading/S.F. Infrastructure (allowance) $75,000 $75,000 Construction/s.f. 198 /s.f. $21,820,804 Parking/stall $0 Landscaping 10 /s.f. $784,080 Course of Construction Ins. $226,799 SUBTOTAL $22,906,683 Contingency 0.1 $2,290,668 General Conditions/Profit 0.12 $3,023,682 TOTAL HARD COSTS $28,221,033 Sales Costs Wrap Ins. $15,000 per unit $960,000 Warranty Reserve $10,000 per unit $640,000 Construction Interest $817,773 TOTAL SALES COSTS $2,417,773 LAND+SOFT+HARD+SALES COSTS TOTAL $35,431,878 385.8067821 Project Value UNIT PRICE NUMBER GROSS VALUE PER SQ FT 2 BR (Plan 1) $359,281.00 16 $5,748,496.00 $307.34 2 BR (Plan 2) $359,381.00 16 $5,750,096.00 $263.48 3 BR (Plan 3) $517,459.00 16 $8,279,344.00 $308.38 3 BR (Plan 4B) $517,459.00 16 $8,279,344.00 $282.61 Less Sales commission 5.0% ($1,402,864.00) Net Sales value $26,654,416.00 Interest Rate 6.50% Bank Term 12 months Bank Construction Loan Limit 80%
Fees 2.5%
571869.5386 Fee Amt * Loan
Max Loan $22,874,782 95% LTC Drawdown Factor 0.55 Estimate Release Rate 1.1
Construction Interest $817,773
I/12 * loan * drawdown * mos.
Market Conditions
HOA DUES per S.F. $0.26 local market data
2 BR (Plan 1) $303.94 per month 2 BR (Plan 2) $354.64 per month 3 BR (Plan 3) $436.28 per month 3 BR (Plan 4B) $476.06 per month
North Village Block 4 Pro Forma

57
UNIT COST TOTAL SOURCES ABSORPTION
2 BR (Plan 1) 1 per month local market data
2 BR (Plan 2) 1 per month 3 BR (Plan 3) 1 per month 3 BR (Plan 4B) 1 per month Selling Costs 5% Brokers
Investor Tax Bracket 41%
35% fed + 67% state (9.3%)
Hurdle Rate 15% Year -1 Year 0 Year 1 Land $428,276 From above Soft Costs $4,364,795 From above Construction Loan Cost
$5,346,252
Hard Costs – Const. Loan
Construction Interest $817,773 From above Sales Cost $1,600,000 Additional Cost at Take-Out Cash-In $11,739,323 $817,773 Cumulative Cash-In $11,739,323 $12,557,096 Summary of Sources & Uses Uses Land $428,276 Soft $4,364,795 Construction $28,221,033 Sales Costs $2,417,773 Cost Until Close $35,431,878 Sales Period HOA Dues $116,987 Sales Period Interest $343,277 TOTAL Cost $35,892,142 Sources Gross Sales $28,057,280 Commissions ($1,402,864) Construction Cost ($35,892,142) Tax $3,436,302 Net Cash Flow ($5,801,424) $0 Profitability Cash Flows Year -1 0 1 2 ATCF from sale $718,123 $6,037,549 Equity ($11,739,323) ($817,773) Cumulative Investment
($11,739,323) ($12,557,096) ($11,838,973) ($5,801,424)
Cash Flows ($11,739,323) ($817,773) $718,123 $6,037,549 Rate of Return NPV IRR Cash on Cash ROE ($7,937,639.02) -19.7% ($5,801,424) 5.7%

58
Cal
cula
tio
n o
f S
up
po
rtab
le A
dd
itio
nal
Ret
ail
Sp
ace
- S
up
erm
arke
t Pr
imar
y Tr
ade
Are
a: S
an J
ose
All
2010
dol
lars
2
01
0
20
14
Sou
rces
D
EM
AN
D
Popu
latio
n of
pri
mar
y tr
ade
area
94
5,94
2 1,
040,
536
U.S
. C
ensu
s 20
10,
ABAG
200
9 Ann
ual p
/cap
ita
expe
nditur
es
$1,9
84
$1,9
84
U.S
. Bur
eau
of L
abor
Sta
tist
ics
2010
Es
timat
ed N
et D
eman
d $1
,876
,983
,522
$2
,064
,681
,477
ca
lcul
ated
Es
tim
ated
Net
Lea
kage
* 0%
0%
es
tim
ate
ESTI
MATE
D G
RO
SS D
EMAN
D
$1,8
76,9
83,5
22
$2,0
64,6
81,4
77
calc
ulat
ed
SU
PP
LY
Tota
l Com
petitiv
e Spa
ce (
leas
ed G
LA)
in p
rim
ary
trad
e ar
ea
1,82
0,59
5 1,
820,
595
mar
ket
obse
rvat
ions
M
edia
n Sal
es p
/s.f
. of
GLA
for
cat
egor
y (a
nnua
l)
$4,8
86
$4,8
86
ULI
200
4 TO
TAL
ESTI
MATE
D A
NN
UAL
SALE
S F
RO
M P
RIM
ARY
TRAD
E AR
EA
$8,8
94,9
04,4
41
$8,8
94,9
04,4
41
calc
ulat
ed
NE
T M
AR
KE
T S
UP
PO
RT
Exce
ss D
eman
d -$
7,01
7,92
0,91
9 -$
6,83
0,22
2,96
4 ca
lcul
ated
M
edia
n Sal
es p
/s.f
. of
GLA
(an
nual
) $4
,886
$4
,886
U
LI 2
004
NET
SU
PPO
RTA
BLE
AD
DIT
ION
AL
GLA
IN
PRIM
ARY
TRAD
E AR
EA
-$1
,43
6,4
17
-$
1,3
97
,99
9
calc
ulat
ed
* Le
akag
e as
sum
ed t
o be
zer
o in
ord
er t
o ar
rive
at
the
cons
erva
tive
Exce
ss D
eman
d nu
mbe
r.
Supply-to-Demand Analysis for North Village Commercial
