transition to a low-carbon society and sustainable
TRANSCRIPT

HAL Id: hal-01692593https://hal.archives-ouvertes.fr/hal-01692593
Submitted on 25 Jan 2018
HAL is a multi-disciplinary open accessarchive for the deposit and dissemination of sci-entific research documents, whether they are pub-lished or not. The documents may come fromteaching and research institutions in France orabroad, or from public or private research centers.
L’archive ouverte pluridisciplinaire HAL, estdestinée au dépôt et à la diffusion de documentsscientifiques de niveau recherche, publiés ou non,émanant des établissements d’enseignement et derecherche français ou étrangers, des laboratoirespublics ou privés.
Transition to a Low-Carbon society and sustainableeconomic recovery, a monetary-based financial device
Jean Charles Hourcade, Michel Aglietta, Baptiste Perrissin-Fabert
To cite this version:Jean Charles Hourcade, Michel Aglietta, Baptiste Perrissin-Fabert. Transition to a Low-Carbon soci-ety and sustainable economic recovery, a monetary-based financial device. 2014. �hal-01692593�

J-C. Hourcade (CIRED), M. Aglietta (Cepii), B. Perissin-Fabert (CIRED)
with
B. Leguet, I. Shishlov, C. Ferron, R. Morel, I. Cochran (CDC Climat), H. Chenet, D. Strauss, J. Thomae, A. Gorius, M. Coeslier, S. Dupré (2°II),
R. Bibas, C. Cassen, A. Pottier (CIRED).
This note benefits from the inputs and suggestions of:
- K. Töpfer, C. Jaeger, and all the participants in the Workshop titled: «Innovative solutions for climate finance, the energy transition and an EU narrative» (July 8th and 9th 2014), F. Lecocq, C. Boemare, E. Espagne, E. Lucero, A. Sirkis, J. de Melo, C. Tutenuit, P.Shukla, E. La Rovere.
- The team of the International Energy Agency last World Energy outlook report.
- The LCS-RNet during its meetings held in Paris (2011), London(2012), Tokyo (2013) and Roma (2014) under the respective chairmanship of J-C. Hourcade, J. Skea, S. Nishioka and S. La Motta.
Study funded by the Caisse des Dépôts et Consignations, VINCI, BNP, and Entreprises pour l’Environnement under the umbrella of Entreprises pour l’Environnement.
Transition to a low-carbon society
and sustainable economic recovery,
A monetary-based financial device


3
INTRODUCTION: CARBON FINANCE AND THE CANCUN’S ‘PARADIGM
SHIFT’ IN CLIMATE NEGOTIATIONS
1 CLIMATE POLICIES IN AN ADVERSE CONDITIONS?
1.1 Canweaffordlow-carboninvestmentsthatareconsistentwith2°Ctarget? 1.1.1 Orders of magnitude: incremental vs. redirected investment 1.1.2 Funding tensions: context-dependent and no specific to the “450-ppm scenario” 1.1.3 Turning the question upside down 1.2 Finance,moneyandcarbonpricing:anewmentalmapneeded 1.3 Inanutshell,blueprintofaproposal
2 PILLARS OF A FINANCIAL ARCHITECTURE ALIGNING CLIMATE AND DEVELOPMENT OBJECTIVES 2.1 TheValueoftheCRAs:atrajectoryofnotionalprices 2.2 Transformingcarbon-basedliquidityintorealwealth
2.2.1 From the credit lines of the Central Banks to carbon assets: the circuit of balance sheets 2.2.2 Using a diversity of canals to redirect savings 2.2.3 Securing the environment contribution of LCIs
2.3 Voluntarycommitments,carbonassetsandpledges:arecoilingmechanism
3 A BENEFICIAL CYCLE OF ENVIRONMENTAL, ECONOMIC AND MACRO-FINANCIAL INTEGRITY 3.1 Leveraginglow-carboninvestments 3.1.1 Reduced upfront costs and higher risk-adjusted profitability of LCIs 3.1.2 Pooling low-carbon investments 3.1.3 Carbon-asset backed LCIs and firms value: Back to the Capital Asset Pricing Model
3.2 Aninmediatecontributiontoasustainableeconomicglobalisation
3.2.1 Clearing the foggy business environtment and dragging the world out of the economic doldrums 3.2.2 The macro-financial advantage of a stable benchmark 3.2.3 Mitigating the structural imbalances in the world “real economy”
CONCLUSION
5
7
779
10
13
16
18
1821
24
27
30
303235
36
363739
41


5
In the series of Conferences of the Parties that have occurred since 1992 COP-16, held in November 2010 in Cancun, marked a turning point. It called for «a paradigm shift towards building a low-carbon society that of-fers substantial opportunities and ensures continued high growth and sustainable development» (paragraph 10). Importantly, it also introduced the notion of «equitable access to sustainable development»1 in the context of a «shared vision for long-term cooperative action» and «global peaking of GHG emissions».
This newly devised paradigm shifts the negotiations away from the adversarial stances taken by nations in any process implying to decide what fractions of the remaining emissions budget will be alloca-ted to specific countries. It calls for a cooperative exercise, a central component of which is the linkage of climate policies to other global and national development objectives in a diversity of political, social and economic agendas.
To support this new paradigm, COP-16 established a Green Climate Fund (GCF), which is devoted in part to funding low-carbon development projects (LCPs) in non-Annex 1 countries of the UNFCCC in order to facili-tate adaptation and capacity building. The GCF is meant to support «one or more market-based mechanisms to enhance the cost effectiveness of, and to promote, mitigation actions» (paragraph 80).
The establishment of the GCF is a political pre-requisite for counteracting the distrust that has accumula-ted during climate negotiationsi. Although it made a real contributionii, the Clean Development Mechanism (CDM) was early suspected by non–Annex 1 countries to be limited by a) the expected difficulties in deploying a global carbon-trading system; and b) the determination of some EU Member States to limit carbon trading by means of «concrete ceilings» i.e. an upper limit on the emissions allowances purchases above their emis-sion quotasiii.
Unfortunately, the GCF in turn risks becoming a new source of misunderstanding, for three major reasons. First, the significant pressures placed on the public budgets of Annex 1 countries in the wake of the financial crisis and the deleveraging process in the banking system cast doubts regarding the amounts of funds that the GCF will effectively mobilize. Second, the re-equilibration of economic forces on the global scale undermines the political acceptability of substantial transfers of funds between the Annex 1 and non-Annex 1 countries Third, in a context of «depression economics» (Krugman, 2008), many Annex 1 countries will experience difficulties in implementing their own decarbonization processes owing to strong social resis-tance to carbon pricing, based on concerns about competitiveness and employment and on the prioritization of debt reduction.
However, it is not possible to await the re-emergence of a stable growth regime before making decisions about climate policies. In the absence of rapid redirection of their investment dynamics, emerging econo-mies will soon be locked into carbon-intensive development pathways, which will reignite the argument for inaction in developed countries, with deleterious consequences for all.
This study has as its start-point the belief that the only way to trigger climate action in adverse eco-nomic conditions is to examine the problem through the lens of «climate-agnostic» poli-cy-makers. In this perspective, climate action will be worth undertaking if and only if it addresses pressing short-term concerns, such as the stability of financial systems, global economic recovery, and poverty alleviation. This does not mean that climate change will be downplayed. Rather, it means that
1UNFCCC Decision 1/CP.16, para. 1.6, http://unfccc.int/resource/docs/2010/cop16/eng/07a01.pdf#page=2 (Accessed on November 22, 2013)
Introduction: Carbon Finance and the Cancun’s «paradigm shift» in climate negotiations

6
in line with the political agreement reached at the United Nations Conference on Environment and Development in Rio de Janeiro, Brazil in 1992 (Rio 92), climate change has to be tackled from the perspective of sustainable deve-lopment, which accords with the spirit of the numerous calls for Green Marshall plans or «Green Growth» that have emerged since the 1990’siv.
The following essay outlines a practical proposal to consider simultaneously the issues of mitigation of carbon emis-sions, financial system stability, and global economic growth objectives. While many other aspects remain to be addressed, the proposal is hopefully sufficiently detailed to constitute a basis for discussion. It contributes to the emerging body of literature on the finance-climate nexus and is addressed both to those scholars who have been involved involved in climate research for a long time and the «climate agnostics». The latter group will maintain a benevolent attitude to climate policies as long as they do not worsen current economic and social conditions. But their active support is needed for an ambitious climate action. They will adopt a positive stance only if they perceive it as coming to grips with urgent problems, even though it is obvious that the ultimate solution to the current problems of the world economy depends of international arena other than the UNFCCC.
The present paper is structured as follows. In the first section, we show that, given the severe transformations required to reach the target of limiting the increase in global temperature to 2°C, climate finance cannot remain a marginalized component of global finance. In the second section, we define the components and the design of a climate-friendly financial architecture. In the third section, we examine the conditions under which this architecture could trigger a virtuous circle between environmental, economic, and macro-financial integrity over the coming decades.

7
1 Climate policies in adverse economic conditions?
1.1 Can we afford low-carbon investments that are consistent with the 2°C target?
1.1.1 Orders of magnitude: incremental vs. redirected investments
An indicator of the challenge that faces us is the gap between the $100 billion per year that Annex 1 countries have pledged for the GCF by 2020 and the $15 billion a year envisaged by EU Member States as the first step in mitigating climate change. Assuming that all the Annex I countries assign the same percentage of their GDP (0.082%) to the GCF, this would lead to an annual $31 billion transfer to non-Annex 1 countries. Although this represents only one third of the commitment made by Annex 1 countries in Copenhagen, it would already repre-sent a one-third increase in the pre-2008 level of overseas development assistance, thereby creating the incentive for simple green washing of existing transfers.
It is all the more embarrassing that the real «funding gap» is significantly higher than that suggested by the majority of current assessments. These assessments are based on the levelized costs of technologies, i.e., the yearly pay-ments, which are equal over the duration of the projects, to cover the capital and operational costs and which include the interest to be paid to the (patient) lender. They rarely designate the time profile of upfront investments, i.e., the cash that will be needed to cover the additional costs of equipment during its incubation phase. One exception is the World Development Report (World Bank 2009), which suggests that the upfront costs (in aggregate form) in the first phase of the transition are 1.9- to 3.2-fold higher than the levelized costs.
Actually, incremental investment costs are only the tip of the «financial iceberg», with the hidden part being the
re-direction of investments flows. Low carbon techniques are not generally end-of-pipe equipment. If the capital cost of a given quantity of «clean» electricity is, say, 30% higher than that of a coal plant, the real percentage of in-vestment to be redirected is 130%. Even more important higher energy efficiency and lower levels of consumption of end-use energy will imply the re-directing of invest-ments, beyond the energy sector, in infrastructure, mate-rial transformation, and the manufacturing sectors. This re-assessment of the orders of magnitude does not mean that the challenge is insurmountable. Instead, it reinforces the necessity of changing the climate policy paradigms.
1.1.2 Funding tensions: context-dependent and not specific to the ‘450-ppm scenario’
To understand why and how funding tensions occur, we conducted numerical experiments on the investment and economic implications of the so-called «450-ppm scena-rio» of the International Energy Agency (2014) for twelve countries and world regions: USA, Canada, EU, Rest of the OECD, Russia, the Middle-East, Africa, Brazil, China, India, Rest of Asia, and Rest of Latin America2 .
These experiments3 are heuristic in nature. Given the hy-brid nature of the IMACLIM model we used, we imposed the technical structure of the energy system, as projec-ted by the three WEM scenarios of the IEA, including a CPS (Current Policies Scenario) that was taken as the baseline and the 450 ppm scenario, onto four macroeco-nomic contexts. Thus, we combined, applying the same overall productivity trends as the WEM scenarios, two treatments related to savings rates (endogenous and exogenous) with two assumptions as to the internatio-nal capital flows of capital (external accounts balance of all the regions in 2020 or 2100 only). We show that (box n1):
a) Contrary to the «conventional wisdom», the 450-ppm scenario does not imply, at the world level,
2The results are for Year 2035 assuming that the policies start in 2010. Thus, they should be interpreted as meaningful over a t+25 year time-period rather than for a precise date.3See Annex 1in http://www.centre-cired.fr/spip.php?article1827 for the technical details.

8
a) Contrary to the «conventional wisdom», the 450-ppm scenario does not imply, at the world level, cumulative higher energy-related investments on the sup-ply and demand sides over the two following decades); b) Energy-related investments fall drastically in oil and gas (O&G)-exporting regions due to a reduced re-quirement to invest for the expansion of export-oriented oil and gas capacities. c) In non-O&G-exporting regions, the incremen-tal investment costs for energy represent amodestdrainonGDP, although this increment is higher in emerging economies. Thus, they do not impose substantial pressure on the consumption levels of the current generation;
d) The variation of the share of the energy in-vestments in total investments is a good indicator of po-tential tensions; the higher this ratio, the higher are the pressures on real interest rates and the lower is the pro-bability to get the energy investments funded. It is worth noting, to seize the underlying rationale of our proposal, that the variation of this indicator is less susceptible to differences in the energy scenarios than to differences in the macro-economic setting; e) The 450-ppm scenario allows for slightly higher economic growth than that in the CPS for the non-O&G-exporting countries, regardless of macroeconomic context.
Box 1 - Orders of magnitude to keep in mind
We sum up here the results of a study conducted with the International Energy Agency of which results are displayed in http://www.centre-cired.fr/spip.php?article1827
a) At the global level, energy-related investment requirements in 2035 are lower in the 450-ppm sce-nario than in the baseline scenario because the lower energy demand in the 450-ppm scenario results in a decrease in energy supply that is higher than the increase in the capital cost of one unit of energy production. Over the short term the magnitude of total incremental investment costs depends upon the magnitude of «negative costs options, which can be mobilized;
b) The increase of these investments is between [14G$ - 42G$] in the US, [35G$ - 65G$] in the EU, [90G$ - 155G$] in China and [45G$ - 58G$] in Indiav. This increase goes along with a structural change of these investments: the share of the demand-side investments multiplied by 2.6 on average between the baseline and the 450 ppm scenario;
c) In percent of the GDP, the orders of magnitude of the incremental investment costs are modest: ([0.1%–0.13%] for the US, [0.6%–0.11%] for the EU, [0.21%–0.34%] for China, and [0.57%–0.86%] for India). The drain is higher in emerging economies owing to the higher energy intensities of their GDP and because they are in a «catch-up» phase with heavy dependence upon energy-intensive sectors (cement, steel, glass, non-ferrous). This does not mean that the transition will be easy. The GDP is not a «putty» that can be reformed at will;
d) The ratios of the maximum to the minimum values of this indicator in our scenarios are: 1.25 for the US; 1.38 for the EU; and 1.63 for China. These orders of magnitude are significant: the higher the ratio, the more severe are the pressures on real interest rates and the lower is the probability to secure the requi-red energy investments or, in the case of political will to impose such measures, the higher are the risks of crowding out other investments. The critical point to note here is that variation of this ratio is less due to differences in the energy scenarios than to differences in the macroeconomic contexts. The baseline scenario itself, in certain contexts, can trigger financial tensions, and this raises doubts regarding its deployment. If we classify the scenarios in descending order of the share of energy investment on total investment, we find first the 450-ppm scenarios provides a hedge against macroeconomic uncertainties with, for almost all regions, a narrower range of values of this indicator and that the 450-ppm scenarios do not always appear as the most financially strained. This ranking is indeed: 450 / 450/ CPS/ CPS/ NPS/ NPS/ 450/ CPS/ 450/ NPS/ CPS/ NPS;
e) This diagnosis is due to the fact that we do not compare the 450-ppm scenarios to optimal baselines changes. This changes the assessment of the impact of climate policies on economic growth. It may be that the CPS baseline will not materialise in the real world, if it does materialise, like in our simulations, the 450-ppm scenario will allow for a slightly higher economic growth with respect to any macroeconomic context in the non-O&G-exporting regionsvi.

9
This very small gain should not be over-interpreted. Howe-ver, it is driven by mechanisms of interest for all countries: the recycling of the carbon taxes into lower household taxes; b) lower price volatility on oil and gas; and c) higher overall factor productivity thanks to higher energy effi-ciency. It confirms that the very notion of incremental costs, which is useful at the microeconomic level, may misrepresent the problem at the macroeconomic level. The question is not only whether the incremental costs of climate policies can be afforded, but also whether the investments for any energy transition can be af-forded. Thus, if climate policy tools combine with other public policy tools are designed so that they help to over-come the barriers to this affordability without crowding out other productive investments and imposing a huge burden on current consumption, the approach to climate policies in an adverse context is fundamentally changed.
1.1.3 Turning the question upside down
Framing the transition to a low-carbon economy in terms of «how to redirect investments» instead of «how to fund incremental investments» is criticallyvii important for the demand-side investments needed to increase energy effi-ciency and lower the overall need for end-use energy ser-vices. These investments mobilize a wide spectrum of the non-energy sectors, such as the building, transport, and material transformation sectors, as well as part of manu-facturing industry which represent 40% of the global gross capital formation. The investments required for severe de-carbonisation in these sectors are mostly not of the «end of pipe» type. Changes in the production chain and industrial organization are needed, and a «back of the envelope» cal-culationviii shows that accounting for the required invest-ments increases by 20% the incremental investments for the low-carbon transition and, more importantly, leads to re-directed investments4 that are 8-fold higher.
This appears to be bad news, since it suggest that climate policies require a prior solution to the larger problem of re-directing savings and investments. But this also prompts us to turn the question upside down, examining it through the lens of the climate agnostic policymakers. These policymakers are primarily concerned by the pers-pective of sluggish or instable future economic growth, because the factors that have led to unstable financial dynamics are still prevalent.
First, the ultra-low interest rate policies of the Central
Banks in advanced countries have intensified the quest for yields higher than «public bonds» conducted by hol-ders of cash deposits (financial departments of multina-tional companies, mutual funds or pension funds). Those holders have moved in and out of capital assets because they are very sensitive to subtle changes in the messages passed in the announcements of central banks that might hint at future changes in interest rates. In short-term money markets prior to 2008, these volatile capital flows were channeled through wholesale funding instruments (ABS and CDOs) issued by shadow banks (broker-dealers, conduits and SIVs5). Although these instruments have di-sappeared, mistrust of the banking system has motivated a continuous build-up of institutional cash pools. The high demand for safe, short-term instruments has provoked an increase in the value of bonds and has mechanically driven down to zero their interest rates. In addition, the purchase by Central banks of bonds for reserve-keeping, resulted in a mass of liquidity that is greater than the va-lue of bonds that can be backed by public assets.
Second, measures that governments and central banks took to deal with the consequences of excessive risk- taking did not succeed in combatting the too-big-to-fail syndrome, while the imposition of a higher equity capital on total assets ratios, in an attempt to hedge against the risk of losing control, remains an unachieved business. Therefore, existing cash pools, estimated by the IMF at $3400 billion in 2010 as compared with $3800 billion in 2007 and $100 billion in 1990 (Polszar, 2011), are held lar-gely outside banks due to widespread mistrust.
Third, firms operate in a business environment that has, since the 1980’s, prioritized shareholder value over maxi-mization of the long-term growth typical of a «managerial economy» (Roe 1994), which accounts for the obsession with liquidity. The profusion of cash in large companies has fuelled bursts in dividend distribution, which have exacer-bated income inequalities and provoked share buyback to boost equity prices. The lack of effective demand and the economic uncertainties have not motivated private savers to maintain investment rates in the industry. The credit de-mands being made by small- and medium-size enterprises are flagging the overcautious credit and lending policies of bank. Investors face a kind of Buridan’s donkey dilem-maix, whereby the donkey died of hunger and thirst be-cause it hesitated too long in making a decision between eating oats or drinking water, in that they cannot decide in which direction long-term investments should go.
4If, for example, the investment in ULCOs technology for the steel industry is 30% higher than in basic oxygen steel-making with coke and a black furnace, this represents 100% of the investment that has to be redirected.5ABS, asset-backed securities; CDO; collateralised debt obligation; SIV, special investment vehicle; LOLR, lender-of-last-resort.
10
Viewed through this lens, ambitious climate policies mobilize a wide spectrum of economic activities, which might leverage a robust economic recovery. The problem of financing posed by the low-carbon transition does not indeed come from a lack of funds but from the inability of the present system of financial intermediation to fund productive investments. Higher and more stable growth would become possible by resorbing excess liquidity through increasing taxes, which seems a highly unlikely prospect, or by matching Treasury bill issuance and the volume of cash pools, which is not recommended in a time of consolidation of public debts, or by expanding the umbrella of the LOLR4 to non-banks, which is also not a palatable option. The only viable solution is the creation of intermediaries that are able to bridge long-term as-sets and short-term cash balances so that savings are invested productively without incurring the risks of excess leverage, maturity mismatch (illiquid long-term assets financed by short-term) and interconnectedness (unsecu-red liabilities of money market funds), which fostered the systemic crisis.
A major question though is whether climate finance can provide such an intermediary while decreasing the capi-tal costs of low-carbon technologies. If it can do this, it will both a) reduce the magnitude of the cash-pools and fuel the global growth engine by shortening the trickling down of current savings to productive investments; and b) help overcome one major obstacle to the energy transitionx.
This is all the more timely considering that the pattern of economic globalization is changing. What the OECD development department calls «shifting wealth» is indeed taking a new course. Export-led growth and the building-up of reserves in emerging economies fuelled by excess credit growth in a host of OECD countries is being replaced by more inward-focused growth involving the expanding middle classes in emerging economies and characte-rized by demands for higher wages and services, and for investments driven by urbanization and environmental concerns. This evolution also concerns international fi-nancial intermediation. European banks have retrenched to their home borders since the Eurozone crisis, and they no longer borrow dollars via their US subsidiaries to re-lend worldwide. Faced with this gap in the market, Asian development banks and sovereign wealth funds are step-ping up their activities. A financial model emerges that is based on long-term bilateral financial contracts at agreed-upon prices backed by government guarantees and that involves bond issuers substituting national currencies with the dollar.
Most recently, the BRICS political leaders went a step further. At their Fortaleza Summit on July 16, 2014, they
created a new development bank, funded to the tune of $100bns, with equal participation of the five sponsoring countries; this bank with commence operations in 2016. This is the first significant shift in multilateral public fi-nance dedicated to poor and developing countries since Bretton Woods. The BRICS initiative, in similarity to that of China in the incipient Asian Investment Bank, which has also been funded with $100bns, aims at financing infras-tructure developments within and between developing and emerging countries.
However, having examined the climate policies through the lens of climate agnostics, it is appropriate to once again turn the question upside-down and to see how the linkage with evolution of the financial economic order can really help to achieve the final objective of a low-carbon transition. This demands a precise definition of the linkage between the established economic frameworks of environmental economics for internalizing the climate change externality through carbon price signals.
1.2 Finance, money and carbon pricing: a new mental map needed
The Kyoto Protocol (KP) did not result from an ex ante, fully fledged vision of a global climate architecturexi. Instead, it was the outcome of a succession of diplomatic faits accomplis (Bodansky, 2011), inter alia the principle of common but differentiated responsibilities (CBDR in the Article 3.1, UNFCCC, 1992), a quantity-based approach to settle countries’ commitments (exempting developing countries), and the possibilities, as described in Articles 17 and 12 of the KP, for carbon trading between countries and a Clean Development Mechanism (CDM) for generating transfers between developed and developing countries.
In the immediate aftermath of the Kyoto conference, the KP was often presented as implying a world carbon market that would generate the same carbon price for imposition on all the carbon emitters. This was not the case but this presentation had the merit of simplicity and was consistent with a mental map in which, as in most modelling exer-cises, carbon markets connect technical abatement cost curves of «GHG abatement factories» all over the world and select techniques in a descending merit orderxii. This mental map contains important landmarks but is in-complete because the abatement factory metaphors:
- implies that an Indian peasant indirectly sells permits to a French tourist flying to the Seychelles. This transaction would not necessarily make him better off, as
11
intermediaries might divert part of the carbon revenues before it reaches his pockets. Moreover, the remaining amount might not compensate him for the negative ef-fects on his earnings (linked to higher irrigation and trans-portation costs) and purchasing power of the propagation of higher energy prices throughout the Indian economyxiii;
- ignores the wedges driven between technical costs, GDP variations, and welfare variations caused by: i) incomplete and fragmented markets (energy markets, labor, and real estate markets) and a dual economy un-dergoing perpetual restructuring; ii) structural unemploy-ment; iii) the absence of compensation mechanisms for the adverse distributional effects of policies; iv) distorting fiscal systems; v) weak policy regimes; vi) under-protec-ted property rights; and vii) investments risks in an unpre-dictable business environmentxiv. A consequence of these wedges, which are determined by a broad set of domestic policiesxv, is that there is no mechanical linkage between «burden sharing» and «emissions target setting».
- assumes that micro decisions are made as a function of levelized costs; this misrepresents the rationale of firms’ decisions in a business regime that makes managers
very sensitive to the variations in shareholder value. In an environment of uncertainty, firms cannot select projects based on their levelized costs, regardless of their short-term impacts on the value of the firm given the magni-tude and the uncertainty of the upfront costs and the time profiles of revenues, net of operational costs.
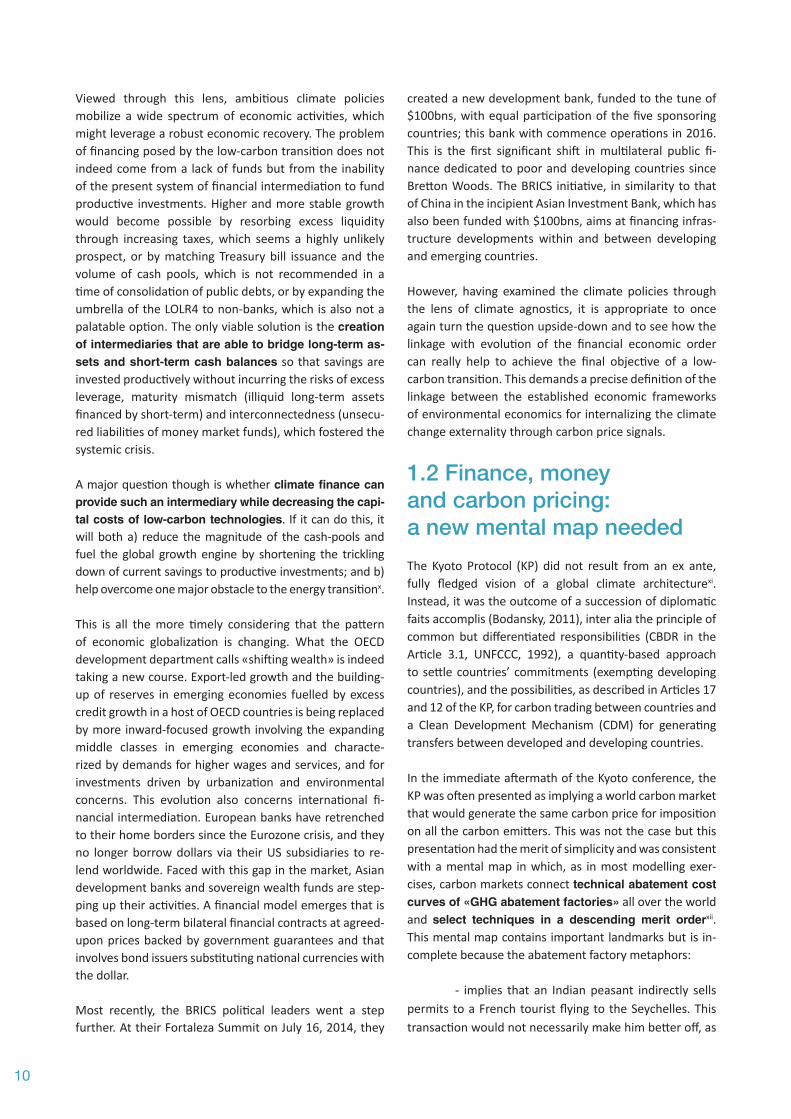
This calls into question the conditions under which car-bon pricing is effective in prompting economic agents to internalize the climate change externality in their beha-viors. We are not in the idealized world of Figure 1 of box 2, where economic agents «see» the entire trajectory of carbon prices reflecting the social cost of carbon along the optimal least-cost pathway towards a climate objec-tive.) In this world, decisions are made today on long-li-ved investments as a function of, say 200 $/tCO2 in Year 2080 even though, as in price trajectory (a) the current prices are 10 $/tCO2. In the real world, economic agents do not ‘see’ the 200 $/tCO2 because long-term markets are missing and because carbon price signals are swam-ped, in infrastructural sectors, by numerous other distor-ting signals (e.g., the price of real estate) and undermined by regulatory uncertainty.
Box 2 - Figure 1: The expectation gap
Agents today consider the carbon price a, and do not anticipate its evolution beyond t1. In a situation in which there is full confidence in public policies and a clear perception of carbon price signals, they see the entire tra-jectory O. If carbon prices are masked by other distorting signals (including low confidence in public policies), a carbon price c > b has to be launched, resulting in the L trajectory
Bridging the ‘expectation gap’ through carbon pricing only would imply very high prices in the short term to cover the “noise” of other signals, as in the price trajectory (b). Such high prices would exacerbate short-term shocks for vulnerable households and economic sectors.

12
This is why carbon pricing cannot be disconnected from a broader set of economic signals (real estate and land prices, labor markets, regulatory regimes for infrastruc-ture sectors) that would reduce these noises or from overall fiscal reforms that would control its general equi-librium effects.
However, this is intrinsically the realm of domestic poli-cies, and there is an irreducible level of uncertainty about the political capacities of governments to enforce such policy packages over decades. Climate finance, backed by public commitments, circumvents part of these difficul-ties because it comes to say «My government really thinks that avoiding carbon emissions is something of value but cannot commit to ever-increasing carbon prices. To prove its commitment to combat global warming, it now bes-tows on the industry a partial surrogate for carbon price trajectories, so that they can immediately invest in low carbon infrastructures».
To understand the microeconomic foundations of such a surrogate and the precise mechanism through which it should be enforced in order to be effective, one needs to
revisit the investment logic of enterprises in the current business regime. The basic argument is that projects can be selected as a function of their net present value (i.e., the discounted sum of revenues minus capital expendi-tures and operational costs) only if the time profile of the operating accounts of the firm is not an issue. This arises only in a situation of unlimited financing capacity and un-der a «managerial business regime»6 in which managers have the flexibility to maximise firm long-term growth. In the real world, firms have limited capacity to finance projects (be it via debt, equity or self-finance). Onerous debt servicing lowers their operating surpluses and poses a threat to dividend payments to their shareholders if their bank loses confidence. Thus, the value of the firm is affected, with consequent risk of bankruptcy or hostile takeover.
The key point is that, under uncertainty the «true» cost of an investment for a firm is highly non-linear as illustrated in Figure 2. Alternative which could be profitable might not pass a financial viability test in the absence of bene-volent lender with unlimited lending capacities.
Box 3 - Figure 2: Risk assessment of projects
under a ‘shareholder value’ regime.
Let A be an investment with a higher net present value than B; it should be preferred to B to maximize the long-run value of the firm. But A implies higher upfront costs of which probability density is represented on curve «P». The line D is a «danger line», the level of deficit of operating accounts which will lead to outcomes (debt to equity ratio, dividends distributed to shareholders) that will endanger the value of the firm and its resistance to hostile investors. For firms’ managers, which have in mind that underestimating investment costs by more than 20% is standard in infrastructure investments, projects with high upfront costs put them at risk of crossing this line.
Climate finance comes to move down this «danger line» from D to D*). Comparing the black and dashed surfaces in the curve p (which gives the probability distribution of costs) shows easily that the impact of this downward displacement on risk perception might be very non-linear. The question though is what combi-nation of carbon prices (which decrease the net revenues of B and of carbon finance is more efficient to internalize the social cost of carbon (see infra third chapter).
6The distinction between the “managerial business regime” and the “shareholder business regime” is clarified in Roe (1992). For its implication on the growth

13
Ultimately, two instruments are needed; carbon pricing as a signal to coordinate decentralized behaviors and car-bon finance to cope with the investment risk in a share-holder business regime. These two instruments should be articulated so as to minimize the lobbying games for exemptions triggered by the fact carbon pricing hurt installed capital stock and vested interests and the risk of arbitrariness in the actual practices of subsidizing the emergence of new low carbon capital stocks.
Fundamentally, behaviors enabled by existing capital stock (mobility, housing modes, location of human sett-lements) result from an implicit social contract relying on cheap energy and environmental innocuousness of fossil energies. That climate policies question this social contract is a real obstacle to their deployment, hence the need for an instrument to facilitate its renegotiation through sending the same carbon price signal to new investments without hitting existing capital.
1.3 In a nutshell, blueprint of a proposal
Different ways of scaling up climate finance can be envi-saged, and several valuable studies have recently been conducted on this topic. Given current economic context of climate negotiations, we propose that any new opera-
tional system to support this scaling up must satisfy the following requirements:
- avoid the imposition of short term direct addi-tional burdens on taxpayers or national/regional budgets;
- redirect private funding towards safe and pro-ductive low-carbon investments, which involves the invol-vement of the banking system and institutional investors;
- send a signal on the social value of avoided car-bon emissions. In the absence of a global carbon price, a surrogate of a price signal minimises the risk of fragmen-tation and inefficiency of bottom up initiatives.
We believe that a monetary-base instrument may be a good candidate to comply with this challenging terms of reference. We describe in the next section the main pillars of carbon-based monetary blueprint.
The basic principle of the proposal consists in injecting Central Bank liquidities into the economy provided that the money is used for low-carbon investments. In this sce-nario, governments would provide a public statutory gua-rantee on a new carbon asset, which allows the Central Bank to provide new credit lines refundable with certified reduction of CO2 emissions. The targeted credit facility would makes it possible to extend credit to Low-Carbon

14
Carbon Investments (LCIs) by lowering the financial risk and making them more attractive for banks and investors. The overall mechanism has to follow four basic principles pictured in figure 3.
(i) The international community recognizes that avoiding GHGs emissions is «something of value». Governments (of Annex 1 countries in a first step) com-mit, on a voluntary basis, but within a framework agreed upon by the UNFCCC, to back a new class of eligible «Climate Remediation Assets (CRA)» recognized by the central bank of their monetary zone. These assets are a quantity of carbon abatement. They are valued at an agreed upon Value of the Climate Remediation Assets (VCRA) per ton of avoided emissions.
(ii) Building on this guarantee, Central Banks of participating open «credit lines» to commercial and deve-lopment banks provided that the money is used to fund LCPs in the issuing country or in any country participating to the system. Then the central bank announces that it will ac-cept as repayment «carbon certificates» (CCs) which testify effective carbon emission reduction. Those CCs are conver-ted into CRAs while entering central bank’s balance sheet. This is tantamount to a money issuance based on the gua-rantee that «something of value» has been created taking the form of low-carbon technologies and infrastructure.
(iii) Those CCs are delivered, administered, and controlled by an independent international Supervisory Body, established under the UNFCCC, like the CDM Exe-cutive Board, to secure the environmental integrity of the mechanism (rules for the attribution of CC, monitoring
of the completion of LCPs) and its developmental effec-tiveness. The latter is guaranteed by the consistency of funded investments with a list of NAMAS selected by par-ticipating countries to secure the alignment of mitigation actions with development policies. The face value of the CC is given by the politically negotiated VCRA.
(iv) Banks or specialized climate funds use the carbon-based monetary facility to back highly rated climate-friendly financial products, such as «AAA» climate bonds, in order to attract long-term saving. Institutio-nal investors could be interested in safe and sustainable bonds instead of speculative financial products for both ethical and regulatory purposes. Part of the CC have to be used to scale up the Green Climate Fund in order to secure multilateral cooperation and the funding of NAMAS without crowding out overseas assistance by each individual country.
In summary, this monetary instrument is tantamount for the central bank to buying a service of carbon emission reduction at a price justified by society’s willingness to pay for a better climate. Carbon-based liquidities can be the-refore be considered as «equity in the commonwealth». The equity pays dividends in the form of «actual wealth» created by productive low carbon investments and averted emissions in the short term, a stronger resilience of the economy to environmental and financial shocks in the longer term. The proposed system would send a carbon price signal (through the SCC) while being politi-cally acceptable because it does not impose direct costs on firms or consumers. It also stimulates mitigation efforts and to stimulate economic growth.
Figure 3: The key elements of a climate-friendly financial architecture

15
Various systems can be built around the above-mentioned set of principles, and in the next section, we examine in greater depth the four pillars upon which a viable and effi-cient system can be built. However, the set of economic and political constraints imposed on a novel system of this type means that there is a limited range of possibilities.
Figure 3 shows that the proposed CRA device carries po-tential risks for: (i) lax monetary creation under the pretext of carbon savings and the real risk of «carbon bubbles» (ii) low-quality LCPs, both in terms of development and carbon abatement; (iii) increases in capital costs in most sectors of the economy; and (iv) economic inefficiencies in regard to the selection of abatement projects.
These concerns have to be addressed in the design of the system and weighed against the efficacy of the system in lowering the risk premium on low-carbon projects, in selecting the most cost-effective projects and in suppor-ting new financial products that attract savings away from speculative investments. We will see that the VCRA is a key component of the device, because it controls the risk of a carbon bubble, while securing the credibility of the new financial products, lowering the costs of fragmentation, and avoiding the arbitrariness of low-carbon initiatives.
Figure 4: Benefits (+) and risks (-) associated with the issuance of CRAs

16
This proposed financial architecture rests on four essen-tial pillars that we analyze in turn:
1. An agreement on the VCRA amongst countries participating in the system. Participating countries include both countries that issue climate remediation assets and countries that accept the preconditions for receiving fun-ding for their NAMAS through this channel.
2. A mechanism transforming carbon-based liquidity into real wealth and CRAs, and supporting cli-mate-friendly financial instruments apt to attract long term savings.
3. The establishment of an independent interna-tional Supervisory Body in charge of controlling the effec-tiveness of emission reductions and of rewarding low-carbon projects with carbon certificates.
4. Rules for the emission of «carbon based liqui-dity» and for the «access rights» of the recipient countries
to the opened credit lines so as to create a recoiling me-chanism that guides participating countries towards emis-sions trajectories consistent with the +2°C objective.
2.1 The Value of the CRAs: a trajectory of notional prices
One fundamental notion of the economics of climate change is the Social Cost of Carbon. As recalled in Box 3, its strict definition demands the assessment of climate change damages over the long run to weigh these da-mages against the costs of mitigation. This is a daunting task arousing a lot of scientific uncertainties and ethical controversies hard to overcome overnight. We will use the cousin notion of social value of the avoided emission of carbon, acknowledging that, since COP-19 has confirmed the long-term objective of preventing that mean surface temperature increase by more than 2°C, the international community attaches an implicit value to this target.
Box 4: The Social Cost of Carbon its meaning and its controversies
For simplicity sake the social cost of carbon (SCC) is often communicated through a single value (X$/tCO2). Actually, it is a time series of values of the additional damage caused by an additional ton of carbon emissions along an optimal growth pathway (Nordhaus, 2008). At each date of this pathway, the discounted sum of the marginal cost of abatement equates the discounted sum of the marginal cost of remaining damage. It writes: SCCt = ∂W/∂at/∂W/∂ct, with W standing for the welfare, at for abatement, and ct for consumption.
When communicated through an aggregate figure, the SCC is the discounted value of the utility of consumption flows expressed in terms of current consumption. Its estimates by integrated assessment models depend on a large set of key parameters: «pure time preference» – which is at the core of the Stern/Nordhaus controversy (Stern, 2007; Nordhaus, 2007; Weitzman, 2007; Yohe and Tol, 2007; Hourcade et al., 2009) – and also on as-sumptions about long term growth and about the future costs of carbon-free techniques, beliefs about climate change damages. This explains why, even in case of agreement on a pure time preference like suggested in the chapter Social, Economic and Ethical Concepts and Methods of the last IPCC report (2014) it might be difficult to reach a consensus about discount rate (Hourcade, Ambrosi, and Dumas, 2009). In sequential decision-making frameworks where decisions are not made for all the century, it is also sensitive to the date of arrival of new information about damages and technologies (Espagne et al. 2014; Pottier et al. 2014).
Pillars of a financial architecture aligning climate and development objectives
2

17
One can compute the trajectory of costs for meeting this target under various assumptions. Uncertainty is still im-portant but results from 900 modeling exercises synthe-sized by the last IPCC report (chapter 3) show ranges of carbon prices which, though still large, provide a corridor within which a political deal can be made. Precisely, Figure
5 shows a maximum likelihood space of carbon prices ran-ging from 28$/tC02 to 50$/tCO2 in 2020 and between 110$/tCO2 and 190$/tCO2 in 2050. Within this corridor, the agreement will be political in nature, and would trans-late the willingness of the international community to pay for climate mitigation.
Figure 5: Global carbon prices and expected consumption losses compatible with several GHG concentration targets at different points in time.
Source: IPCC SPM WGIII
This explains why, even though the consensus of the last IPCC report on low pure time preferences is accepted, the value of the SCC will remain highly controversial. The range of US$-3 to US$95 per ton of CO2 given by the (IPCC, 2007) implies huge differences in the values in 2030 or 2050. This explains why the relevance of such assessments for policy-making was recently strongly questioned (Pyndick, 2013). This did not prevent the UK’s Department for Environment, Food and Rural Affairs and the US government to use SCC estimates for use in regulatory analyses. However the level of controversy is such that it might be a long way before an agreement on a workable range of values for these parameters is reached at the world scale.
One way out is to interpret the SCC as the «shadow price» of an agreed emissions target, i.e. the marginal cost of meeting this target. In this case, the debate about the discount rate matters less (Ambrosi et al, 2003). This approach comes to admit that, if the international community decides a given emissions target, it attaches impli-citly a cost to overshooting it, hence the notion of Value of Avoided carbon Emissions.

18
This agreement involves both the initial VCRA, and the rate at which it increases over time. This is important because this rate of growth will partially offset the fact that the discount rate penalizes long lived infrastructure investments. To reconcile the credibility of the economic signal and the necessity to revise initial choices in function of new information, this VCRA should be reassessed every five year without being changed for the past contracts.
A political agreement on a VCRA should be easier than on a carbon tax because the VCRA serves as a notio-nal price for the new investments. Contrary to a carbon price that must be paid for each unit of carbon emissions, it does not impose a direct short term extra cost on pu-blic budgets, on firms or on consumers. It does not hurt directly existing capital, has less direct distributive impacts and is therefore less at risk of being blocked by a coalition of vested interests.
Moreover, each government will value the avoided car-bon emissions it in function of its own perception of the domestic co-benefits of climate mitigation (air pollution, benefits of the recycling of the revenues of carbon pri-cing, energy security). Hence countries might agree the same VCRA for different reasons and it is questionable that potential benefits of differentiated VCRA are worth the risk of endless controversies about the rules for this differentiationxvi. A key issue however, is to hedge against the vagaries of exchange rates of which ups and down might undermine the efficiency and the reliability of the system for guiding long term decisions. The VCRA would be nominally similar to the 35$ per ounce of gold under the Bretton Woods regime. But, since the exchange rates vary, its value in national currencies will be submitted to variations large enough to generate time inconsisten-cies in the investment projects. To limit this problem, the world VCRA could be the weighted average, in purchasing power parity (PPP) of national prices expressed in dollars. This PPP price system (reviewed every five years) would minimize the inefficiencies caused by the volatility of exchange rates.
2.2 Transforming carbon-based liquidity into real wealth
The previous sections have defined both the price and the amount of carbon-based liquidity issued by Central Banks of countries with high emissions. The key is then to secure that this carbon-based liquidity supports the creation of «real wealth» as collateral of carbon assets.
We have seen the basic principle: Central Banks accept carbon certificates as repayment of their credit instead of cash and enhance the risk-adjusted profitability of low carbon investments (including the risk of bypassing some bankruptcy line for the investor). There are many possible circuits to do so because there are many types of financial intermediaries and many types of enterprises. For clarity sake, we start describing the «banking canal» which will likely be the most important.
2.2.1 From the credit lines of the Central Banks to carbon assets: the circuit of balance sheets
Building on the political agreement on the VCRA, a new class of carbon assets is created by the Central Bank of which the value and the maximum supply is determined. Attributing a notional value to carbon assets does not in-fringe on Central Banks independence; this was the case for gold under the Bretton Woods regime.
Table 1 lists the components of a Central Bank balance sheet. Gold, special drawing rights and securities are part of the Central Bank’s assets while currency in circulation and bank’s deposits appear on the liability side.
Table 1: Central Bank’s balance sheet

19
Backed by government’s commitments, the central bank of a country announces that it open credit lines to fund low-carbon projects and that it will accept as repayment «carbon certificates» (CC) which would testify effective carbon emission reduction, valued at the pre-agreed VCRA.
Tables 2 to 5 offer a numerical example of the balance sheet consequences for the central bank and a commer-cial bank of a 1000 loan to a low-carbon entrepreneur expected to realize 10 units of CO2 emission reduction. The VCRA is set at 10, which values the expected emission reduction at 100.
Table 2 indicates that the loan to the entrepreneur is divi-ded into two credit lines. On the first line, the commercial bank mobilizes 900 deposits remunerated at rate rd and lends 900 at rate rl. The second line refers to the 100 cre-dit equivalent to the value of expected emission reduction
lent by the central bank to the commercial bank that can be paid back with certified carbon certificates. Pruden-tial rule about minimum capital requirement only applies to the first credit line (900 rl), as a zero coefficient risk is applied to the line coming from the carbon-based liquidi-ties. As a result, the net worth increase of the commercial or development bank should only be 0.08*900rl instead of 0.08*1000rl as in the conventional case of full funding by the bank of the project.
The central bank owns a new 100 claim on the commercial bank. Thanks to the 1000 loan, the entrepreneur launches the project with expected returns RLC which makes the total expected revenues amounting to 1000 RLC. Two lines appear in the liability side of the entrepreneur’s balance sheet corresponding to two types of debt: 900 will be paid back with the monetary revenues of the projects and at the interest rate rl, and 100 will be paid back with carbon certificates7.
7 In this example, we assume the project realizes the 5 units of expected emission reductions.
Table 2: Balance sheets at the opening date of the low-carbon loan
During the payback period of the loan, the entrepreneur gradually reimburses the loan with monetary revenues of the project as suggested by Table 3. As the project realizes
emission reductions, the entrepreneur receives carbon certificates.

20
Table 3: Balance sheets at mid-maturity of the low-carbon loan
At the end of loan maturity, Table 4 indicates that the entrepreneur has paid back the entire 900 debt with the monetary revenues of the project and has gotten 10 CC for the emission reduction her project has achieved8.
Capital constraint for the commercial bank gets null and only the second credit line remains unchanged in the balance sheets.
Table 4: Balance sheets at the end of the payback period of the low-carbon loan before the asset swap
8 The schedule of CCs could be allocated to the entrepreneurs as soon as the construction phase of the project is completed

21
The last step of this process is an asset swap performed by the central bank who accepts the 10 CC as repayment of its 100 financial claims. The second credit line corres-ponding to the «carbon debt» of the low-carbon project
can thus be cancelled out (Table 5). Total amount of car-bon-based liquidities that the central bank can still issue is reduced by 100.
Table 5: Balance sheets after the carbon asset swap
For commercial banks in a process of deleveraging, this new credit facility will encourage them to expand their lending activity, instead of accumulating liquid reserves. An additional regulatory incentive for the banks might be that a high share of LCPs in their loan book would make their balance sheet less risky, since this share of their assets would benefit from a public guarantee. One could even imagine that they keep part of the carbon assets. Banks would then be rewarded with a reduction of the cost of their prudential capital constraint. They could in-deed be allowed to apply a zero risk coefficient – in the same fashion as for sovereign bonds – to the fraction of the loan that comes from central bank liquidities backed upon the value of emission reduction. Along the same line, it could be envisaged that firms keep the carbon as-sets in their balance sheet to improve their value in terms of the Capital Asset Pricing Model.
2.2.2 Using a diversity of canals to redirect savings
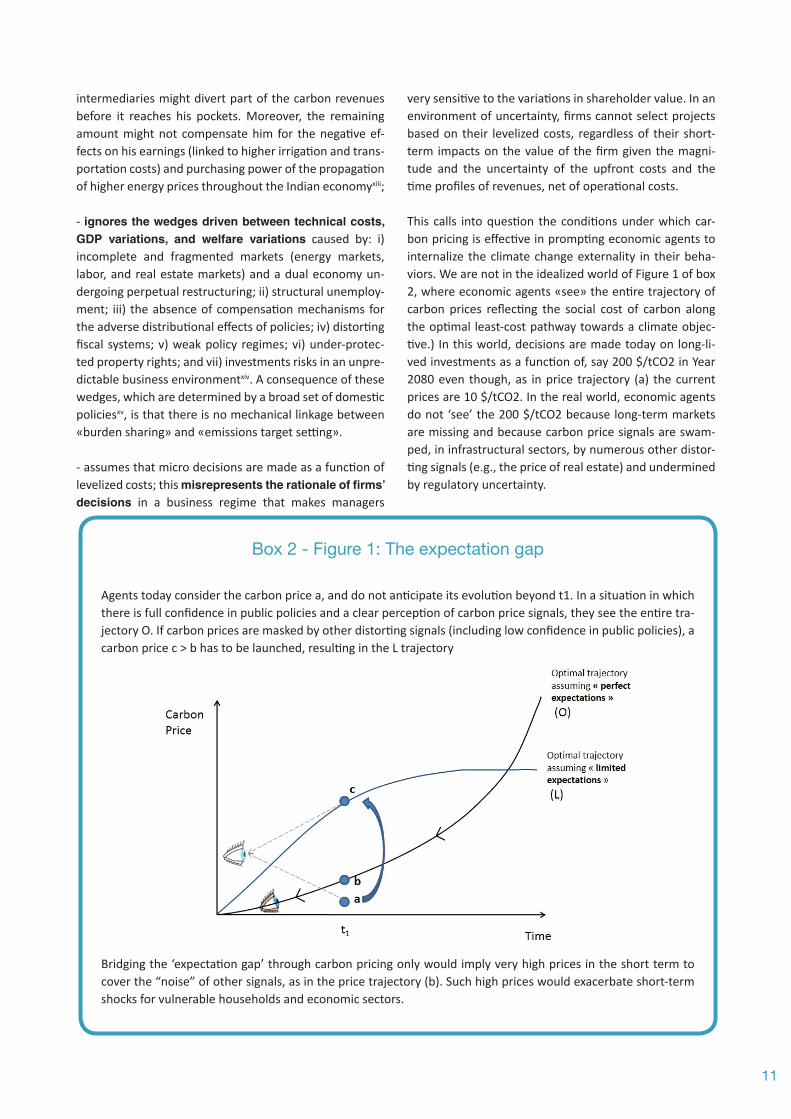
To upgrade climate finance at the necessary level, most of the financial intermediaries should be mobilized: pu-blic private and corporate pension funds, insurance com-panies, endowments and investment management com-panies. All these intermediaries could, as illustrated in Figure 6, use the carbon-based monetary facility to back highly rated climate-friendly financial products attractive for households and institutional investors and «climate colored» (like the green bonds of the World Bank).
22
Figure 6: Climate finance as a means to redirect long term saving toward low-carbon investments
One problem to be overcome is then the general behavior of financial intermediation and the lack of investor appe-tite for illiquid assets. The «CRA» mechanism presented in this note helps increasing the risk-weighted profitabi-lity of climate-friendly projects but its success will depend upon the capacity of using it to propose financial chan-nels adapted to the economic rationale of the diversity of actors involved in the energy systems on the demand and supply side.
Behavior of Long term investors
Many institutional investors have very long-term liabilities or obligations to their beneficiaries (e.g. a typical DB pen-sion funds 12-15 years duration, insurers 7-15 years dura-tion, charities and universities endowments 10+ years). This has led to expect that these investors will be the natural providers of long-term capital. However, the evi-dence suggests that their investment horizons are much shorter-term. The World Economic Forum (2012) shows that long-term investors invest 9% of their portfolio in illiquid assets and that they could, in theory, more than double this exposure while still meeting their liability and regulatory constraints. In a recent survey of leading Euro-pean pension funds, respondents estimated their ideal in-vestment horizon at 23 years and their actual investment
horizon at 6 years. Mercer (2010) found studying the in-vestment horizon of 822 equity funds that 63% of equity managers having received a long term mandate from ins-titutional investors had shorter investment horizons than what they claimed to have when promoting their fund to institutional investors.
Retained earnings, shareholders and debt financing
The four key sectors in the low carbon transition (power generation, petroleum industry, buildings, and transpor-tation) mobilize, in various proportion, private and public capital, and within private capital, a diversity of actors from large International Corporation to the households.
According to the IEA (IEA, 2014), about half of the power generation capacity currently installed globally is owned by state-owned entities, 44% being owned by private companies. Two-thirds of privately owned power genera-tion companies and almost 40% of companies that have majority state-ownership are publicly listed on stock mar-kets. In principle, these are available to investors globally and sensitive to the shareholder value. In OECD countries, most of the investment in new capacity by private com-panies listed on stock exchanges is self-financed (retained earnings).

23
The petroleum industry is hold by large private companies in the OECD countries whereas the dynamics of the trans-portation sector depends critically of a mix of private and public initiatives and this of the building sector from a mix of large corporation and small craft enterprises.
State-owned companies present similar financing pattern. For the IEA: the choice of financing is primarily driven by
commercial considerations and largely independent of other policy targets. More important are the differences between behaviors of private and public actors between OECD countries where the role of shareholder in domi-nant and non-OECD countries where, for example, private companies rely mainly (about 60-70%) on debt financing;
Figure 7: Financing of projects by publicly listed power companies, by majority stakeholder and region, 2002-2012
Sources: IEA analysis and 2° Investing Initiative, based on data from Bloomberg Professional Service.
Basically, for whatever investment, companies can tap into two sources of financing: they can issue equity shares, bonds and increase their debt or they can reinvest profits rather than distributing dividends. Financial institutions have thus two levers to make a difference.
- to influence the companies’ capex strategy, via shareholder activism; this does not require any divest-ment nor significant sectorial reallocation but rather an engagement to reorient existing companies with a «gree-ner» use of their profits in terms of reinvesting;
- to impact the deal flow i.e. the demand of financing and the offer of projects entering in the pipe-line. They can do so via investment banking activities and changes in portfolios allocation fostering green projects and technologies — this is the now well-known green bonds narrative, to provide more «green capital» to raise more «green projects».
Both these levers are ultimately in the hands of finan-
cial institutions but the credibility of climate policies and the technical modalities of public intervention matter to facilitate the matching between the offer of low carbon projects and the amount of savings in search of invest-ment opportunities.
The role of banks and institutional investors
In this process the main role of banks is to channel capital, following three levers.
- the origination of credits, for which they very much depend on the demand in the real economy and the amount of relevant projects waiting to be financed, but where they also have the opportunity to innovate, having an emulating effect on demand.
- The issuance of bonds and asset backed secu-rities (ABS) to finance their balance sheet, or help their clients. The influence on capital allocation is limited here and mainly driven by the clients’ demand, but specialized

24
teams working to create new products can help to remove this obstacle;
- In their daily role of retailers of investment pro-ducts, they influence savings allocation since most clients just follow their bankers’ advice, primarily based on fis-cal argument, and to a lesser extent on the nature of the investment. The climate-friendliness of the investment could be thus a good marketing teaser for certain catego-ries of households.
There is no standardized data related to these three levers available in banks annual reports. No comprehensive ‘offi-cial’ data exist today but the analysis of the breakdown of companies’ sales by segment for a universe of 8.000 companies show that the exposure to low-carbon en-ergy technologies of a typical equity stock index is very limited (typically 2-5%, even if considering rail and nuclear as «green technologies»). The share of green assets for fixed-income, based on a reference bond index, is even smaller, if one does not account the green public invest-ment financed with general purpose sovereign bonds.
Using the benchmark indexes as proxies for institutional investors’ sector allocation, as well as statistics on stra-tegic asset allocation, can provide with a rough estimate of the exposure of institutional investors to green assets, which appears to be very limited compared to brown as-set exposure, and mostly relate to listed equities. There is no available data today to go much further and notably investigating banks’ portfolios, but simplified proxies sug-gest similar patterns.
Ultimately the upgrading of climate finance at the required level will be facilitated by a coordinate effort on informa-tion and data collection. This is the role of the actors of the financial system to form a «club» to carry out this effort.
2.2.3 Securing the environment contribution of LCIs
The problem to be solved for triggering aware of LCIs is not to guarantee the additionally of each project on a case-by-case basis from a counterfactual (and controver-sial) baseline, as in the CDM, but to guarantee «statistical additionally» (Trextler, 2006) i.e., that the pool of projects supported by the system reduces emissions relative to what would have happened otherwise.
Focus on very high accuracy in the allocation of carbon certificates would end up freezing investments while laxity would lead to subsidizing projects that would have been funded anyway. The trade-off between these two risks
will ultimately emerge from a learning process through which the independent authority will progressively refine the assessments in function of experience and local cir-cumstances (but with no retroactivity on past allocations). It can be secured in three steps:
• Step 1. Define a taxonomy of LCIs (size, techno-logy, time horizon) and determine the potential abatement (volume and time profile) to be expected from projects in each category of this taxonomy (for example a unitary capacity of hydropower) in each country. This potential abatement will be used for every project deployed in the country during the considered time period. This number will be conventional in nature, but its determination can rely on modeling exercises that provide orders of magni-tude of the emission reductions associated with the main types of LCIs (hydro-power, solar or wind power plants, transport infrastructure, building insulation, etc.) under various growth scenarios. These values can be reasonably bound by systematic model comparison and sensitivity analysis, through an international expertise committee.
• Step 2. Calculate the expected present value of the avoided emission generated by the project: let A(t) be the CO2 abatement yielded by the project at each point in time, t0 the date of start date of the project, N the pro-ject expected lifetime and i the discount rate, the present value of the CO2 abatements can be computed as follows: ,
and the number of allocated carbon certificates will be:
• determine the amount of carbon certificates allocated to each kind of LCI by dividing the present value of projects by the VAE at the date of project launching and, to secure the environmental integrity of the system by retaining only a share of this value:
In the same spirit, the monitoring of projects (with pos-sible invalidation of part of the CCs) has to rely on simple observable criteria to assess the degree of effectiveness of the project in comparison with its ex-ante objectives (in terms of carbon emissions when this is possible, in terms of indicators of physical achievement for transportation or building infrastructure).
To set up such a process with a minimum degree of cre-dibility would certainly have been risky two decades ago.

25
But we can now benefit from the experience of the Clean Development Mechanism CDM) which is to date the largest carbon offset mechanism in the world – with over 7,000 projects.
This experience show first the importance of upfront transaction costs as a major barrier for the implemen-tation of projects. They include Project Design Docu-ment (PDD) development, validation costs (internal and auditing), UNFCCC registration fees and the cost of instal-
ling the monitoring system. They vary drastically depen-ding on the type of project and technologies and on the concerned sectors, ranging from EUR 37,000 for small-hydro projects to EUR 434,000 for very large adipic acid N2O projects. They are also submitted to scale effects (Figure 8) which indicates the necessity of specific pro-cedures so as to avoid the crowding out of small scales projects which might be the projects yielding the most of development benefits in some countries and regions.
Figure 8: MRV costs in the CDM. Source: CDC Climat Research based on Warnecke et al. (2013), Bellassen and Stephan (forthcoming)
Building upon (Shishlov and Bellassen, 2012) to strike a right balance between lowering transaction costs and the incentive to operate low carbon investments, it is possible to define criteria for a MRV process aiming at statistical
environment additionally of the system. Without deli-vering key in hands solutions, box 5 gives an integrated vision of these criteria.
Box 5: Securing the statistical additionality of LCIs: a few principles
a) Standardization of the baseline setting: necessary to demonstrate the additionally of the project represents half of upfront transaction costs in the CDM (Guigon, Bellassen, and Ambrosi 2009). Abandoning project-by-project assessment will result in a significant reduction of transaction costs without undermining the environmental integrity of the system because, given the accumulated CDM experience, it is possible to set up acceptable «counterfactuals» like those developed by the Program of Actions (PoA) framework as well as in the new sectorial crediting mechanisms. Based on discussions about country-wide standardized baselines for different sectors in COP11 (Montreal), COP16 in Cancun provided the possibility for host countries to submit standardized baselines concerning all or part of the country (UNFCCC 2011). This will overcome the problem of information asymmetry between the project developers and the regulator. But the problem of the regulator will be the level of the stringency of the baseline and/or of the share of CC allocated for an expected deviation from the baseline not to discourage the supply of projects without compromising the environmental integrity of the program (Millard-Ball 2013).

26
b) Positive lists: those already implemented within the CDM can be used as a first basis for further standardization. Certain types of projects that meet minimum criteria can be assigned a standardized, conser-vative amount of credits per operation period with conservative discount in proportion of the uncertainty about their environmental performance. The current list of projects automatically deemed additional include small scale off-grid and grid-connected renewable energy, rural electrification project activities using renewable en-ergy sources in countries with rural electrification rate is less than 20%, mass transit and bus lane in Least Developed Countries (LDCs), etc. This list can be progressively extended to minimize both the «false positives» generating windfall profits and the «false negatives» of lost opportunities (Trexler et al 2006). In this search for avoiding free riding without high transaction costs it makes sense to have more stringent screenings on projects with best leverage ratios than in projects (sectors, regions) with insufficient financing adopted where the list of eligible project types expands over time in line with MRV complexity and cost.
c) Monitoring: the CDM project developers already devise a monitoring plan that provides for «the collection and archiving of all relevant data necessary for estimating or measuring anthropogenic emissions by sources of greenhouse gases occurring within the project boundary during the crediting period». The CDM Pro-ject Standard further specifies that variables that continuously affect the amount of GHG emissions (reductions) - such as the quantity of fuel input or the amount of gas captured – must be measured constantly. Variables that remain largely unchanged, e.g. emissions factors, must be measured or calculated once a year. The MRV system for a non-project based system may provide a certain degree of flexibility to developers in order not to impede projects in sectors where high level of monitoring are unachievable or too costly, e.g. transportation or forestry. This may be done through discounting the amount of carbon certificates in proportion to the overall monitoring uncertainty. Project developers can thus be encouraged to save on monitoring costs at the expense of less carbon certificates awarded.
d) Verification: the use of accredited auditors for verification is necessary to reduce the moral hazard to overestimate emission reductions. They key is the consistency check, by an accredited auditor, between project description and implementation of the project. A similar verification approach is applied in most carbon accoun-ting systems, be it national GHG inventories or an ETS. Since the third party tends to be paid directly by the verified entity, a potential conflict of interest arises. However, the risk of losing the accreditation is typically a much stron-ger incentive and keeps auditors from being complacent with their client (Cormier and Bellassen 2012). Another option is to levy a share of the proceeds on the system to pay directly the auditors. In order to keep verification costs at a reasonable level, the stringency of verification is adapted to the importance of information. Auditors should be encouraged to focus on larger sources of potential overestimations while small sources of errors may be ignored. The threshold of «materiality» depends on the size of the project. Typically in the CDM it ranges from 10% of total emissions reductions for micro-scale projects (renewable energy projects of up to 5 MW and energy efficiency projects of up to 20 GWh of energy savings per year) to 0.5% for large scale projects that reduce more than 500,000 tons of carbon dioxide equivalent per year. Another potential approach that may be considered is the «fire alarm», i.e. the auditor conducts random spot-checks and focuses on «suspicious» numbers.
d) Transparency: transparency improves the credibility of the system and allows «learning-by-doing» among participants. However, there is a trade-off between transparency and confidentiality especially when sensitive financial information is concerned. In the CDM all the documents related to the project – project de-sign, names of project participants, methodology, validation and verification reports etc. – must be made public. The complete transparency of the mechanism enables constructive criticism to emerge from a great variety of stakeholders: project developers, e.g. through the International Emissions Trading Association (IETA), auditors, e.g. through the Designated Operational Entities and Independent Entities Association (DIA) and NGOs such as Carbon Market Watch or Sandbag. The general tendency is to put little confidentiality on the reported data. This transparency, however, may be used to obtain commercially sensitive information on the reporting companies. This is why, for example, reported data is confidential in the Shenzhen ETS where the problem is particularly acute as companies are asked to report their added value as well as their emissions.

27
e) Timing the issuance of Carbon Certificates: by comparison with the current CDM, one advantage of a system based on CC, is that the «cash» is available immediately for the project developer in exchanged of the commitment to reimburse this cash in the form of certified CC. However, it still matter for the investors to have a precise information about the pace at which these CC will be swapped into carbon assets because this determines the risk of being forced to reimburse the loan in cash in case of non-certification. This information will be key for the assessment of the debt servicing and mitigating the «MRV risk». This is why it might be reaso-nable to have part of the «asset swap» carried out for example in three steps: one third after the completion of the equipment and certification that they are conformed with the initial plan, one third at the half of a conven-tional date of economic completion of the project (lower than its technical and economic lifetime) and one third at this date.
2.3 Voluntary commitments, carbon assets and pledges: a recoiling mechanism
The last pillar for the proposed system to work is the amount of carbon assets that each country commits to issue, and symmetrically the amount of carbon certifi-cates it can receive to fund its low carbon policies, so that they are incentivized to stay on a deep decarbonization pathway.
Since most countries will not accept large sovereignty transfers at the occasion of world climate policies, only voluntary participation to the club of countries accep-ting a common set of rules is possible. Given the politi-cal constraints revealed by the emergence and the failure of the Kyoto Protocol, these rules should a) preserve the idea of allocating targets and timetables for countries with a controlled degree of «when» and «where» flexi-bility, leave all latitude for Parties to select NAMAS apt to align their climate and development objectives to avoid misgivings about «environmental colonialism» and follow the «common but differentiated responsibilities (CBDR)» principle (Article 3.1 of the UNFCCC. b) moti-vate countries to respect their pledges and to narrow the gap between these pledges and an emissions trajectory compatible with the 2°C target, through deprive defaul-ting countries of the benefits of the «club», like in Carraro and Siniscalco’s approach (Carraro and Siniscalco, 1998) of technological cooperation9.
This could be achieved through a recoiling mechanism hang on two anchor points:
- Anchor point 1 is «an aspirational emissions convergence trajectory» which determines the allocation to each participating country of an emissions budget for the next five year time period.xvii
- Anchor point 2 is the set of emissions pledges announced by each participating country for the same time horizon.
What makes an agreement on aspirational convergence emissions trajectories possible easier than under a cap and trade system is that the system will to raise funds for carbon transition without triggering adverse impacts for households and firms and high drains on GDP for impor-ters of carbon allowances.xviii
Two recoiling mechanisms are not the same for countries above and below their aspirational convergence trajectory:
- Countries with emissions higher than their convergence trajectory commit to back carbon assets cor-responding to a fraction of the gap between their actual emissions and this trajectory. They will thus be incited to deploy domestic mitigation action to utilize domestically the opened credit lines instead of being forced to ever increasing capital outflows;
- Countries with emissions below their «conver-gence trajectory» announce emissions pledges and a list of NAMAS; the more ambitious are their pledges, the higher should be the share of carbon-based credits they will be eligible to receive to fund their NAMAs.
Box 6 illustrates how theses pullback forces would work between four archetypical countries.
9On the literature of climate clubs see Bodansky (2011), Falkner et al. (2010), Hulme (2010), Victor (2011)

28
Box 6: Recoiling mechanism: an illustrative example
Panel A (2015) Country C1 Country C2 Country D1 Country D1
GHG emissions (2015) (GtCO2) 1000 1300 600 1000
Convergence Trajectory (2020) (GtCO2) 800 1100 900 1300
Carbon Asset Issuance ($*GtCO2) 50*100=5000$ 50*100=5000$
Outflows (2015->2020) -2000$ -4000$
Inflows (2015->2020) 4000$ 2000$
Pledge (2020) 900 1200 700 1200
Panel B (2020) Country C1 Country C2 Country D1 Country D1
GHG emissions (2020) (GtCO2) 900 1200 900 1100
Convergence Trajectory (2025) (GtCO2) 600 700 1100 1200
Carbon Asset Issuance ($*GtCO2) 60*150=9000$ 60*250=15000$
Outflows (2020->2025) -4000$ -5000$
Inflows (2020->2025) 4500$ 4500$
Pledge (2025) (GtCO2) 700 900 1000 1100
Panel C (2025) Country C1 Country C2 Country D1 Country D1
GHG emissions (2025) (GtCO2) 600 900 1100 1200
Convergence Trajectory (2030) (GtCO2) 400 500 1200 1200
Carbon Asset Issuance ($*GtCO2) 70*100=7000$ 70*200=14000$ 0$
Outflows (2025->2030) -4000$ -7000$ 0$
Inflows (2025->2030) 11000$
Pledge (2030) (GtCO2) 500 700 1200 1100

29
The panels A, B, C using purely illustrative figures show how the countries can be guided towards their conver-gence trajectory:
- Annex 1 countries and all countries over their convergence trajectory: in 2015, their central banks open credit lines for 100GtCo2 (half the gap between the convergence trajectory in 2020 and emissions in 2015) valued at a VCRA of 50$/t. Country C2 conducts less domestic abatement effort than country C1 and it uses only 1000$ of the credit lines to support these efforts. It then let 4000$ available for projects abroad to be compared with 2000$ only for country C1. As described in panel B, country C2 is then «penalized» in 2020 by a larger gap between its emissions and its convergence trajectory (500 GtCO2 instead of 300 GtCO2). If the VCRA is now 60$/tCO2 it is obliged to open 15000$ credit lines (instead of 9000$ for country C1). It is thus confronted to the risk of an increasing drift of outflows of capital. Here lies the recoiling mechanism Between 2020 and 2025 it uses domestically two thirds of the credit lines emitted by its Central Bank, is rewarded in Panel C by a reduced gap with its convergence trajectory (400 GtCO2) and then is rewarded by a lower obligation of issue carbon assets.
- on Annex 1 countries : In panel A, developing countries D1 and D2 share the same gap of 300 GtCO2 below their respective convergence trajectory. Because they are not at the same phase of their development, this trajectory increases from 900 GtCO2 to 1200 GtCO2 for country D1 between 2015 and 2030 whereas the trajectory of D2 reaches a pick of 1200 GtCO2 in 2025 and declines after 2030. In 2015, the behavior of the two countries differs in terms of ambition of pledges for 2020. Country D1 announces 200 GtCO2 below its conver-gence trajectory whereas country D2 announces 100 GtCO2. Then, country D1 will have, in this case, a drawing right on 2/3 of the available amount of credit lines issued by developed countries. Here lies the recoiling mecha-nism for these countries: the more ambitious are their pledges (measured by the gap with their convergence rule) the more they will be beneficiaries of capital inflows. To prevent false announcements it will suffice to discount the theoretical drawing rights in t by the gap between the emissions registered in t and the pledges announced in t-1. Note that, beyond 2030, country D2 overshoots its normative peak and then becomes an issuer of carbon assets.
Over time all countries will be discouraged from an-nouncing loose emissions pledges. The rationale of this expected virtuous circle is as follows: the development benefits of the mechanism will be tangible to those issuing and receiving assets. This will make the system increasin-gly attractive for all countries, which in turn might create a movement of expanding climate coalition.
For this system to work, Supervisory Board in charge of managing the MRV system should register the issuance of emissions of carbon assets and their use, like in a form of clearinghouse. This is critical to create a credible infor-mation basis for renegotiating the pledges every five year.
This system will contribute to respecting of the CBDR prin-ciple because in any convergence trajectory the net capi-tal flows will go from North to South. Investment required for the energy transition over 2010-2035 are of the same order of magnitude in OECD countries (5950 G$ - 6300g$) and in Developing Countries (OPEC excluded) (6040 G$ - 6500 G$) and there are in these countries a higher share
of cost-effective opportunities. It is also interesting to note that, one or two decades ahead, emerging economies like China, Mexico and Brazil are likely to overshoot their convergence trajectories and are thus likely to contribute to the system as net issuer of carbon assets.

30
A beneficial cycle of environmental, economic and macro-financial integrity
There exists no economic device or institution that does not run the risk of perverse effects due to mismanage-ment or some diversion from their initial objective. Sec-tors of public opinion concerned by climate change will thus request guarantees regarding the environmental in-tegrity of the system. Other sectors of public opinion will be more concerned with the possible risks, such as infla-tion, the creation of speculative «carbon bubbles», and support for unsound infrastructure investments.
These risks are actually interrelated. The primary way to minimise risks of money creation that is not backed by «real wealth» is to set up high quality MRV processes (with reasonable transaction costs) and credible moda-lities for fixing the quantity of issued carbon assets and for securing the conformity of their use with the country’s NAMAs. Building on this guarantee, the economic integri-ty of the system will be reflected in its capacity to trigger a virtuous cycle in which savings are redirected towards profitable LCIs, thereby resolving the paradox of the co-existence of a vast pool of savings and of over-inde-btedness, and contributing to sustainable development and economic crisis recovery in all world regions.
3.1 Leveraging low-carbon investments
The leverage effect of a CRA based device on LCI depends upon three interrelated parameters: a) the capacity of the device to reduce the cash-flow risk associated with capital intensive projects, b) its capacity to facilitate the efficacy of pooling LCIs to place on the market financial products
attractive for private savings, c) the interest of firms to hold carbon assets – with a value stable over time – to in-creases their value. We discuss these parameters in turn.
3.1.1 Reduced upfront costs and higher risk-adjusted profitability of LCIs
The C4 mechanism has two complementary effects a) it increases the internal rate of return of the LCIs by lowe-ring the repayment of the credits and avoiding a carbon price b) it moves the «danger line» in case of cost overrun at the peak of the investment flow.
Box 7 helps understanding, through simple mathematics, the links between these two effects and how they can impact on the number of LCIs which will be selected. The primary mechanism is to allow for more overrun of up-front investment costs by removing the «bankruptcy line» beyond which the project developer risks to find no len-der to pay this overrun without accepting to lose control on the project or even on its enterprise. With the CRAs, a number of projects now become financially viable, can reach maturity and reap the benefits they could not reap without the help of carbon certificates. Here lies the com-plementarity with carbon pricing which decreases the benefits of projects at second period in invert proportion of their carbon content; it thus improves the merit order of low carbon projects. But it does so only for the projects which have not been stifled by the existence of the «ban-kruptcy line». In other words, the more efficient will be the CRA mechanism to move away this line, the higher will be the effect of a carbon price.
3

31
Box 7, Figure 9
Helping banks financing projects with high upfront in-vestment cost and uncertain returns is of particular im-portance for making possible deep decarbonization pa-thways. In case of learning spillovers the optimal climate mitigation strategy starts with investments in research and development which have high sunk costs and uncer-tain returns, with a potentially high uncertainty on the sunk costs. Moreover the transition from ‘dirty’ capital to «clean capital» requires massive immediate investment (Lecocq and Shalizi, 2014; Vogt-Schilb et al., 2012) before
the resolution of all uncertainties. This is very important for the sectors where clean capital is the most expen-sive (Vogt-Schilb et al., 2014; Vogt-Schilb and Hallegatte, 2014), and with slower capital turnover and long lead periods between investment and returns (Jaccard and Rivers, 2007; Lecocq et al., 1998; Waisman et al., 2012; Williams et al., 2014). The combination of these two para-meters is one major obstacle to bridging the technology valley of death.xix
Figure 10: In sectors where capital lifetimes are longer, such as buildings and power plants, clean investment urgent.
Source : (Williams et al., 2014)

32
Box 8: Enhancing the adoption of LCIs under financial constraints: CRAs and carbon prices
Let us consider investment projects that generate the abatement of one ton of carbon relative to a define base-line. For a project i, the investor pays ci at first period for the construction of the equipment before getting the revenues bi. If the interest rate of capital is r, all projects will positive net present value (NPV) will be undertaken:
In case of costs uncertainty, the costs to be considered are ci + ϵ and the benefits bi + ϵ’ where ϵ and ϵ’ follow subjective probability laws. If these laws are of mean 0, uncertainty does not change the ranking of the project; the mathematical expected of their NPV is still given by:
This is not the case if there is a limit c* beyond which no financial actor will provide additional loans to cover the investment costs overshoot. A lot of projects which are profitable in the context of a patient and infinite lender do not pass this financial viability test. The NPV of each project has thus to be rewritten as:
A carbon price increases the benefits for the second period but might not change the NPV of abatement projects with high upon costs. The role of the C4 device is to do so by moving away c*. A twinned effect is to increase the maximum amount of costs that bankers are willing to accept and to increase marginally the NPV of projects;
With φ representing the probability density of ϵ.
3.1.2 Pooling low-carbon investments
Let us now examine the CRAs through the lens of financial actors. These actors consider LCPs as riskier than conven-tional projects because of the uncertainty about the maturity and economic performance of low-carbon tech-nologies, of the instability of climate policies and of the fragmentation of climate finance initiatives (De Gouvello et al., 2010; Hosier and al, 2010).
If LCI-investors try to raise funds by individually asking for loans from commercial banks, only the most profitable ones will have a chance to get funded, the higher the loss given default the higher the risk premium required by the
bank. Public finance instruments (concessional loans or public guarantees) may help some other projects reach the break-even point. This is the case for the LCP7 in the example of Box 9. But their leverage effect is restricted by the transaction costs associated with tailoring them to each type of project.
Pooling LCIs is a natural way of overcoming these restric-tions and risk pooling procedures would benefit from the CRA device:
- Specialized public and private climate funds set up to pool fund raising by means of climate bonds; such funds, managed by commercial or development

33
banks have the capacity to identify and assess LCIs. This form of financial intermediation was suggested by de Gouvello and Zelenko (2010) with their Low-Carbon Deve-lopment Facility proposal.xx The basic principle is to cali-brate the paid-in-capital of such a fund in order to raise a multiple of this capital by means of highly rated climate bonds. The proceeds of this capital would then be lent to LCIs. This fund rising would be possible turning a BBB port-folio of projects into AAA climate bonds like illustrated in Box 9. Typically this mechanism could be appropriate to fill the Green Climate Fund, up to the promised US$ 100 billion a year in a first step and to expand it in a second.
- Collateral debt obligation (CDO) could make it possible to fund the entire portfolios of LCPs via private
resources. The basic principle consists in turning a portfo-lio of LCPs into different financial products with different brackets of risks (from equity to senior AAA debt) and sold to private investors with different risk profiles (from hedge funds to institutional investors). Such mechanisms, like the «Big Green Bucket» proposal of Bloomberg New Energy Finance are enticing as they require no public money. However they require that financial markets are deep enough to hedge against risks. CDOs have been a key driver of the last financial crisis and this raises skepticism about not carefully regulated sleight-of-hand finance. One safeguard would be to forbid the design of cascades of CDO to keep a visible link between financial vehicle and the underlying risks arising from LCPs.
Box 9: Leveraging Climate Finance
Let us consider a fictive portfolio of 10 LCPs Table 6 presents a pool of 10 LCPs with the same environmental performance (0.2 MtCO2 abated) and the same financing need (a $100M loan) but with different risk profiles. These projects are ranked according to their credit rating (from AA to BB+) which depends on: their Internal Rate of Return (IRR), their probability of default over 10 years and their recovery rate (the fraction of the project revenues that can be recouped in case of default). Column 8 gives the «loss given default» (i.e., the expected amount one stands to lose). The expected value of the loss is $0.243M for a bank lending $100M to LCP1 and $11,86M if the bank invests in LCP10. One billion dollar invested in the entire portfolio is exposed to an expected loss of $38.7M. The portfolio would rate BBB.
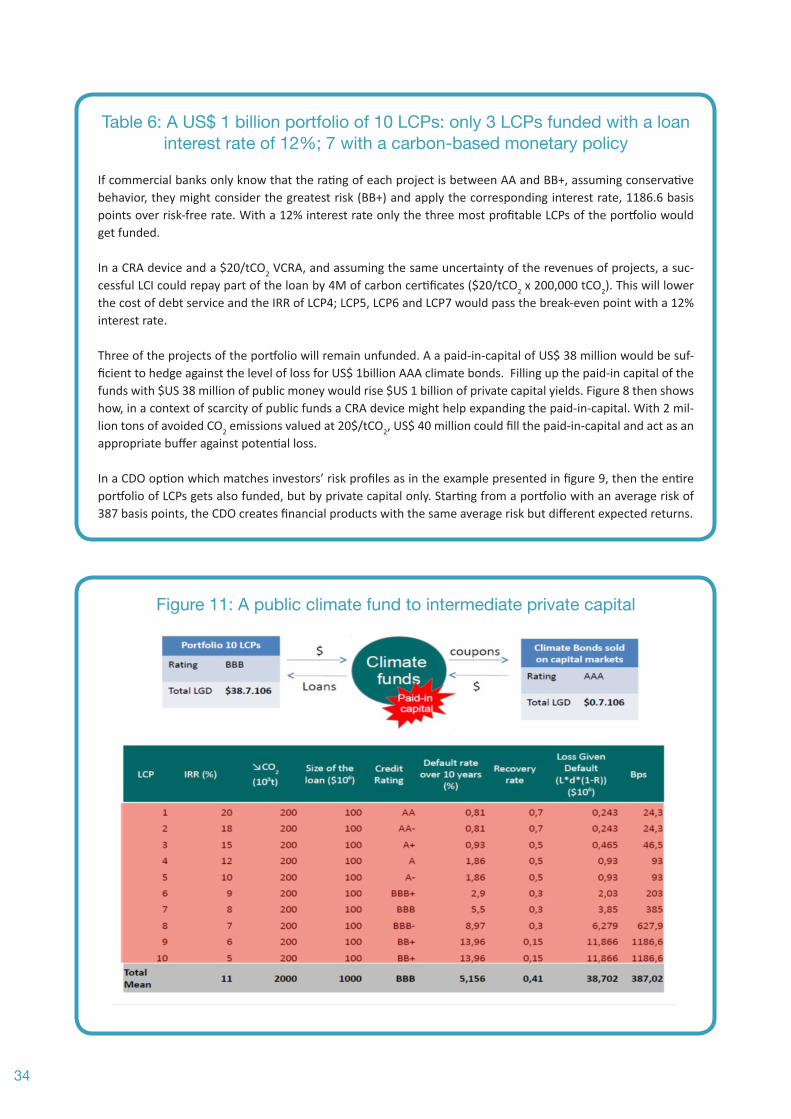
34
Table 6: A US$ 1 billion portfolio of 10 LCPs: only 3 LCPs funded with a loan interest rate of 12%; 7 with a carbon-based monetary policy
If commercial banks only know that the rating of each project is between AA and BB+, assuming conservative behavior, they might consider the greatest risk (BB+) and apply the corresponding interest rate, 1186.6 basis points over risk-free rate. With a 12% interest rate only the three most profitable LCPs of the portfolio would get funded.
In a CRA device and a $20/tCO2 VCRA, and assuming the same uncertainty of the revenues of projects, a suc-cessful LCI could repay part of the loan by 4M of carbon certificates ($20/tCO2 x 200,000 tCO2). This will lower the cost of debt service and the IRR of LCP4; LCP5, LCP6 and LCP7 would pass the break-even point with a 12% interest rate.
Three of the projects of the portfolio will remain unfunded. A a paid-in-capital of US$ 38 million would be suf-ficient to hedge against the level of loss for US$ 1billion AAA climate bonds. Filling up the paid-in capital of the funds with $US 38 million of public money would rise $US 1 billion of private capital yields. Figure 8 then shows how, in a context of scarcity of public funds a CRA device might help expanding the paid-in-capital. With 2 mil-lion tons of avoided CO2 emissions valued at 20$/tCO2, US$ 40 million could fill the paid-in-capital and act as an appropriate buffer against potential loss.
In a CDO option which matches investors’ risk profiles as in the example presented in figure 9, then the entire portfolio of LCPs gets also funded, but by private capital only. Starting from a portfolio with an average risk of 387 basis points, the CDO creates financial products with the same average risk but different expected returns.
Figure 11: A public climate fund to intermediate private capital

35
Figure 12: The private channel of CDOs to fund LCPs
3.1.3 Carbon-asset backed LCIs and firms value: Back to the Capital Asset Pricing Model
Together with making investment with upfront capital cost less risky, the presence in the portfolio of firms of assets backed by carbon certificates and, ultimately, of carbon as-sets with a value guaranteed by the Central Bank is apt to change firms strategic planning. This is easy to show with the simplest version of the capital asset pricing model.
The simplest expression of the economic value-added of the firm (EVA) can be written as follows, with R the net return of the asset (after payment of the debt service), k the weighted average capital cost of the firm and the SE its capital equity:
EVA = R – k.SE
This expression simply means that if the firm generates no value if it is not capable to generate returns higher than the returns expected to pay its capital costs. The lower the average capital cost of the firm, the higher its value is. The
average capital cost of the firm is the weighted average capital cost of its assets, namely the return expected on this asset. The required return ki of asset i is written be-low, with kf the return of a risk-free asset, km the average return on the market portfolio, and βi the risk premium associated to the asset «i»
The lower is βi the lower is the required return on asset and the higher its contribution to the value of the firm. This value in turn writes:
This means that βi is low when the value of co-variance of the value of the asset «i» and of the other assets of the market portfolio is low. The more a firm holds assets of which value is stable by comparison with other assets in which it could invest, the higher is its value.
Thus carbon assets can be of strategic interest for firms submitted to shareholder value constraints, and this might be an important source of the leverage for CC.

36
3.2 An immediate contribution to sustainable economic globalisation
Even if the CRA device is adept at fostering low-carbon investments, this in itself is not sufficient to justify its implementation in an adverse economic context. Introdu-cing a bias in favour of LCIs might be construed as crowding out other investments and eventually cause a slowdown of overall economic activity. It can also be argued that it carries the usual risks of monetary laxity, not only in terms of inflation, but also with respect to supporting socially and economically unsound infrastructure investments.
These arguments are timely caveats against presenting the CR4 device as a «free lunch» option. However, they should be discussed having in mind that the world eco-nomy is currently far from its «production frontier»10 and that the CRA based mechanism, contrary to caricatures of Keynesian compacts relies on a necessary link between money issuance and the creation of «actual wealth» in the form of technologies and infrastructures that would not have been produced otherwise. Its potential advan-tage is that it addresses the three intertwined factors that have led to the current crisis and threaten the stability of growth recovery: 1) the instability of the macro-financial system; 2) the clarity of the business environment; and 3) the disturbances in the current pattern of economic globalization.
3.2.1 Clearing the foggy business envi-ronment and dragging the world out of the economic doldrums
Since the financial crisis, the global economy has lan-guished. The stimulus plans implemented after 2009 suc-ceeded in supporting a growth rate of 3.0% in the US in 2010, following two years of recession. Thereafter, growth slowed to 1.8% in 2011 and 2.5% in 2013, prompting a de-bate on «secular stagnation». The recovery in Europe was interrupted by the Eurozone crisis, which started in 2010. Real GDP growth of the EU-27 declined 0.6% in the period 2007–2012, and the growth rate in 2013 was almost zero. Large emerging countries (Brazil, India and even China) suffered from lacklustre performances in 2013, in a trend that is expected to continue, according to the latest World Economic Outlook (April 2014).
A key underlying cause is the deleveraging of the private sector. Households are still adjusting to the impacts of the property market crashes that occurred in many countries. Small- and medium-size enterprises struggle to secure credit, while big corporations are awash with cash and cautious about investing in long maturity projects. As a consequence, investment has been hit more than overall growth (showing a drop of 14% in the EU between 2008 and 2012).
The primary contribution of the CRA device is to rouse Buridan’s donkey from its hypnotic state by telling it where to invest11. Thus, there will be no crowding out of productive investments (except for high-carbon ones) and instead there will be a redirection of savings away from speculative and/or liquid investments. This might be wel-comed by institutional investors, such as pension fund managers, who are currently acting with caution to avoid getting involved in investments with claimed high returns but which mask ventured assets.
The major challenge is to link the mitigation of climate change and the sustainability of world economic recovery through a «green growth» regime NFC that is supported by a new wave of innovation (Stern N. 2012, Stern N. and Rydge J. (2012). For Schumpeter (1939), the financial crises pinpoint transitions in growth regimes because the upward momentum that precedes the crises accumulates distortions of the market structures and income distri-bution, while the downward resolution phase comprises attempts to adapt to an incipient wave of technological innovation. These industrial revolutions are the sources of long-term growth. They reshape capital accumulation over the long term because they transform consumption patterns and social institutions.
The low-carbon transition is potentially such a new fron-tier of innovation, since it mobilises a wide spectrum of the production sector, which includes energy, buildings, transportation, material industries, and most of the processing industry, including the food industry. Impor-tantly, the transition to a low-carbon system can signifi-cantly boost economic growth over the short term, as the concerned sectors represent the majority of investments. Based on the numerical exercises presented in chapter 1, a back of the envelope calculation shows that issuing credit lines equivalent to 0.12% of the OECD GDP in 2035 would redirect (assuming a leverage ratio of 10 between public money and private finance approximately 1000 G$
10 i.e. an economy with a full utilization of available production factors (labor, capital and primary resources)11 Ben Bernanke, Governor of the U.S. Federal Reserve Board recognized as far back as 2005: «During the past few years, the key asset-price effects of the global saving glut appear to have occurred in the market for residential investment, as low mortgage rates have supported record levels of home construction and strong gains in housing prices»

37
in 2035, corresponding to around 8% of the world gross capital formation.
However, Schumpeter’s message is that a long-lasting innovation wave can take off only when its promises are supported by the «animal spirits» of finance. Cur-rently, these ‘animal spirits’ work in a totally different direction. Changing this direction is all the more timely in that concerns are currently being expressed by top-level economic authorities that the reductions in public and private spending imposed to reimburse outstanding debt may dangerously weaken the final aggregate demand. A major difference between the CRA mechanism and the traditional Keynesian compact is that credit facilities are backed by infrastructure as collateral. This is why this could be one instrument to operate the ‘infrastruc-ture push’ called for in the last World Economic Outlook of the International Monetary Fund (2014).
3.2.2 The macro-financial advantage of a stable benchmark
The condition that money issuance must lead to the crea-tion of «actual wealth» is a first response to the stated potential risks of inflation and the surge of speculative
«carbon bubbles» (see Box 3). A second and more com-prehensive response to the raised objections is that the C4 device provides a contribution to harness the animal spirits of finance by providing a stable benchmark for the financial and monetary systems.
To appreciate this contribution, let us start with Figure 10, which visualises one major macro-economic problem faced by the world economy after the deployment of financial deregulation. Business cycles are characterized by a «Great Moderation» in inflation12, whereas financial cycles are of far greater magnitude and have far longer time-spans than in the past (Schularick and Taylor, 2009). Financial cycles are assessed based on the gap between the trend of an index that combines credit growth and asset prices (a mix of equity, bonds, and real estate price indices).
Figure 13: Business and financial cycles in the US (1980–2011)
This gap translates into a misalignment over a long period of time of asset prices and very long-run benchmarks (the «true» value of assets). It has pervasive efficiency costs that swamp the signals upon which investors base their decisions. It is driven by private credit dynamics and its
magnitude reflects the self-fulfilling prophesies of market participants that prices will go on moving in the direction that they have taken in the past. Financial intermediaries are governed by the same self-fulfilling expectations as their borrowers. They lent money to finance speculative
12 The term «Great Moderation» first appeared in the paper by James Stock and Mark Watson (2002) titled «Has the business cycle changed and why?» (NBER Macroeconomics Annual). It is due to the combination of the emergence of China as a key world economic competitor leading to lower wage increases in many industries and of monetary policies prioritizing the control of inflationary risks. See also the paper of P.M. Summers (2005) titled «What caused the great Moderation? Some cross-country evidence» (Federal Reserve Bank of Kansas City Economic Review, no. 90)

38
positions on asset prices and accepted those same as-sets as collateral for their loans. Thus, more credit led to higher asset prices, higher value of the collateral, lower perceived risk on loans, and new demand for credit.
Therefore, asset prices cannot be vectors of macroeco-nomic adjustments. They exacerbate real disequilibria, as was observed with the cumulative global imbalances in the balance of payments and in the balance sheets of fi-nancial institutions, which receded only during the finan-cial crisis. Price reversals arise exclusively through crises, endogenous «booms and busts» with unknown tipping points that shift the mood of market participants (Adrian Ovitz and Liang, 2013).
If macro prudential policies are not sufficiently strong to mitigate the impact of the reversal of asset prices, then finance is not self-stabilizing and a single-handed mone-tary policy focused on low inflation will not be conducive to macro stability. Real imbalances are even magnified by the Great Moderation in inflation, since the huge gyra-tions in asset prices are real price changes (Aglietta, 2014). One responsexxi is to anchor money in a basket of com-modities, as in the Keyne’s Bancor proposal at Bretton-Woods. In the fixed but adjustable system of exchange rates planned to be reinstated after the war, Keynes pro-posed a symbolic link to gold in defining the bancor in terms of gold. In present time, and contrary to the post-war world, exchange rates are variable and capital flows are mostly free . If however a social value of the CRAs is instituted by international agreement and if low-carbon investments become backbones of NAMAs in a large num-
ber of countries, CRA assets would be a common asset in the balance sheet of central banks as counterpart of na-tional currencies issued on their liability side. They could thus incentivise financial intermediation to do its job of financing the real economy.
CRAs are not a substitute for stricter financial regulation and will not be sufficient to prevent financial crises similar to those that arose during the Gold Standard era during the initial phases of financial globalisation. However, they can contribute to the search for a more stable financial context by becoming de facto a common numeraire for interbank settlement payments amongst the banks of the «club» of participating countries. These could in a second step acquire the status of world reserves, with the so-cial value of carbon (price of a unit of CRA) ultimately an international unit of account in the international mone-tary system. The first step towards this recognition being that they are internationally recognized as assets to fill the Green Climate Fund.
The benefit to be derived would be in lowering one source of tensions in the economic globalisation process, i.e., the distortions in exchange rates due to the «war-chest» of official reserves accumulated in the emerging world after the financial crises of the 1980s and 1990s in Latin Ame-rica and Asia. These reserves, which are invested mainly in US Treasury securities, were built-up to protect export-led growth strategies against exchange-rate appreciation and as self-insurance against currency crises. Carbon-based reserve assets could allow these economies to increase and diversify their foreign exchange reserves13.
Box 10: Systemic risks for the financial and monetary systems?
One legitimate concern about the scaling up of climate finance through the creation of carbon assets is that it will generate inflation and, through the financial intermediaries necessary to create assets apt to diversify the risks and to finance portfolios of LCIs, facilitate the emergence of carbon bubbles like the real estate bubbles. Actually, the risk of a «carbon bubble» followed by a «carbon subprime crisis» is very low. Indeed, while the increase in the value of real estate assets rested on very low interest rates and was unbound, the VCRA is fixed ex-ante. Even though there will be a secondary market of Carbon Certificates or of bonds backed by CRAs prices on the secondary market will stay in a rather narrow margin of fluctuation around its face value at which the Central Bank accepts it as repayment be constrained by the fact that, ultimately, CC can only be reimbursed by the Central Bank at their face value.
13 The CRA device could thus respond the concerns emphasised by Zhu Xiaochuan, the Governor of the People’s Bank of China when he called for an SDR reserve-based system in 2010. C. Jaeger, A. Haas and K. Töpfer (2013) have shown how this proposal could contribute to sustainable develop-ment and suggest the link with climate policies.

39
Certainly, the risk that a significant share of LCIs default cannot be totally excluded, forcing governments to back the debt in last resort and eventually provide «hard cash» as investors would call upon the public guarantee. Countries’ taxpayers would then later pay a debt service due to misdirected and mismanaged projects. However, the orders of magnitude of this carbon based monetary creation are far lower than the several percent of the GDP issued by the Federal Bank in the US and the EU Central Banks to rescue the banking systems since 2008.Building upon the scenarios provided in the first section of this note, let us assume that (i) OECD countries follow the CPS scenario in 203514; (ii) the VAE is 200$/tCO2e – the upper bound of the likelihood space of carbon prices given by the last IPCC report for this time horizon; and that (iii) credit lines are issued in proportion to half of the gap between the CPS baseline and the 450 ppm scenario.
Under these assumptions, the total value of the carbon assets issued by OECD countries in 2035 would repre-sent 1% of the world GDP in case of leverage of private savings and private loans. Assuming a 10% leverage, the needed issuance would be 0.1% of the GDP and the cumulated carbon assets in the balance sheets of central banks amounting to 1.5% of this GDP.
The systemic risks for the financial and banking system are low because carbon certificates are authenticated by control procedures based on technical information which do not exist for other investments for securing that the collateral of the money has been produced and, because the CRA based device provides three control levers that can be used every five years: the volume of carbon assets, their value and the number of carbon certificates available for each type of investment.
14This is a pessimistic assumption because, if the system works after 2015, the OECD should in fact follow another baseline.15This would also spread the gains from seignior age and reduce the perverse effect that forces the United States to pump out more US$ assets for global reserves.
3.2.3 Mitigating the structural imbalances in the world «real economy»
If countries that have non-convertible currencies have access to a pool of supranational carbon-based as-sets, they would be less inclined to run balance-of-payment surpluses, since they would amass their re-serves in proportion to emission reductions that they finance domestically.15 This would also contribute to spreading the gains from seigniorage and to modera-ting the perverse phenomenon whereby the US is for-ced to pump out more US$ assets for global reserves. In the global context, this would reduce tensions on ex-change rates and have an impact on the current pattern of economic globalisation. Today, the catching up of emerging economies is grounded on export-led strategies and the accumulation of reserves. These measures are supported by policies to lower exchange rates and to moderate wage increases. They result in many imbalances, such as huge capital flows from China to the US, the backwardness of the domestic infrastructures in emerging economies, and the weakening of the social contract in many OECD countries.
The contribution of a low-carbon transition supported by carbon-based financial products would facilitate the
adoption by emerging economies of a more «endoge-nous», inward-oriented and inclusive growth pattern. While this option is in principle politically attractive to se-cure the social cohesion of countries, it is often discarded due to the lack of a guarantee that less-export-oriented efforts will not lower the pace of growth and trigger social tensions. A CRA device would provide part of this gua-rantee. First, it would reorient domestically a fraction of the private savings of emerging countries that currently flow into the rich countries’ banking systems. Second, since 55% of carbon savings investment would take place in developing countries, a CRA device would reorient to-wards the economies of these countries a fraction of the savings that currently flow into the world financial system (for example, from China to the US).
In proposing this device Annex 1 countries would assume their historical responsibility for climate change and the fi-nancial meltdown, and would help non-Annex 1 countries to implement a sustainable development strategy that is aligned with the UNFCCC objectives.
This alignment will be translated in very different manner according to the world region in focus and what matters in that each of them can use it in function of its strategic priorities. Emerging and less-developed economies have

40
a keen interest in redirecting their infrastructure policies towards low-carbon and less-energy-intensive choices (Shukla and Dhar, 2011); this is a matter of energy secu-rity, development, and reduced exposure to the turmoils of changes in currency rates and domestic asset prices. Instead of perceiving climate policy as a threat, oil and gas exporters could use it as a way to escape the resource curse by using their long-lasting rents to build up indus-trial, agricultural, transport, and energy systems that will be viable when these rents will vanish. Europe is specifi-cally interested in complementing its current fiscal com-pact with a «green growth» compact, to reinforce the unity that has been undermined by trade imbalances amongst the Member States. As for the US, the manna of shale gas and oil could be used as a leeway to decarbonise
their economy at a pace compatible with the inertia of their installed capital stock instead of using it to pursue an energy-intensive development pattern which could turn into a trap when this «manna» will be exhausted.
Ultimately the common interest of all world regions is to mobilise the investment opportunities created by the low-carbon transition, a climate-friendly finan-cial architecture would help pinpointing the thin pa-thway to navigate the treacherously narrow pathway between extreme rigour, which freezes economic growth (and throws some regions into recession), and extreme laxity, which pushes the burden of econo-mic and environmental debts onto future generations.

41
Conclusion
To sum up this monetary instrument is tantamount for the central banks to buying a service of carbon emis-sion reduction at a price justified by society’s willingness to pay for a better climate. Carbon-based liquidities can be therefore considered as «equity in the commonwealth». The equity pays dividends in the form of «actual wealth» created by productive low carbon investments and averted emissions in the short term, a stronger resilience of the economy to environmental and financial shocks in the longer term. The proposed system would send a carbon price signal through the VCRA while being politically acceptable because it does not impose direct costs on firms or consumers. It also stimulates mitigation efforts efficiently without impo-sing demands on industrialized country government budgets. It will also help to divert a share of private savings from speculative assets to productive low-carbon investments.
Because the potential scale of this system is large enough to make a significant contribution to stimulating economic growth over the short term it can catalyze an alliance between the «climate concerned» and the «climate agnostics» concerned by the current state of the still unstable world economy. This alliance, pre-condition to launch now the ambitious transformation of our technical systems requires to fulfill the UNFCCC objectives, would lay the foundation for new global social contract around the protection of our Global Com-mons and its alignment with an equitable access to development. Climate finance is part of the social contract.
By proposing this type of approach, the developed countries would assume their historical responsibility both cli-mate change in the global financial crisis. Respecting the compromise to upgrade a significant fund, they would, beyond, demonstrate that will to help non-Annex one countries to untie the climate development Gordian Knot.
Obviously, part of the evolution suggested in this note goes far beyond the competencies of the UNFCCC. However, the responsibility of the UNFCCC process, during its journey towards COP21, is to provide hooks for advances in order domains of global governance, so that the evolution of the governments will be aligned with, and will not contradict, its objectives.


43
Notes
iTypically, the only provision of the Kyoto Protocol (Article 12(8)) intended to cover the administrative expenses of the reporting of national emissions and the costs of adaptation was the payment of a share of the proceeds of the CDM and not those of carbon tra-ding amongst rich countries. Another example is the Brazilian proposal for a compliance fund, which was not retained (UNFCCC 1997) and the proposal of restoration fund to unlock the discussions at COP6 was not retained either (CIRED-RFF 2000).
iiAbout a synthetic view of the CDM and its contribution, see Lecocq and Ambrosi (2007).
iiiFor a discussion of the rationale and consequences of the ‘concrete ceiling’ option see: Ellerman & Wing (2000), Gupta & Grubb (2000), Hourcade & Ghersi (2002).
ivThe Green Growth concept was launched just after the burst of the economic and financial crisis by the ‘Green Growth Report of the UNEP (2011), the report on ‘Inclusive Green Growth of the World Bank (2012) and many contributions of the OCDE (2009). The concept, which complements the notion of sustainable development by insisting on the necessity of a short term economic recovery was confirmed at Rio 2012.
vGiven the level of aggregation of IMACLIM-R we do not provide results for the non-energy exporting countries of Africa and of the rest of Oecd, Latin America and Asia. However, the range for these three major economies is consistent with the US $264–$563 billion upfront given by the WB (2009) for the totality of the developing world.
viThe case of the O&G exporting regions rises a specific problem for modeling experiments due to the so-called ‘natural resources curse’ which refers to the historical evidence that countries with very high rents from domestic natural resources are not necessarily the most developed because of a mix of economic factors (an exchange rate which penalizes the competitiveness of their domestic industry and agriculture) and institutional factors (which prohibits the most efficient recycling of the rent in the economies (Frankel, J.A., 2010, Sachs and Warner,2001). This makes the results of policy analysis through general equilibrium models very sensitive to assumptions about the efficiency of the allocation of the rent in the economy and of the increase of industrial productivity generated by higher domestic investments in non-energy sectors; for recent example of such a discussion in the context of climate policies see Waisman et al (2013).
viiUsing the Euklem data base (www.EUKLEM.net we assume that, in 2020: a) 25% of the investments of the households, business and financial intermediaries in residential and non-residential infrastructures is redirected towards low carbon options with an extra unit cost of 5% b) 10% of the investment of the transportation sector (a low percent because of the low substitutability between rail based and road bases transport) with an extra unit cost of 10% c) 33% of the electricity and gas investment with an extra unitary up-front investment of 20% d) a decrease by 10% of the investment in mining and carrying d) 20 % of the investments in machines.
viiiThey are held by 1) global non-financial corporations and institutional investors outside the banking system 2) mutual funds and hedge funds (managed liquidity and cash collateral associated with securities lending) 3) the overlay of derivatives linked to deriva-tives-based investment 4) wealthy individuals and endowments.
ixThis legend is a caricature of Jean Buridan, a theologian at the Sorbonne in the 14th century, who argued that a wise conduct is to postpone decisions up to the availability of the necessary information. The legend counts the sad story of a donkey whodies hesitating between oats and the pail of water placed at equal distance from him. A non-directed inflow of money comes to add more oats and water in front of it without breaking its hypnosis.
xThe IEA (WEIO 2014) analyses that a 3% decrease in the cost of capital can have a significant impact on the cost of producing electri-city for low-carbon technologies: -25% nuclear, -15% for CCS technologies (coal) and -20% for photovoltaic and wind power. Such an evolution by 2015 would allow governments to save 40% subsidy on renewable or $ 800M by 2035.
xiThe KP actually follows stricto sensu a subsidiarity principle: a) emissions allowances are allocated to nation states b) countries select domestic policies to meet their emissions caps given their national development objectives, and c) an international carbon market ins-tituted amongst governments facilitate them to meet their commitments cost-effectively. This inter-countries market would generate a world carbon price, but domestic carbon prices could differ. A country meeting its GHGs emissions targets without carbon prices but through traffic regulation (e.g. speed limit), housing programs or subsidies to low carbon electricity could nevertheless participate in international carbon trading.
xiiThe mechanisms at play are demontrated in Ghersi, Hourcade, Criqui, 2003. The key point is that the inflow of revenues generated by exports of carbon allowances does not compensate for the adverse effects of the propagation of higher energy costs througout the industry of emerging economies. Their competitiveness is more affected than this of developped countries, given a higher share of energy intensive industry during a catch-up phase of development. The impact on the purchasing power of households is also higher.

44
xiiiMany sources of the wedges between technical, social and macroeconomic cost curves have been underlined as early as the IPCC SAR (1996, chapter 8), and encompasses a rich array of literature about the double dividend hypothesis which assumes that fiscal reforms can lower the social cost of environmental policies and can even turn into a gain. For a short synthesis. The fourth assessment report of the IPCC placed a useful caveat on the vision described by modeling exercises which assume long term balanced growth pathways and “use a global least cost approach to mitigation portfolios and with universal emissions trading, assuming transparent markets, no transaction cost, and thus perfect implementation of mitigation measures throughout the 21st century” (IPCC AR4 WGIII SPM Box 3, 2007).
Here lays the fundamental reason why a carbon-price-only framework hardly offers an acceptable deal for emerging and developing countries. This should not be a surprise for economists who, a very long time ago, warned that recommendations – here a carbon price- valid in a 1st best world are not necessarily valid in a 2nd best one (Lipsey and Landcaster, 1956; Guesnerie, 1980).
xivThe first of these reasons questions the capacity of monetary compensations to mitigate the heterogeneity of adverse effects of higher energy prices.
xvHere, strong para on existing proposals and special issues (Haites, 2011).
xviFor an exemplification of how an agreement can be made despite heterogeneous perceptions of costs and benefits of mitigating climate change, see Hourcade & Ghersi (2002) about the creation, in the context of the Kyoto Protocol, of corridor of carbon price (floor price and safety valve).
xviiShukla and Dhar (2011) exemplify, in the case of India, how the social value of carbon in this country varies from one to three depen-ding upon non climate related policies.
xviiiWe do not enter here in the discussion of the normative allocation. To avoid endless controversies, it should be clear from the begin-ning that it will be a mix of two criteria (convergence of emissions per capital and convergence of emissions per GDP). Do not enter here in the discussion of the normative allocation. A lot of mixed formula incorporating per capita convergence in a broader system based on historical trends have been put forward (Agarwal and Narain, 1991; Jacoby et al., 1999; Colombier, 1998; Frankel, 2007, Bossetti and Frankel, 2011) To avoid endless controversies, it should be clear from the beginning that it will be a mix of two criteria (convergence of emissions per capital and convergence of emissions per GDP).
xixInsights on the upfront costs and learning processed can be found in Bramoullé and Olson, 2005; Del Rio Gonzalez, 2008; Gerlagh et al., 2014; Goulder and Mathai, 2000; Kverndokk and Rosendahl, 2007). As to the link between the inertia of capital stocks and the timing of action see Vogt-Schilb et al., 2014; Vogt-Schilb and Hallegatte, 2014, Jaccard and Rivers, 2007; Lecocq et al., 1998; Waisman et al., 2012, Grubb et al 1998). A recent general picture of the ‘valley death problem’ can be found in ‘pulling further, pulling deeper’, chap 9 of Planetary Economics (Grubb et al. 2014).
xxThis low carbon facility could issue Green Bonds to be acquired by institutional investors worldwide searching for diversifying their portfolios in alternative assets. If the Fund could accumulate $100bns up to 2030 and if it invested in well-diversified projects, so that one can assume that the probability density function is Gaussian, it would have 99.9% probability that its capital base could absorb its losses. Hence, it could issue $1trn bonds to leverage its financing and back credit facilities to developing countries on real wealth and low-carbon investments.
xxiKeynes was obsessed by devising a system that could promote symmetry of adjustment in the balance of payments between deficit and surplus countries in a multilateral payment system, the latter being almost exclusively the US in the foreseen post-war world. To achieve symmetry he conceived to extend at the international level the interbank settlement mechanism on the book of national central banks. He proposed an international clearing union, which would have been akin to a world central bank for central banks. The clearing union would issue its own debt denominated in what he called “bancor” as an international means of payment for deficit countries, while surplus countries substituted claims on the clearing union for their credit on deficit countries. Both types of countries would be subjected to quotas over which adjustment would be triggered by collective agreement, possibly by devaluation and reva-luation of the national currencies concerned. The bancor would have been the center of the international monetary system, the use of gold as the ultimate means of payments being ousted. However, in the fixed but adjustable system of exchange rates planned to be reinstated after the war, Keynes proposed symbolically to define the bancor in terms of gold.

45
Bibliographie
Adrian T., Covitz D. and Liang N., 2013. Financial Stability Monitoring, FED NY Staff Reports, n°601, February.
Agarwal, A. Narain, S., 1991. Global warming in an unequal world: a case of environmental colonialism, Center for Science and Environment, New Delhi, 34 p.
Aglietta M., 2014. L’aggiornamento des politiques monétaires, in Les Banques Centrales.
Bodansky, D., 2011a. W[h]ither the Kyoto Protocol? Durban and Beyond, Harvard Project on Climate Agreements, 12 p.
Bodansky, D., 2011b. A Tale of Two Architectures: The Once and Future U.N. Climate Change Regime, Arizona State Law Journal 607-713.
Bovenberg, A.L., Goulder, L.H., Jacobsen, M.R., 2008. Costs of alternative environmental policy instruments in the presence of industry compensation requirements. Journal of Public Economics, 92, 1236–1253.
Bovenberg, A.L., de Mooij, R.A., 1994. Environmental Levies and Distortionary Taxation. American Economic Review, 84, 1085–1089.
Bramoullé, Y., Olson, L.J., 2005. Allocation of pollution abatement under learning by doing. Journal of Public Economics 89, 1935–1960.
Bredenkamp, H., C. Pattillo. 2010. Financing the Response to Climate Change. IMF Staff Position Note. IMF.
Buchner, B, et al., 2013. The Global Landscape of Climate Finance 2013. CPI Report. CPI.
Byrd-Hagel, 1997. http://www.nationalcenter.org/KyotoSenate.html
Carraro, C., and D., Siniscalco, 1998. International Institutions and Environmental Policy: International environmental agreements: Incentives and political economy, European Economic Review, 42, Issues 3–5, 31 May 1998, pp.561–572.
CIRED-RFF, 2000. Summary of CIRED-RFF Workshop on Compliance and Supplementarity. http://204.176.103.53/neg-table/ciredrff_summary.pdf (accessed January 2002).
CISL & UNEP FI, 2014. Stability and Sustainability in Banking Reform : Are Environmental Risks Missing in Basel III ?
Cormier, P., V. Bellassen, 2013. The risks of CDM projects: how did only 30% of expected credits come through?, Energy Policy, 54, pp. 173-183.
De Gouvello, C. Zelenko, I., 2010. Scaling up the financing of emission reduction projects for low carbon development in developing countries. Proposal for a low carbon development facility, Policy Research Working Paper, World Bank.
Del Rio Gonzalez, P., 2008. Policy implications of potential conflicts between short-term and long-term efficiency in CO2 emissions abatement. Ecological Economics 65, 292–303.
Ellerman, A. D., and I.S. Wing, 2000. «Supplementarity: An invitation to Monopsony?» The Energy Journal 21(4): 29−59.
Espagne, E., P. Dumas, A. Pottier, B. Perrissin-Fabert, F. Nadaud, 2014. Why are climate policies of the present decade so crucial for keeping the 2 °C target credible ?. Climatic Change, Springer Verlag (Germany), 2014, 126 (3-4), pp.337-349

46
Estrada, R., 1998. «First Approaches and Unanswered Questions.» In Issues and Options: The Clean Development Me-chanism, 23–29. UNDP.
Falkner, R., Hannes, S., Vogler, J., 2010. International Climate Policy after Copenhagen: Towards a « Building Blocks » Approach, Global Policy, 252-262.
Ferron, C., Morel, R. 2014. Smart Unconventional MOnetary (SUMO) Policies: giving impetus to green investment. CDC Climat Research.
Frankel, J.A., 2010. The Natural Resource Curse: A Survey. NBER Working Paper no. 15836.
Gerlagh, R., Kverndokk, S., Rosendahl, K.E., 2014. The optimal time path of clean energy R&D policy when patents have finite lifetime. Journal of Environmental Economics and Management 67, 2–19.
Ghersi, F., J.-C. Hourcade et P. Criqui, 2003. « Viable Responses to the Equity-Responsibility Dilemma : a Consequenti-alist View », Climate Policy 3 (1) : pp. 115-133
Giraud, Gaël. forthcoming. “COP21 À Paris En 2015 : Une Proposition de Financement International de La Transition Énergétique Dans Les Pays Émergents”
Goulder, L.H., Mathai, K., 2000. Optimal CO2 Abatement in the Presence of Induced Technological Change. Journal of Environmental Economics and Management 39, 1–38.
Grubb M., Hourcade J.-C, Neuhoff K., 2014. Planetary Economics, Earthcan, Routledge, New-York.
Grubb, M., 1990. The greenhouse effect: Negotiating targets, Royal Institute for International Affairs, (RIIA), London.
Guesnerie, R., 1980. Second best pricing rules in the Boiteux tradition: Derivation, review and discussion, Journal of Public Economics, 13 (1), pp. 51-80.
Guigon, P., V. Bellasen, P. Ambrosi, 2009. Voluntary Carbon Markets: What the Standards Say…, Mission Climat Working Paper, Caisse des Dépôts.
Gupta, J., & Grubb, M. J. (Eds.), 2000. Climate change and European leadership: A sustainable role for Europe? (Vol. 27). Springer.
Haites, E., 2011. Climate Change Finance. Climate Policy. Vol 11, Issue 3, pp 963-969.
Hourcade J.-C, 2001. Le Climat au risque de la négociation internationale, le Débat, n°113.
Hourcade J.-C., Shukla P.R., 2013. Triggering the low-carbon transition in the aftermath of the global financial crisis, Climate Policy : Supplement 1 : Low Carbon Drivers for a Sustainable World, Volume 13, 2013 : pages 22-35.
Hourcade, J.-C, Ambrosi P., Dumas P., 2009. Beyond the Stern Review : Lessons from a risky venture at the limits of the cost-benefit analysis, Ecological Economics, Volume 68 (10), pp.2479-2484, ISSN 0921-8009, DOI : 10.1016/j.eco-lecon.2009.04.011.
Hourcade, J.-C, Baron, R., Godard, O., 1993. International Economic Instruments and Climate Change, OECD, 107 p.
Hourcade, J.-C. et F. Ghersi (2002), The Economics of a Lost Deal : Kyoto - The Hague -Marrakesh, The Energy Journal 23 (3) : pp. 1-26.
Hourcade, J.-C., Ghersi, F., (2009), Interpreting Environmental Policy Cost Measures, in Gerlagh, R., Bosetti, V., Schlei-cher, S. (ed.), modeling Sustainable Development, Edward Elgar, Cheltenham, pp. 62-83.
47
HOURCADE, J.C., SHANKER A., 1989. «From greenhouse to the reshaping of financial structure of technology trans-fer», in Pacific and Asian Journal of Energy, vol. 3, n° 2, pp. 79-91.
Hulme, M., 2010. Moving beyond Climate Change, Environment, 15-19.
International Energy Agency, 2014. World Energy Investment Outlook. Special Report. International Energy Agency, Paris.
International Monetary Fund, 2014. World Economic Outlook—Recovery Strengthens, Remains Uneven (Washington, April 2014).
IPCC, 2014: Summary for Policymakers. In: Climate Change 2014: Mitigation of Climate Change.Contribution of Working Group III to the Fifth Assessment Report of the Intergovernmental Panel on Climate Change [Edenhofer, O., R. Pichs-Madruga, Y. Sokona, E. Farahani, S. Kadner, K. Seyboth, A. Adler, I. Baum, S. Brunner, P. Eicke-meier, B. Kriemann, J. Savolainen, S. Schlömer, C. von Stechow,T. Zwickel and J.C. Minx (eds.)]. Cambridge University Press, Cambridge, United Kingdom and New York, NY, USA
IPCC FAR WG3 (2007), Contribution of Working Group III to the Fourth Assessment Report of the Intergovernmental Panel on Climate Change, 2007. B. Metz, O.R. Davidson, P.R. Bosch, R. Dave, L.A. Meyer (eds). Cambridge University Press, Cambridge, United Kingdom and New York, NY, USA.
IPCC SAR WG3 (1996), Bruce, J.P., Lee, H., Haites, E.F., ed., Climate Change 1995: Economic and Social Dimensions of Climate Change, Contribution of Working Group III to the Second Assessment Report of the Intergovernmental Panel on Climate Change, Cambridge University Press. United Kingdom and New York, NY, USA.
Jaccard, M., Rivers, N., 2007. Heterogeneous capital stocks and the optimal timing for CO2 abatement. Resource and Energy Economics 29, 1–16.
Jaeger C., A. Haas, K. Töpfer, 2013. Sustainability Finance and a Proposal from China, Institute for Advanced Sustainabi-lity Studies and Global Climate Forum, Institute for Advanced Sustainability Studies and Global Climate Forum. Postdam and Berlin.
Kaminker, C. et al., 2013. Institutional Investors and Green infrastructure Investments: Selected Case Studies, OECD Working Papers on Finance, Insurance and Private Pensions, No. 35, OECD Publishing
Kolstad C., K. Urama, J. Broome, A. Bruvoll, M. Cariño Olvera, D. Fullerton, C. Gollier, W. M. Hanemann, R. Hassan, F. Jotzo, M. R. Khan, L. Meyer, and L. Mundaca, 2014. Social, Economic and Ethical Concepts and Methods. In: Climate Change 2014: Mitigation of Climate Change. Contribution of Working Group III to the Fifth Assessment Report of the Intergovernmental Panel on Climate Change [Edenhofer, O., R. Pichs-Madruga, Y. Sokona, E. Farahani, S. Kadner, K. Sey-both, A. Adler, I. Baum, S. Brunner, P. Eickemeier, B. Kriemann, J. Savolainen, S. Schlömer, C. von Stechow, T. Zwickel and J.C. Minx (eds.)]. Cambridge University Press, Cambridge, United Kingdom and New York, NY, USA.
Kroll, Matthias. 2011a. “The Lack of $100 Billion for Climate Finance and the Possibility to Create New Global Reserve Money in the Form of Special Drawing Rights from the IMF.” In Poznan.
Krugman P., 2008. The Return of Depression Economics and the Crisis of 2008. W.W. Norton & Company, Inc., New York.
Kverndokk, S., Rosendahl, K.E., 2007. Climate policies and learning by doing: Impacts and timing of technology subsi-dies. Resource and Energy Economics 29, 58–82.
Lecocq, F. and Ambrosi, P., 2007. The Clean Development Mechanism: History, Status, and Prospects, Review of Envi-ronmental Economics and Policy, volume 1, issue 1, winter 2007, pp. 134 – 15. doi: 10.1093/reep/rem004.
Lecocq, F., Hourcade, J.-C., Ha Duong, M., 1998. Decision making under uncertainty and inertia constraints: sectoral implications of the when flexibility. Energy Economics 20, 539–555.

48
Lecocq, F., Shalizi, Z., 2014. The economics of targeted mitigation in infrastructure. Climate Policy 14, 187–208.
Lipsey, R. G., K., Lancaster (1956), The general theory of second best, The Review of Economic Studies, pp. 11-32.
Mercer, J., 2010. Disaster risk reduction or climate change adaptation: Are we reinventing the wheel?, Journal of Inter-national Development, 22( 2), pages 247–264.
Millard-Ball, A., 2013. The trouble with voluntary emissions trading: Uncertainty and adverse selection in sectoral cre-diting programs. Journal of Environmental Economics and Management 65(1), 40 – 55.
Morel, R. et al., 2014. Panorama des financements climatiques en France en 2011. CDC Climat Recherche & CPI.Nordhaus, W. (2007). A Review of the «Stern Review on the Economics of Climate Change». Journal of Economic Litera-ture, 45(3) :686–702.
Nordhaus, W.D., 2008. A question of balance: weighing the options on global warming policies.OCDE, 2009. Declaration on Green Growth Adopted at the Meeting of the Council at Ministerial Level on 25 June 2009 [C/MIN(2009)5/ADD1/FINAL].
Perrissin Fabert B., Rozenberg J., 2012. Venturing into uncharted financial waters : an essay on climate-friendly finance, International environmental agreements-Politics law and economics, 12(2), p 165-186, DOI:10.1007/s10784-012-9169
Polszar, Z. 2011. Institutional cash pools and the triffin dilemma of the US bnaking system, IMF Working Paper, n°190, August 2011.
Pottier et al., 2014. L’Économie dans l’impasse climatique : développement matériel, théorie immatérielle et utopie auto-stabilisatrice, THÈSE D’ÉCONOMIE, École des hautes études en sciences sociales, soutenue le 28 mai 2014.
Proost, S., Regemorter, D., 1995. The double dividend and the role of inequality aversion and macroeconomic regimes. International Tax Public Finance, 2, 207–219.
Robert S. Pindyck, 2013. «Climate Change Policy: What Do the Models Tell Us?,» Journal of Economic Literature, Ame-rican Economic Association, vol. 51(3), pages 860-72, September.Roe, M.J. 1994. Strong Managers, Weak Owners: the Political Roots of American Corporate Finance. Princeton: Princeton University Press.
Sachs, J.D.,Warner, A.M.,2001. Thecurse of natural resources. European Economic Review, 45(4–6), 827–838.
Shishlov, I., et Bellassen V., 2012. Dix enseignements pour les dix ans du MDP, n°37, Etude de La Mission Climat, Caisse des dépôts.
Schularick M and Taylor A., 2009. Credit booms gone bust: monetary policy, leverage cycles and financial crises, 1870-2008, NBER Working Paper, n°15512.
Schumpeter J.A., 1939. Business Cycles, Cambridge University Press.
Shukla, P. R., S., Dhar, 2011. Climate agreements and India: aligning options and opportunities on a new track. Interna-tional Environmental Agreements: Politics, Law and Economics, pp. 229-243.
Stern, N. (2006). The Economics of Climate Change. The Stern Review. Cambridge University Press.
Stern, N. (Ed.)., 2007. The Economics of Climate Change: the Stern review. Cambridge University press.
Stern, N. and Rydge, J., 2012. ‘The new industrial revolution and international agreement on climate change’, Econo-mics of Energy and Environmental policy, 1: 1-19.

49
Stern, N., 2012. How can we respond and prosper: The New Energy-Industrial Revolution, Lionel Robbins Memorial Lec-ture Series, Slide 5. London School of Economics.
Stock J.H., M. Watson, 2002. Forecasting using principal components from a large number of predictors, Journal of the American Statistical Association, 97(460), pp. 1167-1179.
Summers P.M., 2005. What caused the Great Moderation? Some cross-country evidence, Federal Reserve Bank of Kan-sas City Economic Review, n°90.
Teulings, C., & Baldwin, R., 2014. Secular Stagnation: Facts, Causes and Cures. London: Centre for Economic Policy Research.
Timilsina G.R., de Gouvello, C., Thioye, M., Dayo F.B., 2010. Clean Development Mechanism Potential and Challenges in Sub-Saharan Africa, Mitigation and Adaptation Strategies for Global Change, 15, Issue 1, pp 93-111.
Trexler, M.C., Broekhoff, D.J., Kosloff, L.H., 2006. A statistically-driven approach to offset-based GHG additionality determinations: what can we learn? Sustainable Development Law & Policy 6, 8.
UNEP, 2011. Towards a green economy. Pathways to Sustainable Development and Poverty Eradication, UNEP/GRD-Arendal, www.unep.org/greeneconomy.
UNFCCC, 1997. Proposed elements of a protocol to the United Nations framework Convention on Climate Change pre-sented by Brazil in response to the Berlin Mandate, AGBM/1997/misc.1/add.3.
UNFCCC, 2011. Decision 1/CP16, The Cancun Agreements: Outcome of the work of the Ad Hoc Working Group on Long-term Cooperative Action under the Convention.
UNFCCC, 2011. Report of the Conference of the Parties serving as the meeting of the Parties to the Kyoto Protocol on its sixth session, held in Cancun from 29 November to 10 December 2010. UNFCCC.
Victor, D., 2011. Global warming gridlock, New York, Cambridge University Press.
Vogt-Schilb, A., Hallegatte, S., 2014. Marginal abatement cost curves and the optimal timing of mitigation measures. Energy Policy 66, 645–653.
Vogt-Schilb, A., Hallegatte, S., de Gouvello, C., 2014. Marginal Abatement Cost Curves and Quality of Emission Reduc-tions: A Case Study on Brazil. Climate Policy (forthcoming) DOI: 10.1080/14693062.2014.953908.
Vogt-Schilb, A., Meunier, G., Hallegatte, S., 2012. How inertia and limited potentials affect the timing of sectoral abate-ments in optimal climate policy. World Bank Policy Research.
Waisman, H., Guivarch, C., Grazi, F., Hourcade, J.C., 2012. The Imaclim-R model: infrastructures, technical inertia and the costs of low carbon futures under imperfect foresight. Climatic Change 114, 101–120.
Waisman, H.,Rozenberg, J., Hourcade, J-., 2013. Monetary compensations in climate policy through the lens of a gene-ral equilibrium assessment: The case of oil-exporting countries, Energy Policy, Volume 63, pp. 951-96.
Weitzman, M. (2007). A review of the Stern Review on the economics of climate change. Journal of Economic Literature, 45(3) :703–724.
Williams, J.H., Haley, B., Kahrl, F., Jones, A.D., Torn, M.S., McJeon, H., 2014. Pathways to Deep Decarbonization in the United States. The U.S. report of the Deep Decarbonization Pathways Project of the Sustainable Development Solutions Network and the Institute for Sustainable Development and International Relations., New York and Paris.

50
World Bank. 2009. World Development Report 2009: Reshaping Economic Geography. World Bank. © World Bank. https://openknowledge.worldbank.org/handle/10986/5991 License: CC BY 3.0 IGO.
World Bank. 2010. World Development Report 2010: Development and Climate Change. Washington, DC. © World Bank. https://openknowledge.worldbank.org/handle/10986/4387 License: CC BY 3.0 IGO.
World Bank. 2012. Inclusive Green Growth: The Pathway to Sustainable Development. The World Bank, Washington D.C.
Yohe, G. and Tol, R., 2007. The Stern Review : implications for climate change. Environment : Science and Policy for Sustainable Development, 49(2) :36–43.


Given the high risks and costs associated with low-carbon investments, ambitious mitigation of carbon emissions requires levels of funding that are in excess of current or projected public resources. To resolve this dilemma, we propose a financial instrument mechanism that:
1. Foster low-carbon investments that generate independently validated carbon certificates;
2. Allows Central Banks and commercial banks to include carbon certificates as assets in their balance sheets, at a notional, internationally agreed price; and
3. Allows Central Banks to open drawing rights dedicated to low-carbon investments, to be backed by carbon certificates, which will be issued in limited numbers.
This mechanism creates a situation in which low-carbon investments are permitted to attract additional debt, despite the perceived risks being higher. Commercial banks can also use the valuation of carbon certificates to attract savings directed towards low-carbon investments.
The mechanism requires an international agreement regarding the notional price of carbon certificates, as well as a credible Measurement, Reporting and Verification (MRV) system. The mechanism, which complements international negotiations on climate change, can be linked to the international climate regime via the coordination of the volumes of drawing rights across monetary zones.
It should be noted that controls on the price and volume of carbon certificates will limit inflatio-nary risks. Moreover, environmental integrity is strongly dependent on the ability of the MRV system to draw lessons from the Clean Development Mechanism (CDM) experience.
Executive Summary
Graphic design: Arancha Sánchez