transitional dynamics and the distribution of wealth in a
TRANSCRIPT

Journal of Public Economics 54 (1994) 97-119. North-Holland
Transitional dynamics and the distribution of wealth in a neoclassical growth model
Satyajit Chatterjee”
Research Department, Federal Reserve Bank of Philadelphia, Ten Independence Mall, Philadelphia, PA 19106-1574, USA
Received May 1989, final version received December 1992
The evolution of the personal distribution of wealth in a standard neoclassical growth model is studied. If the economy is growing toward the steady state and preferences are such that marginal utility from consumption is infinite (finite) at some (all) positive (non-negative) consumption level(s), then the average saving propensity of agents is positively (negatively) related to their wealth. If the economy is decaying toward the steady state, these relationships are reversed. If wealth and average saving propensity are positively (negatively) related, the distribution of current period wealth Lorenz-dominates (is Lorenz-dominated by) next period’s distribution of wealth.
1. Introduction
The objective of this paper is to investigate the evolution of wealth distribution in a single-sector, neoclassical, capital accumulation model. Specifically, it studies the behavior of wealth distribution along dynamic paths that converge to the steady state. This issue is addressed keeping in mind that consumers and firms choose their actions in light of well-defined objectives and constraints. The emphasis on rational choice distinguishes it from Stiglitz (1969) who analyzed similar issues in a model with ad hoc savings functions. Becker and Tomes (1986) have studied the evolution of
Correspondence to: S. Chatterjee, Research Department, Federal Reserve Bank of Philadelphia, Ten Independence Mall, Philadelphia, PA 19106-1574, USA.
*The views expressed here are solely those of the author and do not necessarily reflect those of the Federal Reserve Bank of Philadelphia or of the Federal Reserve System. This is a substantially revised version of an earlier paper entitled ‘Distribution and Growth’. I wish to thank two anonymous referees for their exceptionally detailed and helpful comments on the earlier version. I also thank Andy Abel, seminar participants at the University of Iowa and the University of Virginia, participants at the 1990 Conference of the Society for Economic Dynamics and Control, and the 1992 NBER Summer Institute Program on Income Distribution for helpful comments.
0047-2727/94/$07.00 0 1994 Elsevier Science B.V. All rights reserved
SSDI 0047-2727(93)01369-L

98 S. Chatterjee, Neoclassical growth model
income distribution in a choice-theoretic framework but did not consider the influence of aggregate dynamics.
In our framework, all agents have an identical infinite horizon utility function, face the same prices but begin life with different wealth levels. In addition to the standard assumption that lifetime utility is a discounted sum of time-invariant momentary utility functions, it is also assumed that preferences are quasi-homothetic, that is, the Engel curve is linear in lifetime wealth.’ Linearity of the Engel curve implies that excess demand functions can be aggregated so that the path of per capita consumption, per capita capital stock, and prices can be deduced from the associated single-agent planning (Pareto optimum) problem. Therefore, by construction, the distribu- tion of wealth does not influence the aggregate dynamics of the model but these dynamics do influence the evolution of the distribution of wealth. The purpose of this paper is to shed light on the latter effect.
The distribution of wealth changes over time because there is a monotonic relationship between individual wealth levels and individual average saving propensities. The direction of this relationship depends on the nature of preferences as well as on the nature of aggregate dynamics. If the economy is growing toward the steady state and preferences are such that marginal utility from consumption is infinitely high at some positive consumption level (which we interpret as the minimum consumption level required), then average saving propensity is positively related to wealth. This result is reversed if either (but not both) of the following is true: the marginal utility of consumption is finite for all non-negative consumption levels (i.e. there is no minimum consumption level required) or if the economy is decaying toward the steady state.
A monotonic relationship between average saving propensity and wealth has strong implications for the evolution of wealth distribution. As shown in Theorem 1, the sequence of wealth distributions generated by the optimal adjustment of the economy to the steady state can be Lorenz ranked. Specifically, if the relationship between wealth and average saving propensity is positive (negative) then the current period’s wealth distribution Lorenz- dominates (is Lorenz-dominated by) the next period’s wealth distribution.
The paper reports two results on the influence of initial conditions on the dynamic path of wealth inequality. Theorem 2 shows that an economy that begins with a more equal distribution of wealth (in the sense of Lorenz) in comparison with another will continue to have a more equal distribution of wealth in all future time periods provided it is identical to the second economy in all other respects. Thus, the influence of the initial distribution
‘As shown in Pollack (19711, this implies that the momentary utility function is a member of the generalized Bergson class which includes only the log, CRRA, exponential and quadratic utility functions.

S. Chutterjee, Neoclassical growth model 99
of wealth persists forever into the future. Theorem 3 explores the influence of the initial capital stock on the rapidity of distributional changes. Loosely speaking, it shows that the farther away an economy is from its steady state the more rapid is the change in its distribution of wealth. Since an economy which is farther away from its steady state is also likely to alter its capital stock more quickly, this suggests that rapid changes in wealth distribution may well accompany rapid changes in aggregate capital stock.
The paper also addresses three other issues. First, it points out the significance of the perfect capital market assumption for the competitive evolution of wealth distribution. Somewhat surprisingly, imperfections in the capital market could, in the long run, improve the distribution of wealth. In particular, in a world where equity and credit markets are absent, the long- run distribution of wealth is perfectly equal since all agents have access to the same technology and individually converge to the same long-run capital stock. More generally, however, market structure distortions could either enhance or attenuate the tendency toward greater wealth inequality.
Second, it draws out the normative implications of Theorems 1 and 2. With regard to the distributional changes that occur along the transition to steady state it is argued that no normative significance should be attached to them. This is because the distribution of wealth in the initial period is fixed by the initial pattern of endowments and the structure of equilibrium prices. While the distribution of wealth as viewed from the perspective of a later period can easily be different, this fact does not alter the initial distribution of wealth. In contrast, a redistribution of initial wealth can have unambi- guous consequences for social welfare. In particular, for a reasonable class of social welfare functions a Lorenz-dominating redistribution of initial wealth implies an increase in social welfare.
Finally, the study touches on the available empirical evidence on the correlation between changes in income and wealth inequality and economic development and concludes that the predictions of the model are not inconsistent with the facts.
2. The environment
The economy is composed of N consumers, indexed by i= 1,2,3,. . . , N, and a single (representative) firm. Each consumer maximizes a lifetime utility function given by
where u( .) is the momentary utility from the consumption of a homogeneous good and is one of the following types:
100 S. Chatterjee, Neoclassical growth model
:
yln(u+c), Vc&O and (~+c)zO,
u(c) = Y(E + WY, VczO and (cc+~c)~O,
-aexp(-qc), VclO,
(1)
where LX, y, v, and o satisfy appropriate restrictions2 The representative firm has a technology for producing the homogeneous
consumption good using capital. The production function is given by
Y, = f(U (2)
where y, is per capita output, k, is per capita capital stock at the beginning of period t, and f(.) is strictly increasing, strictly concave and twice continuously differentiable on the open interval (0, co).
It is assumed that markets are complete and the price of the consumption good in period t in terms of the consumption good in period 0 is pt. The optimization problem of the representative firm is
max f pt{f(kt)+(1-6)kt-kt+,} t=o
given k, > 0,
where 0 < 6 < 1 is the depreciation rate on capital. The term in curly brackets is the per capita distributed profits of the firm in period t and we will denote it as d,.
The optimization problem of consumer i can be stated as
max f /Yu(cf) t=o
s.t. f p,cf &I f p,(Nd,), t=o t=o
where sb is the share of the firm owned by consumer i in period 0. It is assumed that $, is large enough so that the optimal consumption path of consumer i is in the interior of the feasible set and therefore satisfies the first- order equations necessary for optimality. Define the t-period wealth of consumer i measured in terms of the consumption good in period t as
‘For the log specification, y=(l -/I) and a can be any real number. For the second specification there are two sets of parameters possible. For the CRRA set, D is non-zero and less than 1, q = 1, y is l/o and a is any real number. For the quadratic set, o = 2, y = - l/2, q = - 1 and G( r 0. For the exponential specification the only restriction is cz > 0 and 7 > 0.

S. Chatterjee, Neoclassical growth model 101
Then, given the specification of momentary utility, it is easy to show that consumption of agent i in period t is a linear function of wealth in period t:
4 = 4,P) + M,Pbf, (4)
where ,p is the sequence {p,, pt + 1,. . . } and a and b are quantities that depend on *p and on the parameters of the momentary utility function.3
A competitive equilibrium in this environment is a positive sequence {p,}
such that the optimal choices of all consumers and the firm satisfy market clearing:
(5)
The objective of this paper is to analyze the competitive evolution of the wealth share vector (sr s2 f, f,. . . , s:, s,“). Clearly, a key element in this evolution are the rates at which consumers accumulate wealth. From the budget constraint, a consumer’s growth rate of wealth is given by
$L($) (1($)).
3The exact expressions for a(,p) and b(,p) are as follows:
Log:
b(,d=(l-B).
CRRA and quadratic:
Exponential:
aLp)= i 4 Z”,($og(&) Pr c = (-) : t Pt iT
(6)

102 S. Chatterjee, Neoclassical growth model
Therefore, the smaller is the ratio of current consumption to current wealth the faster is the growth in personal wealth. This relationship can also be expressed more intuitively in terms of the average savings propensity of a consumer. Since the flow income of a consumer in period t is sf(Nd,) (z yyf), it follows that wf = ~$,vf, where ~,=(C,“=,(~,/p~)/d,)/d,. Denoting the ratio of savings to income (the average savings propensity) by vf, (7) can be rewritten as
Thus, a consumer with a higher average savings propensity will accumulate wealth at a faster rate.
While the average savings propensity of a consumer determines his rate of wealth accumulation, the evolution of his wealth share depends on his rate of accumulation relative to the rate of accumulation of per capita wealth. Denoting (xi wf)/N by W,, the fundamental equation governing the evolution of wealth share for a consumer is
It is immediate that an individual will increase (decrease) his share if he accumulates wealth at a rate higher (lower) than the rate of accumulation of
(8)
per capita wealth. Not surprisingly, the evolution of an individual’s wealth share can also be related to his average savings propensity relative to the average savings propensity of the economy. To see this, simply note that (7) holds if all variables indexed by i are replaced by their per capita counterparts. It follows immediately that a consumer’s wealth share will improve if and only if vf >ii, where V is the average savings propensity of the economy.4 Of course, the interesting question is: Which consumer will have more than the average savings propensity of the economy? Will it be the consumer who is wealthy or will it be the consumer who is poor?
3. Aggregate dynamics and competitive prices
Linear Engel curves imply that &cj)/N =C,= a(,p) + I%,, so that the per capita consumption of the economy is the desired consumption of an
4Note that since Nd, is the total flow income received by consumers in period t, the market-clearing condition (5) implies that If= I cf= Nd,. Hence, the average savings propensity for the economy, 6, is zero. Therefore, only consumers with positive savings improve their wealth share.

S. Chatterjee, Neoclassical growth model 103
agent with per capita wealth. Therefore, the per capita behavior of the economy can be understood in terms of a single consumer and a single firm responding to the same set of prices. Thus, the competitive per capita quantities can be recovered from the following social planning problem:
max f p’u(c,) t=o
s.t. ct+k,+l= f(k)+U -4k
c,eEcR+ and kt+leR’, VtzO,
given k, > 0.
This is a standard Cass (1965)-Koopmans (1965) optimal growth problem studied extensively in the growth literature. For the purposes of this discussion it will be assumed that this problem has a unique solution. Beals and Koopmans (1969) have shown that the solution involves monotonic convergence of capital stock and consumption to the steady-state values given by f’(k*) = l//3 - 1 + 6 and c* = f(k*) - 6k*. Therefore, economies that start off with less (more) than the steady-state capital stock have increasing (decreasing) per capita capital stock and per capita consumption along the transition path. The optimal path also yields the equilibrium price sequence through the recursion
p,*,,=p:Cf’(k,*,,)+(l-6)), vtZO>
&= 1, (9)
where k: is the optimal as well as the competitive equilibrium path of per capita capital stock.
4. Competitive evolution of wealth distribution
In this section we relate the evolution of wealth shares to the economic characteristics of consumers and the nature of aggregate dynamics. As a preliminary step, we give the definition of Lorenz-dominance in terms of our notation:
Definition. Let all agents be ordered according to increasing wealth. The vector {sf} Lorenz-dominates the vector (sf+ 1} if cf= 1 sf+ 1 scf= 1 sf for all 15 K 5 N, with strict inequality holding for some K.
Now, note that linearity of Engel curves implies
104 S. Chatterjee, Neoclassical growth model
$I(+ - _ oa(,p)(wf-bq>(~)O. Wt W t
(10)
Therefore, whether consumer i’s wealth share increases in the next period depends on the size of his wealth relative to per capita wealth and on the sign of the constant term in the Engel curve, namely a(,~). In regard to the latter, the following important result holds:
Lemma. a(,p) is greater than, equal to or less than zero if and only if cr(k,- k*) is greater than, equal to or less than zero.
Proof: See appendix A.
We are now in a position to discuss the evolution of wealth shares.
Theorem If a(k,- k*) >( <) 0, then {sf} Lorenz-dominates (is Lorenz- dominated by) (~f+~}. Zfa(k,--k*) is zero, then {~f}={sf+~}.
Proof: Suppose that cl(k,- k*) >O. Order all agents according to increasing wealth and suppose that K is such that wf’s Wt and w,“” > W,. Then, (8), (10) and the lemma imply that c:=i s:, r = <ci=i sf for all .Js K. In addition,
CY= J+rsf+1>C?= J+l~f, which implies that 1 -Cy=j+ 1 of+ 1 < 1 -C~=j+ 1 S: for all J>K. Since J$=i~f+~= cy=i Sf = 1, the result follows. The same argument can be used to prove the corresponding result for tx(k,- k*) ~0. Note that if a(k,- k*)=O, then by the lemma it follows that a(,p)=O and hence by (8) and (10) sf+i =sf for all i and t. 0
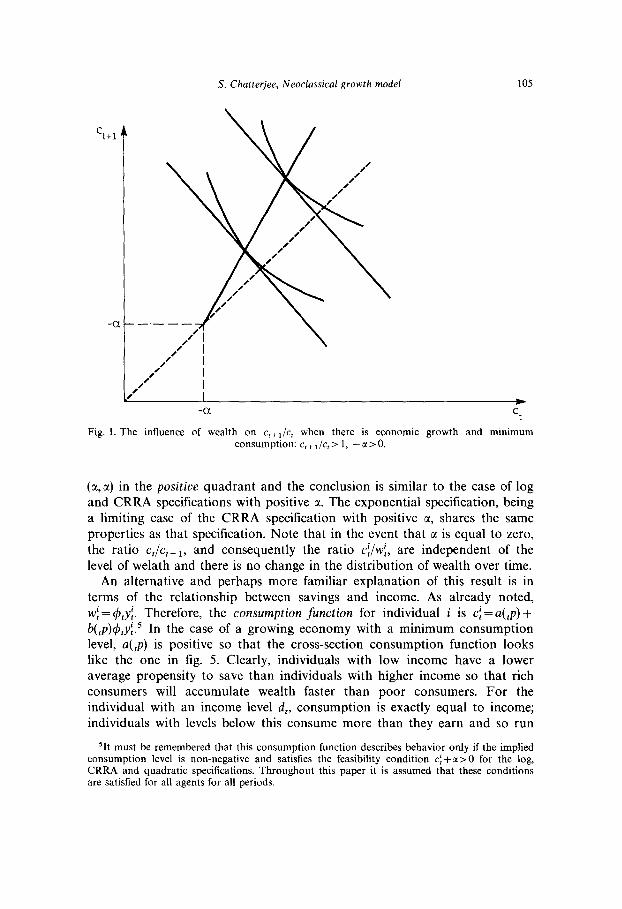
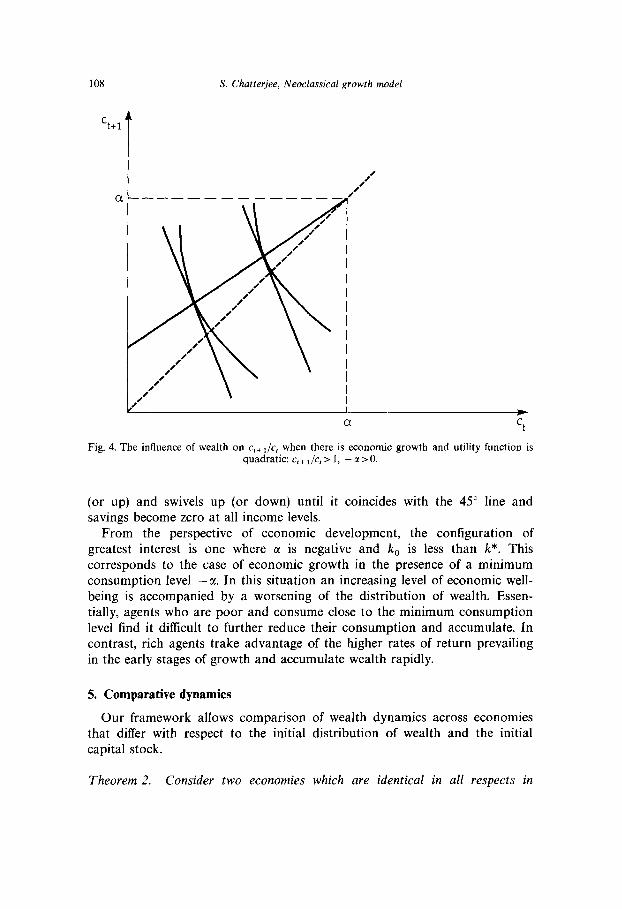
The geometric intuition for Theorem 1 is given in figs. l-4. For the log and CRRA specifications a negative cr. implies that the indifference curve for consumption in any two adjacent periods is homothetic with respect to the point (--a, -LX) in the positive quadrant. Thus, at unchanged relative prices, an increase in wealth causes the optimal consumption path to move out on a ray through the point (-cc, -a). Therefore, the ratio (c,+cI)/(c,+ i +c() remains unchanged but the ratio c,/c,+i changes. It is easy to verify that if the agent’s consumption is growing over time (which it would be if the economy is accumulating capital), then c,+c(<c,+ i +cr and hence the ratio c,/c,+i is negatively related to wealth. In other words, a 1 percent increase in wealth must lead to a less than 1 percent increase in c,. Hence, cf/wf < C,/W, for wf >G,. This conclusion is reversed if either consumption is declining over time (that is the economy is decumulating capital) or if the indifference curve is homothetic to a point in the negative quadrant, that is, CI is positive. These cases are illustrated in figs. 2 and 3. For the quadratic specification, illustrated in fig. 4, the indifference curves are homothetic to the bliss point
S. Chatterjee, Neoclassical growth model 105
C tt1
i -a -
Fig. 1. The influence of wealth on c~+~ /c, when there is economic growth and minimum consumption: cI+,/cl> 1, --G(>O.
(4 4 in the positive quadrant and the conclusion is similar to the case of log
-a ct
and CRRA specifications with positive ~1. The exponential specification, being a limiting case of the CRRA specification with positive ~1, shares the same properties as that specification. Note that in the event that c( is equal to zero, the ratio c,/c, + I, and consequently the ratio cf/wf, are independent of the level of welath and there is no change in the distribution of wealth over time.
An alternative and perhaps more familiar explanation of this result is in terms of the relationship between savings and income. As already noted, ~f=4~yf. Therefore, the consumption function for individual i is cf =a(,~) +
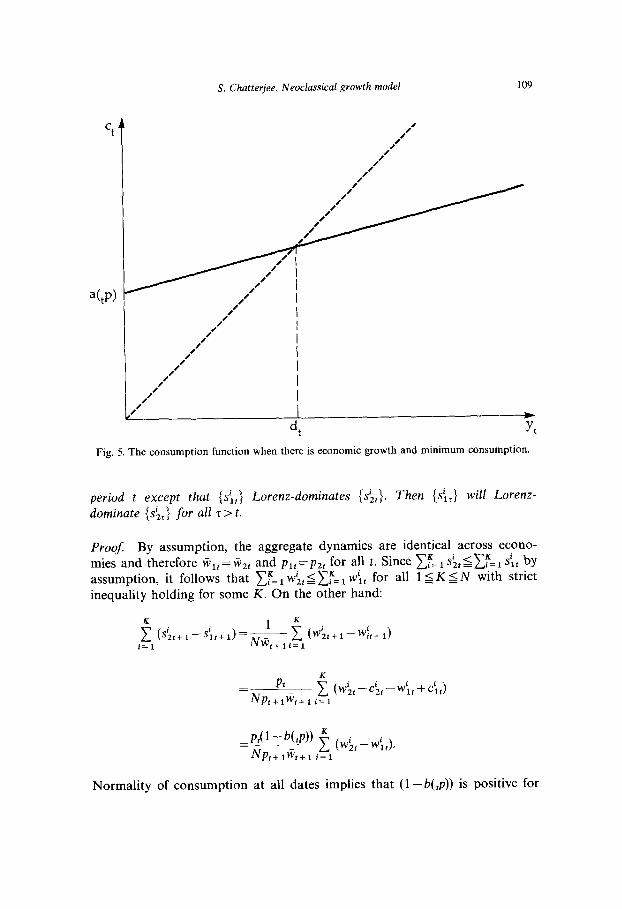
b(,p)~#~,yf.~ In the case of a growing economy with a minimum consumption level, a(,~) is positive so that the cross-section consumption function looks like the one in fig. 5. Clearly, individuals with low income have a lower average propensity to save than individuals with higher income so that rich consumers will accumulate wealth faster than poor consumers. For the individual with an income level d,, consumption is exactly equal to income; individuals with levels below this consume more than they earn and so run
51t must be remembered that this consumption function describes behavior only if the implied consumption level is non-negative and satislies the feasibility condition c;+cc>O for the log, CRRA and quadratic specifications. Throughout this paper it is assumed that these conditions are satisfied for all agents for all periods.

106 S. Chatterjee, Neoclassical growth model
-Cl Ct Fig. 2. The influence of wealth on c,+J f c when there is economic decline and minimum
consumption: ~,+~/c,il, -a>O.
down their stock of assets (ownership shares) which are bought by con- sumers with income level higher than d,. Consequently, the wealth share of poor agents declines relative to that of the rich.(j
If a(,p) is negative the consumption function, as illustrated in fig. 6, appears to have a negative intercept. However, in this case the function is meaningful only for income levels for which consumption is non-negative. For lower income levels consumption is simply zero. As before, income and expenditure are equal at d,. However, now individuals with income less than d, save while those with income higher than d, dissave. Thus, the poor accumulate wealth faster than the rich.
If a=O, then a(,~) is zero and the consumption function passes through the origin. Obviously, there is no difference in the average saving propensity across income levels in this case and the distribution of wealth is invariant over time.
The savings behavior of an agent reflects the interaction between the agent’s consumption and income path. For example, in an economy which is
6This may be an appropriate place to point out that because d,yj= w:, the wealth share measure (s;) is also a measure of the agent’s share in total income. Therefore all statements made about sf pertain to income share as well.

107 S. Chatterjee, Neoclassical growth model
Fig. 3. The influence of wealth on ctil /c, when there is economic growth and no minimum consumption: c,+,/c,>l, -a<O.
accumulating capital all agents face an increasing income path and all choose to consume increasing amounts over time.’ However, whether an agent saves or dissaves depends on how fast his desired consumption path rises relative to his income path: if it rises faster (slower) he will be a saver (dissaver).
It is important to remember that these cross-sectional consumption functions change over time. As time progresses and the economy gets closer to the steady state, the value of a(,p) gets closer to zero.8 It is also easy to show that c$, approaches l/( 1 -fl) as t approaches ~0.~ This implies that in all cases b(,p)@, approaches 1 in the limit. This is easiest to see in the case of the log specification for which b(,p) is (1 -p) but can be verified for the other cases too.” Thus, as time progresses the consumption function shifts down
‘In an economy which is growing toward the steady state the gross interest rate is, except in the limit, above l/p. Therefore, all agents would want to have an increasing path of consumption. Also, the per capita distributed proIits in the economy are equal, in equilibrium, to per capita consumption so that rising consumption implies a rising path for distributed profits. Therefore, the initial ownership of capital would imply a rising path of future income for all agents.
‘See Lemma A.1 in the appendix. “Since 4, = ( ,“=,(p,/p,)d,)/d,, as t-+oo, the denominator converges to d* and the numerator
converges to I? zm=Ip-rd* = [l/(1 -fl)]d*. Thus the ratio converges to l/(1 -fi). “For the CRRA and quadratic specifications b,= l/c~,(pdp,)(p,/p,B”)l’“-‘. As t--rcC, the
denominator converges to l/(1 -8) by Lemma A.l. For the exponential specifictaion, b,= l/cz,(pJp,) and again the denominator converges to l/(1 -p).
108
Ct+l t
S. Chatterjee, Neoclassical growth model
, /
I *
a Ct
Fig. 4. The influence of wealth on c,+~ /c, when there is economic growth and utility function is quadratic: c,+ l/ct > 1, - G( > 0.
(or up) and swivels up (or down) until it coincides with the 45” line and savings become zero at all income levels.
From the perspective of economic development, the configuration of greatest interest is one where c1 is negative and k, is less than k*. This corresponds to the case of economic growth in the presence of a minimum consumption level ---a. In this situation an increasing level of economic well- being is accompanied by a worsening of the distribution of wealth. Essen- tially, agents who are poor and consume close to the minimum consumption level find it difficult to further reduce their consumption and accumulate. In contrast, rich agents trake advantage of the higher rates of return prevailing in the early stages of growth and accumulate wealth rapidly.
5. Comparative dynamics
Our framework allows comparison that differ with respect to the initial capital stock.
Theorem 2. Consider two economies
of wealth dynamics across economies distribution of wealth and the initial
which are identical in all respects in
S. Chatterjee, Neoclassical growth model
Ct t
109
/ /
/ /
/
a(,P> /
/ I /
/’ I
/ I /’ I
/ /
,’ ,’
, * dt yt
Fig. 5. The consumption function when there is economic growth and minimum consumption.
period t except that (sit} Lorenz-dominates {s&}. Then {sir} will Lorenz- dominate {s&j for all z > t.
Proof: By assumption, the aggregate dynamics are identical across econo- mies and therefore WIt=Wzt and plt=pZt for all t. Since cFSI .&~~~=I sit by assumption, it follows that If= 1 wit ~~~= 1 w\, for all 15 K s N with strict inequality holding for some K. On the other hand:
K Pt
=NP,+I~,+~ i=l 1 (w:,-c;t-w~t+C~t)
Jg-b(,P)) f (W;r_W’lr),
t+1wt+1 i=l
Normality of consumption at all dates implies that (1 - b(,p)) is positive for

S. Chatterjee, Neoclassical growth model
Fig. 6. The consumption function when there is economic decline and minimum consumption.
all t. Therefore, {sit+r } will Lorenz-dominate {si,, r>. The results follows since the argument can be repeated for all r > t + 1. [7
Thus, the ranking of economies with respect to the distribution of wealth is not affected by the passage of time provided the initial distributions are Lorenz-comparable and the economies are identical in all other respects. Note that that result holds independent of whether the distributions in the two economies are improving or worsening over time.
The next theorem relates the swiftness of distributional change to the distance of the initial capital stock from its steady-state value. The theorem contends that if two economies are growing or declining toward a common steady state, then, for some specification of utility functions, the economy which is initially farther away from the steady state will see a bigger change in its distribution (for better or for worse, depending on the sign of c().
Theorem 3. Consider two economies identical in all respects in period t except that k,, is less than (greater than) k,, and both capital stocks are below (above) their common steady-state value. If their common utility function is either log or CRRA with Ota< 1, then {sir} Lorenz-dominates (is Lorenz-dominated by)

S. Chatterjee, Neoclassical growth model 111
{ si,,} for all z > t provided that c( < 0 and {s\~} Lorenz-dominates (is Lorenz- dominated by) {s&} for all z > t provided that cx>O.
Proof. See appendix B.
Since economies that are farther away from the steady state also accumu- late (decumulate) capital faster, an important implication of this theorem is that rapidly changing capital stock may be positively correlated with rapid changes in its distribution. Therefore, economies with a prospect of pro- longed growth ahead of them may also be the countries most susceptible to rapid changes in their distribution of wealth.
6. Discussion
6.1. The role of market structure
In our framework rich and poor consumers have access to a perfect capital market. Contrary to what one might think, this assumption plays a key role in the result that the wealth share of agents may diverge over time. To see this, consider the case where there are no credit or equity markets so that each household invests in its privately owned firm. Assume also that households have more than enough resources to sustain minimum consump- tion and that all have access to the same technology. In these circumstances, each household will eventually converge to the same capital stock and the long-run distribution of wealth will be perfectly equal. The force responsible for this convergence is the higher marginal product of capital faced by agents with low levels of initial capital stock. This allows poor households to eventually catch up with richer ones despite differences in the average propensity to save. This is the mechanism in Tamura (1991) through which countries displaying endogenous growth converge in income levels. In contrast, unimpeded access to the capital market removes disparity in rates of return across agents and leaves differences in average saving propensities alone to mold the distribution of wealth.
The point that imperfections in capital markets may lie at the bottom of convergence in income levels bears emphasis. In the recent revival of growth economics, it is often stated that if countries are similar with respect to production and preference parameters, the one-sector neoclassical growth model implies long-run convergence in income levels [e.g. Barro (1991, p. 407)]. Such statements need to be made with care. If we re-interpret individuals as countries, the model of this paper shows that the statement is correct only if each country is isolated and accumulates capital on its own. If capital is allowed to flow costlessly across national borders, the gross domestic product always will be equal across countries, while the distribution

112 S. Chatterjee, Neoclassical growth model
of gross national product may well diverge over time. Thus, the neoclassical growth model need not imply convergence in any sense.
Of course, imperfections in market structure need not always be a force in favor of convergence. Greenwood and Jovanovic (1990) present a model where access to high return projects involves a fixed cost and consequently agents with wealth above a threshold level invest in them. In this type of situation, wealth levels and rates of return are positively related and the imperfection contributes toward divergence of income and wealth levels.
6.2. Normative issues
Since changes in the distribution of wealth that accompany the dynamic evolution of the economy can be ordered according to the Lorenz criterion, it is tempting to attach strong normative significance to them. One must, however, be careful. A changing distribution of wealth does not imply a changing value of social welfare. Fundamentally, social welfare is the value taken by a function defined on the collection of N individual consumption sequences. That is,
w= W({c’},“, {c2); )...) {c”};). (11)
The competitive equilibrium of the economy determines these sequences once and for all and there is no change in them as the economy progresses through time. Therefore, changes in the distribution of wealth in the process of economic development do not cause any change in social welfare. The evolution of wealth distribution is simply an aspect of the interaction between competitive consumption sequences and the lifetime budget con- straint of individuals.
On the other hand, a redistribution of wealth undertaken in the initial period can have unambiguous welfare consequences. To explore this issue, assume that the social welfare function is of the following time-separable form:
w= c w’v(c:,c,2 )..., c,“), O<o<l, (12) t=0
where w is the social discount factor and V is a continuous, symmetric, and strictly quasi-concave function of the consumption vector (cl, c*, . , cN).ll Suppose that there is a Lorenz-dominating redistribution of wealth in the
“The first assumption on V(,) is hardly controversial; the second ensures that the value of the social welfare function is independent of permutations of the consumption vector; the third assumption means that the level sets of the social welfare function are convex. This incorporates the notion of fairness since it implies that ‘average’ consumption vectors are better than ‘extreme’ consumption vectors.

S. Chatterjee, Neoclassical growth model 113
initial period. From Theorem 2 we know that the distribution of wealth in all future periods will Lorenz-dominate the distribution of wealth that would have prevailed in that period in the absence of the redistribution. Formally:
(wf&~= 1 Lorenz-dominates (wf)y= 1,
where wh,,, is the wealth of agent i in period t in the post-redistribution economy. Note also that
and ci “ewf =a(#) + KPM,%Vf
cf = 4P) + N,P)Wf, (13)
where, because of the invariance of aggregate dynamics to redistribution of wealth, the coefficients a(,~) and b(,p) are identical in the two equations. It is straightforward to verify that
(wi .,,,,,)f= I Lorenz-dominates (wf)y= 1 0 (c~_,,,)~= I
Lorenz-dominates (cf):’ 1.
Finally, invariance of aggregate dynamics also implies that ~iche,,=~i~f for all t. We can now make use of a theorem proved by Dasgupta et al. (1973) [see also Sen (1973)] which says that if a consumption vector Lorenz- dominates another and both have the same average consumption, then any social welfare function that satisfies continuity, symmetricity and strict quasi- concavity will rank the first distribution above the second. Hence, we can conclude that a Lorenz-dominating redistribution in period 0 will increase the value of V(.) in all periods and therefore unambiguously raise social welfare.
It is important to keep in mind that derivation of this result depends crucially on the invariance of aggregate dynamics to changes in distribution. In more complex models it is very unlikely that aggregate consumption at any date will remain unchanged in the aftermath of the initial redistribution. In such situations, society might have to weigh the gains of greater equality against the consequences of a possibly smaller level of aggregate consumption.
6.3. Empirical evidence
Two pieces of empirical evidence lend support to the ideas expressed in this paper. First, there is direct evidence that the wealth accumulation rates of rich and poor consumers differ because of subsistence consumption requirements. Atkeson and Ogaki (1992) have estimated parameters of utility

114 S. Chatterjee, Neoclassical growth model
functions of the CRRA and log types using panel data on consumption expenditures of Indian villagers. They iind evidence in favor of differences in accumulation rates arising from subsistence consumption requirements.
Second, the prediction of the model that income and wealth inequality deteriorate monotonically in the process of unfettered economic growth and ultimately stabilize at a higher level appears to have some support in the large empirical literature on income distribution and economic development. Adelman and Robinson (1989) in their survey of this field summarize current state of knowledge as follows:
All these studies agree on one descriptive result: the initial phase of the development process, during which a mostly agrarian economy starts industrialization, is necessarily marked by substantial increases in the inequality of the distribution of income, with sharply reduced share of income going to the poorest 20, 40, and 60 percent of the population. But there is controversy whether a decrease in inequality with develop- ment is inevitable (the U-hypothesis) or a matter of policy choice (the J- hypothesis). There is also controversy about whether the real income of significant groups of the poverty population actually fall during the early stages of the transition.
The framework explored in this paper is consistent with the J-hypothesis: in the absence of any government intervention, the degree of equality falls in the process of economic growth and stabilizes at a lower level in the long run. The model also implies that all agents experience a monotonic increase in their consumption levels along the transition path to the steady state so that nobody suffers an absolute decline in their standard of living. However, the explanation of these changes differs in emphasis from those put forward by development economists. Following Kuznet’s (1955) pioneering work, development economists have emphasized the role of intersectoral move- ments in composition of income and employment (from agriculture/rural to industry/urban) as a source of changes in income inequality. In contrast, the present study focuses on what, in the multisector context, is identified as within-sector changes in equality. Furthermore, it points to differential saving propensities of rich and poor individuals as source of distributional changes.
Appendix A: Proof of lemma
We begin with a preliminary result.
Lemma A.I. If k, is less than (greater than) k*, then (p,/p,p’-‘) is less than (greater than) 1. Also, for all s >O and z = t +s, lim,,, (p,/p,/F’) = 1.
Proof: If k, is less than k*, then we know that the sequence of optimal

S. Chatterjee, Neoclassical growth model 115
capital stocks monotonically increases towards k*. Therefore, by the defini-
tion of the sequence {p,}, Pt+ l/pt increases monotonically to [f’(k*)+(l-8)]-‘=/I. Therefore ~~+~/p~<fl for all ~20. Since p,/p,= (pt+ 1/pt)(pt+2/pt+ 1). . (p,/p,_ 1) it follows that it must be less than /Y’ for all z>t. If k, is greater than k*, then pt + Jp, > fl and we can conclude that p,/p, is greater than /?-‘. Also lim,,, (p, + Jp,) = p. Thus, for all s > 0 and z = t + s, lim f’rn (PJPJ=B’-’ f rom which it follows that for all s>O and z = t SS,
lim,,, (P,lP,p”) = 1. 0
Proof of hwna. We will examine the sign of a(,~) for each of the specifications:
(a) Log
4tP)=a [
(l-B)f (PJPJ-1 . c=f 1
If k,< k*, then by Lemma A.l, c,“=,(p,/p,) <~~ft/Ff= l/(1 -fl). Thus the term multiplying into c1 will be negative. If k, is greater than k*, then
~z,(P,/Pt)scxJ-‘= l/(1 -B) and the term multiplying into c1 will be positive. Therefore, the sign of a(,~) will correspond to the sign of a(k,- k*).
(b) Constant relative risk aversion and quadratic specification
4,P) = (4d [L T f L
f (P lP 1 f (P,lP,)(P,lP,8’-‘)‘““- I) IH If k, is less than k*, then, by Lemma A.l, (p,/p,p’-‘)‘““-” will be less than 1 for all z > t and equal to 1 for z = t for the quadratic case. Therefore, the term in square brackets will be positive. For the CRRA case, (p,/p,p’-‘)‘““- ‘) is greater than 1 for all T> t and equal to 1 for z = t. Therefore, the term in square brackets will be negative. If k, > k*, then the term in square brackets is negative for the quadratic case and positive for the CRRA case. Now, in the quadratic case q is negative and CI is positive so that the sign of a(,~) will correspond to the sign of a(k, - k*). In the CRRA case q is always positive so that the sign of a(,~) will also correspond to the sign of a(k,- k*).
(c) Exponential specification
4tP)=(Vd f (PJP,)log(P,lPtp’~‘) *=*
If k, is less than k*, then by Lemma A.1 log(p,/p,p’-‘) is less than 0 for all z> t and equal to zero for z z= t. Therefore the term in square brackets is negative. If k, is greater than k* then log(p,/p,p’-I) is greater than 0 for all
116 S. Chatterjee, Neoclassical growth model
T> t and equal to 0 for T= t and the term in square brackets is positive. Since for the exponential specification CI >O and q >O, the sign of a(,~) will correspond to the sign of cc(k,-k*). 0
Remark. Note also that by Lemma A.l, lim,,, a(,p) = 0 for all specifications.
Appendix B: Proof of Theorem 3
Lemma B.l. If the absolute difference in the growth factor of wealth shares between any two agents is greater in country 1 than in country 2, and if both countries have the same distribution of wealth in period t, then the period t + 1 distribution of wealth in country 2 will Lorenz-dominate (be Lorenz-dominated by) the distribution in country I provided a,, and aZr are both positive (negative).
Proof: Denote the period t wealth share of agent i in country h = 1,2 as sit. Then, by hypothesis:
Order agents according to increasing wealth and assume that uht>O for h = 1,2. Then, by (8):
(~~~+~/s~~)-(Sjh~+~/sjh~)<O, Vi< jand Vh=1,2.
Hence, (B.l) and (B.2) imply
(&+I /sl,)-(Silr+llsi,)<(sl,+1/s:,)-(SjZt+1/Sj2t), vi<j.
(B.2)
(B.3)
Rearrangement yields
(S’;,+1/S1,)-_(Si2t+1/Si2t)<(si,+1/sjlr)-(s!I+1/Sj2t), Vi<j.
Suppose, to get a contradiction, that there is some K < N for which
03.4)
Then, for some i 2 K (sit+ t-s\,+ 1) must be non-negative. Since sit =s& by hypothesis and since &>O for all i and h, it follows from (B.4) that
(&,I -s&+1 ) > 0 for all i> K. However, this impies that
i&sl,+l-&+l,+ : &+1-&,l)>O, i=K+l

S. Chatterjee, Neoclassical growth model 117
which is impossible. Therefore for all K 5 N, IF= ,(si,,+ I -s&+ 1) 50, with equality holding only for K= N. Hence, {s&+,} Lorenz-dominates {sit+r}. A similar proof can be constructed to show that {sir+r} Lorenz-dominates {s&+ 1 ) when a,,, is negative for all h. 0
Lemma B.2. Zf k,, is less than k,, and both are below their (common) steady-state value k* and their (common) momentary utility function is either log or CRRA with O<a< 1, then the absolute difference in the growth factor of wealth shares between any two agents in country 1 is greater than in country 2.
Proof. First note that for all h and i#j:
~s~,+~/s1,-sSjht+~/Siht(=(~tl~t+~)~(la~tllNW~,+~)Il/s~,--/Sjht)
=1,$/s;,- l/&1.
We will show that 2rt>&,. Note that A,, has three parts to it and we will establish the required inequality for each part.
(i) (p,/p,+,),>(p,/p,+1)2. Since kI,,<kz,, we know from the properties of single-sector option growth models that k,,,< k2,r for all Z> t. The result follows from the definition of the sequence (p*},,.
(4 J4,,l> la2,,l. W e establish this by considering each specification in turn:
(a) Log
Now, (i) above implies that (p,/pJl g(p,/p,), for all r 2 t with equality holding
only for only r = r. Thus, C( 1 - B)c% (P,/P,) 1 - 11~ CC 1 - P)cZ f (P,/P,)z - 11 for all t. Also, Lemma A.1 implies that (1 - fl)c,“=,(p,/p,),- 1~ 0 for h = 1,2. Hence I( 1 - j?)cz f (p,/p,) 1 - l( > (( 1 - /?)I,“= I (p,/p,), - l( and the result follows.
(b) CRRA with 0 < 0 < 1
Again, (i) implies that ~,“=,(p,/p,), <~~t(pr/pr)z. For O<a< 1, we also have that x:1 (P,/P,)~(P,/P,P’-‘):‘“- ’ >C~=r(~,l~,)z(~,l~,P’-‘):‘“- ‘. Hence,

118 S. Chatterjee, Neoclassical growth model
Since k,,, <k*, Lemma A.1 implies that ((p,/p,)p’-‘)““-’ 2 1 with equality holding for r = t. Therefore
Therefore
The result follows.
-W..J/N@1,,+1 > l/Nwz, f + 1. In competitive equilibrium, W,,, t = xx? t(pr/pf)hF,,, r. The result follows from (i) above and the fact that in a single-sector growth model kr,,~k~,~ implies that C1,r<CZ,r for all rzr. 0
Proof of Theorem 3. Suppose the a@) >O. By Lemmas B.l and B.2 it follows that {&+ 1 } Lorenz-dominates {s\,~+~>. Since kl,,<kzZr it also follows that kr+,+i <kz,t+l. Now imagine two economies with capttal stock, k l,f+l and k2,f+lr and each with a distribution (&+i}. Again, by Lemmas
B.l and B.2 {s;,~+~ > Lorenz-dominates {s;,~+~), where the latter is period t+2 distribution of the first economy. Next, consider two economies with
capital stocks k,,,, 1 but with distributions (s’;,,+i} and {.&+i>. Since {si,,+ i} Lorenz-dominates (~~,~+r}, Theorem 2 implies that {s;,~+~} Lorenz-
dominates {s’;!~+~ }. By the transitivity property of Lorenz orderings it follows that {s;,,+ Z ) Lorenz-dominates (s’;,~+ 2). Given this, one can use the same argument to conclude that {s;,~+ 3) Lorenz-dominates {s:,~ + 3} and so on for all r > t + 1. The argument for a(,p) < 0 is analogous. Cl
References
Adelman, I. and S. Robinson, 1989, Income distribution and development in: H. Chenery and T.N. Srinivasan, eds., Handbook of development economics, vol II (North-Holland, Amsterdam) 949-1003.
Atkeson, A. and M. Ogaki, 1992, Wealth varying intertemporal elasticities of substitution: Evidence from panel and aggregate data, mimeo, University of Rochester and the University of Chicago.
S. Chatterjee, Neoclassical growth model 119
Barro, R.J., 1991, Economic growth in a cross section of countries, Quarterly Journal of Economics 106,407-443.
Becker, G. and N. Tomes, 1986, Human capital and the rise and fall of families, Journal of Labor Economics 4, 1072-1085.
Beals, R. and T. Koopmans, 1969, Maximizing stationary utility in a constant technology, Siam Journal of Applied Mathematics 17, 100-1015.
Cass, D., 1965, Optimum growth in an aggregative model of capital accumulation, Review of Economic Studies 32, 233-240.
Dasgupta, P., A.K. Sen and D. Starrett, 1973, Notes on the measurement of inequality, Journal of Economic Theory 6, 180-l 87.
Greenwood, J. and B. Jovanovic, 1990, Financial development, growth and the distribution of income, Journal of Political Economy 98, 1076-l 107.
Koopmans, T., 1965, On the concept of optimal economic growth in: The econometric approach to development planning (North-Holland, Amsterdam, and Rand McNally, Chicago) 301-384.
Kuznets, S., 1955, Economic growth and income inequality, American Economic Review 65, l-28.
Pollack, R., 1971, Additive utility functions and linear Engel curves, Review of Economic Studies 38,401-413.
Sen, A.K., 1973, On economic inequality (Clarendon Press, Oxford, and Norton, New York). Stiglitz, J.E., 1969, Distribution of income and wealth among individuals, Econometrica 37,
382-397. Tamura, R., 1991, Income convergence in an endogenous growth model, Journal of Political
Economy 99, 522-540.