transnational corporations and the global water industry
TRANSCRIPT
This article takes stock of foreign direct investment (FDI) undertaken by transnational corporations
(TNCs) in the global water industry and examines the evidence on the impact of their operations in
host countries. Between 1996 and 2006, approximately $12 billion were invested in water-related
sectors, of which 75% came from the private sector (including TNCs) from just four countries, while
tentative calculations put the global share of investment by TNCs at 56%. Presently, 243 enterprises
have interests in 409 water projects in 53 host countries. However, just six countries have received
over half of the total investment. A survey of the evidence reports mixed results of the impact of
TNCs’ investment in host countries. It is argued that the biggest issue here is pricing, a dilemma
that, alongside the privatization issue of host countries’ water industry, is discussed in the concluding
section. © 2011 Wiley Periodicals, Inc.
Published online in Wiley Online Library (wileyonlinelibrary.com)© 2011 Wiley Periodicals, Inc. • DOI: 10.1002/tie.20437
feature artICLe
In t roduct ion
W ater utilities have historically been publicly owned. It was largely in the 1990s, with the advent of privatization debates at national fora,
that private initiatives in the water industry, particularly in Western economies, came to be introduced. These initiatives have gradually spread to the developing world (Johnstone & Wood, 2001). Economic and technical efficiencies have been the main arguments in favor of privatization. However, despite all of the advocated gains
(see below), the industry is still 90% publicly owned. This leaves room for transnational corporations (TNCs) to expand their operations in this sector, but this is a formi-dable challenge for all parties concerned. In order to un-derstand why this is so, we first introduce as background the characteristics peculiar to the water industry that will help readers grasp the complex socioeconomic nature of the industry. This is followed by subsections on the global water needs and the United Nations Millennium Development Goals (MDGs), which have recognized the urgency of global water requirements. The third section
By
Satwinder Singh
Keith Dickson
601
Transnational Corporations and the Global Water Industry
Correspondence to: Satwinder Singh, Brunel Business School, Brunel university, uxbridge, uB8 3PH, united Kingdom, 0044 (0) 1895 267547 (phone), 0044 (0) 1895 269770 (fax), [email protected]
602 feature artIcle
thunderbird International Business review Vol. 53, No. 5 September/October 2011 DOI: 10.1002/tie
The water industry is a mature industry and together with its sister industry, electricity, forms the backbone of a nation’s competitiveness. The components in the vertical chain of the industry—water extraction, transmis-sion, distribution, and actual supply—are limited and well defined. Second, it is a high sunk- and fixed-cost industry, with high operating costs as well, irrespective of the amount of water produced and supplied at any given point in time. Whereas the industry generates scale economies, cost structure may vary significantly between countries and within countries and over time (Nauges & Van den Berg, 2007). In addition, the density and trans-port economies of the industry are immense. Third, the product the industry produces is homogeneous and has universal applicability and a ubiquitous market. Water has no substitute; as a result, the cross-elasticity of demand between water and any rival product is zero. One impli-cation of this trait is that the issues of switching costs or product differentiation are virtually nonexistent, unless it is sold as branded, bottled varieties, but they constitute a very small fraction of overall water consumption. Essen-tially, the product is both price- and income-inelastic, and brand loyalty is by default. Whereas price discrimination may exist between residential and commercial users, the intragroup price differential is nonexistent.
The characteristics of the water industry, coupled with the fact that the industry is a driver for the develop-ment of most industries, lends it almost to the status of an indispensable “public good.” This is the reason that for such a long time, the industry has been run as a natural monopoly by government-run enterprises. In the case of the water industry, the generation and the retail supply can be competitive, but owing to networks, the transmis-sion and distribution are naturally monopolistic. Water supply to domestic and industrial sectors, particularly in developing countries, is often subsidized. Thus, the “pub-lic good” nature of the water industry generates several pricing dilemmas (Peet, 2003).
The setting up of prices and its regulation in the case of natural monopolies such as water is a complex task. Ideally, prices charged by the regulated monopolies should reflect the marginal cost of production accurately to minimize the deadweight loss. The problem, however, is that the enforced price regulation according to this principle could require true natural monopolies to oper-ate at a loss since such firms exhibit decreasing average costs over a broad range of output levels. This dilemma forces government regulatory agencies either to abandon their goal of marginal cost pricing or the government must subsidize the monopoly forever. A second option and way out of marginal cost pricing is to permit discrimi-
presents the salient features of water TNCs, their entry modes, and direction of investment in host countries, as well as a review of relevant literature. Research methods and data sources are noted in the fourth section before a comprehensive presentation and analysis of that data is provided in the fifth section. Discussion of implications of the analysis, a summary, and recommendations occupy the final section. Such a structure assists the article in ad-dressing three objectives:
• to provide an overview, both statistically and discur-sively, of the global water industry, with particular reference to the growing role and influence of TNCs in host countries;
• to review the literature on the impact of TNCs on this industry; and
• to highlight the challenges governments of host coun-tries face in addressing the current situation by offer-ing a range of policy suggestions.
Overv iew of Global Water Industry
characteristics of the Water IndustryIn order to fully understand the urgency behind the United Nations’ Millennium Development Goals (United Nations, 2006c) and the rising concern of developing na-tions to cater to the water needs of their population, it is important to appreciate the unique nature of water and the water industry. A delineation of the unique features should also help appreciate the difficulties arising in the privatization process of this vital industry.
Water is a free “good” in the sense that nature pro-vides it in abundance in both aboveground and under-ground reservoirs. In order to make it safely available to the masses, it has to be extracted, purified, and supplied via a network of pipelines. Once a private individual or a firm has added value to it (by installing such a network), it becomes an “economic good” that can be sold or traded for profit. At the same time, for the poor masses to live disease-free from water-borne infections, it is es-sential that they have a clean supply of water available at a price they can afford. Studies (Pattanayak, Van den Berg, Yang, & Van Houtven, 2006) show that, without some form of state assistance, those who need it most are unable to afford it. An adequate and clean supply of water is possible only if enough investment is forthcoming and if the industry is run “efficiently.” The efficiency factor encompasses a host of issues, including stable govern-ments, good coordination between service providers, and a corruption-free regulatory mechanism.
transnational Corporations and the Global Water Industry 603
DOI: 10.1002/tie thunderbird International Business review Vol. 53, No. 5 September/October 2011
If unchecked, by 2025 about half of the world’s population, some 3.5 billion people, will be living in areas facing a severe water shortage.
uN Millennium Development GoalsThe gravity of the situation has prompted the United Na-tions to pronounce water as one of eight priority goals in its Millennium Development Goals declarations in 2000 and reaffirmed in 2008 (United Nations, 2008). The achievement of these millennium goals have been inte-grated into the United Nations Development Programme (UNDP; 2009), which assists countries in preparing and implementing MDG-based national development strate-gies. Goal Seven on the MDG list is to ensure environ-mental sustainability, Target Ten of which is to halve, by 2015, the proportion of people without sustainable access to safe drinking water and basic sanitation (United Nations, 2006b). However, with all good intentions, the predicted positive outcomes of the initiatives are lopsided in favor of regions in East Asia and Latin America. For instance, on prevailing trends, it will be more than three decades before sub-Saharan Africa reaches the water targets and over seven decades before it reaches the sanitation targets. It has been calculated that, “measured on a country by country basis, the water target will be missed by 234 million people, with 55 countries off track” (United Nations, 2006a, p. 16). Growing populations pose a big challenge, however, causing wide disparities among countries and between rural and urban areas. The largest urban-rural disparities are found in sub-Saharan Africa, where city dwellers are twice as likely to have safe water as their rural counterparts (United Nations, 2006c).
natory pricing between various end-users (e.g., domestic and commercial). A third option still is to permit mo-nopolies to charge a price above the marginal cost that is sufficient to earn a “fair” rate of return on investment. However, under this method, much effort may have to be devoted to define what the “fair” rate is. If the calculation is based on the rate of return on an investment in a com-parable business, then there is an incentive for monopo-lies to inflate or use more capital base than is warranted.
As a result of these actual and potential complica-tions, it is difficult to predict how exactly the prices in a deregulated water industry would be set. For certain countries, however, firms are not totally free to set and alter prices without consultation with the regulatory authorities. The moot question, however, is this—do prices stay as they are, fall, or rise after privatization? In theory, if the prices of erstwhile public enterprises were subsidized, or were set at below cost, they would clearly be expected to alter on the higher side afterward. How much this rise would be, again, is a difficult question to answer, especially in the case of countries where masses are unable to afford even the basic rates in the first place.
Global Water NeedsSince ancient times, humans have endeavored to live near sources of clean water for their survival. The pro-cess of staying connected to water sources became easier with the onset of industrialization that helped to draw, purify, and supply water through a network of pipes. However, with rising populations, especially in rapidly industrializing countries, supply has failed to keep pace with demand. This has led to chronic shortages in several regions of the world, causing immense hardship to the impoverished masses—so much so that it is estimated that presently 1.5 billion of the world’s population have no access to water, and if unchecked, by 2025 about half of the world’s population, some 3.5 billion people, will be living in areas facing a severe water shortage (World Bank, 2009). Presently, 1.8 million children die each year as a result of unclean drinking water and poor sani-tation, while it has been estimated that, in addition to the large number of deaths caused by unclean drinking water, over 400 million school days are lost each year from water-related ailments (World Business Council for Sustainable Development [WBCSD], 2006). Facts such as these have brought the water industry to the forefront of debate on development, attracting worldwide atten-tion. The tragic failure of many governments to cater to the dire need of the masses can be judged from the fact that less than 10% of water demand is for human consumption (WBCSD, 2006).
604 feature artIcle
thunderbird International Business review Vol. 53, No. 5 September/October 2011 DOI: 10.1002/tie
The “efficiency” and “competitive” culture brought in by the TNC can have positive spillover effects on the business environment by way of its dealings with local private and state institutions.
In the section that follows, a review of water TNCs operations in host countries is presented. This is followed by comments on methodology, sources of data, and some essential definitions, with the help of which we derive certain facts about TNCs. These include the number of TNCs involved in the water industry of host countries, the number of countries in which they have made invest-ment, the total amount invested, the extent of domina-tion or otherwise of this industry by them, their preferred mode of investment, and the extent of outflow and, at the same time, inflow of capital funds into the home nation of water TNCs.
review of Water tNcs’ Operations in Host countriesA transnational corporation’s entry into a host nation can bring in much-needed capital, technology, and entrepre-neurial skills—all of which can have a direct impact on the industry it enters by making it more efficient. The “efficiency” and “competitive” culture brought in by the TNC can have positive spillover effects on the business environment by way of its dealings with local private and state institutions, and other interest groups with which it interacts. The end-users gain by improved services at a competitive price that can generate consumer and producer surplus. Macro effects on direct and indirect employment and positive fiscal impacts can also be substantial. The generation of these benefits, however, is based on the premise that the enterprise will enter a competitive market with symmetric information and com-plete contracts. Absence of these attributes can distort the benefits. For instance, if the market is not competitive, as is often the case with public utilities, the generation of some of these benefits can become questionable. The privatization of public utilities, including water, is a re-cent phenomenon and, as yet, enough research does not exist to warrant a strong conclusion either way. A review of literature reveals mixed results. For instance, posi-tive outcomes have been reported from the Philippines (Rosenthal, 2001). Other studies (Cesano & Gustafsson, 2000) on water concessions in central Europe involving TNCs urge much caution, suggesting that a move toward decentralization and privatization can raise prices, breed corruption, and reduce efficiency. Similar sentiments are echoed in other studies (Budds & McGranahan, 2003; Kauffmann & Pérard, 2007) from Africa, Asia, and Latin America that point out the fact that private-sector entry is often concentrated in wealthier, more populous, and more urbanized regions with scant attention to low-income areas. Another specific country study that casts doubt on the efficiency of privatization of public water utilities is that of Anwandter and Ozuna (2002), who car-
the role of Water tNcs in Global Water Needs
BackgroundThe unique features of the water industry, as described above, pose a difficult ethical dilemma for governments. That is, irrespective of the cost, for the populace to sur-vive, the product of the industry has to be provided on a continuous basis. Recently, a few industrialized countries, notably France and the United Kingdom, have taken the route to privatizing the industry to assist in this supply (Shaoul, 1997). Gradually, the privatization process has also diffused into developing countries. The opening up of their water industry to privatization—nationally or, more likely, internationally—is based on three beliefs. First, that increased capital investment will rejuvenate the aging infrastructure, which in turn will help improve the supply. Second, along with the physical capital invest-ment, the water TNCs will bring in much-needed exper-tise to run the state enterprises efficiently. And, finally, increased competition will lead to overall improvement in the services provided, including competitive prices. These claims are examined later in a separate section, after a review of the salient features connected with water TNCs. The acronym TNC in this article is used in a broad sense. This is because, whereas some enterprises, such as Veolia, which has interests in over 60 countries, can be termed as truly global companies, others are relatively small, with involvement in limited geographic areas.
transnational Corporations and the Global Water Industry 605
DOI: 10.1002/tie thunderbird International Business review Vol. 53, No. 5 September/October 2011
to connect new communities in the kinds of numbers needed to tackle the global water crisis” (p. 6).
A review of literature such as that above leads to two basic questions. First, if it is necessary to privatize a public utility such as water, how can it be privatized to the ben-efit of the ultimate end-users, the most important being the consumer. Second, if it is not necessary to privatize, then what are the alternatives? Before we answer these questions in the form of policy suggestions, it will be help-ful to first summarize certain facts on TNCs’ operations in host countries. We begin with the sources of data and the methodology adopted to arrive at these facts.
Sources of Data and Methodology
National water industries around the world began to be privatized in the late 1980s. With a good amount of foresight, the World Bank had initiated a collection of data on investments in the privatization ventures of host countries’ infrastructure industries—in which water and sewerage is one. This collection has come to be known as the Private Participation in Infrastructure (PPI) data-base (World Bank, 2006a). Although the database has some limitations (described later), it is the only source from which meaningful conclusions on privatization measures can be derived. This section is based on the analysis of data that is publicly available from their web-site and on some additional data made available to the authors. The analysis is based on desk research of an in-depth analysis of these sets of data. The tables that are derived are one- and cross-ways frequency tables that, for the purpose of this article, help us make the point clear. A survey of literature on the impact of TNCs operations in host countries, as reported earlier, further help us clarify the tabular results and highlight the es-sential points in debate on water privatization programs of developing countries.
The PPI database identifies four types of private in-volvement in public-sector infrastructure industries:
(a) Under greenfield projects, a private entity or a public-private joint venture builds and operates a new facility for a specified period.
(b) Under management and lease contracts, a private en-tity takes over only the management of a state-owned enterprise for a fixed period.
(c) Under divestitures, a private entity can buy an equity stake in a state-owned enterprise.
(d) Under concessions, a private entity can take over the management of a state-owned enterprise for a given period.
ried out their empirical analysis on Mexican water utili-ties. Several other studies either disprove the hypothesis that privatization of water utilities brings in efficiency and/or suggest that, in fact, public utilities perform bet-ter than private (Bhattacharyya, Parker, & Raffie, 1994; Bruggink, 1982; Byrnes, Grosskopf, & Hayes, 1986; Fei-genbaum & Teeples, 1983; Kirkpatrick, Parker, & Zhang, 2006; Lambert, Dichev, & Raffie, 1993; Mann & Mikesell, 1976; Teeples & Glyer, 1987). However, some studies (Crain & Zardkoohi, 1978; Estache & Rossi, 1999; Galiani, Gertler, & Schargrodsky, 2002; Morgan, 1977; Raffie, Na-rayanan, Harris, Lambert, & Collins, 1992) conclude that private involvement is more efficient than public owner-ship and that it has had a positive impact on the welfare of the masses.
A detailed econometric country-based study on Ar-gentina’s privatization program (Galiani et al., 2002) concludes that increased investment in the sector has been responsible for a decrease in child mortality rates ranging from 5 to 7% in areas that privatized their water services, and that the poorest areas were the main ben-eficiaries where mortality rates fell by almost a quarter percent. Another study on Argentina concerning Buenos Aires’s water and sewerage privatization scheme (Abdala, 1996) concluded that increased investment in the sector, accompanied by overall efficiency and lower tariffs for the consumers, lead to welfare gains to users. The study, however, also points out that the government could have better handled the privatization process and earned bet-ter returns for itself. Another study (Prasad, 2006) claims that despite problems with the privatization in the water and sanitation sector, the issue of private involvement in this sector is still very much alive. More recently, mixed results have also been reported in the case of Cambodia (Public-Private Infrastructure Advisory Facility, 2002). Another country study on Tanzania (Kjellén, 2006) casts doubt on the would-be efficacy of privatization and la-ments the lack of transparency and competition in the privatization process. Similar sentiments are expressed in an earlier study on Mexico (Anwandter & Ozuna, 2002). Yet again, another country-specific paper on China (Sha-lizi, 2006) urges an imaginative approach to handling the issue of water management and its judicious allocation to competing end-users. A study that outrightly rejects the view that privatization has been a successful measure in the water industry of developing countries is by the World Development Movement (2006). Berating the promises advanced in favor of private-sector investment to solve the water problems of developing countries, the report states that “water privatisation has failed to deliver even the investment promised, let alone sufficient investment

606 feature artIcle
thunderbird International Business review Vol. 53, No. 5 September/October 2011 DOI: 10.1002/tie
Of these, one-third was invested in water treatment plants, and two-thirds in utilities; 66% of all invest-ment in water treatment plants and 29% of all invest-ment in utilities took place during 2001–2006.
4. The country distribution of the largest 50 water companies (Table 2) is as follows. Spain has the largest number of water companies with interests overseas (seven), followed by the United States and Hong Kong (six each); Malaysia (five); France and Italy (four); Germany, Japan, Singapore, and the United Kingdom (two each); and Argentina, Aus-tria, Canada, Cuba, Finland, Greece, and Portugal (one each).
5. French companies have the highest share in total in-vestment (31%), followed by Spanish (19%), German (14%), and US (10%) companies. Companies from these four countries have 74% of the total investment of the top 50 companies.
tNcs’ entry Modes As stated earlier, TNCs’ involvement in a host nation’s water industry can take one of four forms: concession,
There are two limitations with regard to data related to the water sector. First, the data does not report fig-ures purely on account of water treatment plants. Data reported under “Treatment Plants” consists of three components: (1) a potable water and sewerage treatment plant, (2) a potable water treatment plant, and (3) a sew-erage treatment plant. Under “Utility,” data is reported under three headings as well: (1) sewerage collection and treatment, (2) water utility with sewerage, and (3) water utility without sewerage. As a result, it is not always pos-sible to get pure data on investment in water plants when combining “treatment plant” and “utility” data. Where possible, totals have been calculated excluding “sewerage treatment plants” and “sewerage collection and treat-ment.” But because this has not always been possible, the total number of projects reported may vary in different tables. The second drawback with the data is of a general nature—that is, the investment figures reported include investment made by both private entities from domestic sources as well as those from foreign sources including water TNCs. Fortunately for the water sector, we were able to obtain exact investment figures from both these sources for the period 1996–2000. This information has been used (see later) to extrapolate investment figures for the two sectors separately in order to get some idea of private investment coming from domestic and overseas sources. Cancelled projects and projects in distress are excluded from the analysis.
Data analys is
Salient features of Water tNcsUsing the sources and methodology as described earlier, a detailed examination of available data was undertaken. The analysis highlighted the following features of private investment into the water sector of host countries.
1. There are a total of 243 large and small enterprises that are operating overseas with interests in host countries’ water industry. Of this total, 179 have interests only in 1 country; 31 have interests in 2; 18 in 3; 7 in 4; 3 in 5; 2 in 7; 1 in 11; and 2 in 23. The 243 enterprises have interests in 409 water projects in 53 host countries.
2. Between 1990 and 2006, these enterprises have in-vested a total of $38.983 million. The share of the top ten enterprises in this is 57%; the share of the next ten is 14%. Thus, the top 20 enterprises between them have over 70% of the share of total investment.
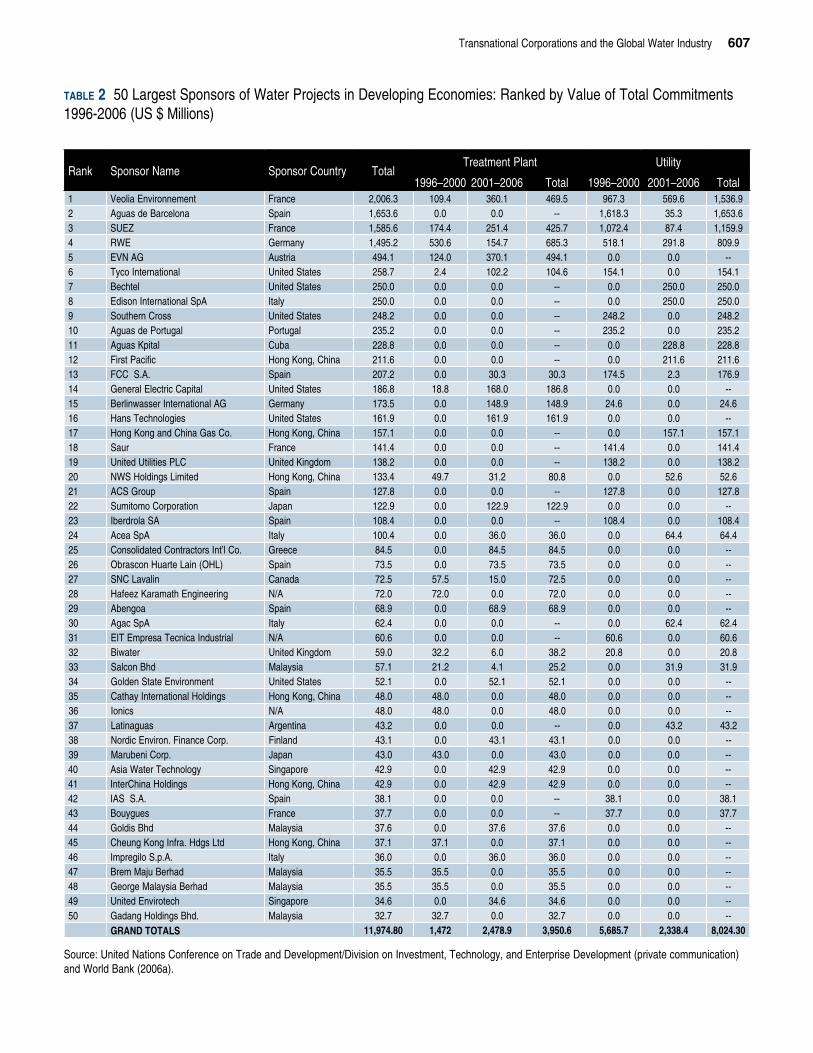
3. Table 1 lists the investment share of the top 50 water TNCs. The cumulative investment by these TNCs during the period 1996–2006 was $11.975 million.
Country total Investment ($m) Percent Sharefrance 3,771.0 31.49
Spain 2,277.5 19.02
Germany 1,668.7 13.94
united States 1,157.7 9.67
Hong Kong, China 630.1 5.26
austria 494.1 4.13
Italy 448.8 3.75
Portugal 235.2 1.96
Cuba 228.8 1.91
Malaysia 198.4 1.66
united Kingdom 197.2 1.65
Japan 165.9 1.39
Greece 84.5 0.71
Singapore 77.5 0.65
Canada 72.5 0.61
argentina 43.2 0.36
finland 43.1 0.36
Others 180.6 1.51total 11,974.8 100.0
Source: table 2.
table 1 Share of top 50 Water tNCs in Overseas Water Industries (1996–2006)
transnational Corporations and the Global Water Industry 607
DOI: 10.1002/tie thunderbird International Business review Vol. 53, No. 5 September/October 2011
rank Sponsor Name Sponsor Country totaltreatment Plant utility
1996–2000 2001–2006 total 1996–2000 2001–2006 total1 Veolia environnement france 2,006.3 109.4 360.1 469.5 967.3 569.6 1,536.92 aguas de Barcelona Spain 1,653.6 0.0 0.0 -- 1,618.3 35.3 1,653.63 SueZ france 1,585.6 174.4 251.4 425.7 1,072.4 87.4 1,159.94 rWe Germany 1,495.2 530.6 154.7 685.3 518.1 291.8 809.95 eVN aG austria 494.1 124.0 370.1 494.1 0.0 0.0 --6 tyco International united States 258.7 2.4 102.2 104.6 154.1 0.0 154.17 Bechtel united States 250.0 0.0 0.0 -- 0.0 250.0 250.08 edison International Spa Italy 250.0 0.0 0.0 -- 0.0 250.0 250.09 Southern Cross united States 248.2 0.0 0.0 -- 248.2 0.0 248.210 aguas de Portugal Portugal 235.2 0.0 0.0 -- 235.2 0.0 235.211 aguas Kpital Cuba 228.8 0.0 0.0 -- 0.0 228.8 228.812 first Pacific Hong Kong, China 211.6 0.0 0.0 -- 0.0 211.6 211.613 fCC S.a. Spain 207.2 0.0 30.3 30.3 174.5 2.3 176.914 General electric Capital united States 186.8 18.8 168.0 186.8 0.0 0.0 --15 Berlinwasser International aG Germany 173.5 0.0 148.9 148.9 24.6 0.0 24.616 Hans technologies united States 161.9 0.0 161.9 161.9 0.0 0.0 --17 Hong Kong and China Gas Co. Hong Kong, China 157.1 0.0 0.0 -- 0.0 157.1 157.118 Saur france 141.4 0.0 0.0 -- 141.4 0.0 141.419 united utilities PLC united Kingdom 138.2 0.0 0.0 -- 138.2 0.0 138.220 NWS Holdings Limited Hong Kong, China 133.4 49.7 31.2 80.8 0.0 52.6 52.621 aCS Group Spain 127.8 0.0 0.0 -- 127.8 0.0 127.822 Sumitomo Corporation Japan 122.9 0.0 122.9 122.9 0.0 0.0 --23 Iberdrola Sa Spain 108.4 0.0 0.0 -- 108.4 0.0 108.424 acea Spa Italy 100.4 0.0 36.0 36.0 0.0 64.4 64.425 Consolidated Contractors Int’l Co. Greece 84.5 0.0 84.5 84.5 0.0 0.0 --26 Obrascon Huarte Lain (OHL) Spain 73.5 0.0 73.5 73.5 0.0 0.0 --27 SNC Lavalin Canada 72.5 57.5 15.0 72.5 0.0 0.0 --28 Hafeez Karamath engineering N/a 72.0 72.0 0.0 72.0 0.0 0.0 --29 abengoa Spain 68.9 0.0 68.9 68.9 0.0 0.0 --30 agac Spa Italy 62.4 0.0 0.0 -- 0.0 62.4 62.431 eIt empresa tecnica Industrial N/a 60.6 0.0 0.0 -- 60.6 0.0 60.632 Biwater united Kingdom 59.0 32.2 6.0 38.2 20.8 0.0 20.833 Salcon Bhd Malaysia 57.1 21.2 4.1 25.2 0.0 31.9 31.934 Golden State environment united States 52.1 0.0 52.1 52.1 0.0 0.0 --35 Cathay International Holdings Hong Kong, China 48.0 48.0 0.0 48.0 0.0 0.0 --36 Ionics N/a 48.0 48.0 0.0 48.0 0.0 0.0 --37 Latinaguas argentina 43.2 0.0 0.0 -- 0.0 43.2 43.238 Nordic environ. finance Corp. finland 43.1 0.0 43.1 43.1 0.0 0.0 --39 Marubeni Corp. Japan 43.0 43.0 0.0 43.0 0.0 0.0 --40 asia Water technology Singapore 42.9 0.0 42.9 42.9 0.0 0.0 --41 InterChina Holdings Hong Kong, China 42.9 0.0 42.9 42.9 0.0 0.0 --42 IaS S.a. Spain 38.1 0.0 0.0 -- 38.1 0.0 38.143 Bouygues france 37.7 0.0 0.0 -- 37.7 0.0 37.744 Goldis Bhd Malaysia 37.6 0.0 37.6 37.6 0.0 0.0 --45 Cheung Kong Infra. Hdgs Ltd Hong Kong, China 37.1 37.1 0.0 37.1 0.0 0.0 --46 Impregilo S.p.a. Italy 36.0 0.0 36.0 36.0 0.0 0.0 --47 Brem Maju Berhad Malaysia 35.5 35.5 0.0 35.5 0.0 0.0 --48 George Malaysia Berhad Malaysia 35.5 35.5 0.0 35.5 0.0 0.0 --49 united envirotech Singapore 34.6 0.0 34.6 34.6 0.0 0.0 --50 Gadang Holdings Bhd. Malaysia 32.7 32.7 0.0 32.7 0.0 0.0 --
GraND tOtalS 11,974.80 1,472 2,478.9 3,950.6 5,685.7 2,338.4 8,024.30
Source: united Nations Conference on trade and Development/Division on Investment, technology, and enterprise Development (private communication) and World Bank (2006a).
table 2 50 Largest Sponsors of Water Projects in Developing economies: ranked by Value of total Commitments 1996-2006 (uS $ Millions)
608 feature artIcle
thunderbird International Business review Vol. 53, No. 5 September/October 2011 DOI: 10.1002/tie
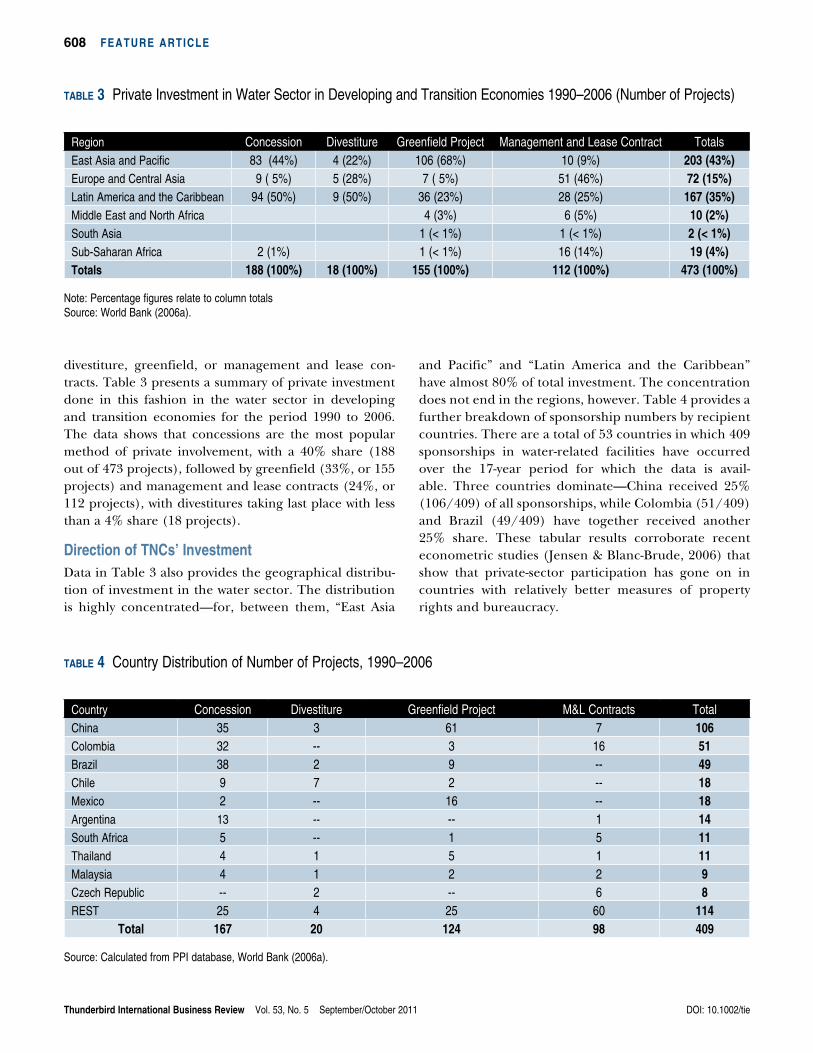
and Pacific” and “Latin America and the Caribbean” have almost 80% of total investment. The concentration does not end in the regions, however. Table 4 provides a further breakdown of sponsorship numbers by recipient countries. There are a total of 53 countries in which 409 sponsorships in water-related facilities have occurred over the 17-year period for which the data is avail-able. Three countries dominate—China received 25% (106/409) of all sponsorships, while Colombia (51/409) and Brazil (49/409) have together received another 25% share. These tabular results corroborate recent econometric studies (Jensen & Blanc-Brude, 2006) that show that private-sector participation has gone on in countries with relatively better measures of property rights and bureaucracy.
divestiture, greenfield, or management and lease con-tracts. Table 3 presents a summary of private investment done in this fashion in the water sector in developing and transition economies for the period 1990 to 2006. The data shows that concessions are the most popular method of private involvement, with a 40% share (188 out of 473 projects), followed by greenfield (33%, or 155 projects) and management and lease contracts (24%, or 112 projects), with divestitures taking last place with less than a 4% share (18 projects).
Direction of tNcs’ InvestmentData in Table 3 also provides the geographical distribu-tion of investment in the water sector. The distribution is highly concentrated—for, between them, “East Asia
region Concession Divestiture Greenfield Project Management and Lease Contract totalseast asia and Pacific 83 (44%) 4 (22%) 106 (68%) 10 (9%) 203 (43%)europe and Central asia 9 ( 5%) 5 (28%) 7 ( 5%) 51 (46%) 72 (15%)Latin america and the Caribbean 94 (50%) 9 (50%) 36 (23%) 28 (25%) 167 (35%)Middle east and North africa 4 (3%) 6 (5%) 10 (2%)South asia 1 (< 1%) 1 (< 1%) 2 (< 1%)Sub-Saharan africa 2 (1%) 1 (< 1%) 16 (14%) 19 (4%)totals 188 (100%) 18 (100%) 155 (100%) 112 (100%) 473 (100%)
Note: Percentage figures relate to column totals Source: World Bank (2006a).
table 3 Private Investment in Water Sector in Developing and transition economies 1990–2006 (Number of Projects)
Country Concession Divestiture Greenfield Project M&L Contracts totalChina 35 3 61 7 106Colombia 32 -- 3 16 51Brazil 38 2 9 -- 49Chile 9 7 2 -- 18Mexico 2 -- 16 -- 18argentina 13 -- -- 1 14South africa 5 -- 1 5 11thailand 4 1 5 1 11Malaysia 4 1 2 2 9Czech republic -- 2 -- 6 8reSt 25 4 25 60 114 total 167 20 124 98 409
Source: Calculated from PPI database, World Bank (2006a).
table 4 Country Distribution of Number of Projects, 1990–2006
transnational Corporations and the Global Water Industry 609
DOI: 10.1002/tie thunderbird International Business review Vol. 53, No. 5 September/October 2011
transition to Global Water Industry amidst Growing Influence of tNcsThe global water industry is in a period of transition that began in the early 1990s with decisions by developing countries to open the sector to private participation in order to widen and deepen the capital and technological base. The ultimate aim behind the privatization process is to meet existing and potential water shortages. The im-perative of the growing crisis can be gauged from the fact that the United Nations has proclaimed the availability of water for the masses as one of its Millennium Develop-ment Goals. The gravity of the situation was already real-ized in the late 1980s and early 1990s when privatization programs were initiated by selected developing coun-tries—in that sense, these countries can be regarded as the forerunners of MDGs. The scale of private participa-tion in the global water industry is as yet small—approxi-mately 10% of the industry is in private ownership. As a result, there is scope for investment in the sector before it reaches the saturation point. Between 1996 and 2006, $12 billion were invested in which the share of the private sec-tor including TNCs from four countries—France, Spain, Germany, and the United States—was 75%, revealing the oligopolistic nature of overseas involvement. Tentative calculation put the share of water TNCs in total private investment at 56%. There is, however, concentration on the receiver’s end as well. China, Colombia, Brazil, Chile, Mexico, and Argentina are the major recipient of funds, attracting over half of the total investment.
Impact of Water tNcs on Host countries
The issue that, presently in the developing world, there is an acute shortage of clean water for household, ag-ricultural, and industrial use is not in debate. A large number of theoretical and factual studies have focused on this issue. The seminal question is how this require-ment should be met? MDGs are steps in the right di-rection, and water TNCs are gradually making inroads into the water privatization programs of developing countries. However, a survey of literature on the impact of private involvement in the water sector reveals mixed results. It is not possible to conclude firmly whether private participation in the water sector, which is a criti-cal public service in developing countries, is beneficial for the poor masses. The biggest issue here is pricing. Commercial enterprises operate for profit, and the issue of subsidizing the service, or providing it a breakeven point, does not exist in their parlance, and the poor can-not afford to pay on a “full cost plus” pricing principle. This is the dilemma.
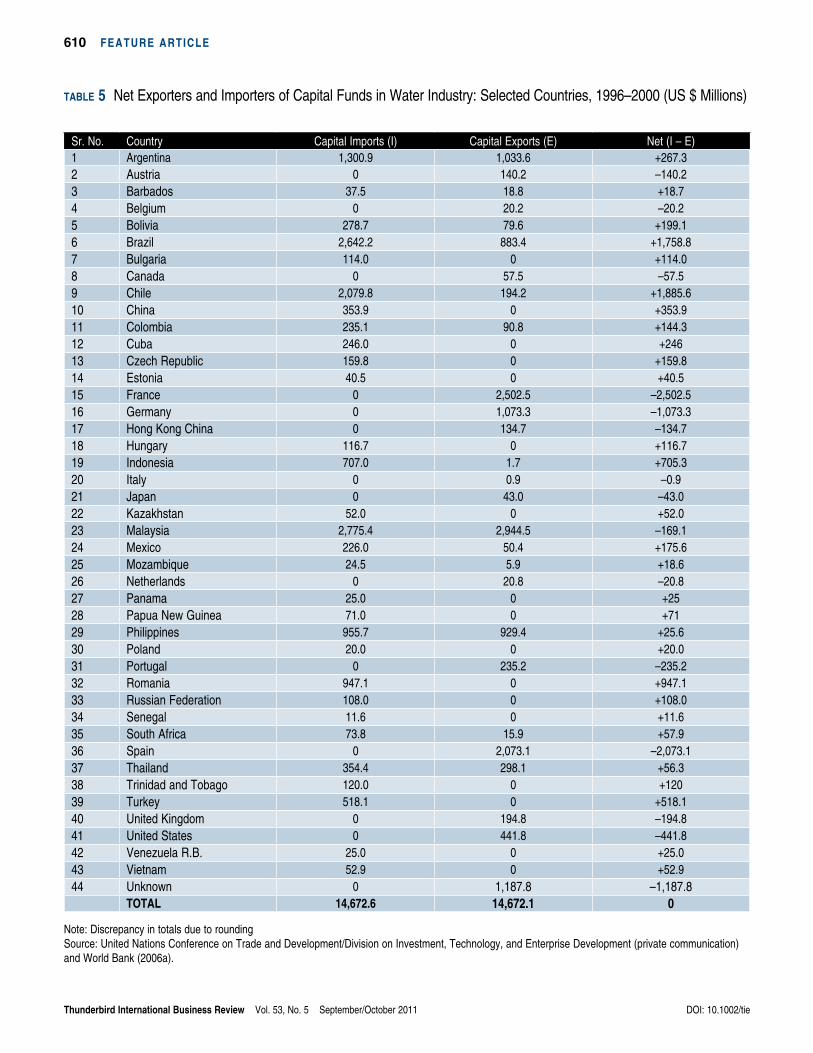
Private Domestic Investment vs. transnational InvestmentTable 5 lists selected exporters and/or recipients of capi-tal funds in the water industry for the period 1996–2000. Data for this period shows that 17 of the listed countries are only recipients and 13 are only exporters; 13 coun-tries also have two-way movement of funds. France and Spain stand out as the largest exporter of funds, while Brazil and Chile are the largest receivers of funds.
Data in Table 5 gives a snapshot of two-way flow of funds information between countries. The invest-ment figures reported include funds flow originating from private sector investors of host countries as well as those from TNCs into the water and sewage sector of the host countries. Fortunately, for the period for which the data is reported in Table 5, it was possible to obtain data purely on account of funds flow from TNCs. This figure amounts to a total of $8.295 million, which means 56% (8295/14673) of the total funds flow into this sector were by TNCs. Using this ratio we can make some tentative extrapolations of water projects funded purely by water TNCs. Under the salient fea-tures, we pointed out that between 1990 and 2006, pri-vate entities have invested a total of $38.983 million in host countries’ water sectors. Using the ratio as worked out above (56%), the share of TNCs in the water sec-tor of host countries works out to be $21.830 million in absolute terms.
Summary, Pol icy Suggest ions, and future research
Global Water NeedsWater as a consumer product possessing life-saving properties is an emotive and difficult issue for state governments to deal with. Water is provided in abun-dance by nature but has to be extracted and purified for human and industrial use, which attaches cost to it. It is argued that the poor masses in developing countries cannot afford to buy it if it is sold to them at a “full cost plus” pricing principle, which essentially means covering the full cost and adding a profit mar-gin on it before it is sold to the public. The problem is compounded by the fact that presently 1.5 billion of the world’s population have no access to water and, if unchecked, in 15 years’ time about half of the world’s population (mostly in the developing world) will have little or no access to water. The gravity of the situation has prompted many countries to initiate changes in their domestic water industry.
610 feature artIcle
thunderbird International Business review Vol. 53, No. 5 September/October 2011 DOI: 10.1002/tie
Sr. No. Country Capital Imports (I) Capital exports (e) Net (I – e)1 argentina 1,300.9 1,033.6 +267.32 austria 0 140.2 –140.23 Barbados 37.5 18.8 +18.74 Belgium 0 20.2 –20.25 Bolivia 278.7 79.6 +199.16 Brazil 2,642.2 883.4 +1,758.87 Bulgaria 114.0 0 +114.08 Canada 0 57.5 –57.59 Chile 2,079.8 194.2 +1,885.610 China 353.9 0 +353.911 Colombia 235.1 90.8 +144.312 Cuba 246.0 0 +24613 Czech republic 159.8 0 +159.814 estonia 40.5 0 +40.515 france 0 2,502.5 –2,502.516 Germany 0 1,073.3 –1,073.317 Hong Kong China 0 134.7 –134.718 Hungary 116.7 0 +116.719 Indonesia 707.0 1.7 +705.320 Italy 0 0.9 –0.921 Japan 0 43.0 –43.022 Kazakhstan 52.0 0 +52.023 Malaysia 2,775.4 2,944.5 –169.124 Mexico 226.0 50.4 +175.625 Mozambique 24.5 5.9 +18.626 Netherlands 0 20.8 –20.827 Panama 25.0 0 +2528 Papua New Guinea 71.0 0 +7129 Philippines 955.7 929.4 +25.630 Poland 20.0 0 +20.031 Portugal 0 235.2 –235.232 romania 947.1 0 +947.133 russian federation 108.0 0 +108.034 Senegal 11.6 0 +11.635 South africa 73.8 15.9 +57.936 Spain 0 2,073.1 –2,073.137 thailand 354.4 298.1 +56.338 trinidad and tobago 120.0 0 +12039 turkey 518.1 0 +518.140 united Kingdom 0 194.8 –194.841 united States 0 441.8 –441.842 Venezuela r.B. 25.0 0 +25.043 Vietnam 52.9 0 +52.944 unknown 0 1,187.8 –1,187.8
tOtal 14,672.6 14,672.1 0
Note: Discrepancy in totals due to roundingSource: united Nations Conference on trade and Development/Division on Investment, technology, and enterprise Development (private communication) and World Bank (2006a).
table 5 Net exporters and Importers of Capital funds in Water Industry: Selected Countries, 1996–2000 (uS $ Millions)
transnational Corporations and the Global Water Industry 611
DOI: 10.1002/tie thunderbird International Business review Vol. 53, No. 5 September/October 2011
order and work toward making it efficient or to invite private participation and then establish a regulatory agency to oversee the operation of private investors? The second solution is a double-edged sword. If the government and/or concerned regulatory agencies are not up to the job, then it will be reduced to fire fighting the ensuing problems. A classic example of this emerged in India when a 22.7-km stretch of a semiperennial river was privatized (Singh, 2004)! Public protests have forced state authorities to review the decision. It may cost the government millions in compensation to reverse the contract—a waste of funds that could be put to good alternate uses in such a resource-constrained economy.
3. The third and the final issue is that of pricing. The crux of the problem is the affordability by the poor. Clearly, the “full cost plus” pricing principle cannot work in situations where end-users are unable to bear even the base price. Hence, some degree of subsidization is called for, at least in the initial stages of development. There is, however, no justification in providing subsidized water to industries, which could be charged on the “full cost plus” principle. Before embarking on any business venture, water usage is one of the costs a firm has to take into ac-count in its feasibility study. If water is a precious commodity, then there is no reason why it cannot be auctioned to industry like any other product. Recent studies (Iimi, 2008) have reported that the water sector has the lowest competition in the infra-structure industries where only a small number of firms are allowed to participate in the auction. After analyzing the depth of scale economies, the same study also recommends that “there is no rationale for auctioning the water operations with annual water delivery of more than 400 m3. To enhance the competition effect, auctioneers should consider the possibility to unbundle the transaction to several contracts” (Iimi, 2008, abstract).
In the final analysis, it has to be noted that a large portion of the world’s water industry remains in public hands. Governments of developing countries need to take a deeper look to determine if they indeed need private help to sort out as vital an industry as water. It can be argued that, even if the answer to this ques-tion was “yes,” the timing is perhaps not right. Western countries who adopted the privatization route did so at a critical stage in their development path. At this stage, the overall educational and general awareness of the masses and the government that dealt with the issue had
Presently, there may be a slowdown in the expan-sion program of TNCs as is reported in some studies (Hall, 2003; Hall & Lobina, 2007; Robbins, 2003). This slowdown could be owing to a number of reasons. For instance, being commercial entities, water TNCs may be in the process of taking stock of what they have achieved so far and in which directions they wish to progress. This, in turn, may have been prompted by the criticism levied by nongovernmental organizations (NGOs) and other interest groups on private entry into an erstwhile strong-hold on the public sector. The present worldwide reces-sion may also be forcing TNCs to brace themselves. It is unlikely that, given the scale of investment opportunities, TNCs will fade into oblivion. There is a possibility that, with the growing knowledge on both sides (e.g., on how to deal with each other), the host countries and private entities may come together for the common good of the masses. With careful handling and negotiations, there is no reason why a trade-off between the financial viability of private operators and the general welfare of the masses cannot be found.
Policy Suggestions In order to achieve this end, we suggest a three-point
framework.
1. The relevant authorities of a country first have to de-cide whether to take the privatization route to their water problems or not. This is a fundamental ques-tion involving public versus private rights to service provisions, bearing in mind that it is not the water per se that is subject of privatization rights, but the ser-vices providing it. There is no reason why the public sector, with help from financial institutions, cannot meet the investment requirements to keep the provi-sion of such an important and emotive good in the public domain. Clearly, if this public route is chosen then some mechanism to enhance overall efficiency has to be found.
2. Two central themes repeatedly emerge in the litera-ture on water privatization issues. First, the issue of private participation does not seem to be handled efficiently, and second, the management of water utilities is marred by corruption. Practical manuals (e.g., World Bank, 2006b) that deal with the priva-tization issue in water services have been written to assist countries engaged in the privatization process. However, in the end, it is the implementing author-ity that has to educate itself on the process. Devel-oping countries, it seems, have only two choices to consider: is it better to keep their existing house in
612 feature artIcle
thunderbird International Business review Vol. 53, No. 5 September/October 2011 DOI: 10.1002/tie
an extensive public debate on the efficacy of privatization of public utilities is also required. In order to compile such a database, the authors suggest that the following further research be undertaken:
1. Individual and in-depth countrywide studies, espe-cially for countries experimenting with privatization programs involving foreign investment, and
2. Analyses of firm-specific performances in host coun-tries, including cost-benefit and welfare analyses of their operations.
acknowledgments
The authors are grateful to the staff of The Division on Investment and Enterprise at UNCTAD for helpful com-ments on drafts of a report prepared on this topic for the Division. All shortcomings and opinions expressed in the paper are those of the authors and do not in any way reflect the views of UNCTAD or any other organization mentioned in the paper.
reached a stage where they could deal with the issue of privatization and its governance in an efficient manner. Corruption-free bureaucracy and a sound legal system, complemented by an unwritten civil and corporate code of conduct that is constantly evolving with time with input from the public, are the hallmarks of these coun-tries. These hallmarks are the essential ingredients of success of any privatization process. Maybe the develop-ing countries ought to wait a few more years and should emulate/inculcate some of these traits before embark-ing on ambitious privatization programs of such crucial sectors as water. With its life-granting properties, water indeed is unique in its own right and demands much more soul searching before it is thrown open to the cold calculus of profit and loss of private enterprises.
future researchThis analysis is based on available published data, though the authors recognize that a more comprehensive data-base, exclusively addressing TNCs’ involvement in the global water industry, has yet to be compiled. Moreover,
Satwinder Singh is a lecturer at Brunel university and holds a PhD in economics with a specialization in international business. He previously worked as a senior research fellow in the Department of economics at the university of reading, england. His primary research interests are in the area of firm behavior and human resource management in large national and multinational enterprises. He has consulted for private and public organizations, including the united Nations Conference on trade and Development and the Macroeconomic and financial Management Institute of eastern and Southern africa. Dr. Singh has written over 40 papers and chapters in edited volumes on international business.
Keith Dickson is currently deputy head (research) and professor of technology management in the Brunel Busi-ness School at Brunel university, where he was first appointed as a lecturer in 1990 following previous academic posts at Kingston and aston universities in england. He cofounded Brunel research in enterprise, Innovation, Sustainability, and ethics (BreSe) at Brunel in 2001. Professor Dickson’s work has been published widely in the fields of technology management, entrepreneurship, and innovation studies as a result of many research projects on such topics as teleworking in small and medium-sized enterprises (SMes), intellectual property rights protec-tion in textiles, social capital in SMes, and collaborative research networks.
referencesAbdala, M. (1996). Welfare effects of Buenos Aires’ water and sewerage services privatisation. Cordóba, Argentina: Expectativa Economic Consult-ants. Retrieved from http://www.aaep.org.ar/espa/anales/pdf/abdala.pdf
Anwandter, L., & Ozuna, T. (2002). Can public sector reforms improve the efficiency of public water utilities? Environment and Development Economics, 7, 687–700.
Bhattacharyya, A., Parker, E., & Raffie, K. (1994). An examination of the effect of ownership on the relative efficiency of public and private water utilities. Land Economics, 70, 197–209.
Bruggink, T. (1982). Public versus regulated private enterprises in the municipal water industry: A comparison of operating costs. Quarterly Review of Economics and Business, 22, 111–125.
Budds, J., & McGranahan, G. (2003). Are the debates on water priva-tisation missing the point? Experiences from Africa, Asia and Latin America. Environment and Urbanisation, 15(2), 87–113.
Byrnes, P., Grosskopf, S., & Hayes, K. (1986). Efficiency and ownership: Further evidence. The Review of Economics and Statistics, 68, 337–341.
Cesano, D., & Gustafsson, J. (2000). Impact of economic globalisation on water resources. Water Policy, 2, 213–222.
Crain, W., & Zardkoohi, A. (1978). A test of the property-rights theory
transnational Corporations and the Global Water Industry 613
DOI: 10.1002/tie thunderbird International Business review Vol. 53, No. 5 September/October 2011
water connections in Sri Lanka. Policy Research Working Paper WPS 3818. Washington, DC: World Bank.
Peet, J. (2003). Priceless: A survey of water. The Economist, 368 (8333), S3–S17.
Prasad, N. (2006). Privatisation results: Private sector participation in water services after 15 years. Development Policy Review, 24, 669–692.
Public-Private Infrastructure Advisory Facility. (2002). Public-private in-frastructure facility on water. Retrieved from http://wbln0018.worldbank .org/ppiaf/activity.nsf/WebSectorWater
Raffie, K., Narayanan, R., Harris, T., Lambert, D., & Collins, J. (1992). Cost analysis of water utilities: A goodness-of-fit approach. Working paper, Department of Economics, University of Nevada.
Robbins, P. (2003). Transnational corporations and the disclosure of water privatization. Journal of International Development, 15, 1073–1082.
Rosenthal, S. (2001). The Manila water concessions and their impact on the poor. New Haven, CT: Yale School of Forestry and Environmental Studies.
Shalizi, Z. (2006). Addressing China’s growing water shortage and as-sociated social and environmental consequences. Policy Research Work-ing Paper WPS 3895. Washington, DC: The World Bank.
Shaoul, J. (1997). The power of accounting: Reflecting on water priva-tization? Accounting Auditing & Accountability Journal, 10, 382–405.
Singh, A. (2004). Privatisation of Sheonath River. Combat Law, 3(2). Retrieved from http://www.combatlaw.org/v3i2.php
Teeples, R., & Glyer, D. (1987). Cost of water delivery systems specification and ownership effects. Review of Economics and Statistics, 69, 399–407.
United Nations. (2006a). HDR 2006—Beyond scarcity: Power, poverty and the global water crisis. UNDP Human Development Report. New York: Author. Retrieved from http://hdr.undp.org/hdr2006/
United Nations. (2006b). Investing in development: A practical plan to achieve the millennium development goals. UN Millennium Project. New York: Author. Retrieved from http://www.unmillenniumproject .org/goals/gti.htm#goal7
United Nations. (2006c). The millennium development goals report 2006. New York: Author.
United Nations. (2008). UN millennium development goals. New York: Author. Retrieved from http://www.un.org/millenniumgoals/
United Nations Development Programme (UNDP). (2009). United Nations development programme on environment and energy: Water governance. New York: United Nations. Retrieved from http://www .undp.org/water
World Bank. (2006a, September). Private participation in water. Public-Private Infrastructure Advisory Facility (PPIAF). Gridlines, Note No. 14.
World Bank. (2006b). Approaches to private participation in water ser-vices: A toolkit. Washington, DC: Author.
World Bank. (2009). Retrieved from http://www.worldbank.org/watsan
World Business Council for Sustainable Development (WBCSD). (2006). Facts and trends: Water. Geneva, Switzerland. Retrieved from http://www.wbcsd.org
World Development Movement. (2006). Pipe dreams. Retrieved from http://www.wdm.org.uk/resources/reports/water/pipedreamsreport 01032006.pdf
of the Firm: Water utilities in the United States. Journal of Law and Economics, 21, 395–408.
Estache, A., & Rossi, M. (1999). Comparing the performance of public and private water companies in Asia and Pacific Region. What a sto-chastic cost frontier shows. Policy Research Working Paper WPS 2890. Washington, DC: The World Bank.
Feigenbaum, S., & Teeples, R. (1983). Public versus private water deliv-ery: A hedonic cost approach. The Review of Economics and Statistics, 65, 672–678.
Galiani, S., Gertler, P., & Schargrodsky, E. (2002). Water for life: The impact of the privatisation of water services on child mortality. Retrieved from http://faculty.haas.berkeley.edu/gertler/
Hall, D. (2003). Water multinationals—No longer business as usual, PSIRU (Public Services International Research Unit) paper. London: University of Greenwich.
Hall, D., & Lobina, E. (2007). Water companies in Europe 2007, PSIRU (Public Services International Research Unit) report. London: Univer-sity of Greenwich.
Iimi, A. (2008). Bundling public-private partnership contracts in the water sector: Competition in auctions and economies of scale in opera-tion. Policy research working paper No. WPS 4459, Washington, DC: World Bank.
Jensen, O., & Blanc-Brude, F. (2006). The handshake: Why do govern-ments and firms sign private sector participation deals? Evidence from the water and sanitation sector in developing countries. Policy research working paper No WPS 3937. Washington, DC: World Bank.
Johnstone, N., & Wood, L. (Eds.). (2001). Private firms and public water: Realising social and environmental objectives in developing countries. Cheltenham, UK: Edward Elgar.
Kauffmann, C., & Pérard, E. (2007). Stocktaking of the water and sanita-tion sector and private sector involvement in selected African countries. Background note for the regional roundtable on strengthening invest-ment climate assessment and reform in NEPAD countries. Paris: OECD.
Kirkpatrick, C., Parker, D., & Zhang, Y-F. (2006). An empirical analysis of state and private-sector provision of water services in Africa. World Bank Economic Review, 20, 143–163.
Kjellén, M. (2006). From public pipes to private hands: Water access and distribution in Dar es Salaam, Tanzania. Retrieved from http://urn.kb.se/resolve?urn=urn:nbn:se:su:diva-1212
Lambert, D., Dichev, D., & Raffie, K. (1993). Ownership and sources of inefficiency in the provision of water services. Water Resource Research, 29, 1573–1578.
Mann, P., & Mikesell, J. (1976). Ownership and water system operation. Water Resource Bulletin, 12, 995–1004.
Morgan, D. (1977). Investor owned vs. publicly owned water agencies: An evaluation of the property rights theory of the firm. Water Resource Bulletin, 13, 777–781.
Nauges, C., & Van den Berg, C. (2007). How natural are natural mo-nopolies in the water supply and sewerage sector? Case studies from developing and transition economies. Policy Research Working Paper WPS 4137. Washington, DC: World Bank.
Pattanayak, S., Van den Berg, C., Yang, J-C., & van Houtven, G. (2006). The use of willingness to pay experiments: Estimating demand for piped