transport statistics great britain 2017 · 0 20 40 60 80 100 over a quarter of all trips were for...
TRANSCRIPT
November 2017
Transport Statistics Great Britain 2017
2017 Edition

Passenger transport TSGB0101-0102Passenger kilometres by mode, Great Britain: 1952 to 2016
Transport Statistics Great Britain 2017 Modal Comparisons
Trips Distance
Further data are available on Modal Comparisons, including: ► Passenger transport and personal travel: mode, distance, purpose, casualty rates and travelling in London during the morning peak: TSGB0101-07
► Transport related employment: TSGB0116
More detailed information on personal travel can be found in the National Travel Survey.
Trips by purpose, England: 2016Purpose of trips TSGB0104
How we travelled, mode share, England: 2016
Mode share TSGB0103-0105
Most modes are used for a mixture of purposes, however over half (58%) of all trips by surface rail are for either commuting or business purposes.
4.9 billionpassenger journeys on local bus services - 61% lower than 1950.
passenger kilometres - the highest volume ever recorded
801 billion
Percentage
0
200
400
600
800
1952 1956 1960 1964 1968 1972 1976 1980 1984 1988 1992 1996 2000 2004 2008 2012 2016
Other Buses & coaches Rail Cars, vans and taxisBillion passenger kms
Other
62% 78%
25% 3%
5% 4%
2% 8%
2% 1%
3% 5%
Commuting/business Education/escort education Shopping
Other escort Personal business Leisure
Other including just walk
0 20 40 60 80 100
Over a quarter of all trips were for leisure purposes in 2016, that includes trips to visit friends, sports, holidays and day trips. Around 19% of trips were for commuting/business or shopping.
passenger journeys in 2016/17Over 8.3 billion
of passenger kilometres in 2016 were by car, van or taxi
Over 80%
Further information and detailed statistical tables: Modal Comparisons statisticsPassenger Transport and Labour Force Survey
Darren Stillwell020 7944 4746
Overseas TravelNikesh Lad
07747 627141 [email protected]
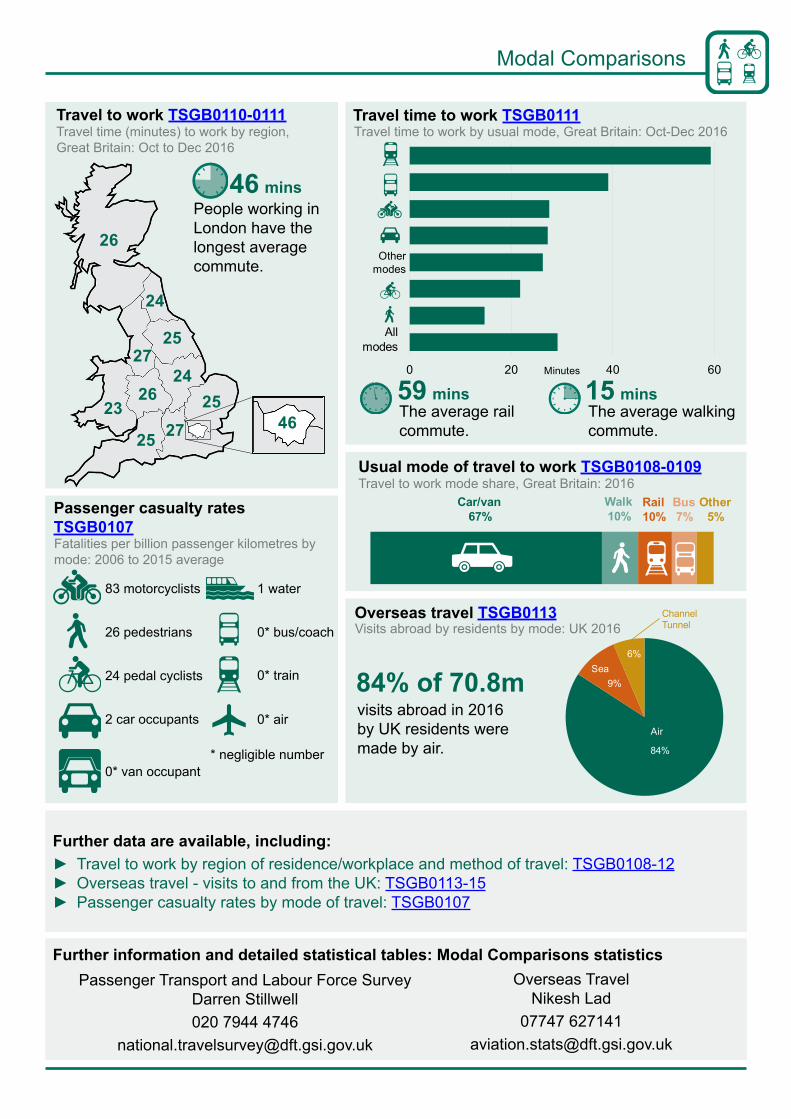
Usual mode of travel to work TSGB0108-0109
Travel time to work TSGB0111Travel to work TSGB0110-0111
Further data are available, including: ► Travel to work by region of residence/workplace and method of travel: TSGB0108-12 ► Overseas travel - visits to and from the UK: TSGB0113-15 ► Passenger casualty rates by mode of travel: TSGB0107
Passenger casualty rates TSGB0107
Overseas travel TSGB0113
People working in London have the longest average commute.
46 mins
The average rail commute.
59 mins 15 minsThe average walking commute.
12
39
6
12
39
6
Travel time (minutes) to work by region, Great Britain: Oct to Dec 2016
Travel time to work by usual mode, Great Britain: Oct-Dec 2016
Fatalities per billion passenger kilometres by mode: 2006 to 2015 average
Visits abroad by residents by mode: UK 2016
Travel to work mode share, Great Britain: 2016
83 motorcyclists
26 pedestrians
24 pedal cyclists
2 car occupants
0* van occupant
1 water
0* bus/coach
0* train
0* air
* negligible number
visits abroad in 2016 by UK residents were made by air.
84% of 70.8m
24
2725
2426 25
25 27 4623
26
0 20 40 60Minutes
Other modes
All modes
84%
9%
6%
Air
Sea
Channel Tunnel
Car/van67%
Walk10%
Rail10%
Bus7%
Other5%
Modal Comparisons

Trends in air traffic TSGB0201 Trend in air traffic at UK airports: 1991 to 2016
Transport Statistics Great Britain 2017 Aviation
2.2 millionair transport movements (ATMs)(landings and take-offs), 5% more than 2015 but 7% less than the peak in 2007.
268 millionterminal passengers (arrivals and departures) - an increase of 7% from 2015 and 50% higher than in 2000.
tonnes of freight handled in 2016, 4% more than in 2015 and exceeds the former peak in 2004.
2.4 million
Further data are available on air traffic at UK airports, including:
► Activity at UK airports, including punctuality and passenger characteristics: TSGB0201 ► Activity of UK airlines: TSGB0202 ► Major airports and airlines worldwide: TSGB0203
Traffic at UK airports TSBG0202 Traffic at UK airports: 2016
Passenger characteristics TSGB0208Passenger characteristics at selected UK airports: 2016
The 5 London airports (Heathrow, Gatwick, Luton, Stansted, London City) accounted for 59% of passengers, 50% of ATMs and 78% of freight in 2016.
There were 7 UK airports with more than 100,000 ATMs in 2016. This includes Heathrow, Gatwick, Manchester, Stansted, Luton, Edinburgh and Birmingham.
East Midlands handled the most air freight (12%) after Heathrow.
2016 figures
HolidayVisiting friends and relativesBusinessOther
54%30%
14%2%
Gatwick
HolidayVisiting friends and relativesBusinessOther
33%37%
26%4%
Heathrow
HolidayVisiting friends and relativesBusinessOther
36%48%
14%2%
Stansted
HolidayVisiting friends and relativesBusinessOther
57%26%
16%2%
Manchester
HolidayVisiting friends and relativesBusinessOther
36%50%
13%2%
Luton
Passengers
ATM
Freight
64%
22%
28%
13%
16%
5%
8%
10%
9%
7%
9%
5%
5%
18%
45%
32%
Heathrow Gatwick Manchester Stansted Luton Other
100
150
200
250
300
1991 1996 2001 2006 2011 2016
Terminal passengers Freight handled Air transport movementsIndex: 1991=100

Further information and detailed statistical tables: Aviation statistics
Nikesh Lad07747 627141
Further data are available on passenger characteristics, including:
► International passenger movements at UK airports: TSGB0205 ► Type of passenger at selected UK airports: TSGB0206 ► Mode of transport to selected UK airports: TSGB0207 ► Purpose of travel at selected UK airports: TSGB0208 ► International passenger movements at UK airports: TSGB0209
Over half of passengers at Stansted travelled to the airport by public transport in 2016.
This is compared with 44% using public transport at Gatwick, 39% at Heathrow, 31% at Luton and 17% at Manchester.
International passenger movements TSGB0205 International passenger movements at UK airports: 2016
Mode of travel TSGB0207 Mode of travel to UK airports: 2016
56%
51%
38%
41%
28%
26%
17%
11%
15%
32%
15%
16%
28%
37%
9%
16%
23%
6%
11% 19%
Manchester
Luton
Stansted
Gatwick
HeathrowRailCar Taxi/minicab Bus/Coach Tram/Tube
In 2016, three-quarters (75%) of international passenger movements at UK airports were to/from European coun-tries.
Spain was the most popular country origin/destination for passengers at UK airports, accounting for 18% of interna-tional movements, followed by USA (9%) and then Ger-many, Italy and Ireland, each at approximately 6%.
Przemyslaw Majkut020 7944 4493
Aviation
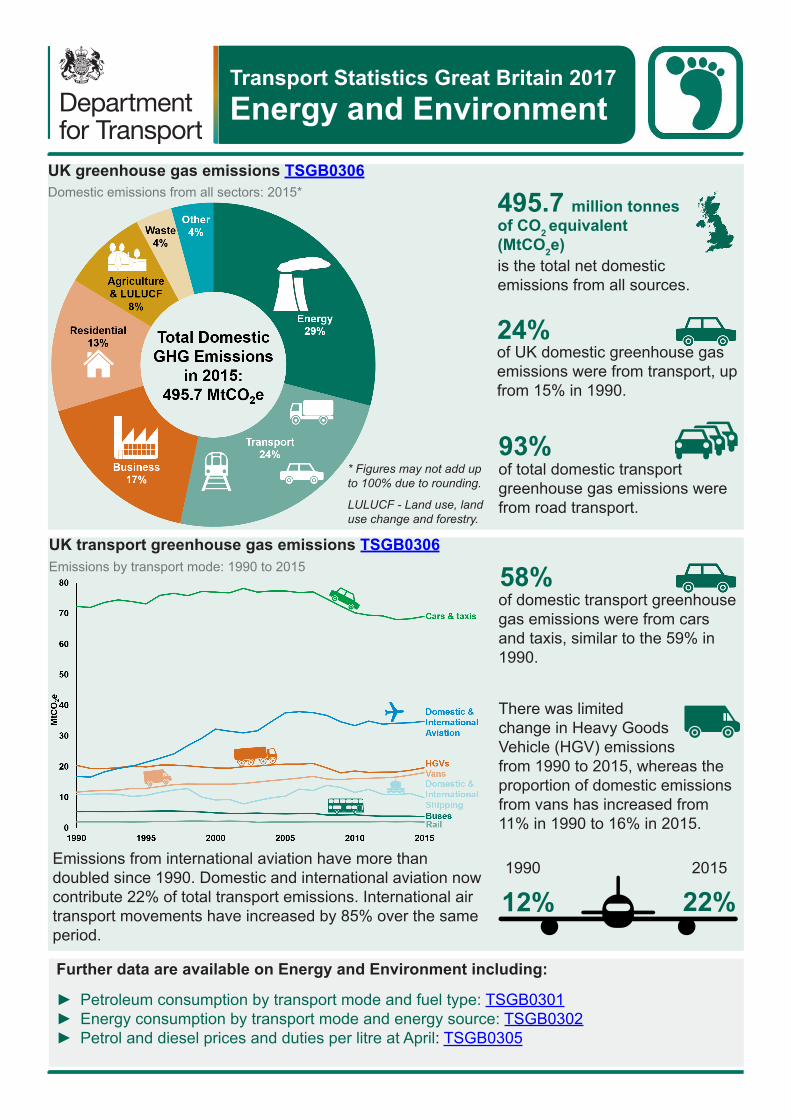
UK greenhouse gas emissions TSGB0306Domestic emissions from all sectors: 2015*
Further data are available on Energy and Environment including:
► Petroleum consumption by transport mode and fuel type: TSGB0301 ► Energy consumption by transport mode and energy source: TSGB0302 ► Petrol and diesel prices and duties per litre at April: TSGB0305
UK transport greenhouse gas emissions TSGB0306
24% of UK domestic greenhouse gas emissions were from transport, up from 15% in 1990.
is the total net domestic emissions from all sources.
495.7 million tonnesof CO2 equivalent (MtCO2e)
93%of total domestic transport greenhouse gas emissions were from road transport.
Emissions from international aviation have more than doubled since 1990. Domestic and international aviation now contribute 22% of total transport emissions. International air transport movements have increased by 85% over the same period.
There was limited change in Heavy Goods Vehicle (HGV) emissions from 1990 to 2015, whereas the proportion of domestic emissions from vans has increased from 11% in 1990 to 16% in 2015.
22%2015
12%1990
Emissions by transport mode: 1990 to 2015
Transport Statistics Great Britain 2017 Energy and Environment
of domestic transport greenhouse gas emissions were from cars and taxis, similar to the 59% in 1990.
58%
LULUCF - Land use, land use change and forestry.
* Figures may not add upto 100% due to rounding.
Energy and Environment
Further information and detailed statistical tables: Energy and Environment statisticsEdisa Livingstone
020 7944 [email protected]
Mohan Dell 020 7944 6068
Further data are available on biofuels including:
► Volume of fuels by fuel type: TSGB0311
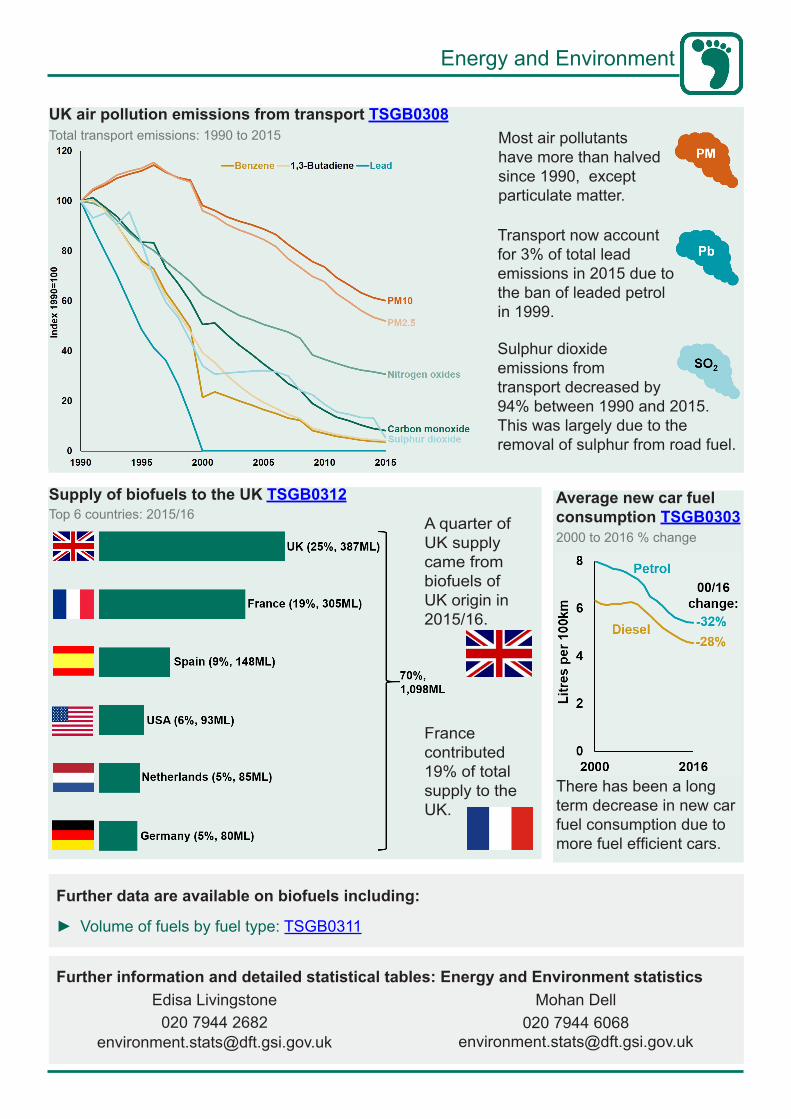
UK air pollution emissions from transport TSGB0308
Supply of biofuels to the UK TSGB0312
A quarter of UK supply came from biofuels of UK origin in 2015/16.
France contributed 19% of total supply to the UK.
Average new car fuel consumption TSGB03032000 to 2016 % change
There has been a long term decrease in new car fuel consumption due to more fuel efficient cars.
Total transport emissions: 1990 to 2015
Top 6 countries: 2015/16
Most air pollutants have more than halved since 1990, except particulate matter.
Transport now account for 3% of total lead emissions in 2015 due to the ban of leaded petrol in 1999.
Sulphur dioxide emissions from transport decreased by 94% between 1990 and 2015. This was largely due to the removal of sulphur from road fuel.
Transport Statistics Great Britain 2017 Freight
Further data are available on Freight, including: ► Domestic freight between modes: TSGB0401-0403 ► Domestic road freight activity: TSGB0404-0407 and TSGB0429-0433 ► International road freight activity: TSGB0411-0421 ► Road goods vehicles travelling to mainland Europe: TSGB0434-0435 ► Rail freight activity: TSGB0422-0424
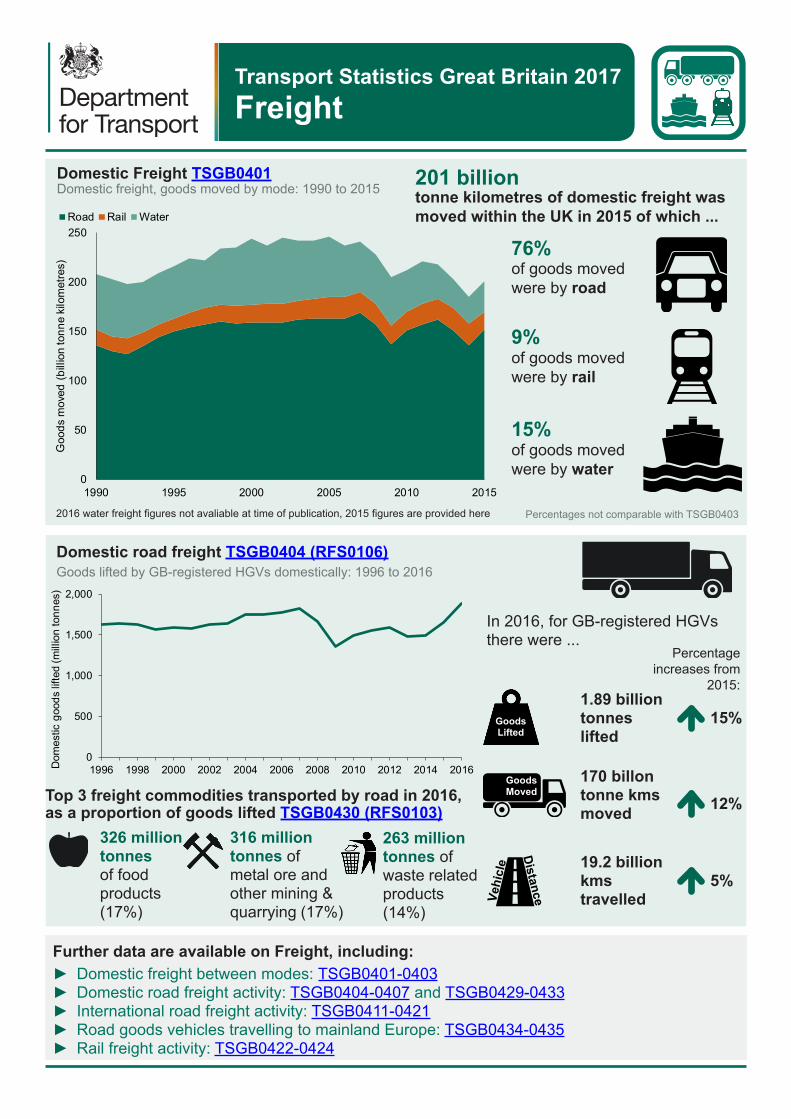
Top 3 freight commodities transported by road in 2016, as a proportion of goods lifted TSGB0430 (RFS0103)
326 million tonnes of food products (17%)
Domestic road freight TSGB0404 (RFS0106)Goods lifted by GB-registered HGVs domestically: 1996 to 2016
316 million tonnes of metal ore and other mining & quarrying (17%)
263 million tonnes of waste related products (14%)
GoodsLifted
1.89 billion tonnes lifted
In 2016, for GB-registered HGVs there were ...
Goods Moved
19.2 billion kms travelled
170 billon tonne kms moved
Percentage increases from
2015:
15%
12%
5%
Domestic Freight TSGB0401Domestic freight, goods moved by mode: 1990 to 2015
9%
15%
76%of goods moved were by road
tonne kilometres of domestic freight was moved within the UK in 2015 of which ...
201 billion
of goods moved were by water
of goods moved were by rail
Percentages not comparable with TSGB04032016 water freight figures not avaliable at time of publication, 2015 figures are provided here
0
50
100
150
200
250
1990 1995 2000 2005 2010 2015
Goo
ds m
oved
(bi
llion
tonn
e ki
lom
etre
s)
Road Rail Water
0
500
1,000
1,500
2,000
1996 1998 2000 2002 2004 2006 2008 2010 2012 2014 2016Dom
estic
goo
ds li
fted
(mill
ion
tonn
es)
Road goods vehicles TSGB0434 (RORO0101)
Further information and detailed statistical tables: Freight statistics
Road freightPaul McEvoy
020 7944 [email protected]
Water freightMatthew Tranter020 7944 4847
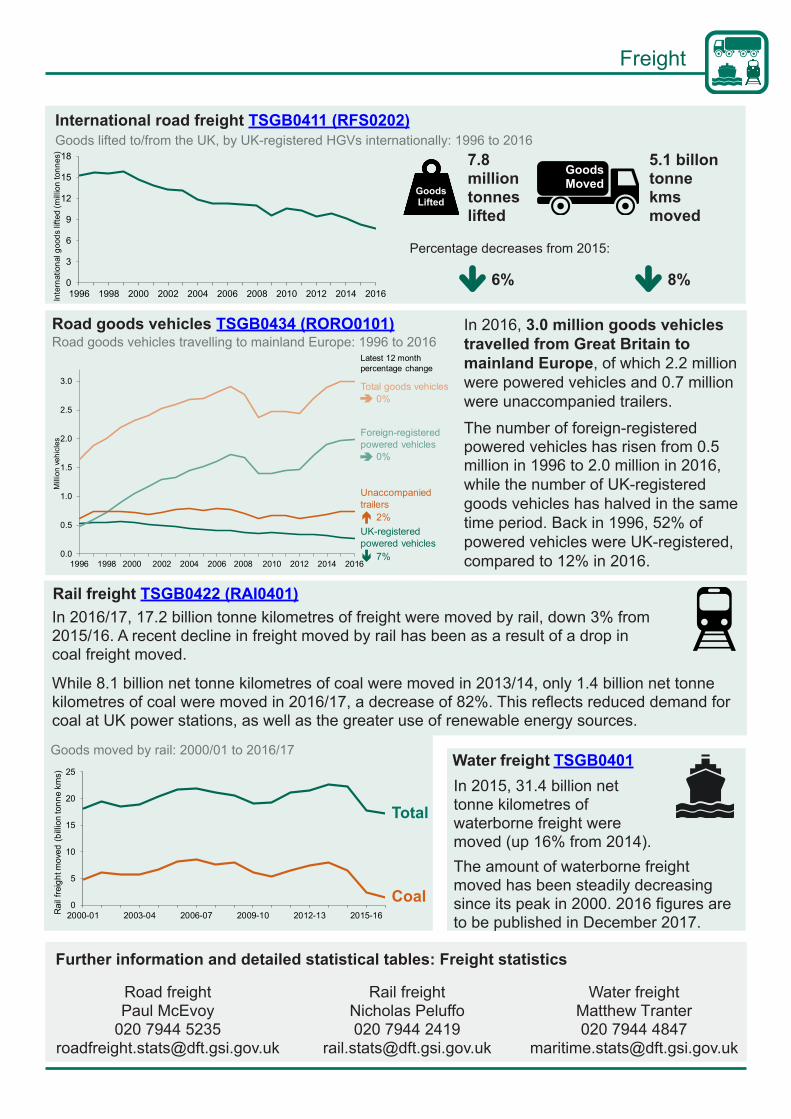
Road goods vehicles travelling to mainland Europe: 1996 to 2016
Rail freightNicholas Peluffo020 7944 2419
In 2016, 3.0 million goods vehicles travelled from Great Britain to mainland Europe, of which 2.2 million were powered vehicles and 0.7 million were unaccompanied trailers.
The number of foreign-registered powered vehicles has risen from 0.5 million in 1996 to 2.0 million in 2016, while the number of UK-registered goods vehicles has halved in the same time period. Back in 1996, 52% of powered vehicles were UK-registered, compared to 12% in 2016.
Rail freight TSGB0422 (RAI0401)
Goods moved by rail: 2000/01 to 2016/17
In 2016/17, 17.2 billion tonne kilometres of freight were moved by rail, down 3% from 2015/16. A recent decline in freight moved by rail has been as a result of a drop in coal freight moved.
While 8.1 billion net tonne kilometres of coal were moved in 2013/14, only 1.4 billion net tonne kilometres of coal were moved in 2016/17, a decrease of 82%. This reflects reduced demand for coal at UK power stations, as well as the greater use of renewable energy sources.
Water freight TSGB0401In 2015, 31.4 billion net tonne kilometres of waterborne freight were moved (up 16% from 2014).The amount of waterborne freight moved has been steadily decreasing since its peak in 2000. 2016 figures are to be published in December 2017.
International road freight TSGB0411 (RFS0202)Goods lifted to/from the UK, by UK-registered HGVs internationally: 1996 to 2016
GoodsLifted
7.8 million tonnes lifted
Goods Moved
5.1 billon tonne kms moved
Percentage decreases from 2015:
6% 8%
Coal
0
3
6
9
12
15
18
1996 1998 2000 2002 2004 2006 2008 2010 2012 2014 2016Inte
rnat
iona
l goo
ds li
fted
(mill
ion
tonn
es)
0
5
10
15
20
25
2000-01 2003-04 2006-07 2009-10 2012-13 2015-16Rai
l fre
ight
mov
ed (
billi
on to
nne
kms)
Total
Total goods vehicles
Foreign-registered powered vehicles
Unaccompanied trailers
UK-registered powered vehicles
7%
0%
2%
0%
Latest 12 month percentage change
0.0
0.5
1.0
1.5
2.0
2.5
3.0
1996 1998 2000 2002 2004 2006 2008 2010 2012 2014 2016
Mill
ion
vehi
cles
Freight
Transport Statistics Great Britain 2017 Maritime
Further data are available on Maritime and Shipping, including: ► Port freight: TSGB0501-TSGB0510► UK Shipping fleet: TSGB0513-TSGB0515
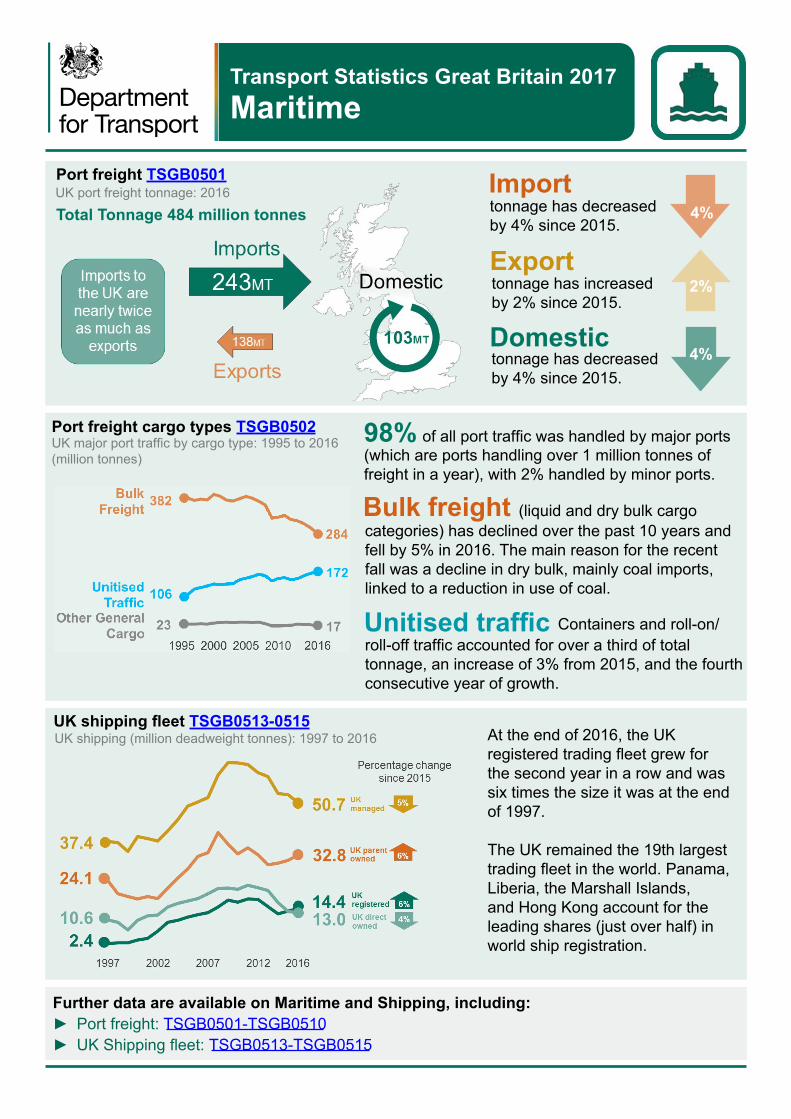
UK major port traffic by cargo type: 1995 to 2016 (million tonnes)
Port freight cargo types TSGB0502 of all port traffic was handled by major ports
Importtonnage has decreased by 4% since 2015.
Exporttonnage has increased by 2% since 2015.
4%
2%
Domestictonnage has decreased by 4% since 2015.
4%
categories) has declined over the past 10 years and fell by 5% in 2016. The main reason for the recent fall was a decline in dry bulk, mainly coal imports, linked to a reduction in use of coal.
roll-off traffic accounted for over a third of total tonnage, an increase of 3% from 2015, and the fourth consecutive year of growth.
98%
Bulk freight
Unitised traffic
UK shipping fleet TSGB0513-0515UK shipping (million deadweight tonnes): 1997 to 2016 At the end of 2016, the UK
registered trading fleet grew for the second year in a row and was six times the size it was at the end of 1997.
The UK remained the 19th largest trading fleet in the world. Panama, Liberia, the Marshall Islands, and Hong Kong account for the leading shares (just over half) in world ship registration.
(which are ports handling over 1 million tonnes of freight in a year), with 2% handled by minor ports.
(liquid and dry bulk cargo
Containers and roll-on/
Port freight TSGB0501UK port freight tonnage: 2016
Total Tonnage 484 million tonnes

Further information and detailed statistical tables: Maritime statisticsAndrew Kelly
020 7944 [email protected]
Sea passengers TSGB0511UK international short sea passenger journeys: 2016 compared to 2006, millions
In 2016, there were 20.0 million international short sea passenger journeys to and from the UK.
Journeys to and from France accounted for 73% of these.
The port of Dover handled 60% of all international short sea passengers.
In 2016, there were 42.2 million passengers travelling on domestic routes, Cairnryan - Belfast remained the most popular route with 1.2 million passengers.
Cruise passengers TSGB0512UK cruise passengers
Further data are available on Maritime and Shipping, including: ► Sea Passengers: TSGB0501-TSGB0510 ► Seafarers: TSGB0513-TSGB0515 ► Accompanied Passenger Vehicles: TSGB0506-TSGB0507
There were nearly 9 times more UK cruise passengers in 2016 than 20 years ago.
In 2016, 85% of all UK cruise passengers began or ended their cruise at Southampton.
In 2016, there were 23,060 UK seafarers active at sea - a decrease of 1% compared to 2015 (23,380).
There were 1,860 officer trainees active at sea in 2016 - a 68% increase compared to 2006, when 1,110 were active at sea.
5.8 millioncars were handled at UK ports in 2016 - 52% travelled to or from France.
Passenger Vehicles TSGB0507Accompanied pass. vehicles: UK 2016
Civilian search and rescue helicopters TSGB0518There were 2,594 civilian search and rescue helicopter taskings in the UK during the year-to-end March 2017.
Seafarers TSGB0519UK seafarers active at sea (Thousands): 2002 to 2016
1,985 thousand
226 thousand1996
2016
Maritime

Passenger journeys on public transport Passenger journeys by mode, Great Britain: 1985/86 to 2016/17
Transport Statistics Great Britain 2017 Public Transport
► National Rail: TSGB0601-TSGB0608 ► Underground: TSGB0609-TSGB0610 ► Light Rail & Trams: TSGB0611-TSGB0617 ► Local Bus Services: TSGB0618-TSGB0624 ► Taxis: TSGB0628
Further data are available for each of the public transport modes, including:
0
1
2
3
4
5
1986/87 1991/92 1996/97 2001/02 2006/07 2011/12 2016/17
Buses (London)
Buses (GB outside London)
National Rail
Underground (London and Glasgow)
Light Rail and Tram
Bill
ion
local bus passenger journeys in Great Britain in 2016/17, 59% of all public transport journeys
4,941 million
passenger journeys on light rail and tram systems in Great Britain, a record level since comparable records began
273 million
National Rail passenger journeys in Great Britain, an increase of 152% since 1985/86
1,731 million
Share of passenger journeys by public transport mode: 2016/17
59% 21% 17%
3%
Buses National Rail Underground (London and Glasgow)
Light Rail and Tram
Whilst buses accounted for the highest proportion of passenger journeys in 2016/17, National Rail saw the largest share of passenger kilometres. This is due largely to rail journeys being over longer distances on average.
Passenger kilometres on public transport Passenger kilometres by mode, Great Britain: 1985/86 to 2016/17
0
10
20
30
40
50
60
70
1986/87 1991/92 1996/97 2001/02 2006/07 2011/12 2016/17
Buses
National Rail
Underground (London and Glasgow)
Light Rail and Tram
Billio
n
Note: Some statistics in this chapter have not been updated. Specifically, publication of annual bus and concessionary travel statistics has been delayed until December 2017. However, provisional quarterly estimates for bus journeys in 2016/17 are included in this chapter.

AM peak(07:00-09:59)
Both peaks
PM peak (16:00-18:59)
2007 2010 2013 20160%
2%
4%
6%
Buses, Light Rail & TaxisDavid Mais
020 7944 [email protected]
Local bus concessionary travel TSGB0627 England: 2015/16
Passenger journeys (million), England: 2016/17Light rail passenger journeys TSGB0611Taxis and Private Hire Vehicles TSGB0628
Taxis and PHVs by area (thousand), England: 2017
Revenue and government support: 2004/05 to 2016/17 TSGB0622 TSGB0623 TSGB0602 TSGB0625
For rail, passenger revenue has increased in real terms year-on-year in line with increased passenger journeys. Net government support is at its lowest level since 2004/05, largely due to an increase in receipts from Train Operating Companies.
Further data are available for each of the Public Transport modes, including:
9.9 million older and disabled concessionary travel passes held
970 million older and disabled concessionary bus journeys
98 concessionary bus journeys per pass
Passengers in excess of capacity (PiXC)1
TSGB0632 London & SE operators only
1 PiXC is the percentage of passengers in excess of capacity on a typical autumn weekday.
Nottingham Express TransitLondon TramlinkMidland MetroSheffield SupertramManchester Metrolink
Docklands LightRailway
Tyne and Wear MetroBlackpool Tramway
1986/87 1991/92 1996/97 2001/02 2006/07 2011/12 2016/170
40
80
120
160
200
240
280
2005 2007 2009 2011 2013 2015 20170
50
100
150
200
250
300
PHVs (England outside London)
PHVs (London)
Taxis (England outside London)
Taxis (London)
RailNicholas Peluffo020 7944 2419
0
2
4
6
8
10
04/05 06/07 08/09 10/11 12/13 14/15 16/170
2
4
6
8
10
04/05 07/08 09/10 11/12 13/14 15/16
Passenger fare receipts
Net government support (Latest figures are for 14/15. New figures expected Dec 17)
Passenger revenue
Net government support
Buses in England National Rail in Great Britain
£ Bi
llion
£ Bi
llion
There were 281,000 licensed taxis and private hire vehicles in England in 2017, up 16% on 2015.
In 2016/17, 268 million passengers journeys were made on the eight light rail and tram systems in England, a 6.2% increase on the previous year.
In Autumn 2016 there was slightly less crowding overall on trains into London in the morning peak than the previous year, but more crowding overall in the afternoon peak.
Public Transport
Transport Statistics Great Britain 2017 Roads and Traffic
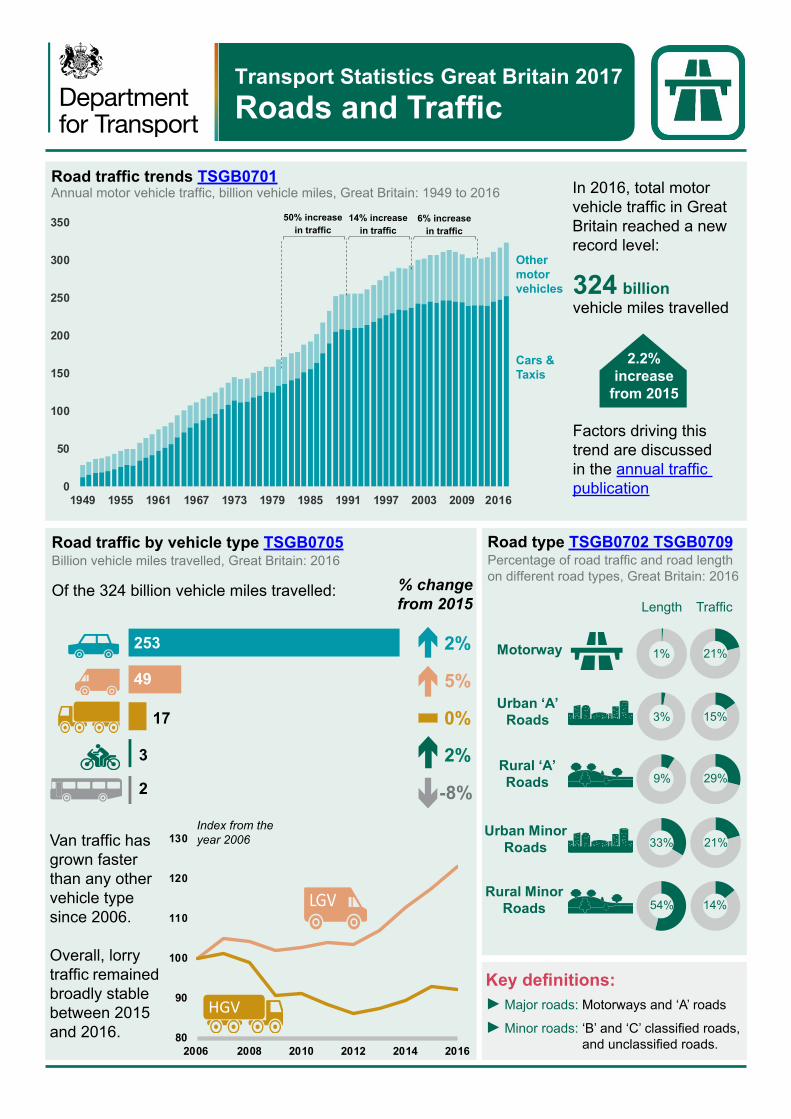
Key definitions: ► Major roads: Motorways and ‘A’ roads
► Minor roads: ‘B’ and ‘C’ classified roads, and unclassified roads.
Road traffic by vehicle type TSGB0705 Billion vehicle miles travelled, Great Britain: 2016
Van traffic has grown faster than any other vehicle type since 2006.
Overall, lorry traffic remained broadly stable between 2015 and 2016.
Road type TSGB0702 TSGB0709 Percentage of road traffic and road length on different road types, Great Britain: 2016
TrafficLengthOf the 324 billion vehicle miles travelled:
Motorway
Urban ‘A’ Roads
Rural ‘A’ Roads
Urban Minor Roads
Rural Minor Roads
Index from the year 2006
LGV
HGV
80
90
100
110
120
130
2006 2008 2010 2012 2014 2016
324 billionvehicle miles travelled
In 2016, total motor vehicle traffic in Great Britain reached a new record level:
0
50
100
150
200
250
300
350
1949 1955 1961 1967 1973 1979 1985 1991 1997 2003 2009 20152016
Road traffic trends TSGB0701Annual motor vehicle traffic, billion vehicle miles, Great Britain: 1949 to 2016
Cars & Taxis
Other motorvehicles
2.2%increase
from 2015
50% increase in traffic
14% increasein traffic
6% increase in traffic
1% 21%
3% 15%
9% 29%
33% 21%
54% 14%
% change from 2015
253
49
17
3
2
2%
5%
0%
2%
-8%
Factors driving this trend are discussed in the annual traffic publication

Further information and detailed statistical tables: Roads and Traffic statisticsRoad traffic and speed
compliance020 7944 3095
Road congestion and travel times020 7944 5850
Road length, condition and expenditure020 7944 5032
[email protected] [email protected]
Further data are available on roads and traffic, including:
► Road traffic and lengths: TSGB0701-13 ► Road speeds: TSGB0714-15 ► Road congestion: TSGB0721 ► Road construction and expenditure TSGB0717-0720
Road length TSGB0709
Motorways and ‘A’ roads accounted for 13% of total road length, but carried 65% of total road traffic.
Vehicle speed compliance TSGB0714 TSGB0715Free flowing vehicles exceeding the speed limit on roads, Great Britain: 2016
Since 2011, the percentage of vehicles exceeding the speed limit for each type of vehicle has generally declined.
246,500 miles of roadin Great Britain in 2016
Congestion on local ‘A’ roads TSGB0716b
The average delay on local ‘A’ roads in England in 2016 was:
45.9 seconds pervehicle per mile
Average delay compared to free flow (seconds per vehicle per mile)
2016road
length
‘C’ Roads & Unclassified Roads
Motorways
‘B’ Roads
‘A’ Roads
Road Type Vans Articulated HGVs
Rigid HGVs Cars
Motorways 47% 1% - 46%
National Speed Limit Single Carriageways
- 24% 28% 8%
30 mph Roads 56% 43% 51% 53%20 mph Roads 80% 71% 73% 81%
2.8% increase
from 2015
Congestion on the Strategic Road Network* (SRN) TSGB0716aAverage delay compared to free flow (seconds per vehicle per mile)
The average delay on the SRN in England in 2016 was:
9.0 seconds pervehicle per mile
0.3% increase from 2015
30
35
40
45
50
55
Mar2014
Jun2014
Sep2014
Dec2014
Mar2015
Jun2015
Sep2015
Dec2015
Mar2016
Jun2016
Sep2016
Dec2016
Month
Year ending
04
6
8
10
12
Mar2015
Jun2015
Sep2015
Dec2015
Mar2016
Jun2016
Sep2016
Dec2016
Month
Year ending
Start of series: April 2015
0
*The Strategic Road Network (SRN) is made up of the motorways andmajor trunk roads in England that are managed by Highways England
Roads and Traffic
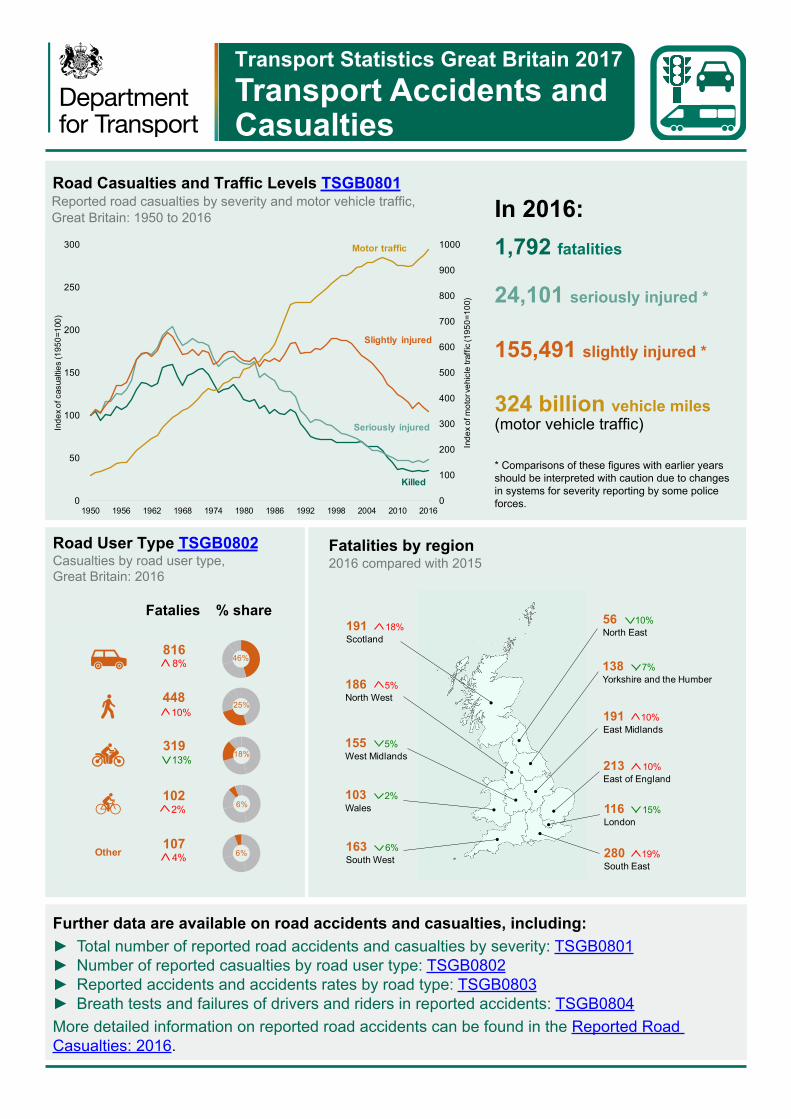
Road Casualties and Traffic Levels TSGB0801 Reported road casualties by severity and motor vehicle traffic, Great Britain: 1950 to 2016
Transport Statistics Great Britain 2017 Transport Accidents and Casualties
Further data are available on road accidents and casualties, including: ► Total number of reported road accidents and casualties by severity: TSGB0801 ► Number of reported casualties by road user type: TSGB0802 ► Reported accidents and accidents rates by road type: TSGB0803 ► Breath tests and failures of drivers and riders in reported accidents: TSGB0804
More detailed information on reported road accidents can be found in the Reported Road Casualties: 2016.
2016 compared with 2015Fatalities by regionRoad User Type TSGB0802
Casualties by road user type, Great Britain: 2016
1,792 fatalities
24,101 seriously injured *
155,491 slightly injured *
324 billion vehicle miles(motor vehicle traffic)
Fatalies
0
100
200
300
400
500
600
700
800
900
1000
0
50
100
150
200
250
300
1950 1956 1962 1968 1974 1980 1986 1992 1998 2004 2010 2016
Inde
x of
mot
or ve
hicl
e tra
ffic
(195
0=10
0)
Inde
x of
cas
ualti
es (1
950=
100)
Killed
Seriously injured
Slightly injured
Motor traffic
% share
46%
25%
18%
6%
Other 6%
44810%
8168%
31913%
1022%
1074%
In 2016:
56 10%North East
280 19%South East
191 18%Scotland
138 7%Yorkshire and the Humber
191 10%East Midlands
213 10%East of England
116 15%London
186 5%North West
155 5%West Midlands
103 2%Wales
163 6%South West
* Comparisons of these figures with earlier yearsshould be interpreted with caution due to changes in systems for severity reporting by some police forces.
Further information and detailed statistical tables: Accidents and Casualties statisticsRoad accidents and casualties
Amardeep Dhani020 7944 6595
Rail accidents and safety Nicholas Peluffo020 7944 2419
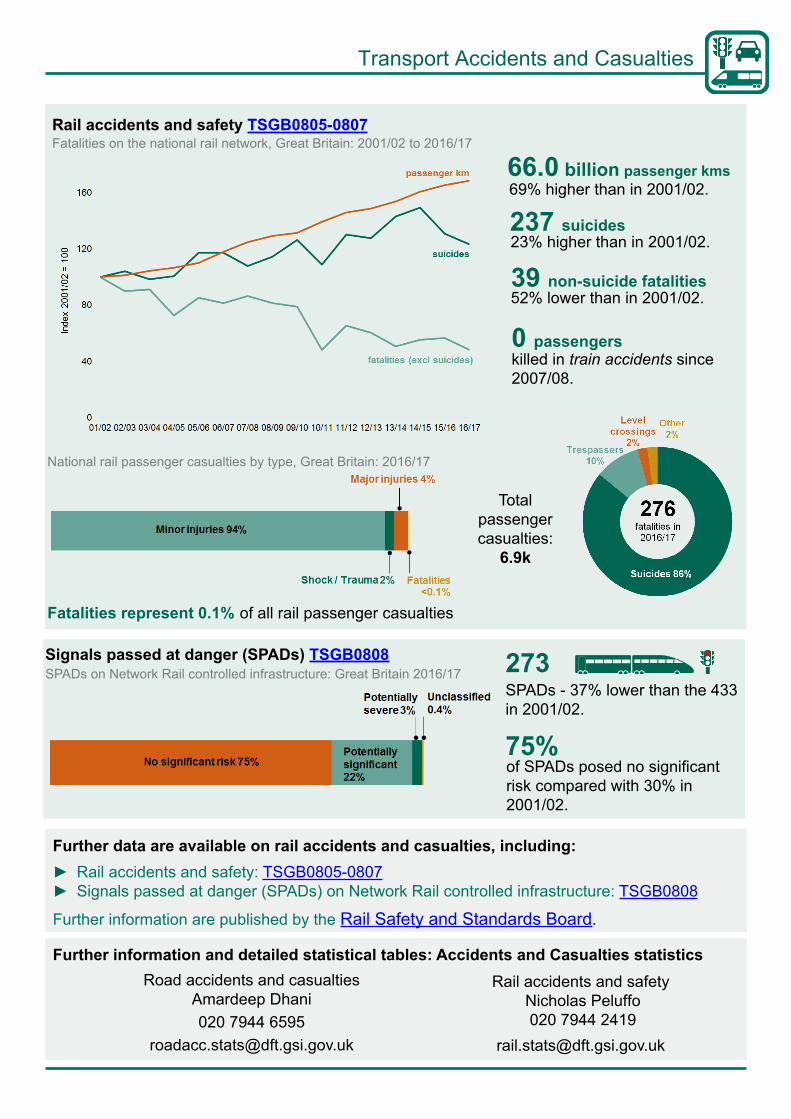
Further data are available on rail accidents and casualties, including: ► Rail accidents and safety: TSGB0805-0807 ► Signals passed at danger (SPADs) on Network Rail controlled infrastructure: TSGB0808
Further information are published by the Rail Safety and Standards Board.
Rail accidents and safety TSGB0805-0807Fatalities on the national rail network, Great Britain: 2001/02 to 2016/17
66.0 billion passenger kms69% higher than in 2001/02.
237 suicides23% higher than in 2001/02.
52% lower than in 2001/02.39 non-suicide fatalities
Signals passed at danger (SPADs) TSGB0808
SPADs - 37% lower than the 433 in 2001/02.
273SPADs on Network Rail controlled infrastructure: Great Britain 2016/17
0 passengerskilled in train accidents since 2007/08.
Fatalities represent 0.1% of all rail passenger casualties
National rail passenger casualties by type, Great Britain: 2016/17
Total passenger casualties:
6.9k
of SPADs posed no significant risk compared with 30% in 2001/02.
75%
Transport Accidents and Casualties
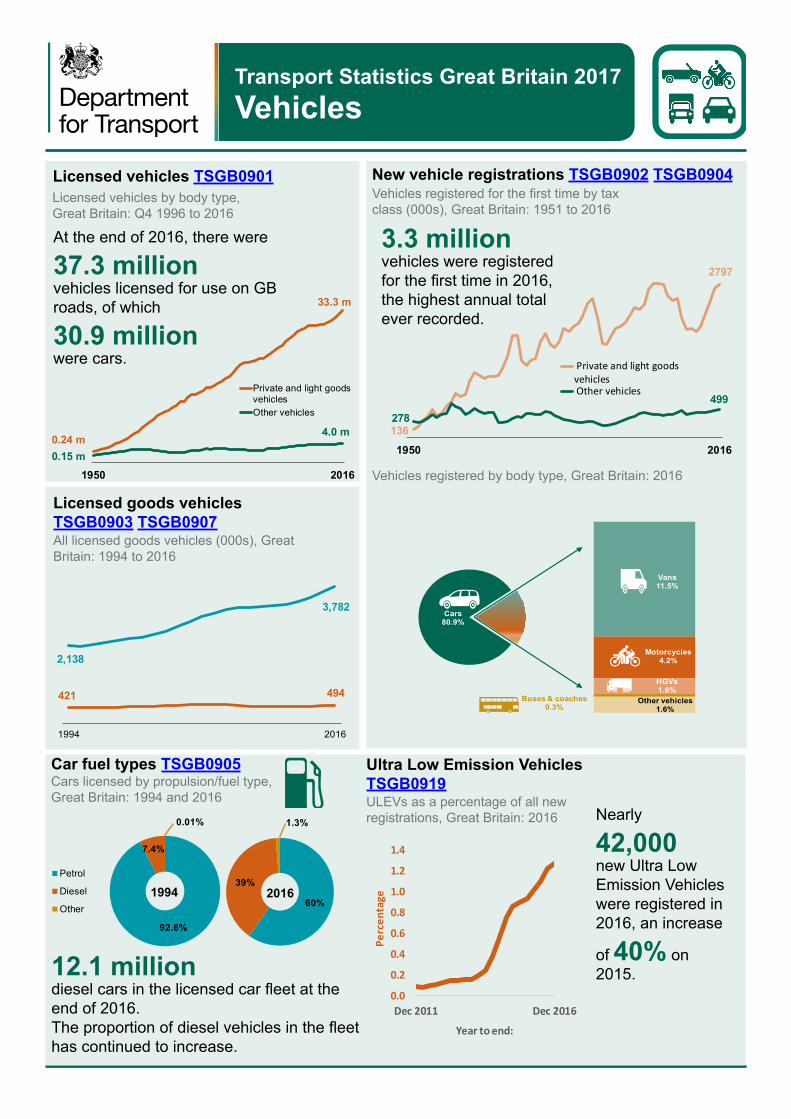
Licensed vehicles TSGB0901
Transport Statistics Great Britain 2017 Vehicles
1950 2016
Private and light goodsvehiclesOther vehicles
0.24 m0.15 m
4.0 m
33.3 m
All licensed goods vehicles (000s), Great Britain: 1994 to 2016
Licensed goods vehicles TSGB0903 TSGB0907
Vehicles registered for the first time by tax class (000s), Great Britain: 1951 to 2016
2,138
3,782
421 494
1994 2016
New vehicle registrations TSGB0902 TSGB0904Licensed vehicles by body type,Great Britain: Q4 1996 to 2016
Cars80.9%
Vans11.5%
Motorcycles4.2%
HGVs1.6%
Buses & coaches0.3%
Other vehicles1.6%
Under31 t
81.3%
31 to 41 t18.5%
Over 41 t0.2%
136
2797
278499
1950 2016
Private and light goodsvehicles Other vehicles
At the end of 2016, there were
37.3 millionvehicles licensed for use on GB roads, of which
30.9 millionwere cars.
Car fuel types TSGB0905
92.6%
7.4%
0.01%
Petrol
Diesel
Other 60%
39%
1.3%
1994 2016
Cars licensed by propulsion/fuel type, Great Britain: 1994 and 2016
3.3 millionvehicles were registered for the first time in 2016, the highest annual total ever recorded.
Ultra Low Emission Vehicles TSGB0919ULEVs as a percentage of all new registrations, Great Britain: 2016
0.0
0.2
0.4
0.6
0.8
1.0
1.2
1.4
Dec 2011 Dec 2016
Perc
enta
ge
Year to end:
12.1 milliondiesel cars in the licensed car fleet at the end of 2016.The proportion of diesel vehicles in the fleet has continued to increase.
Nearly
42,000 new Ultra Low Emission Vehicles were registered in 2016, an increase
of 40% on2015.
Vehicles registered by body type, Great Britain: 2016
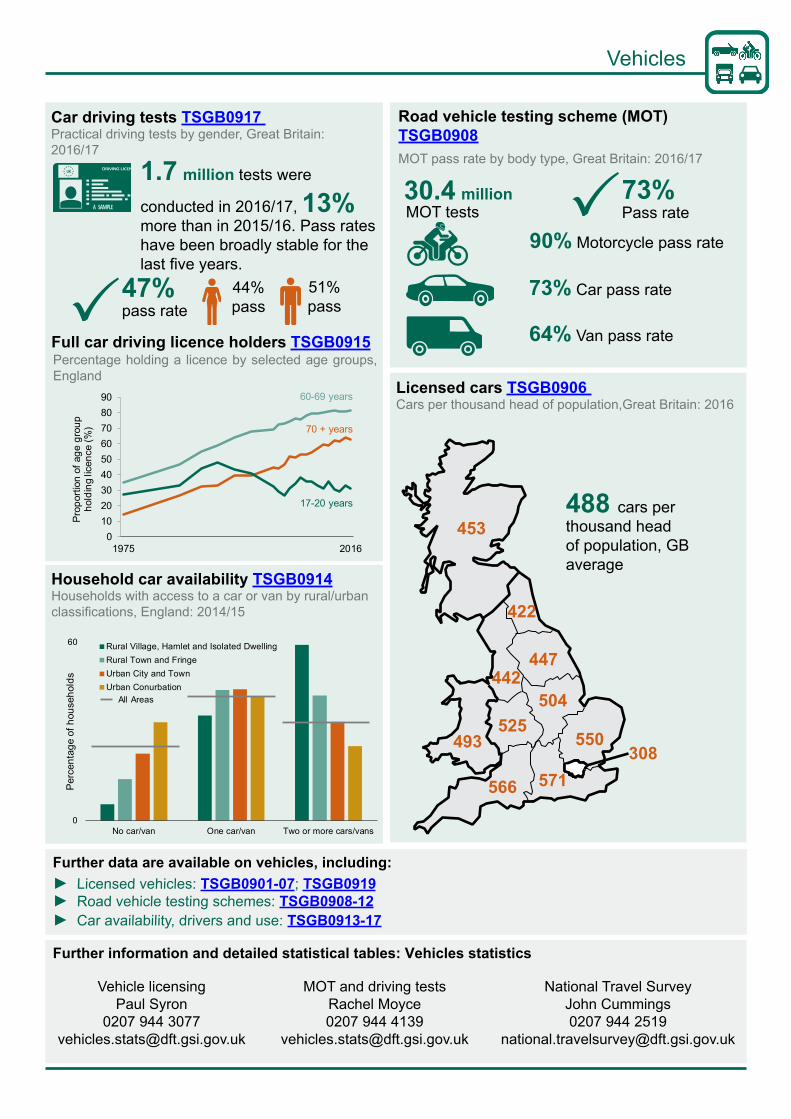
Road vehicle testing scheme (MOT) TSGB0908MOT pass rate by body type, Great Britain: 2016/17
30.4 millionMOT tests
73%Pass rate
90% Motorcycle pass rate
64% Van pass rate
73% Car pass rate
Further data are available on vehicles, including: ► Licensed vehicles: TSGB0901-07; TSGB0919 ► Road vehicle testing schemes: TSGB0908-12 ► Car availability, drivers and use: TSGB0913-17
Household car availability TSGB0914
Households with access to a car or van by rural/urban classifications, England: 2014/15
Full car driving licence holders TSGB0915
Car driving tests TSGB0917 Practical driving tests by gender, Great Britain: 2016/17
1.7 million tests were
conducted in 2016/17, 13%more than in 2015/16. Pass rates have been broadly stable for the last five years.
44% pass
Percentage holding a licence by selected age groups, England
0
60
No car/van One car/van Two or more cars/vans
Per
cent
age
of h
ouse
hold
s
Rural Village, Hamlet and Isolated DwellingRural Town and FringeUrban City and TownUrban Conurbation
All Areas
47% pass rate
Further information and detailed statistical tables: Vehicles statistics
0102030405060708090
1975 2016
Pro
porti
on o
f age
gro
up
hold
ing
licen
ce (%
)
17-20 years
60-69 years
70 + years
Licensed cars TSGB0906 Cars per thousand head of population,Great Britain: 2016
51% pass
488 cars perthousand head of population, GB average
422
442
525493
447
453
566
504
571
550308
Vehicle licensingPaul Syron
0207 944 [email protected]
MOT and driving testsRachel Moyce0207 944 4139
National Travel SurveyJohn Cummings0207 944 2519
Vehicles
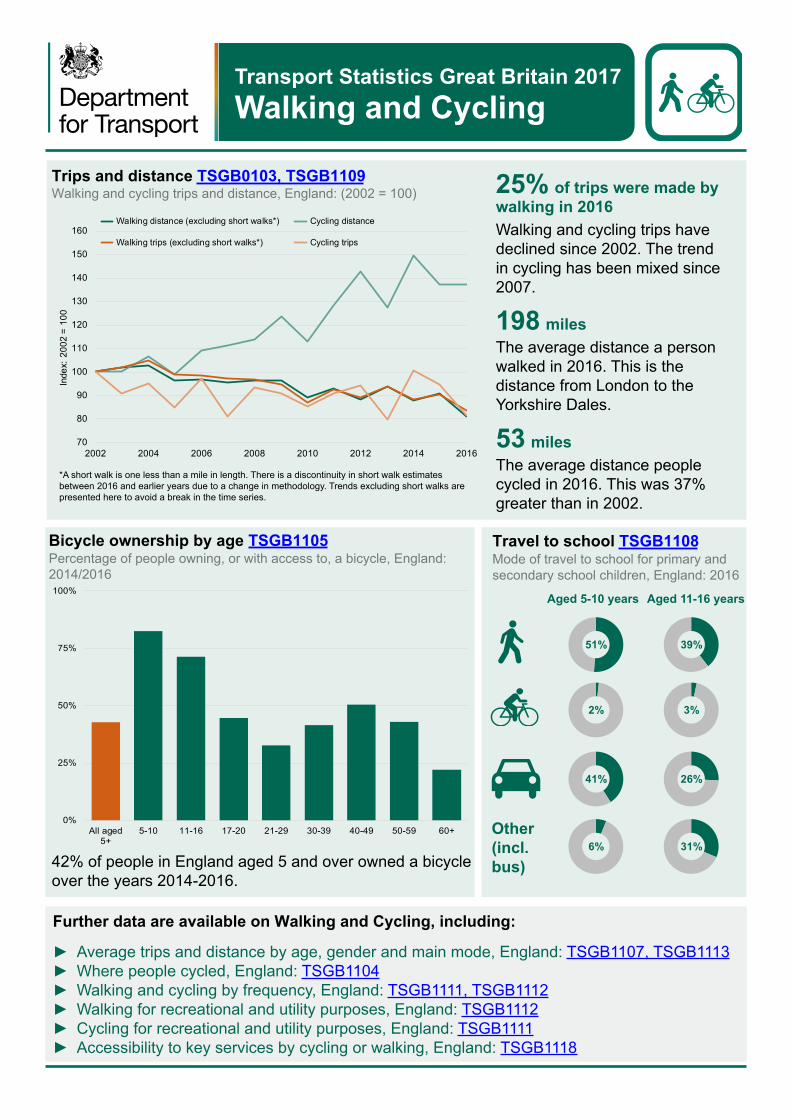
Trips and distance TSGB0103, TSGB1109 Walking and cycling trips and distance, England: (2002 = 100)
Transport Statistics Great Britain 2017 Walking and Cycling
Further data are available on Walking and Cycling, including:
► Average trips and distance by age, gender and main mode, England: TSGB1107, TSGB1113 ► Where people cycled, England: TSGB1104 ► Walking and cycling by frequency, England: TSGB1111, TSGB1112 ► Walking for recreational and utility purposes, England: TSGB1112 ► Cycling for recreational and utility purposes, England: TSGB1111 ► Accessibility to key services by cycling or walking, England: TSGB1118
Bicycle ownership by age TSGB1105Percentage of people owning, or with access to, a bicycle, England: 2014/2016
Travel to school TSGB1108 Mode of travel to school for primary and secondary school children, England: 2016
42% of people in England aged 5 and over owned a bicycle over the years 2014-2016.
Aged 5-10 years Aged 11-16 years
Other(incl.bus)
70
80
90
100
110
120
130
140
150
160
2002 2004 2006 2008 2010 2012 2014 2016
Inde
x: 2
002
= 10
0
Walking distance (excluding short walks*) Cycling distance
Walking trips (excluding short walks*) Cycling trips
0%
25%
50%
75%
100%
All aged5+
5-10 11-16 17-20 21-29 30-39 40-49 50-59 60+
25% of trips were made bywalking in 2016Walking and cycling trips have declined since 2002. The trend in cycling has been mixed since 2007.
198 milesThe average distance a person walked in 2016. This is the distance from London to the Yorkshire Dales.
53 milesThe average distance people cycled in 2016. This was 37% greater than in 2002.
*A short walk is one less than a mile in length. There is a discontinuity in short walk estimates between 2016 and earlier years due to a change in methodology. Trends excluding short walks are presented here to avoid a break in the time series.
51% 39%
2% 3%
41% 26%
6% 31%
Further information and detailed statistical tables: Walking and Cycling statisticsLocal Transport Statistics
Thomas Parry020 7944 3094
Further data are available on pedestrian and pedal cyclist road accidents, including:
► Reported killed or seriously injured casualties, GB: TSGB1110 ► Vehicle accident numbers and rates by severity, GB: TSGB1119 ► Perception of roads being too dangerous to cycle on, GB: TSGB1120 ► International comparisons of road deaths, UK: TSGB1121
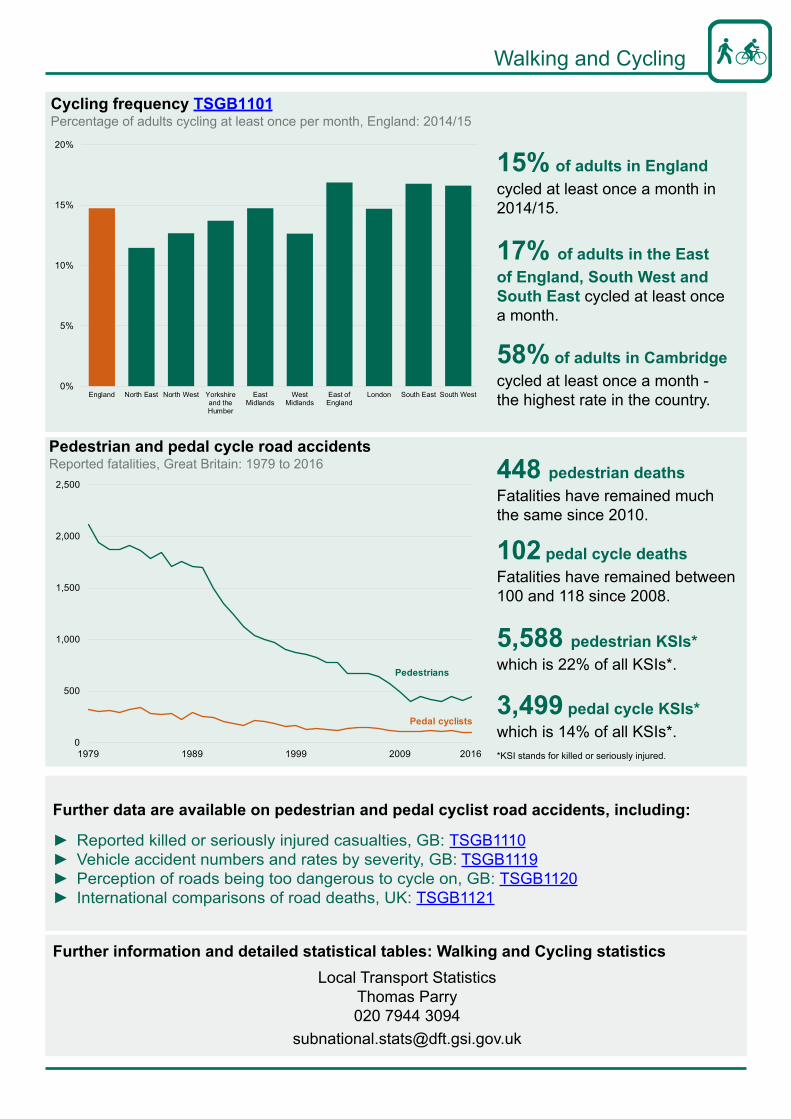
Cycling frequency TSGB1101Percentage of adults cycling at least once per month, England: 2014/15
Pedestrian and pedal cycle road accidents Reported fatalities, Great Britain: 1979 to 2016
5,588 pedestrian KSIs*which is 22% of all KSIs*.
448 pedestrian deathsFatalities have remained much the same since 2010.
15% of adults in Englandcycled at least once a month in 2014/15.
17% of adults in the Eastof England, South West and South East cycled at least once a month.
58% of adults in Cambridgecycled at least once a month - the highest rate in the country.
102 pedal cycle deathsFatalities have remained between 100 and 118 since 2008.
3,499 pedal cycle KSIs*which is 14% of all KSIs*.
0
500
1,000
1,500
2,000
2,500
1979 1989 1999 2009
Pedestrians
Pedal cyclists
2016
0%
5%
10%
15%
20%
England North East North West Yorkshireand theHumber
EastMidlands
WestMidlands
East ofEngland
London South East South West
*KSI stands for killed or seriously injured.
Walking and Cycling

Travel by people with mobility difficulties TSGB1201Trips per person per year by age and mobility status, England: 2015
Transport Statistics Great Britain 2017 Transport and Disability
0
200
400
600
800
1,000
All aged 16+ 16-49 50-59 60-69 70+
With a mobility difficulty Without a mobility difficulty
474 trips per person per yearwere taken by those aged 70+ with mobility difficulties - half the number of trips undertaken by those with no mobility disability
9% of adultsreported having a mobility difficulty* in England in 2015
by individuals aged 16+ with mobility difficulties compared to those with no mobility disability
38% fewer trips
With mobility difficulty
No mobility difficulty
Further data are available on Transport and Disability, including:
► Travel by people with mobility difficulties (National Travel Survey): TSGB1201-3 ► Disability accessible buses and taxis: TSGB1206 (buses) and TSGB1207 (taxis) ► List of rail vehicles built or refurbished to modern accessibility standards
Percentage of trips per person per year by mobility status and main mode, England: 2015
Travel by mobility status and main mode TSGB1202Trips per person per year by purpose, England: 2015
Travel by trip purpose TSGB1203
A similar proportion of people with and without mobility difficulties use a car for trips, however people with mobility difficulties make a higher proportion as a passenger
Leisure/other
Commuting
Shopping
Personal/other escort
Education/education escort*The National Travel Survey definition of mobility difficulty is based on adults who say they have difficultes travelling on foot, by bus or both
Public transport: accessibility to disabled people% fully accessible vehicles: England
58% Mar 2017 1
since 2005
TSGB1207
75% Jul 2017 5
since Jul 2016
94% Mar 2016 65
since 2005
TSGB1206
Percentage points
Percentage points
Percentage points
38% 30% 16% 9% 8%
51% 14% 20% 7% 8%
With a mobility difficulty
Without a mobility difficulty
Driver35%
32%
24%
6%
4%
22%
30%
17%
24%
7%
BANK
LIBRARY
Further information and detailed statistical tables: Transport and Disability statistics
National Travel SurveyJohn Cummings020 7944 3094
Local Transport StatisticsThomas Parry020 7944 3094
Further data are available on Transport and Disability, including:
► Disabled parking badges, England: TSGB1204 (number), TSGB1205 (per head) and TSGB1209 (by local authority)
► Disabled concessionary bus passes issued, England: TSGB1208
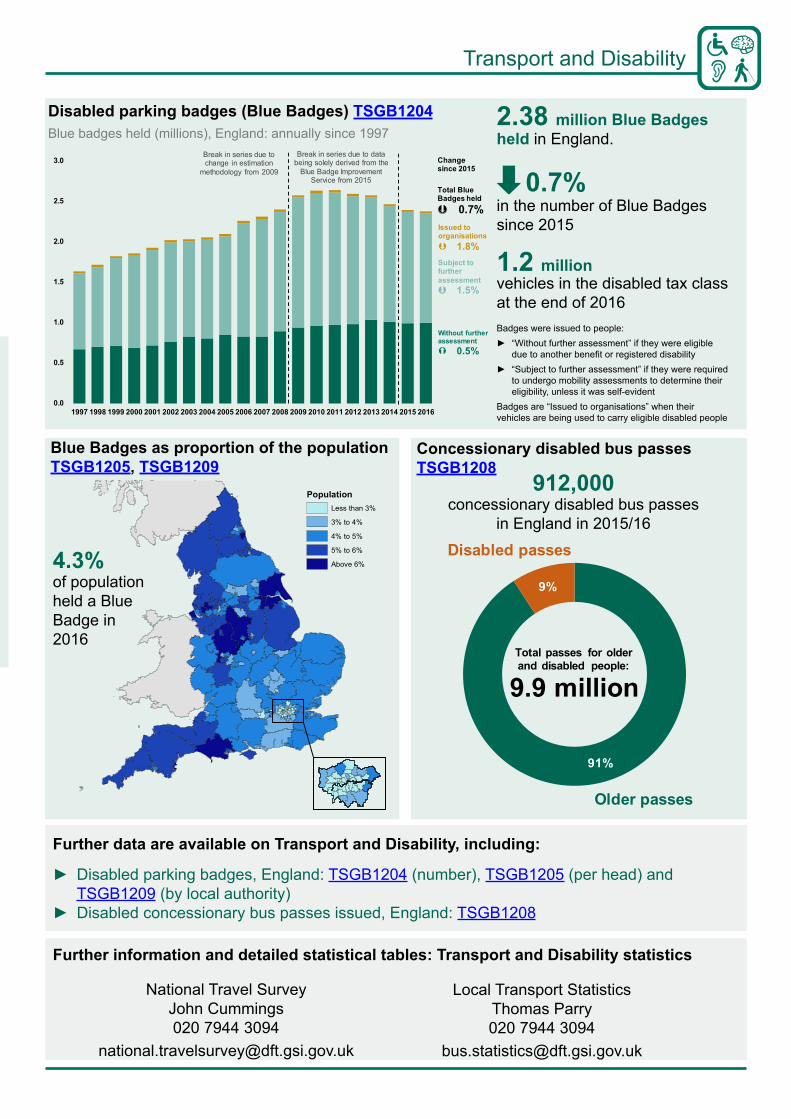
Blue badges held (millions), England: annually since 1997
1.2 millionvehicles in the disabled tax class at the end of 2016Badges were issued to people:
► “Without further assessment” if they were eligible due to another benefit or registered disability
► “Subject to further assessment” if they were required to undergo mobility assessments to determine their eligibility, unless it was self-evident
Badges are “Issued to organisations” when their vehicles are being used to carry eligible disabled people
in the number of Blue Badges since 2015
0.7%
Blue Badges as proportion of the population TSGB1205, TSGB1209
Concessionary disabled bus passes TSGB1208
912,000concessionary disabled bus passes
in England in 2015/16
Disabled parking badges (Blue Badges) TSGB1204
0.0
0.5
1.0
1.5
2.0
2.5
3.0
1997 1998 1999 2000 2001 2002 2003 2004 2005 2006 2007 2008 2009 2010 2011 2012 2013 2014 2015 2016
Break in series due to change in estimation
methodology from 2009
Break in series due to data being solely derived from the
Blue Badge Improvement Service from 2015
Change since 2015
Total Blue Badges held 0.7%Issued toorganisations 1.8%Subject to further assessment 1.5%
Without further assessment 0.5%
PopulationLess than 3%
3% to 4%
4% to 5%
5% to 6%
Above 6%4.3%of population held a Blue Badge in 2016
91%
9%
Total passes for older and disabled people:
9.9 million
Disabled passes
Older passes
2.38 million Blue Badgesheld in England.
Transport and Disability

Transport Statistics Great Britain 2017 Transport Expenditure
£29.1 billionpublic expenditure on transport in 2016/17. Includes National Rail for the second time, after first being included in 2015/16.
increase on 2016/17: total rail and road expenditure has increased by £1.7bn, while total local public transport and other transport expenditure fell by £0.2bn.
£1.5 billion
increase on 2016/17. 6%
UK public expenditure on transport TSGB1301
UK public expenditure on transport TSGB1303
£16 billionspending on railways in 2016/17, accounting for 54% of total public expenditure on transport.
spending on local roads in 2016/17, accounting for 19% of total public expenditure on transport.
£6 billion
Further data are available on Transport Expenditure, including:
► Public expenditure on transport by country and spending authority: TSGB1302 ► Total UK public corporation capital expenditure on transport: TSGB1304 ► Public expenditure on specific transport areas: TSGB1305
Expenditure by transport function: 2016/17
Transport expenditure: 1989/90 to 2016/17
Transport Expenditure
Further information and detailed statistical tables: Transport Expenditure statisticsMohan Dell
020 7944 [email protected]
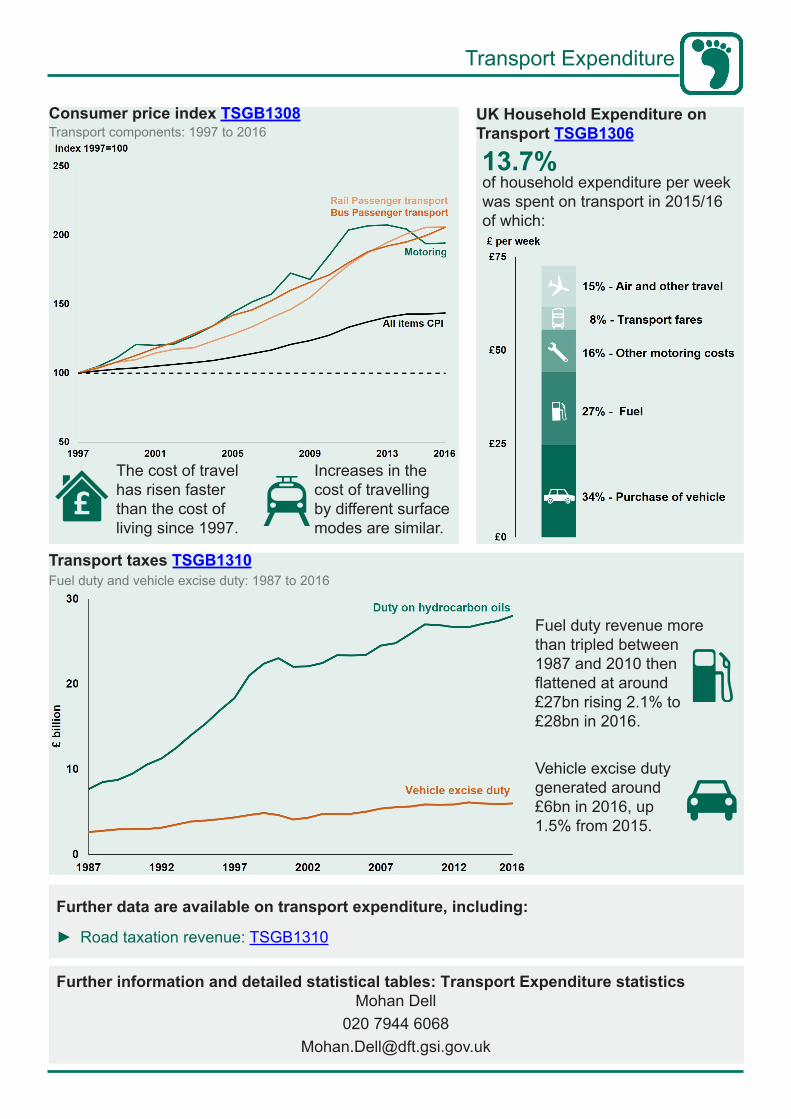
Consumer price index TSGB1308
The cost of travel has risen faster than the cost of living since 1997.
Increases in the cost of travelling by different surface modes are similar.
Transport components: 1997 to 2016
13.7%of household expenditure per week was spent on transport in 2015/16 of which:
Further data are available on transport expenditure, including:
► Road taxation revenue: TSGB1310
Transport taxes TSGB1310
Fuel duty revenue more than tripled between 1987 and 2010 then flattened at around £27bn rising 2.1% to £28bn in 2016.
Vehicle excise duty generated around £6bn in 2016, up 1.5% from 2015.
UK Household Expenditure on Transport TSGB1306
Fuel duty and vehicle excise duty: 1987 to 2016
Department for Transport are reviewing the way in which Transport Statistics Great Britain (TSGB) is published. We are carrying out a user feedback survey to see how we can make TSGB a better, more informative and more user friendly publication moving forward. Please complete the survey at www.smartsurvey.co.uk/s/TSGBReview Department for Transport has actively considered the needs of blind and partially sighted people in accessing this document. The text will be made available in full on the department’s website. The text may be freely downloaded and translated by individuals or organisations for conversion into other accessible formats. If you have other needs in this regard please contact the department. Department for Transport Great Minster House 33 Horseferry Road London SW1P 4DR Telephone 0300 330 3000 General enquiries https://forms.dft.gov.uk Website www.gov.uk/dft
Crown copyright 2017 Copyright in the typographical arrangement rests with the Crown. You may re-use this information (not including logos or third-party material) free of charge in any format or medium, under the terms of the Open Government Licence v3.0. To view this licence visit http://www.nationalarchives.gov.uk/doc/open-government-licence/version/3 or write to the Information Policy Team, The National Archives, Kew, London TW9 4DU, or e-mail: [email protected]. Where we have identified any third-party copyright information you will need to obtain permission from the copyright holders concerned. A National Statistics publication produced by Transport Statistics: DfT National Statistics are produced to high professional standards set out in the Code of Practice for Official Statistics. They undergo regular quality assurance reviews to ensure that they meet customer needs. They are produced free from any political interference. Prepared for publication by: John Wilkins Shawn Weekes DfT Statistics Staff DfT Statistics Twitter Team Chris Cameron (DfT Print Publishing) Pembe Sevenel (DfT Print Publishing) Further information and queries concerning this publication should be directed to: AMES Statistics, 2/29, Great Minster House, 33 Horseferry Road, London SW1P 4DR, Tel: +44 (0) 20-7944 4847, E-mail: [email protected]
To hear more about DfT statistics publications as they are released please follow us on Twitter via our @DfTstats account http://www.twitter.com/DfTstats TWITTER, TWEET, RETWEET and the Twitter logo are trademarks of Twitter Inc. or its affiliates.