transport, storage and communication · pdf file1 hsrc sector case studies case study report...
TRANSCRIPT

Human Sciences Development Policy Sociology of Work Research Council Research Unit Unit
RESEARCH CONSORTIUM
________________________________________________________________
TRANSPORT, STORAGE AND COMMUNICATION INDUSTRY
Sector Studies
Research Project
MARCH 2008
RESEARCH COMMISSIONED BY DEPARTMENT OF LABOUR
SOUTH AFRICA
1
HSRC Sector Case Studies
Case Study Report
Transport, Storage and Communication Industry
February 2008

i
TABLE OF CONTENTS
Page CHAPTER 1: GENERAL OVERVIEW ...................................................................................... 1 INTRODUCTION .......................................................................................................................... 1 DEMARCATION OF THE TRANSPORT SECTOR................................................................ 1 METHODOLOGY ......................................................................................................................... 5 OVERVIEW: TRANSPORT, STORAGE AND COMMUNICATION ..................................... 5
The role and functions of transport........................................................................................ 5 The economic function of transport ....................................................................................... 6 The social function of transport.............................................................................................. 7 The political function of transport........................................................................................... 7
KEY INDUSTRY DRIVERS ........................................................................................................ 7 SKILLS DEVELOPMENT CONTEXT ..................................................................................... 10 CHAPTER 2: EMPLOYMENT DEMAND-SIDE FACTORS ................................................ 13 EMPLOYMENT DEMAND: TRANSPORT, STORAGE AND COMMUNICATION INDUSTRY .................................................................................................................................. 13 LABOUR FORCE SURVEY AND OCTOBER HOUSEHOLD SURVEY ........................... 13
Total employment for the transport, storage and communications industry ................. 13 The Transport Sub-sector ..................................................................................................... 15 Passenger transport .............................................................................................................. 22 Formal and informal employment for the industry ............................................................ 25 Employment distribution by gender for the industry ......................................................... 25 Employment distribution by race for the industry .............................................................. 26 Employment distribution by age for the industry ............................................................... 27 Skills bands for selected occupational categories in the industry .................................. 28
SUMMARY .................................................................................................................................. 31 CHAPTER 3 - EMPLOYMENT SUPPLY-SIDE FACTORS................................................. 32 OVERVIEW ................................................................................................................................. 32 THE STATUS QUO ................................................................................................................... 32
Secondary education ............................................................................................................. 32 Science, engineering and technology (SET) ..................................................................... 35
FET AND HET SUPPLY ........................................................................................................... 36 FET and HET data ................................................................................................................. 37
IMMIGRATION AND EMIGRATION ....................................................................................... 41 LIFE EXPECTANCY .................................................................................................................. 42 VACANCY RATES..................................................................................................................... 43
Transport sector (HSRC Vacancy Study) .......................................................................... 43 Vacancies in the Department of Transport ........................................................................ 44
OTHER SUPPLY-SIDE FACTORS......................................................................................... 44 Sector Education and Training Authorities......................................................................... 44
SUMMARY .................................................................................................................................. 45 CHAPTER 4: FREIGHT TRANSPORT CASE STUDY ........................................................ 46 INTRODUCTION ........................................................................................................................ 46 SURFACE TRANSPORT BY ROAD AND RAIL IN SOUTH AFRICA ............................... 47
Introduction.............................................................................................................................. 47 Expected skills shift................................................................................................................ 51
WATER TRANSPORT IN SOUTH AFRICA .......................................................................... 52
ii
Introduction.............................................................................................................................. 52 Shipping lines.......................................................................................................................... 53 Expected skills shift................................................................................................................ 54
PIPELINE TRANSPORT IN SOUTH AFRICA....................................................................... 55 Introduction.............................................................................................................................. 55 Expected skills shift................................................................................................................ 55
SUMMARY .................................................................................................................................. 56 CHAPTER 5: PASSENGER TRANSPORT CASE STUDY................................................. 57 INTRODUCTION ........................................................................................................................ 57 PASSENGER TRANSPORT IN SOUTH AFRICA ................................................................ 58
Short Haul................................................................................................................................ 60 EXPECTED SKILLS SHIFT...................................................................................................... 62 SUMMARY .................................................................................................................................. 63 CHAPTER 6: TELECOMMUNICATIONS CASE STUDY .................................................... 64 INTRODUCTION ........................................................................................................................ 64 TELECOMMUNICATIONS IN-MARKET STRUCTURE: SOUTH AFRICA ...................... 67 EXPECTED SKILLS SHIFT...................................................................................................... 68 SUMMARY .................................................................................................................................. 70 CHAPTER 7: SUMMARY ......................................................................................................... 71 INTRODUCTION ........................................................................................................................ 71 TRANSPORT SUB-SECTORS (CASE STUDIES)............................................................... 71
Freight Transport.................................................................................................................... 71 Passenger transport .............................................................................................................. 73 Telecommunications.............................................................................................................. 73
POLICY RECOMMENDATIONS ............................................................................................. 73 CONCLUSION ............................................................................................................................ 74 REFERENCES ........................................................................................................................... 75 APPENDIX 1: ACRONYMS...................................................................................................... 79 Figures
Figure 1.1: Demarcation of the transport, storage and communications industry..............................................5 Figure 1.2: Transport, storage and communication industry employment relative to GDP contribution......12 Figure 2.1: Formal employment growth for the transport, storage and communication industry 1996 – 2005 ................................................................................................................................................................................14 Figure 2.2: Formal employment in the transport, postal and telecommunications sub-sectors 1996 – 2005.........................................................................................................................................................................................15 Figure 2.3: Formal employment distribution - air, water and surface transport, 1996-2005 ..........................16 Figure 2.4: Formal employment distribution by surface transport mode (rail, road and pipeline) 1996-2005.........................................................................................................................................................................................16 Figure 2.5: Estimated formal employment split between passenger and freight transport 1996-2005 ........17 Figure 2.6: Formal employment split between passenger and freight transport for rail 1996-2005 .............18 Figure 2.7: Formal employment split between passenger and freight transport for road 1996-2005...........18 Figure 2.8: Growth in tonkilometer per worker compared to growth in real GDP 1995-2005 ........................19 Figure 2.9: Tonkilometer per employee for all railways of the world (USA Class 1, the best European railway and all available sub-Saharan railways are labeled) ...............................................................................20 Figure 2.10: Tonkilometer per employee (two parts of SA Rail compared to global railways) ......................21 Figure 2.11: Growth in tonkilometer per worker compared to growth in real GDP per worker 1995-2005 .22 Figure 2.12: Growth in passenger journeys per worker compared to growth in real GDP 1995-2005 ........22 Figure 2.13: Growth in passenger journeys per worker compared to growth in real GDP per worker 1995-2005 ................................................................................................................................................................................23 Figure 2.14: Mode comparison between metro rail and taxi short distance transport 1995-2005 ................24
iii
Figure 2.15: Growth in long distance passenger journeys per worker compared between rail and air 1995-2005 ................................................................................................................................................................................24 Figure 2.16: The split between formal and informal employment in the transport sub-sector (as reported by StatsSA) 1996-2005 ...............................................................................................................................................25 Figure 2.17: Distribution by gender for the industry (formal employment) 1996-2005 ....................................26 Figure 2.18: Distribution by race for the industry (formal employment) 1996-2005.........................................26 Figure 2.19: Average distribution of age for the industry (formal sector)...........................................................27 Figure 2.20: Average distribution of age for the industry (formal sector) 1995-2005 ......................................28 Table 2.1: Three Skills Bands and the National Qualifications Framework ......................................................28 Figure 2.21: Distribution of skills bands for the industry (formal employment) 1996-2005 ............................29 Figure 2.22: Low Skills: Distribution of occupational category for the industry (formal employment) 1996–2005 ................................................................................................................................................................................29 Figure 2.23: Intermediate Skills: Distribution per occupational category for the industry (formal employment) 1996–2005 ............................................................................................................................................30 Figure 2.24: High Skills: Distribution per occupational category for the industry (formal employment) 1996–2005 .....................................................................................................................................................................31 Figure 3.1: Grade 12 pass rate 1994-2006 .............................................................................................................34 Figure 3.2: Number of grade 12’s passing Mathematics Higher Grade 1995-2006 ........................................34 Table 3.1: Examination results for Physical Science, 2001 and 2005 ...............................................................35 Figure 3.3: SET student pass rate 1994-2005 ........................................................................................................36 Figure 3.4: HET Graduates in Engineering and Transportation by race 1996-2005 .......................................38 Figure 3.5: HET Graduates in Engineering and Transportation by gender 1996-2005 ..................................39 Figure 3.6: Fields of study in engineering and transportation 1996–2005 ........................................................39 Figure 3.7: Types of qualifications obtained in engineering and transportation 1996-2005...........................40 Table 3.2: Attrition rates in HET 2000-2004 ............................................................................................................40 Figure 3.8: Transport and communication migration 1996-2002.........................................................................41 Figure 3.9: Professional and Managerial/Administrative migration 1996-2002 ................................................42 Figure 3.10: Life expectancy (RSA) 2001-2007 .....................................................................................................43 Table 3.3: Selected vacancy data .............................................................................................................................43 Figure 4.1: South African freight transport as a percentage of world figures (2004).......................................47 Figure 4.2: Freight transport flow between the major concentration nodes ......................................................48 Figure 4.3: South African freight transport network segments.............................................................................48 Figure 4.4: Description and challenges for South African freight transport network segments.....................49 Figure 4.5: Mode usage of the different freight transport segments...................................................................49 Figure 4.6: Degree of skills shift required to enable step change from long haul road to long haul rail freight transport.............................................................................................................................................................51 Figure 4.7: Degree of skills shift required to enable water freight transport......................................................54 Figure 4.8: Degree of skills shift required to enable pipeline transport ..............................................................56 Figure 5.1: South Africa’s demand for fast long haul domestic journeys...........................................................58 Figure 5.2: Long haul journeys compared to other modes of transport as a percentage of world figures ..59 Figure 5.3: Expected shift in long haul journeys if economy matures ................................................................60 Figure 5.4: Degree of skills shift compared to current levels of skill (Passenger)............................................62 Figure 6.1: Global wireless revenue as a percentage of the total .......................................................................64 Table 6.1: Global broadband wireless will grow six times faster than broadband fixed line ..........................65 Figure 6.2: Global mobile data volumes...................................................................................................................66 Table 6.2: South Africa’s reach in comparison to other SADC countries ..........................................................67 Figure 6.3: Degree of skills shift compared to current levels of skill (Telecommunication)............................69 Tables Figure 1.1: Demarcation of the transport, storage and communications industry..............................................5 Figure 1.2: Transport, storage and communication industry employment relative to GDP contribution......12 Figure 2.1: Formal employment growth for the transport, storage and communication industry 1996 – 2005 ................................................................................................................................................................................14 Figure 2.2: Formal employment in the transport, postal and telecommunications sub-sectors 1996 – 2005.........................................................................................................................................................................................15 Figure 2.3: Formal employment distribution - air, water and surface transport, 1996-2005 ..........................16 Figure 2.4: Formal employment distribution by surface transport mode (rail, road and pipeline) 1996-2005.........................................................................................................................................................................................16

iv
Figure 2.5: Estimated formal employment split between passenger and freight transport 1996-2005 ........17 Figure 2.6: Formal employment split between passenger and freight transport for rail 1996-2005 .............18 Figure 2.7: Formal employment split between passenger and freight transport for road 1996-2005...........18 Figure 2.8: Growth in tonkilometer per worker compared to growth in real GDP 1995-2005 ........................19 Figure 2.9: Tonkilometer per employee for all railways of the world (USA Class 1, the best European railway and all available sub-Saharan railways are labeled) ...............................................................................20 Figure 2.10: Tonkilometer per employee (two parts of SA Rail compared to global railways) ......................21 Figure 2.11: Growth in tonkilometer per worker compared to growth in real GDP per worker 1995-2005 .22 Figure 2.12: Growth in passenger journeys per worker compared to growth in real GDP 1995-2005 ........22 Figure 2.13: Growth in passenger journeys per worker compared to growth in real GDP per worker 1995-2005 ................................................................................................................................................................................23 Figure 2.14: Mode comparison between metro rail and taxi short distance transport 1995-2005 ................24 Figure 2.15: Growth in long distance passenger journeys per worker compared between rail and air 1995-2005 ................................................................................................................................................................................24 Figure 2.16: The split between formal and informal employment in the transport sub-sector (as reported by StatsSA) 1996-2005 ...............................................................................................................................................25 Figure 2.17: Distribution by gender for the industry (formal employment) 1996-2005 ....................................26 Figure 2.18: Distribution by race for the industry (formal employment) 1996-2005.........................................26 Figure 2.19: Average distribution of age for the industry (formal sector)...........................................................27 Figure 2.20: Average distribution of age for the industry (formal sector) 1995-2005 ......................................28 Table 2.1: Three Skills Bands and the National Qualifications Framework ......................................................28 Figure 2.21: Distribution of skills bands for the industry (formal employment) 1996-2005 ............................29 Figure 2.22: Low Skills: Distribution of occupational category for the industry (formal employment) 1996–2005 ................................................................................................................................................................................29 Figure 2.23: Intermediate Skills: Distribution per occupational category for the industry (formal employment) 1996–2005 ............................................................................................................................................30 Figure 2.24: High Skills: Distribution per occupational category for the industry (formal employment) 1996–2005 .....................................................................................................................................................................31 Figure 3.1: Grade 12 pass rate 1994-2006 .............................................................................................................34 Figure 3.2: Number of grade 12’s passing Mathematics Higher Grade 1995-2006 ........................................34 Table 3.1: Examination results for Physical Science, 2001 and 2005 ...............................................................35 Figure 3.3: SET student pass rate 1994-2005 ........................................................................................................36 Figure 3.4: HET Graduates in Engineering and Transportation by race 1996-2005 .......................................38 Figure 3.5: HET Graduates in Engineering and Transportation by gender 1996-2005 ..................................39 Figure 3.6: Fields of study in engineering and transportation 1996–2005 ........................................................39 Figure 3.7: Types of qualifications obtained in engineering and transportation 1996-2005...........................40 Table 3.2: Attrition rates in HET 2000-2004 ............................................................................................................40 Figure 3.8: Transport and communication migration 1996-2002.........................................................................41 Figure 3.9: Professional and Managerial/Administrative migration 1996-2002 ................................................42 Figure 3.10: Life expectancy (RSA) 2001-2007 .....................................................................................................43 Table 3.3: Selected vacancy data .............................................................................................................................43 Figure 4.1: South African freight transport as a percentage of world figures (2004).......................................47 Figure 4.2: Freight transport flow between the major concentration nodes ......................................................48 Figure 4.3: South African freight transport network segments.............................................................................48 Figure 4.4: Description and challenges for South African freight transport network segments.....................49 Figure 4.5: Mode usage of the different freight transport segments...................................................................49 Figure 4.6: Degree of skills shift required to enable step change from long haul road to long haul rail freight transport.............................................................................................................................................................51 Figure 4.7: Degree of skills shift required to enable water freight transport......................................................54 Figure 4.8: Degree of skills shift required to enable pipeline transport ..............................................................56 Figure 5.1: South Africa’s demand for fast long haul domestic journeys...........................................................58 Figure 5.2: Long haul journeys compared to other modes of transport as a percentage of world figures ..59 Figure 5.3: Expected shift in long haul journeys if economy matures ................................................................60 Figure 5.4: Degree of skills shift compared to current levels of skill (Passenger)............................................62 Figure 6.1: Global wireless revenue as a percentage of the total .......................................................................64 Table 6.1: Global broadband wireless will grow six times faster than broadband fixed line ..........................65 Figure 6.2: Global mobile data volumes...................................................................................................................66 Table 6.2: South Africa’s reach in comparison to other SADC countries ..........................................................67 Figure 6.3: Degree of skills shift compared to current levels of skill (Telecommunication)............................69

1
CHAPTER 1: GENERAL OVERVIEW
This chapter provides a general overview of the transport, storage and communications sector, the demarcation thereof and the structure of the remaining chapters of this report.
INTRODUCTION This study forms part of a sector-focused research project on behalf of the Department of Labour (DoL) to identify transport, storage and communication industry specific challenges with a particular focus on skills development. The outcome of the study will contribute to improved alignment between skills development policies and industrial or sector initiatives and/or policies. In addition, it will a sectoral and enterprise focus in the further debate about skills development in South Africa. The study also informs critical inter-relationships between industrial policy, the transport, storage and communication industry and economic growth in relation to skills development by the Sector Education and Training Authorities (SETA’s) to enable integrated and effectively aligned skills development strategies and programs. DEMARCATION OF THE TRANSPORT SECTOR Before the transport, storage and communication industry can be reviewed, it is necessary to briefly identify challenges which exist in terms of demarcating the industry. A literature review revealed that no single interpretation exists to demarcate the nature and scope of the transport, storage and communication industry in South Africa. Terminology such as “transport sector” or “transport industry” is used in a mutually inclusive manner throughout to refer to a variety of transport, storage and communication related issues and can include or exclude, depending on the topical discussion at the time, a range of activities and/or services produced by other “industries” or “sectors”, such as transport infrastructure and construction, air transport equipment maintenance, manufacturing and production, etc. In addition, “transport sector/industry” literature mostly refers to road, rail (road and rail also called “surface”), water, air and supply chain activities. Seldom does it include mention of tourism related activities such as those associated with tour guides, car rental with a driver and post and telecommunications related activities. The First State of Logistics Survey for South Africa (2004) indicates that the transport, storage and communications sector, as it is classified by the Standard Industrial Classification (SIC) and by the South African Reserve Bank (SARB), demonstrates a shortcoming, since “communications” activities are included in SARB figures; this whilst the communications sector entails many facets not necessarily only applicable to transport. The SARB also does not divulge the detailed information on the compilation of the national accounts. Furthermore, some companies do not

2
primarily focus on the storage and handling of goods, but make a considerable contribution towards the cost of storage and the cost of such operations are included in the storage amount, which implies that the presented figure is higher than the actual (input to the First Annual State of Logistics Survey for South Africa, 2004) (CSIR, 2004). The SIC and the SARB definition includes the cost of services rendered for reward, i.e. by third parties, but it excludes the services provided in-house by companies as part of their day-to-day operations. This implies that the extent of the transport, storage and communication industry is not known in South Africa. Detailed research into quantifying the total freight transport component of the sector has been done by the University of Stellenbosch and has been enhanced with some research into passenger components to form a basis for this study. However, as it was necessary to formally demarcate the transport, storage and communication industry for purposes of this study, it was decided to apply the SIC system to some extent. The necessary adjustments to the SIC and the inherent weaknesses in the way in which it is applied by Statistics South Africa (StatsSA) are discussed later. The SIC system, also used by StatsSA in the Labour Force Surveys (LFS - used amongst other data for statistical analysis in this study), classifies the transport, storage and communication industry to generally include divisions involved in activities related to providing passenger or freight transport, whether scheduled or not, by rail, road, water or air and auxiliary activities such as terminal and parking facilities, cargo handling and storage. The industry is also considered to include postal activities and telecommunications as well as the renting of transport equipment with a driver or operator for the different transport modes. General exclusions are the transport of a firm’s own products/goods (conducted as an ancillary service), the maintenance, repair and alteration of transport equipment, motor vehicles and motor cycles as well as the construction, maintenance and repair of roads, railways, harbours, air fields, etc. Also excluded are the renting of transport equipment without a driver or operator and recreational transport activities, such as the operation of cableways for recreation purposes. SIC 7, Transport, Storage and Communication, has been broken down into its major groups below to identify the sub-sectors relevant to this study: Group Sub-sector/industry 71 Land transport, transport via pipe-lines
711 Railway transport • Inter-urban railway transport • Railway commuter services
712 Other land transport • Other scheduled passenger land transport • Urban, suburban and inter-urban bus and coach passenger lines • School buses • Other non-scheduled passenger land transport • Taxis • Safaris and sightseeing bus tours • Other passenger transport, including the renting of motor cars with
drivers

3
• Freight transport by road • Transport of furniture • Other freight transport by road
713 Transport via pipelines 714 Unspecified
72 Water transport
721 Sea and coastal water transport • Coastal shipping • Ocean shipping
722 Inland water transport 73 Air Transport
730 Air transport 74 Supporting and auxiliary transport activities
741 Supporting and auxiliary transport activities; activities of travel agencies • Cargo handling • Storage and warehousing • Other supporting transport activities • Parking garages and parking lots • Salvaging of distressed vessels and cargoes • Maintenance and operation of harbour works, light-houses, etc., and
pilotage • Operation of airports, flying fields and air navigation facilities • Operation of roads and toll roads • Other supporting transport activities n.e.c. • Travel agency and related activities • Activities of other transport agencies
75 Post and telecommunications
751 Postal and related courier activities • National postal activities • Courier activities other than national postal activities
752 Telecommunication The analysis and interpretation of statistical data necessitates the use of this classification system. However, in order to present meaningful transport, storage and communication industry-related case studies a more logical and broad classification system, based on the normal principles of market segmentation, is required. Market segmentation should be needs-based and the “needs” in this case is for the transport of either freight or people (as far as the transport sub-sector is concerned). “Needs” translates into a utility that is provided by a service provider, solution, or system. Any system that is evaluated in terms of its inputs and outputs has the measurement of output productivity at heart (relating to the inputs consumed). Another core characteristic is also that it shouldn’t be financially defined, as financial parameters are not comparable (the cost of a commodity or manufactured item, for instance, in many countries could differ, whereas the use of this item remains the same). For electricity, for example, it could be kilowatt hours and for telecommunications,

4
bandwidth available or lines installed. In the transport sub-sector arena this can only be defined as tons shipped and passenger journeys in the widest sense and tonkilometers and passengerkilometers in the narrowest sense. It would be nonsensical to add tons shipped to passenger journeys or tonkilometers to passengerkilometer. If a system delivering x passengerkilometers and y tonkilometers are compared to another system delivering x1 passengerkilometers and y1 tonkilometers it would not be possible to compare x+y for the first system with x1 + y1 for the second in terms of productivity relative to each system’s inputs. StatsSA uses a rigorous system for its large sample surveys which limits data collection to the third SIC code, meaning for instance that railway transport, other land transport, water transport and air transport is the finest level of granularity on which statistics are reported (which are all systems and in most cases delivers both passenger and freight transport solutions). This means that passenger and freight transport cannot be disaggregated from the available statistics and that comprehensive research was necessary to provide this breakdown for purposes of this study. A further aspect that drove the additional research was the imbalance in data that was caused by this methodology, where of the 27 third level sub-sectors that are used in the transport sub-segment alone, 61% of all formal employees are to be found in only one (other land transport) and 75% in only two (other land and rail transport) of these sub-sectors. This report reflects this research to rectify this situation, together with some use of the official statistics in order to provide a sensible basis for further study. The same argument can be used to demarcate the relationship between post and telecommunications where outputs that can be used to analyze productivity are completely different between postal and telecommunications services, in addition to these two sectors being completely different from the transport sector. On the highest level the most logical demarcation in the industry should be transport, telecommunications and postal services, followed by a high level split between passenger and freight transport. In the modern era transport forms part of logistics which includes transport, storage, administration and inventory carrying costs. The latter logistics elements, i.e. storage, administration and inventory carrying costs are excluded from this report since many of the aspects involved in this areas are not included in the SIC group 7. The telecommunications sub-sector is completely misplaced as outputs have no bearing on freight or passengerkilometers or vice versa. The sub-sector is, however, discussed in an overarching fashion and one short case study is provided. The following figure visually depicts the somewhat more logical demarcation of the industry applied for purposes of this report.

5
Figure 1.1: Demarcation of the transport, storage and communications industry Source: Stellenbosch University, 2008 METHODOLOGY In order to achieve the required objective of this study, a data driven approach is crucial, but as is common for many studies in this regard (Department of Transport “DoT”, Moving South Africa, 1998, p. 3, 5, 11, 178-179) data is scarce and unavailable. Even worse, the statistical data available from official sources such as Statistics South Africa (“StatsSA”) are constructed poorly and categorized incorrectly and is not useful in its current format. It was therefore necessary to conduct interviews, specifically to obtain some of the data that was necessary to do a critical evaluation, do desktop research and model the data (based on secondary test cases) in order to fill the numerous gaps that existed. Apart from constructing the data sets, interviews and surveys were performed together with further desktop analysis to inform the critical analysis of the constructed data for the various parts of the industry. OVERVIEW: TRANSPORT, STORAGE AND COMMUNICATION The role and functions of transport Milne (1960, p3) indicates that living standards can be improved through specialization (labour division), which increases productivity, provided that there are markets in which the additional output can be sold. The degree of specialization is therefore limited by the size of the market (Milne, 1960, p3). Due to the fact that goods and services gain time value and place value as a result of transport, markets can grow as a result of transport provision. In modern times, many businesses realized that the time and place utility that could be added to goods and services are not only limited to a transport service provision. An integrated view with the storage function and the administration of the interrelated costs between transport, storage and the carrying costs of the inventory is a more accurate view of the overarching
Utilities Passenger transport
Freight transport
Other logistics and storage
activitiesTelecommunications Postal
services
SIC
Modes
Transport Sub-sector
Storage Sub-sector
Communications Sub-sector
•Rail•Road surface•Pipeline•Air•Water
Logical demarcation Transport Sub-sector
Postal Sub-sector
Telecommunica-tions Sub-sector

6
utility and is commonly called logistics. Globally, for instance, the transport component of the provision of time and place utility is now estimated to be only 38% of the total costs in the freight sub-sector. This figure is much higher for South Africa (due to spatial challenges that will be discussed later), but even at 63% significant utility is added by non-transport related dimensions. The physical function of transport is to close the gap between the place of production and the place of consumption, and thereby to add time value and place value to goods and services, while the economic function of transport is to cross that distance at the lowest possible cost. In this context the lowest cost does not necessarily refer to tariffs or travel fees, but rather the lowest cost expressed as the resources that are necessary to let the transportation take place, i.e. the lowest economic costs or opportunity costs (Milne, 1960, p11). Due to today's diverse nature of human needs, the provision of transport takes on a variety of forms. The advantages of transport are thus just as diverse and are best illustrated by the following basic functions of transport, further described in the sections below:
• Economic function; • Social function and • Political function.
The economic function of transport The economic function of transport is derived from the interaction between transport and the creation of goods and services in order to satisfy people's needs. Human needs are not necessarily satisfied only through the distribution of goods and services. It must be in the right form (stage of production) and it must be available to consumers at the right place (transport) and at the right time (storage). This requirement coupled with the disproportionate distribution (caused by nature and specialization) of raw materials, labour, factories, and markets is essential for the provision of transport. The role of specialization is illustrated by the difference between subsistence and commercial farming – subsistence farming requires little or no inputs and produces little or no outputs that need to be distributed away from the farm. It is however not effective and with commercial farming more and better quality commodities can be provided by the same inputs. This trend is global and rising, as many production processes are specialized to such an extent that some finished goods used around the world could contain components that are manufactured in more than two continents. This rise in specialization in turn drives labour specialization which in turn results in unique training challenges because the training of specialists (as opposed to generalist training) necessitates the development of deep skills and requires narrower defined subject matters. Transport is therefore an integral part of the process through which production inputs are converted into goods and services that are necessary to satisfy human needs and the resulting commercial transactions. Over and above the basic creation of place and time value, transport also offers the following economic advantages (Shumer, 1974, p3-6):
• It increases the accessibility to markets for both buyers and sellers.

7
• It brings balance to the supply of products in different markets with the existing demand.
• The above leads to a greater deal of uniformity in view of the prices of a specific product on the different markets.
• It increases the supply area of all distributors; this leads to greater competition between distributors, which usually lead to a lower average price level.
• Due to the greater supply area of producers and distributors, residents of an area can get involved in the production of goods in which they have an equivalent cost advantage; (this, in turn, leads to greater specialization, higher productivity of labour and other advantages that go with it.).
• It is no longer necessary for workers to live close to their place of work. They have a greater variety of choices of work and are exposed to more opportunities.
The social function of transport The priorities of today's lifestyle are not only of an economic nature. For other needs, such as social status, relaxation, education, cultural activities, religion, municipal and health services, transport is just as essential (Shumer, 1974, p5-6). The social function of transport does not merely entail the distribution of transport in order to satisfy people’s aforementioned needs. The transport facilities must be of sufficient quantity, it must be of the required quality (speed, convenience and comfort) and it must be offered to the consumer at a reasonable price. Some of the social needs (e.g. education and health services) are typical government functions, which must be made available to all citizens of the country. The government consequently accepts most of the responsibility in providing transport facilities that are available at fair tariffs. Transportation services that are offered are often unprofitable and will not be provided by private organizations. Consequently it is often found that the government will help to maintain those services. The political function of transport The political function of transport according to Shumer (1974, p6-7) is based on the contributions it makes to the relations between government and citizens as well as the relations between the government and other countries. Efficient transport improves those relations by creating mobility, which overcomes isolation. The following are examples of the aforementioned improvements:
• National unity is improved. • The political right of every citizen to have an influence on the election of a
representative government body is made possible. • Accessibility is provided to all citizens by means of transport. • Transport makes the distribution of government aid during natural disasters
possible. • It contributes to the safety of the state and enables it to defend itself.
KEY INDUSTRY DRIVERS
8
The transport, storage and communication industry grew by 5.6% during the first nine months of 2006 compared to the same period in 2005. The real value added by the transport, storage and communication sector to the output of the economy increased by approximately 5.5% in 2006. For the year as a whole, the sector contributed about 11% of the total gross value added. This is expected to increase significantly over the next few years with the build-up to the 2010 Soccer World Cup. Gross domestic product (GDP) data released by StatsSA however lacks detail, which limits the ability to identify precisely the source of growth in a given period, or the reason for its absence (Business Watch, 2007). Johan Prinsloo, a senior economist in the Reserve Bank's research department, however, indicates that transport, storage and communication contribute to nearly 10% of total GDP. Prinsloo says transport, together with storage, which is negligible, makes up 55% and communication 45% of this portion. The following presents a summary of the key drivers that shape the transport, storage and communication industry, as provided by Standard Bank (2007), the National Treasury (2007) and Cosatu (2006), unless otherwise noted. • Focused investment in sustainable public passenger transport:
o Over the past two years government has made almost R16 billion available for public transport infrastructure and systems (for taxi, rail and bus). The aim for 2009 is to ensure in the shortest period possible, significant improvements in the current passenger transport arrangements through the taxi recapitalization program, consolidation of passenger rail entities, transformation of the bus industry, and coordination and support of the public transport strategies.
o The National Land Transport Transition Act of 2000 directs government to actively promote public transport. The Gautrain project illustrates the Gauteng Government’s commitment in this regard. The Gautrain Rapid Rail Link is a state-of-the-art rapid rail network being built in Gauteng, comprising two links: (a) a link between Tshwane (Pretoria) and Johannesburg, and (b) a link between OR Tambo International Airport and Sandton. Apart from the three anchor stations on these two links, seven other stations will be linked by approximately 80 kilometers of rail along the proposed route. The Gautrain Rapid Rail Link project offers a cost-effective, efficient, environmentally friendly and safe solution to some of the worst transport problems in the most densely developed areas of Gauteng. This project is part of a longer-term vision, which will include a government commitment towards creating and sustaining a new culture of public transport usage.
• The existence of a well-maintained transport infrastructure: o This infrastructure must meet the needs of commuters and freight
transporters as a precondition for a successful economy, especially in rural areas as transport consumes a large proportion of the disposable income of the poor.
o The Department of Transport (DoT) is thus faced with a challenge to improve and expand the transport infrastructure to enable access for the second economy. The high number of accidents in the country,

9
road as well as rail, has warranted the need to manage and overcome these problems in a proactive and creative manner.
o Significant investment by state-owned enterprises, particularly in general rail freight, will help lower the cost of logistics and reduce pressure on road transport.
o The Airports Company of South Africa (ACSA) has also completed the first bond issue of R2 billion as part of its R12 billion domestic medium-term note program to invest in infrastructure capacity development at all of its nine airports. Capital expenditure plans include forecasted passenger growth in excess of 50% to accommodate approximately 43.7 million passengers by 2010. The capital expenditure program focuses mainly on the three major airports: OR Tambo International in Johannesburg, the international airport in Durban, and Cape Town International, which together produce 93% of ACSA’s revenue and 96% of its profit.
• The 2010 FIFA Soccer World Cup: o This will be a significant milestone for South Africa, especially in terms
of infrastructure and transport services. A transport Action Plan for 2010 has been developed and an allocation of R9 billion will be spent in various host cities and on state-owned entities in preparation for the event to provide sufficient air, road and rail transport to accommodate the projected travel demands for various events.
• A successful tourism industry: o As the tourism industry is an amalgamation of sectors related to
transport, accommodation, food and beverage, and as the transport sub-sector includes safaris, travel agents and the renting of vehicles with drivers, it is also necessary to determine what the tourism industry’s prospects are in relation to transport.
o Tourism is regarded as a modern-day engine of growth and is one of the largest industries globally. It is also said that South Africa’s tourism industry has great potential, which needs to be tapped. Tourism has been earmarked as a growth industry in South Africa, and is also perceived to be able to absorb excess labour even when skills are inadequate, as training can be provided relatively quickly to upgrade service proficiency to an acceptable standard.
o The tourism industry, however, lacks comprehensive and accurate statistical information; therefore it is necessary to set up a Tourism Satellite Account (TSA) to quantify the industry’s direct and indirect contribution to the economy in order to enable international comparison. The establishment of the TSA is expected to fundamentally assist the public and private sectors to create policy and to invest in the sector on the basis of core information rather than on supposition. It enables the industry to be compared to other industries in the economy, in terms of percentage contribution to GDP, as well as to the tourism industries internationally.
o South Africa’s tourism industry appears to have changed dramatically since 1989. Before 1989 less than a million foreign visitors traveled to South Africa annually; since 1990, when the number of foreign visitors exceeded one million for the first time, these numbers have soared, to just over 8.5 million in 2006. Presently, the tourism industry employs

10
an estimated 7% of South Africa’s workforce, and is regarded as potentially the largest provider of jobs and earner of foreign exchange. It is projected that in 2010 the South African tourism industry will employ more than 1.2 million people either directly or indirectly.
• A competitive telecommunications industry: o Telkom, a listed company with government as the biggest shareholder,
until recently was the only licensed provider of public fixed line telecommunications services in the country. Telkom’s monopoly expired in 2002 and it took a few years for the second national operator of South Africa, Neotel, to be appointed. Neotel aims to reduce the cost of doing business by enhancing the operational efficiencies of companies through the optimal use of advanced communications technologies, and to extend these benefits into the second informal economy. Neotel is in the process of implementing wholesale international voice and data services and consumer services.
o South Africa’s cellular services have become the fourth fastest growing Groupe Speciale Mobile (GSM) market in the world since it entered the market in 1994. Cellular services are provided by three licensed operators: Vodacom, MTN and Cell C, and since 24 June 2006, also by a virtual cellular service provider, Virgin Mobile, in partnership with Cell C. The country has more than 33 million mobile phones. The introduction of number portability in November 2006 has further increased the flexibility of the mobile service industry.
• Broad-based access to these telecommunications services: o Despite significant expansion, access to telecoms services in South
Africa remains a problem for many, especially in rural and other neglected areas. The introduction of various wireless services has promoted the accessibility to internet services to a large extent.
• Efficient postal services: o The South African Post Office operates more than 2 000 outlets and
delivers approximately 8 million postal articles to 6.5 million addresses annually.
o Continued focus on these services are critical to ensure competitiveness and reliability
SKILLS DEVELOPMENT CONTEXT The Accelerated and Shared Growth Initiative for South Africa (AsgiSA) identified the shortage of appropriate skills as one of six factors that constrain growth in the country. The Joint Initiative on Priority Skills Acquisition (JIPSA) has been established as a result to identify urgent skills needs and advise on ways to respond to these challenges (Department of Labour, date unknown). The main focus of Jipsa is to develop skills that are most urgently needed. Jipsa is one of the most important parts of AsgiSA with its biggest challenge being the need to overcome the skills shortage in South Africa. Some of the ways identified through which to alleviate the skills shortages include:
• Implementing mentoring programs.

11
• Overseeing placements of trainees to fast-track development. • Developing and implementing special training programs. • Utilizing retirees. • Bringing back expatriate South Africans. • Drawing on new immigrants. • Re-implementing apprenticeships.
Considering the above-mentioned, it is necessary to determine to what extent the transport, storage and communication industry will require, apart from additional scarce skills for the immediate future, up-skilling, re-skilling and even completely new and differentiated skills sets. Some of the initiatives and global impacts which will present new ways of working and place even higher demands on the supply and demand of skills within the transport, storage and communication industry in the next five to twenty years include:
• The Government’s infrastructure investment, which will see R372-billion spent up to 2009 in preparation for the 2010 FIFA World Cup.
• Urban congestion that leads to the implementation of the high speed Gautrain project and the possible future expansion of suburban rail based transport solutions.
• Large industrial projects such as the development of the Coega aluminium smelter.
• The development of Transnet’s rail, harbour and petroleum pipeline network and the regaining of rail market share through large scale intermodal developments.
• Eskom’s planned spend of about R84 billion on transmission, generation and distribution over the next five years.
• The development and introduction of alternative fuels and technologies, such as bio-diesel, bio-ethanol and fuel cells.
• Environmental concerns that will drive modal shift in transport. • Globalization - transport and telecommunication advances have contributed to
the creation of a "global village” resulting in countries and people being closer together, whilst competing in the global economy. Local companies therefore have to compete with companies from other countries that can export goods to South Africa at cheaper prices, as well as compete in major export markets such as automotive manufacturing and trade in livestock.
• Technology - increased use of ICT (information and communications technologies) have led to jobs that are information-oriented and require higher level technical as well as generic skills (for example, communication-, writing-, learning-, and computer literacy skills). Increased use of machines to replace workers has also led to more industries needing a smaller pool of highly skilled workers, instead of a large pool of lower-skilled workers.
• New forms of work organisation - companies need to be able to respond quickly to fast-changing customer demands. In order to do this, they require workers who can make decisions, solve problems and take responsibility for their actions. The need for this flexibility has led to new forms of work including team-based production, and outsourcing certain parts of operations to outside individuals and smaller companies.
• Global climate change and greenhouse gas production: well-designed, well-run and sensibly planned public transport systems and infrastructure can play
12
a key role in cutting climate change emissions. In addition, it can help improve air quality and bridge social and economic divides.
• The long-term need from an industrial and socio-economic development point of view, to create sustainable opportunities to be economically active for participants in the second economy.
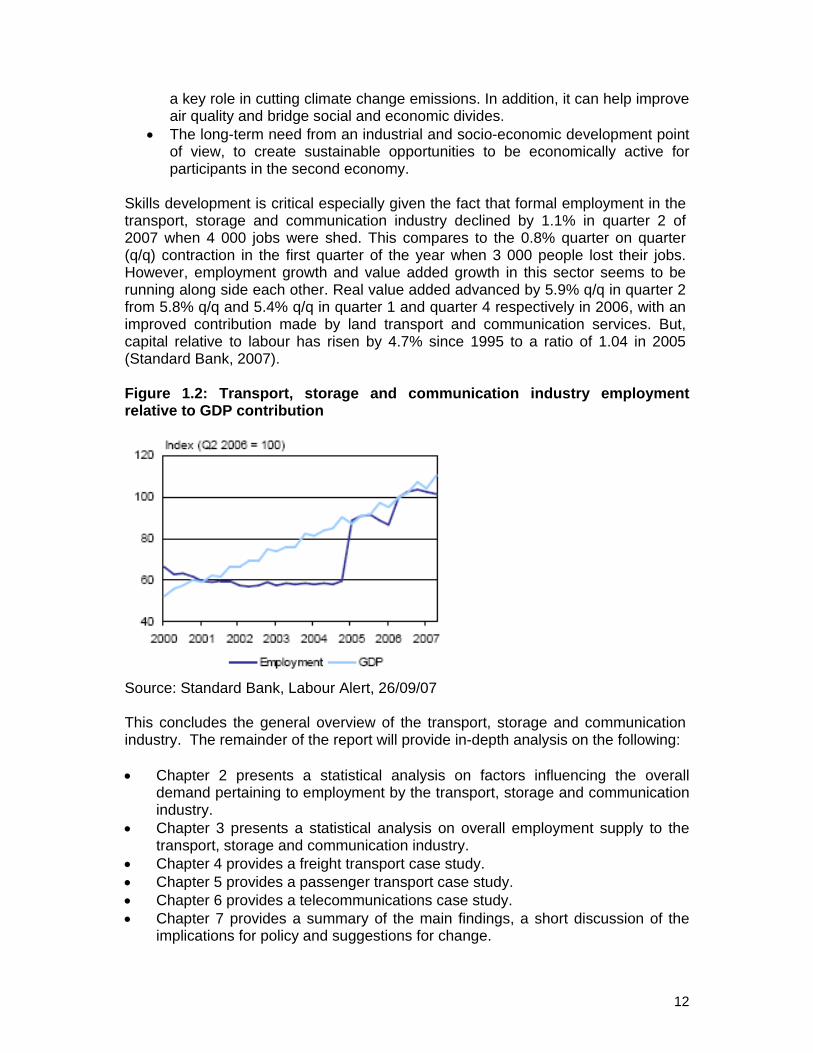
Skills development is critical especially given the fact that formal employment in the transport, storage and communication industry declined by 1.1% in quarter 2 of 2007 when 4 000 jobs were shed. This compares to the 0.8% quarter on quarter (q/q) contraction in the first quarter of the year when 3 000 people lost their jobs. However, employment growth and value added growth in this sector seems to be running along side each other. Real value added advanced by 5.9% q/q in quarter 2 from 5.8% q/q and 5.4% q/q in quarter 1 and quarter 4 respectively in 2006, with an improved contribution made by land transport and communication services. But, capital relative to labour has risen by 4.7% since 1995 to a ratio of 1.04 in 2005 (Standard Bank, 2007). Figure 1.2: Transport, storage and communication industry employment relative to GDP contribution
Source: Standard Bank, Labour Alert, 26/09/07 This concludes the general overview of the transport, storage and communication industry. The remainder of the report will provide in-depth analysis on the following: • Chapter 2 presents a statistical analysis on factors influencing the overall
demand pertaining to employment by the transport, storage and communication industry.
• Chapter 3 presents a statistical analysis on overall employment supply to the transport, storage and communication industry.
• Chapter 4 provides a freight transport case study. • Chapter 5 provides a passenger transport case study. • Chapter 6 provides a telecommunications case study. • Chapter 7 provides a summary of the main findings, a short discussion of the
implications for policy and suggestions for change.

13
CHAPTER 2: EMPLOYMENT DEMAND-SIDE FACTORS
This chapter presents a statistical analysis on factors influencing the overall demand for employment in the transport, storage and communication industry.
EMPLOYMENT DEMAND: TRANSPORT, STORAGE AND COMMUNICATION INDUSTRY The boom in, amongst others, infrastructural development, new technologies, differentiating telecommunications, mechanising supply chains, and the growth in the economy in general, as well as the demand for sustainable development and upliftment of the previously disadvantaged, have created many new opportunities for transport, storage and communication industry employees. This chapter investigates the demand related to transport sub-sectors at the hand of labour force and household statistics provided by StatsSA surveys as well as other data sources related to freight and passenger transport. In addition, the University of Stellenbosch has also utilised and modelled data collected from various sources as well as in-house research. LABOUR FORCE SURVEY AND OCTOBER HOUSEHOLD SURVEY The October Household Survey (OHS) published by StatsSA, which was discontinued in 1999, was replaced by the Labour Force Survey (LFS) in 2000, also published by StatsSA. Data gathered by these two reports were used together with comprehensive own research to determine demand trends for the period 1996 to 2005. A limitation regarding the data includes raw data extracted from the OHS (1996 to 1999), and the LFS (2000 to 2005) being incomplete with many cells reflecting missing values, making it difficult, if not in some instances impossible, to meaningfully interpret the data. This has, however, been circumvented with the new research. Notwithstanding the above-mentioned, the data is still presented below, as it does provide some insight into demographical, geographical as well as remunerative variables in the transport related sub-sectors. Figures were primarily drawn for the formal sector which includes government institutions on all levels, parastatals, the private sector and self-employed individuals, non-governmental organizations (NGO’s), clubs, associations, etc. Additional research and data refinements include research into the informal sector that is pertinent to this study, productivity research based on existing and newly developed output data and estimates on informal employment. Total employment for the transport, storage and communications industry

14
Figure 2.1 illustrates total formal employment in the transport, storage and communications industry over a 10 year period. After an initial decline up to 2000, formal employment has risen steadily (represented by the trend line from 2000 to 2005 on the graph), but is still approximately 2% less than the 1996 levels. Figure 2.1: Formal employment growth for the transport, storage and communication industry 1996 – 2005
84
86
88
90
92
94
96
98
100
102
1996 1997 1998 1999 2000 2001 2002 2003 2004 2005
Year
Inde
x
Total formal employment Trend line 2000 - 2005
Trend line 1996 - 2005
1996 1997 1998 1999 2000 2001 2002 2003 2004 2005Scale: Thousands 476.1 450.1 463.7 445.3 432.3 433.6 446.4 441.7 442.2 466.8Source: StatsSA OHS, LFS The following analysis concentrates on the three logical sub-sectors of the industry, i.e. the transport, postal and telecommunications sub-sectors. StatsSA data does not reflect separate storage employment data, storage as a sub-sector is therefore excluded from detailed analysis in this report (refer Figure 1.1). The changes in the distribution of the workforce relative to the three sub-sectors over the last decade show that only the transport sub-sector grew to levels higher than a decade ago. By 2005, 79% of formal employment in the sector was in transport indicating its importance. This sub-sector therefore receives the most attention in this study.

15
Figure 2.2: Formal employment in the transport, postal and telecommunications sub-sectors 1996 – 2005
0
20
40
60
80
100
120
1996 1997 1998 1999 2000 2001 2002 2003 2004 2005
Year
Inde
x TransportPostalTelecom
2005 Distribution
Source: StatsSA OHS and LFS The telecommunications sub-sector in South Africa has shown considerable growth, especially in terms of technology concomitant with global improvements in communication technology such as enhanced bandwidth and broadband, wireless technology and fixed wire/wireless and voice/data conversion. South Africa’s transport sub-sector benefits less from global improvements and are experiencing serious congestion, cost and capacity challenges. This situation might explain why transport employment growth is faster than for the other two sub-sectors where automation is more prevalent. Postal employment is declining as a result of the declining demand for postal services in the new technological era. Advances in postal technology are classified in the telecommunications sub-sector and sometimes even in the business services group of the SIC classification system leaving the postal sub-sector with a declining employee base. Many of the service components of postal services (e.g. hardware and software supplied for faxing, video conferencing, etc.) is also excluded from the SIC code and included in other groups further explaining the declining nature of the sub-sector. The Transport Sub-sector As the transport sub-sector has the largest overall employment, it was decided to disaggregate the figure for this sub-sector further (refer Figure 2.3). South Africa’s relatively low maritime presence (due to the absence of a national flag carrier) and the decline in domestic coastal shipping are also evident in employee numbers for this sub-sector. The remainder of the transport sub-sector employment growth is in air transport employment, with surface transport employment (road, rail, pipeline) remaining flat.
Scale: Thousands 1996 1997 1998 1999 2000 2001 2002 2003 2004 2005Transport 340.0 356.3 359.9 336.9 327.1 330.3 323.3 336.3 355.4 368.8Postal 49.4 48.5 21.6 28.5 31.8 28.5 45.1 35.8 35.8 27.1Telecom 82.2 45.3 82.3 80.0 73.3 74.9 78.1 69.6 60.9 70.9
Transport 36879%
Postal27.16%
Telecom70.915%

16
Figure 2.3: Formal employment distribution - air, water and surface transport, 1996-2005
020406080
100120140160180
1996
1997
1998
1999
2000
2001
2002
2003
2004
2005
Year
Inde
x Water
Air
Surface
2005 Distribution
Scale: Thousands 1996 1997 1998 1999 2000 2001 2002 2003 2004 2005Water 14.4 23.6 13.1 17.2 11.7 15.5 20.1 8.0 18.4 4.5Air 20.6 33.6 25.2 25.4 18.8 18.4 21.1 22.5 24.3 24.6Surface 273.1 274.5 272.2 245.6 263.9 245.6 232.0 240.2 247.2 274.8
Source: StatsSA OHS and LFS The Transport Sub-sector by mode As discussed earlier, official statistics distinguish between modes rather than utilities (passenger and freight transport). In this section passenger and freight transport is aggregated per mode and analyzed. Figure 2.4: Formal employment distribution by surface transport mode (rail, road and pipeline) 1996-2005
020406080
100120140160180200
1996
1997
1998
1999
2000
2001
2002
2003
2004
2005
Inde
x
Rail
Road
Pipeline
2005 Distribution
Scale: Thousands 1996 1997 1998 1999 2000 2001 2002 2003 2004 2005Rail 74.8 57.1 70.4 66.1 64.2 72.4 62.8 67.9 57.9 48.8Road 183.7 198.2 200.7 179.2 198.9 172.7 167.8 171.8 188.2 225.9Pipeline 1.2 2.11 1.0 1.0 0.3 0.3 1.3 0.4 0.4 0.4
Source: StatsSA OHS and LFS
Rail48.9 17.76%
Road225.982.08%
Pipeline 0.4
0.16%
Water 4.51%
Air 24.6
8%
Surface274.8
91%
17
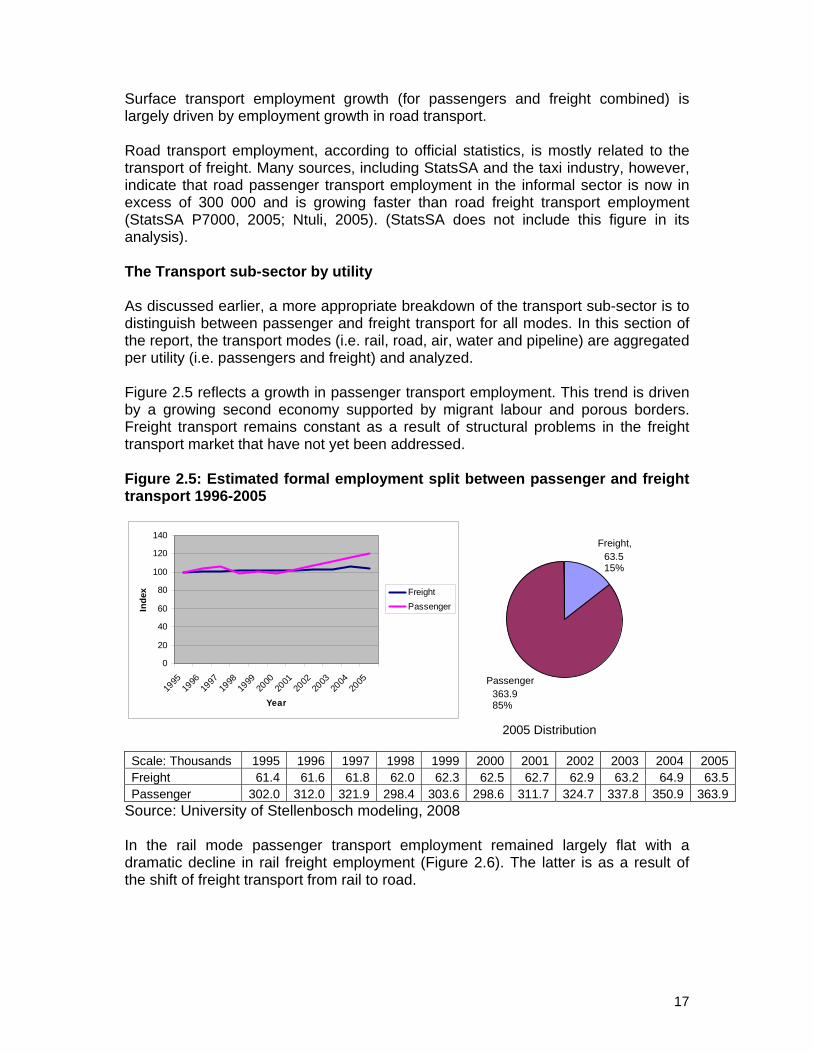
Surface transport employment growth (for passengers and freight combined) is largely driven by employment growth in road transport. Road transport employment, according to official statistics, is mostly related to the transport of freight. Many sources, including StatsSA and the taxi industry, however, indicate that road passenger transport employment in the informal sector is now in excess of 300 000 and is growing faster than road freight transport employment (StatsSA P7000, 2005; Ntuli, 2005). (StatsSA does not include this figure in its analysis). The Transport sub-sector by utility As discussed earlier, a more appropriate breakdown of the transport sub-sector is to distinguish between passenger and freight transport for all modes. In this section of the report, the transport modes (i.e. rail, road, air, water and pipeline) are aggregated per utility (i.e. passengers and freight) and analyzed. Figure 2.5 reflects a growth in passenger transport employment. This trend is driven by a growing second economy supported by migrant labour and porous borders. Freight transport remains constant as a result of structural problems in the freight transport market that have not yet been addressed. Figure 2.5: Estimated formal employment split between passenger and freight transport 1996-2005
0
20
40
60
80
100
120
140
1995
1996
1997
1998
1999
2000
2001
2002
2003
2004
2005
Year
Inde
x FreightPassenger
2005 Distribution
Scale: Thousands 1995 1996 1997 1998 1999 2000 2001 2002 2003 2004 2005Freight 61.4 61.6 61.8 62.0 62.3 62.5 62.7 62.9 63.2 64.9 63.5Passenger 302.0 312.0 321.9 298.4 303.6 298.6 311.7 324.7 337.8 350.9 363.9
Source: University of Stellenbosch modeling, 2008 In the rail mode passenger transport employment remained largely flat with a dramatic decline in rail freight employment (Figure 2.6). The latter is as a result of the shift of freight transport from rail to road.
Freight, 63.5 15%
Passenger 363.985%

18
Figure 2.6: Formal employment split between passenger and freight transport for rail 1996-2005
0
20
40
60
80
100
120
1995
1996
1997
1998
1999
2000
2001
2002
2003
2004
2005
Year
Inde
x Freight
Passenger
2005 Distribution
Scale: Thousands 1995 1996 1997 1998 1999 2000 2001 2002 2003 2004 2005Freight 53.7 51.3 49.0 46.6 42.5 37.6 34.9 33.1 33.5 33.6 31.5Passenger 11.8 11.8 11.8 11.8 11.8 11.8 11.8 11.8 11.8 11.8 11.8
Source: Transnet, 2008 In the road mode freight transport employment remained flat, but passenger employment is growing (Figure 2.7). Figure 2.7: Formal employment split between passenger and freight transport for road 1996-2005
0
20
40
60
80
100
120
140
1995
1996
1997
1998
1999
2000
2001
2002
2003
2004
2005
Inde
x Freight
Passenger
Freight63.515%
Passenger 363.985%
Scale: Thousands 1995 1996 1997 1998 1999 2000 2001 2002 2003 2004 2005Freight 61.4 61.6 61.8 62.0 62.3 62.5 62.7 62.9 63.2 64.9 63.5Passenger 302.0 312.0 321.9 298.4 303.6 298.6 311.7 324.7 337.8 350.9 363.9Source: Transnet, 2008 Growing road passenger employment is driven by the growth experienced in the taxi industry. Freight transport
Freight, 31.5 73%
Passenger, 11.827%
19
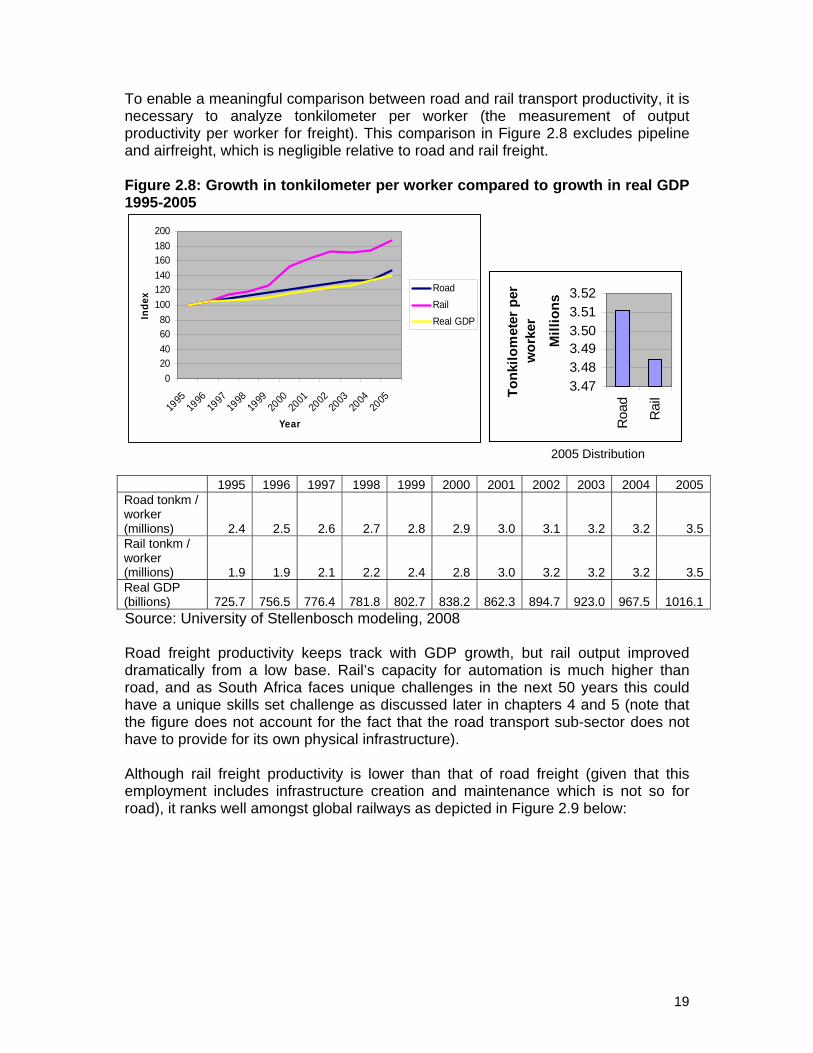
To enable a meaningful comparison between road and rail transport productivity, it is necessary to analyze tonkilometer per worker (the measurement of output productivity per worker for freight). This comparison in Figure 2.8 excludes pipeline and airfreight, which is negligible relative to road and rail freight. Figure 2.8: Growth in tonkilometer per worker compared to growth in real GDP 1995-2005
020406080
100120140160180200
1995
1996
1997
1998
1999
2000
2001
2002
2003
2004
2005
Year
Inde
x RoadRailReal GDP
3.473.483.493.503.513.52
Roa
d
Rai
l
Mill
ions
Tonk
ilom
eter
per
w
orke
r
2005 Distribution
1995 1996 1997 1998 1999 2000 2001 2002 2003 2004 2005Road tonkm / worker (millions) 2.4 2.5 2.6 2.7 2.8 2.9 3.0 3.1 3.2 3.2 3.5Rail tonkm / worker (millions) 1.9 1.9 2.1 2.2 2.4 2.8 3.0 3.2 3.2 3.2 3.5Real GDP (billions) 725.7 756.5 776.4 781.8 802.7 838.2 862.3 894.7 923.0 967.5 1016.1Source: University of Stellenbosch modeling, 2008 Road freight productivity keeps track with GDP growth, but rail output improved dramatically from a low base. Rail’s capacity for automation is much higher than road, and as South Africa faces unique challenges in the next 50 years this could have a unique skills set challenge as discussed later in chapters 4 and 5 (note that the figure does not account for the fact that the road transport sub-sector does not have to provide for its own physical infrastructure). Although rail freight productivity is lower than that of road freight (given that this employment includes infrastructure creation and maintenance which is not so for road), it ranks well amongst global railways as depicted in Figure 2.9 below:
20
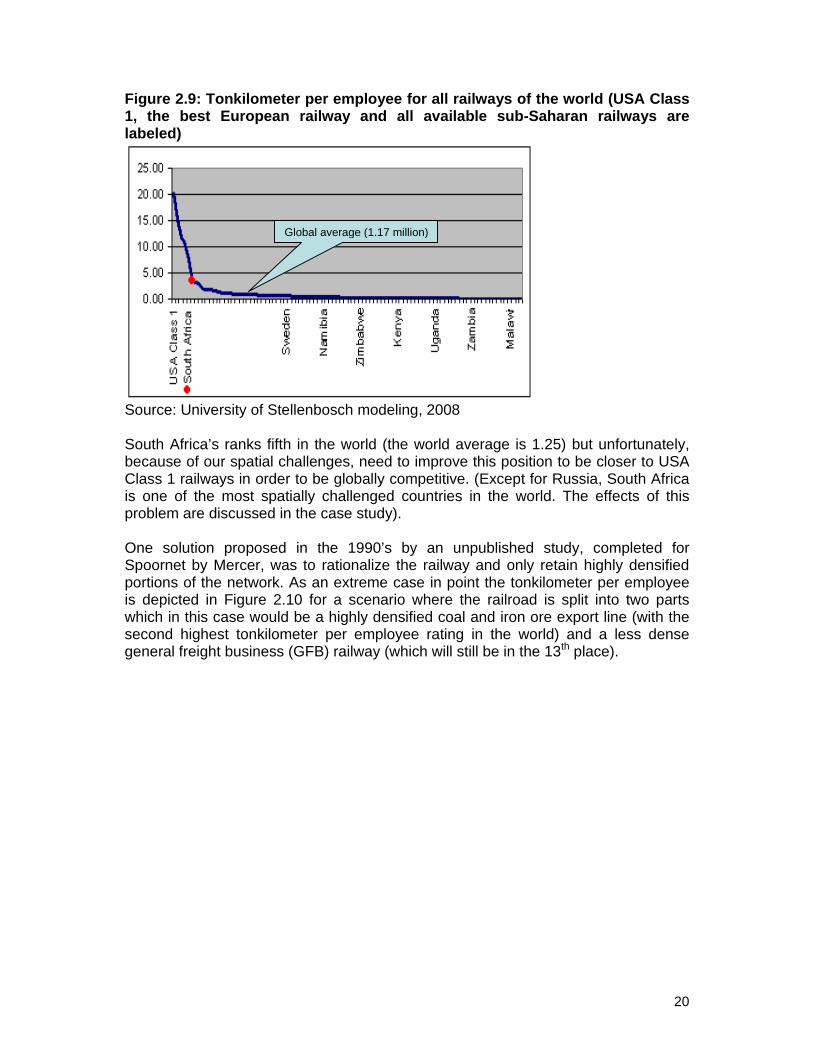
Figure 2.9: Tonkilometer per employee for all railways of the world (USA Class 1, the best European railway and all available sub-Saharan railways are labeled)
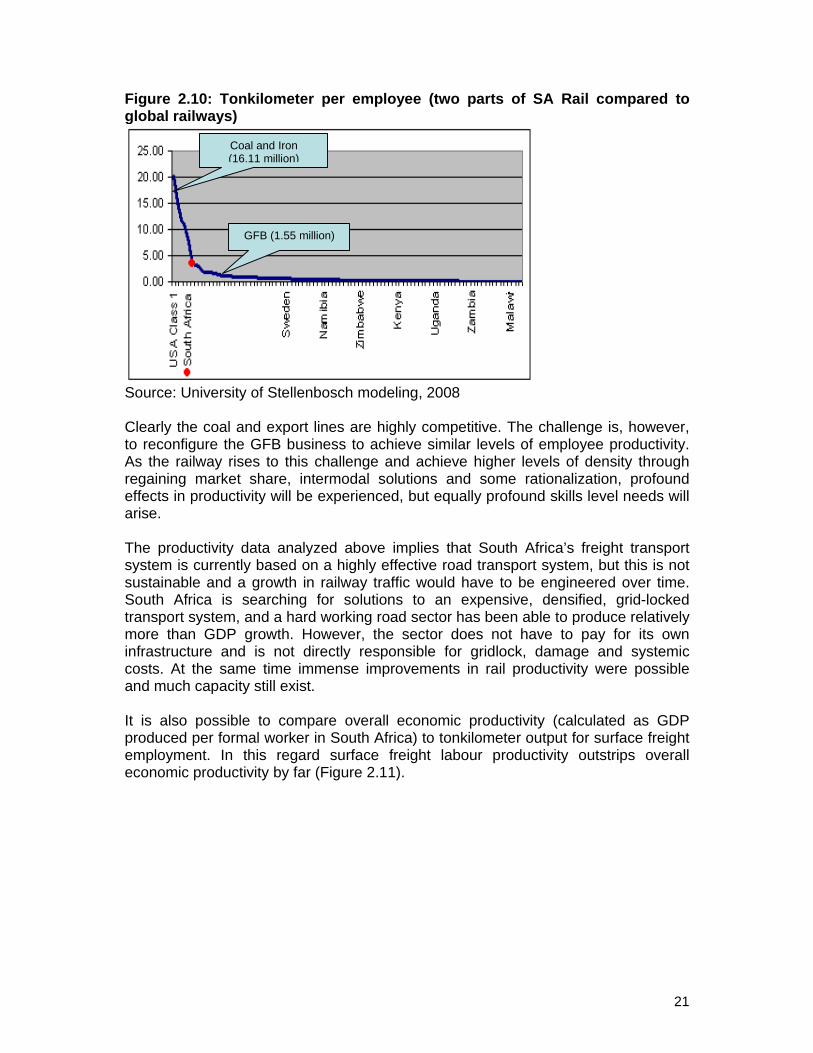
Source: University of Stellenbosch modeling, 2008 South Africa’s ranks fifth in the world (the world average is 1.25) but unfortunately, because of our spatial challenges, need to improve this position to be closer to USA Class 1 railways in order to be globally competitive. (Except for Russia, South Africa is one of the most spatially challenged countries in the world. The effects of this problem are discussed in the case study). One solution proposed in the 1990’s by an unpublished study, completed for Spoornet by Mercer, was to rationalize the railway and only retain highly densified portions of the network. As an extreme case in point the tonkilometer per employee is depicted in Figure 2.10 for a scenario where the railroad is split into two parts which in this case would be a highly densified coal and iron ore export line (with the second highest tonkilometer per employee rating in the world) and a less dense general freight business (GFB) railway (which will still be in the 13th place).
Global average (1.17 million)
21
Figure 2.10: Tonkilometer per employee (two parts of SA Rail compared to global railways)
Source: University of Stellenbosch modeling, 2008 Clearly the coal and export lines are highly competitive. The challenge is, however, to reconfigure the GFB business to achieve similar levels of employee productivity. As the railway rises to this challenge and achieve higher levels of density through regaining market share, intermodal solutions and some rationalization, profound effects in productivity will be experienced, but equally profound skills level needs will arise. The productivity data analyzed above implies that South Africa’s freight transport system is currently based on a highly effective road transport system, but this is not sustainable and a growth in railway traffic would have to be engineered over time. South Africa is searching for solutions to an expensive, densified, grid-locked transport system, and a hard working road sector has been able to produce relatively more than GDP growth. However, the sector does not have to pay for its own infrastructure and is not directly responsible for gridlock, damage and systemic costs. At the same time immense improvements in rail productivity were possible and much capacity still exist. It is also possible to compare overall economic productivity (calculated as GDP produced per formal worker in South Africa) to tonkilometer output for surface freight employment. In this regard surface freight labour productivity outstrips overall economic productivity by far (Figure 2.11).
GFB (1.55 million)
Coal and Iron (16.11 million)

22
Figure 2.11: Growth in tonkilometer per worker compared to growth in real GDP per worker 1995-2005
020406080
100120140160180200
1995
1996
1997
1998
1999
2000
2001
2002
2003
2004
2005
Year
Inde
x RoadRailReal GDP per worker
Scale: Millions 1995 1996 1997 1998 1999 2000 2001 2002 2003 2004 2005Road 2.4 2.5 2.6 2.7 2.8 2.9 3.0 3.1 3.2 3.2 3.5Rail 1.9 1.9 2.1 2.2 2.4 2.8 3.0 3.2 3.2 3.2 3.5GDP per worker 0.08 0.08 0.09 0.08 0.08 0.07 0.08 0.08 0.08 0.08 0.09
Source: University of Stellenbosch modeling, 2008 This behaviour is caused by three drivers, i.e. the capacity to improve, opportunities to rationalize labour and the drive to exploit opportunities in a spatially challenged economy. Passenger transport The following section addresses passenger transport. In contrast to freight transport, passenger transport employment output is growing slower than GDP (Figure 2.12). Figure 2.12: Growth in passenger journeys per worker compared to growth in real GDP 1995-2005
020406080
100120140160
1995
1997
1999
2001
2003
2005
Year
Inde
x
Short distance (Metrorail and Taxi)
Long distance (Rail andAir)
Real GDP
010203040506070
Sho
rtdi
stan
ce
Long
dist
ance
Thou
sand
s
Pas
seng
er jo
urne
ys p
er
wor
ker
2005 Distribution
1995 1996 1997 1998 1999 2000 2001 2002 2003 2004 2005Short (thousands) 51.6 53.1 56.7 55.6 56.1 56.0 53.8 53.6 56.7 58.1 59.6
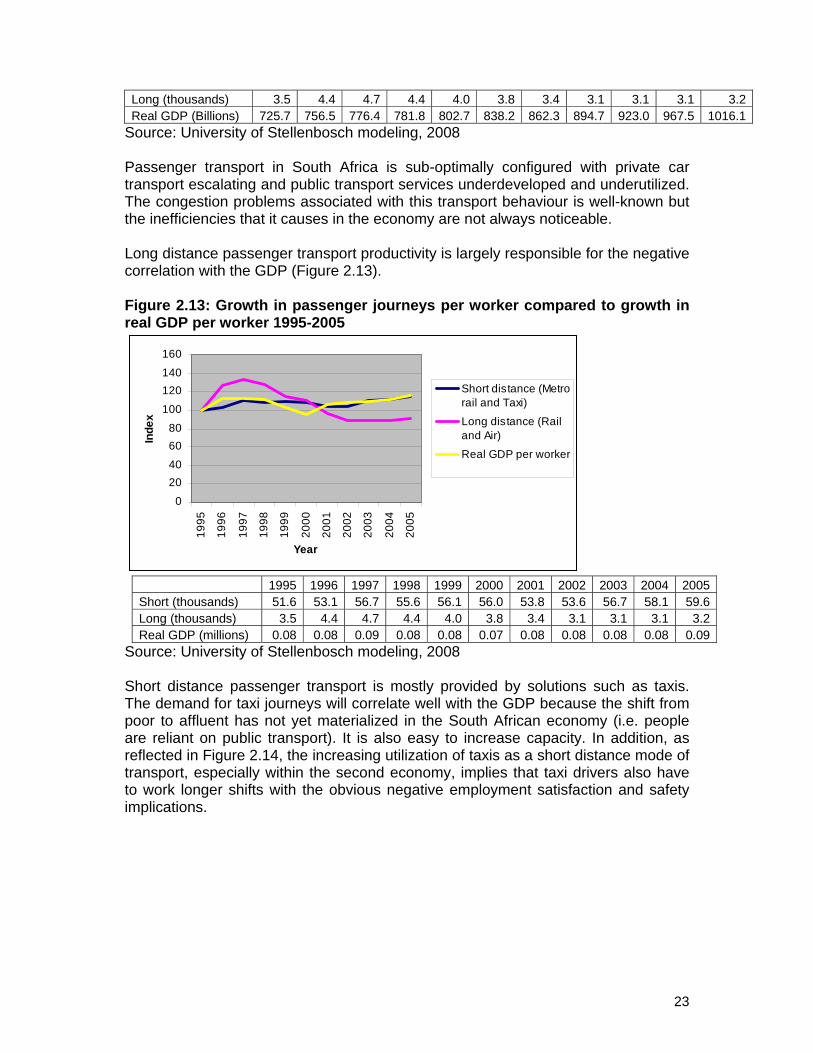
23
Long (thousands) 3.5 4.4 4.7 4.4 4.0 3.8 3.4 3.1 3.1 3.1 3.2Real GDP (Billions) 725.7 756.5 776.4 781.8 802.7 838.2 862.3 894.7 923.0 967.5 1016.1
Source: University of Stellenbosch modeling, 2008 Passenger transport in South Africa is sub-optimally configured with private car transport escalating and public transport services underdeveloped and underutilized. The congestion problems associated with this transport behaviour is well-known but the inefficiencies that it causes in the economy are not always noticeable. Long distance passenger transport productivity is largely responsible for the negative correlation with the GDP (Figure 2.13). Figure 2.13: Growth in passenger journeys per worker compared to growth in real GDP per worker 1995-2005
0
2040
6080
100
120140
160
1995
1996
1997
1998
1999
2000
2001
2002
2003
2004
2005
Year
Inde
x
Short distance (Metrorail and Taxi)
Long distance (Railand Air)
Real GDP per worker
1995 1996 1997 1998 1999 2000 2001 2002 2003 2004 2005Short (thousands) 51.6 53.1 56.7 55.6 56.1 56.0 53.8 53.6 56.7 58.1 59.6Long (thousands) 3.5 4.4 4.7 4.4 4.0 3.8 3.4 3.1 3.1 3.1 3.2Real GDP (millions) 0.08 0.08 0.09 0.08 0.08 0.07 0.08 0.08 0.08 0.08 0.09
Source: University of Stellenbosch modeling, 2008 Short distance passenger transport is mostly provided by solutions such as taxis. The demand for taxi journeys will correlate well with the GDP because the shift from poor to affluent has not yet materialized in the South African economy (i.e. people are reliant on public transport). It is also easy to increase capacity. In addition, as reflected in Figure 2.14, the increasing utilization of taxis as a short distance mode of transport, especially within the second economy, implies that taxi drivers also have to work longer shifts with the obvious negative employment satisfaction and safety implications.

24
Figure 2.14: Mode comparison between metro rail and taxi short distance transport 1995-2005
020406080
100120140
1995
1997
1999
2001
2003
2005
Year
Inde
x Metro Rail
Taxi
0
10
20
30
40
50
Metro Rail Taxi
Thou
sand
s
Pas
seng
ers
trans
porte
d
2005 Distribution
Scale: Thousands 1995 1996 1997 1998 1999 2000 2001 2002 2003 2004 2005Metro Rail 42.0 43.4 47.0 45.9 46.4 46.3 44.1 44.0 45.5 46.5 47.6Taxi 9.7 9.7 9.7 9.7 9.7 9.7 9.7 9.7 11.2 11.6 12.0
Source: University of Stellenbosch modeling, 2008 For long distance transport the rail solution is close to collapse and more and more people use private cars for long distance travel. Air travel employment productivity as depicted by passenger journeys by worker remains constant (Figure 2.15). Figure 2.15: Growth in long distance passenger journeys per worker compared between rail and air 1995-2005
0
50
100
150
200
1995
1996
1997
1998
1999
2000
2001
2002
2003
2004
2005
Year
Inde
x Rail
Air
05
1015202530
Rail Air
Hund
reds
Pas
seng
ers
per w
orke
r
2005 Distribution
Scale: Thousands 1995 1996 1997 1998 1999 2000 2001 2002 2003 2004 2005Rail 2.8 3.8 4.2 3.9 3.5 3.3 2.9 2.6 2.6 2.5 2.6Air 0.7 0.6 0.5 0.6 0.5 0.5 0.5 0.5 0.5 0.5 0.5
Source: University of Stellenbosch modeling, 2008 Air passenger transport productivity improvements are technologically difficult given the complexities of the industry. Aircraft sizes remain the same and the same crew size is required.
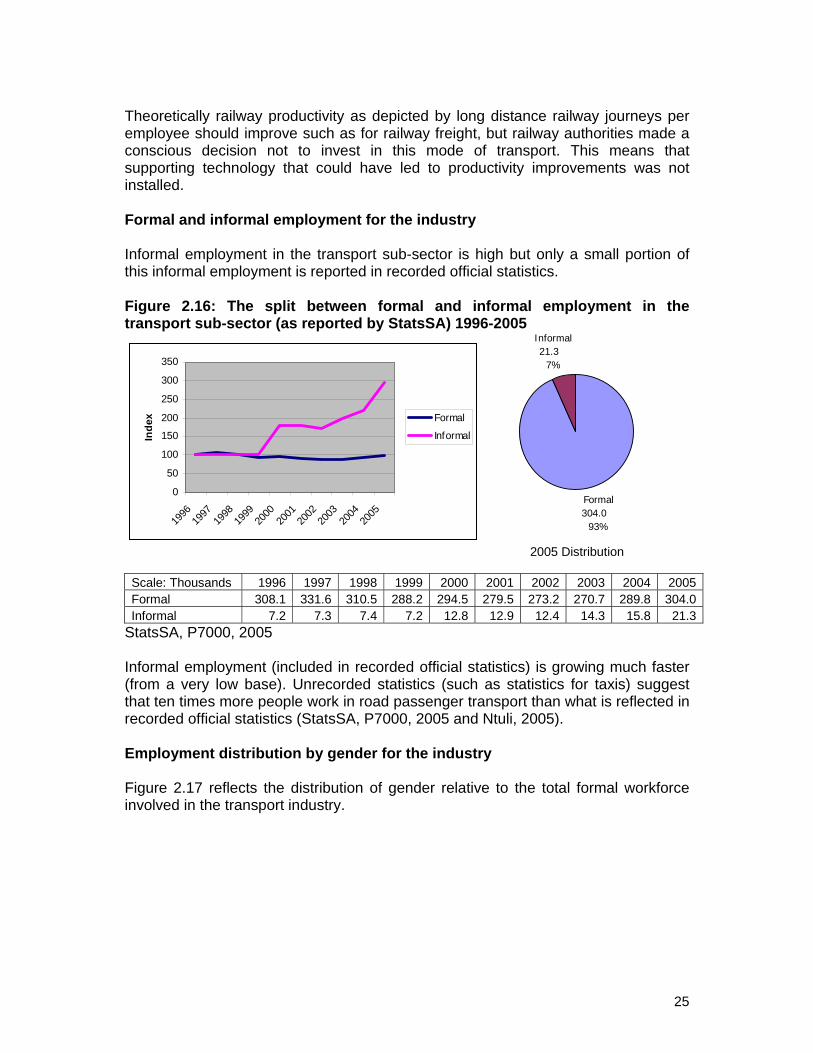
25
Theoretically railway productivity as depicted by long distance railway journeys per employee should improve such as for railway freight, but railway authorities made a conscious decision not to invest in this mode of transport. This means that supporting technology that could have led to productivity improvements was not installed. Formal and informal employment for the industry Informal employment in the transport sub-sector is high but only a small portion of this informal employment is reported in recorded official statistics. Figure 2.16: The split between formal and informal employment in the transport sub-sector (as reported by StatsSA) 1996-2005
0
50
100
150
200
250
300
350
1996
1997
1998
1999
2000
2001
2002
2003
2004
2005
Inde
x Formal
Informal
2005 Distribution
Scale: Thousands 1996 1997 1998 1999 2000 2001 2002 2003 2004 2005Formal 308.1 331.6 310.5 288.2 294.5 279.5 273.2 270.7 289.8 304.0Informal 7.2 7.3 7.4 7.2 12.8 12.9 12.4 14.3 15.8 21.3
StatsSA, P7000, 2005 Informal employment (included in recorded official statistics) is growing much faster (from a very low base). Unrecorded statistics (such as statistics for taxis) suggest that ten times more people work in road passenger transport than what is reflected in recorded official statistics (StatsSA, P7000, 2005 and Ntuli, 2005). Employment distribution by gender for the industry Figure 2.17 reflects the distribution of gender relative to the total formal workforce involved in the transport industry.
Informal21.3
7%
Formal 304.0
93%
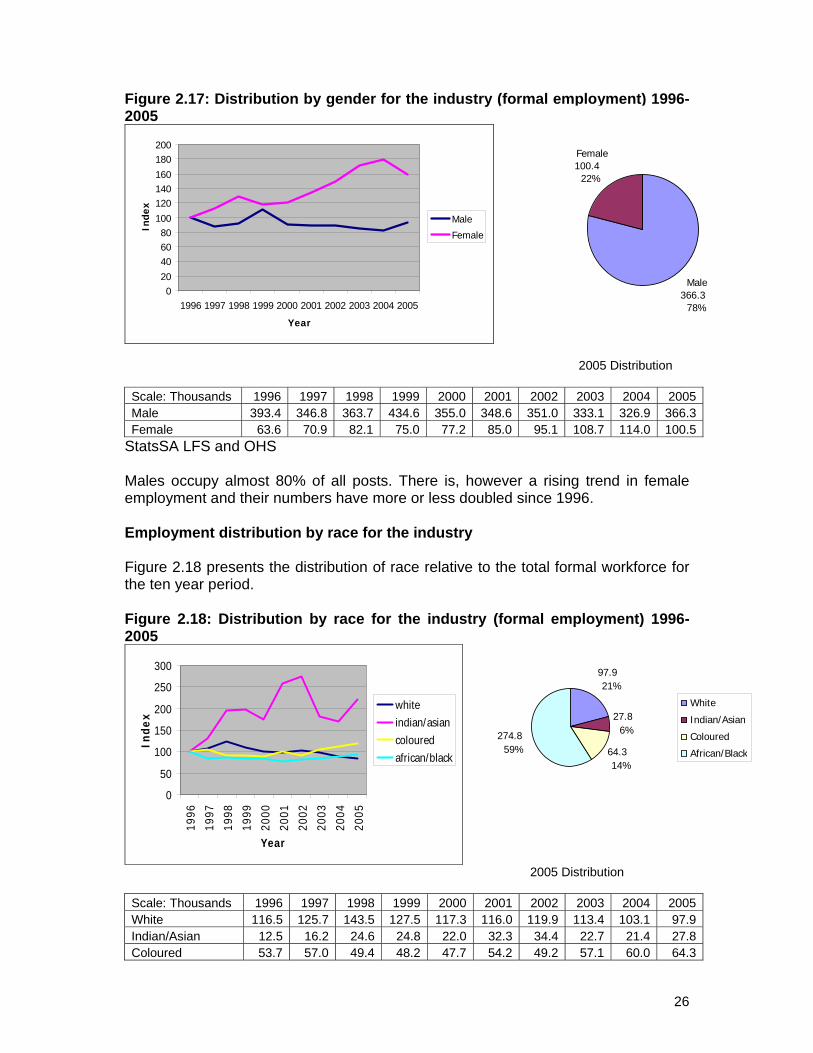
26
Figure 2.17: Distribution by gender for the industry (formal employment) 1996-2005
020406080
100120140160180200
1996 1997 1998 1999 2000 2001 2002 2003 2004 2005
Year
Inde
x
Male
Female
2005 Distribution
Scale: Thousands 1996 1997 1998 1999 2000 2001 2002 2003 2004 2005Male 393.4 346.8 363.7 434.6 355.0 348.6 351.0 333.1 326.9 366.3Female 63.6 70.9 82.1 75.0 77.2 85.0 95.1 108.7 114.0 100.5
StatsSA LFS and OHS Males occupy almost 80% of all posts. There is, however a rising trend in female employment and their numbers have more or less doubled since 1996. Employment distribution by race for the industry Figure 2.18 presents the distribution of race relative to the total formal workforce for the ten year period. Figure 2.18: Distribution by race for the industry (formal employment) 1996-2005
0
50
100
150
200
250
300
1996
1997
1998
1999
2000
2001
2002
2003
2004
2005
Year
Inde
x
whiteindian/asiancolouredafrican/black
2005 Distribution
Scale: Thousands 1996 1997 1998 1999 2000 2001 2002 2003 2004 2005White 116.5 125.7 143.5 127.5 117.3 116.0 119.9 113.4 103.1 97.9Indian/Asian 12.5 16.2 24.6 24.8 22.0 32.3 34.4 22.7 21.4 27.8Coloured 53.7 57.0 49.4 48.2 47.7 54.2 49.2 57.1 60.0 64.3
Male366.3
78%
Female 100.4
22%
97.9 21%
27.8 6%
64.3 14%
274.859%
White
Indian/Asian
Coloured
African/Black

27
African/Black 292.9 251.2 252.2 244.2 244.8 229.1 241.6 248.6 257.8 274.8StatsSA LFS and OHS Africans/Blacks account for more than half of the workforce, followed by Whites, Coloureds and Indian/Asians. Transformation remains a clear challenge as it is still not representative of the demographics of the country. Employment distribution by age for the industry Figure 2.19 presents the average age of the formal workforce distributed across the age categories over the 10 year period. Figure 2.19: Average distribution of age for the industry (formal sector)
0%
2%
4%
6%
8%
10%
12%
14%
16%
18%
Ave
rage
age
as
% o
f tot
al w
orkf
orce
Series1 1% 8% 15% 17% 16% 15% 12% 9% 5% 1%
Age between 15 and 19
Age between 20 and 24
Age between 25 and 29
Age between 30 and 34
Age between 35 and 39
Age between 40 and 44
Age between 45 and 49
Age between 50 and 54
Age between 55 and 59
Age between 60 and 64
Source: StatsSA OHS and LFS From Figure 2.19 it is clear that the formal workforce is aging with close to two thirds on average being older than 35 years of age if calculating an average age over the ten year period. Of these an average of over 40% are older than 40 and the remaining portion is between 35 and 39 years old. However, as depicted below, this trend is changing and by 2003 a turning point was established.

28
Figure 2.20: Average distribution of age for the industry (formal sector) 1995-2005
0
20
40
60
80
100
120
140
1996
1997
1998
1999
2000
2001
2002
2003
2004
2005
Inde
x Younger than 4040 and older
2005 Distribution
Scale: Thousands 1996 1997 1998 1999 2000 2001 2002 2003 2004 2005Younger than 40 207 167 188 183 235 246 269 248 267 27240 and older 160 142 152 147 197 184 177 194 175 191
StatsSA LFS and OHS The workforce is now progressively getting younger but with the resulting loss of skills, knowledge and experience. Skills bands for selected occupational categories in the industry Skills bands have been identified in accordance with the NQF framework. These are demonstrated below. Table 2.1: Three Skills Bands and the National Qualifications Framework NQF Level Education level Skills Band
1 Grade 9 2 Grade 10 3 Grade 11
Entry-level skill (low skill) (Pre-Matric)
4 Grade 12
5 College and Technicon National Certificates and Diplomas
Intermediate skill (matric, plus: post-school, pre-degree qualifications)
6 University Degree 7 Honours and Masters
Degrees 8 Doctorate
Degree
High skill (Equivalent to a higher education degree and post-graduate courses)
(Source: Kraak, HSRC, 2004) The data drawn from the OHS and LFS surveys indicates that half of the collective workforce holds less than a Grade 12 certificate (i.e. half of the employees have not completed matric), whilst 44% presents a Grade 12 certificate and/or a College
Younger
than 40272
59%
40 and older190
41%
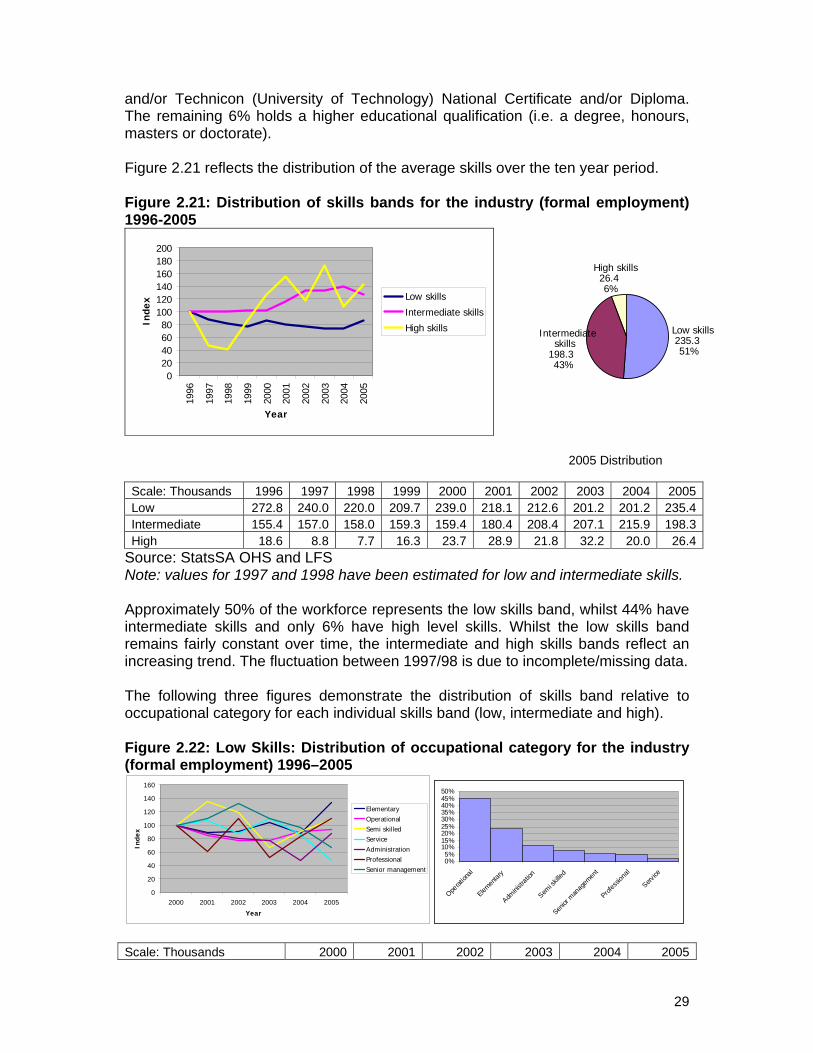
29
and/or Technicon (University of Technology) National Certificate and/or Diploma. The remaining 6% holds a higher educational qualification (i.e. a degree, honours, masters or doctorate). Figure 2.21 reflects the distribution of the average skills over the ten year period. Figure 2.21: Distribution of skills bands for the industry (formal employment) 1996-2005
020406080
100120140160180200
1996
1997
1998
1999
2000
2001
2002
2003
2004
2005
Year
Inde
x Low skills
Intermediate skills
High skills
2005 Distribution
Scale: Thousands 1996 1997 1998 1999 2000 2001 2002 2003 2004 2005Low 272.8 240.0 220.0 209.7 239.0 218.1 212.6 201.2 201.2 235.4Intermediate 155.4 157.0 158.0 159.3 159.4 180.4 208.4 207.1 215.9 198.3High 18.6 8.8 7.7 16.3 23.7 28.9 21.8 32.2 20.0 26.4
Source: StatsSA OHS and LFS Note: values for 1997 and 1998 have been estimated for low and intermediate skills. Approximately 50% of the workforce represents the low skills band, whilst 44% have intermediate skills and only 6% have high level skills. Whilst the low skills band remains fairly constant over time, the intermediate and high skills bands reflect an increasing trend. The fluctuation between 1997/98 is due to incomplete/missing data. The following three figures demonstrate the distribution of skills band relative to occupational category for each individual skills band (low, intermediate and high). Figure 2.22: Low Skills: Distribution of occupational category for the industry (formal employment) 1996–2005
0
20
40
60
80
100
120
140
160
2000 2001 2002 2003 2004 2005
Year
Inde
x
ElementaryOperationalSemi skilledServiceAdministrationProfessionalSenior management
0%5%
10%15%20%25%30%35%40%45%50%
Operat
ional
Elemen
tary
Adminis
tratio
n
Semi sk
illed
Senior
man
agem
ent
Profes
siona
l
Service
Scale: Thousands 2000 2001 2002 2003 2004 2005
Low skills235.351%
Intermediate skills
198.3 43%
High skills 26.4 6%

30
Elementary 40.4 35.9 36.5 42.1 35.4 54.4Operational 112.5 95.5 86.5 86.7 101.3 104.9Semi skilled 16.8 22.8 20.0 11.3 15.1 18.3Service 8.3 8.9 7.2 9.1 7.1 4.0Administration 30.9 27.0 24.9 23.8 14.6 26.9Professional 10.2 6.2 11.1 5.3 8.5 11.2Senior management 19.8 21.8 26.1 21.8 19.2 13.3Source: StatsSA OHS and LFS From the figure above, it is clear that operational employees are the most represented in this group. The second category holding a share in the low skills band is elementary occupations, followed by administration. The representation of professionals and senior management in the low skills band is quite a concern. The latter operates at a very senior level in organizations, and should preferably hold a higher educational qualification. Figure 2.23: Intermediate Skills: Distribution per occupational category for the industry (formal employment) 1996–2005
0
50
100
150
200
250
300
2000 2001 2002 2003 2004 2005
Year
Inde
x
ElementaryOperationalSemi skilledServiceAdministrationProfessionalSenior management
0%5%
10%15%20%25%30%35%
Admini
strati
on
Operat
ional
Profes
siona
l
Senior
man
agem
ent
Service
Elemen
tary
Semi sk
illed
Scale : Thousands 2000 2001 2002 2003 2004 2005Elementary 7.6 9.7 6.3 14.1 20.6 13.8Operational 25.8 22.4 36.5 39.1 40.1 46.1Semi skilled 12.3 14.9 11.8 11.2 15.5 12.9Service 7.6 13.8 10.0 14.3 14.5 14.3Administration 47.5 57.2 72.7 74.0 68.3 58.6Professional 37.6 33.0 37.1 23.7 21.5 27.2Senior management 21.1 30.0 33.2 30.1 34.4 25.5
Source: StatsSA OHS and LFS Administration is most represented in the intermediate skills band, followed by operational employees. The high level of professionals and senior management representation is again a point of concern given that they hold very senior positions. These occupational groups should preferably possess a higher institutional qualification.

31
Figure 2.24: High Skills: Distribution per occupational category for the industry (formal employment) 1996–2005
0102030405060708090
100
2000 2001 2002 2003 2004 2005
Year
Per
cent
Elementary
Operational
Semi skilled
Service
Administration
Professional
Senior management
0%10%
20%30%
40%
50%
60%
Senior
man
agem
ent
Profes
siona
l
Admini
stratio
nServ
ice
Semi sk
illed
Elemen
tary
Operat
ional
No Scale 2000 2001 2002 2003 2004 2005Elementary 1 1324 0 0 0 0Operational 1796 0 1379 592 0 0Semi skilled 359 1162 0 437 0 724Service 1 725 0 1005 0 1176Administration 3368 5673 803 2228 2971 2823Professional 6202 5986 7699 10818 3120 6053Senior management 5577 12291 8246 13983 10535 13650
Source: StatsSA OHS and LFS Senior management as well as professionals are most represented in the high skills band. The fact that the high skills band is represented within occupational categories such as service and semi-skilled occupations, etc. where one would not expect a Higher Education and Training (HET) type of qualification, may be as a result of people holding higher educational qualifications, but occupying a specific lower level occupational category for the sake of being employed. These staff can probably be applied more optimally in organizations, depending on the type of qualifications that they present. SUMMARY Specialization drives sophisticated demand for products and services but the operational skills to execute this demand are extremely low, and are not improving. Added to the specialization of global economies in general, productivity demand for one of South Africa’s scarcest and most expensive commodities, i.e. transport, will be great. Greater productivity can only be achieved by a modal shift, which not only presupposes more operational skills, but also different skills, especially in operations. A further complexity is the movement of channel and value chain power downstream, that will make transport even more complex as “pull” demand management requires different parcel sizes, routes and distribution approaches than “push” demand management. The shift in skills demanded, from a low operational skills base, with a younger work force that has not yet been transformed, will create serious feedstock problems in the next 20 years.
32
CHAPTER 3 - EMPLOYMENT SUPPLY-SIDE FACTORS
This chapter discusses supply-side factors influencing the scarcity of skills in the transport, storage and communications industry.
OVERVIEW Supply-side challenges manifest themselves to a large extent in the mismatch of skills, in so far as the characteristics of the available pool of potential employees do not satisfy labour demand in terms of specific qualifications and skills. This is the result of amongst others: • The debatable quality of training institutions and teaching capital. • Incorrect and/or inappropriate fields of study offered by training institutions. • The lack and/or incompleteness of overarching management information on the
labour market (this is defragmented and incomplete). • The inability of learners to make the transition from school to FET’s, Universities
or Technicons (Universities of Technology). • Insufficient communication and collaboration between enterprises and training
institutions. Studies in the majority of careers in the transport industry can be sourced from a number of accredited service providers. Due to the technical nature of the content of some transport occupations, a person would be required to master a number of entry requirements, but amongst them probably the most important is in most cases, mathematics, science and technology. This chapter presents the supply-side factors influencing and contributing to the perceived shortage of transport sector employees. A statistical analysis investigates the supply of students through schools, the supply of trained potential employees from further education and training (FET) institutions as well as from higher education and training (HET) institutions. In addition, the effect of immigration and emigration is also investigated. The LFS was also analyzed to determine if possible migration trends between national sectors could be established. In the extraction of relevant data on “previous occupation” no statistics were available. It could therefore not be determined if inter-sector migration has a positive or negative impact on the transport sector. THE STATUS QUO Secondary education While approximately 25% of South Africa’s budget is awarded to education, some schools still lack basic services, learning materials and teachers (SAPA, 2007; The Presidency, 2007). The education system is where it all starts. In order to develop skills that are aligned to economic needs South Africa needs to have well-qualified teachers and a school
33
curriculum which adequately prepares pupils for higher education and employment. Neither of these requirements are met at present (Daniels, 2007; Skills and Vacancies project, 2006). Dennis Dykes, a senior economist at Nedbank, argues that the quality of South Africa’s grade 12’s is not acceptable in a global context and could have negative effects on the economy. Dykes’ sentiments are echoed by Salim Vally, a Senior Researcher at the University of the Witwatersrand’s Education Policy Unit, who also argues that the high number of grade 12’s with only senior certificates churned out annually is troubling, given the levels of unemployment (Skills and Vacancies project, 2006). A recent reply (July 2006) to a Democratic Alliance parliamentary question revealed that a substantial number of South Africa’s public school teachers are under-qualified. Currently, 12 000 out of the 287 000 public school teachers only have a grade 12 certificate (6 040) or a Standard 8 and two years training (6 053). Only 33 000 teachers or 11.6% have a postgraduate degree (Skills and Vacancies project, 2006). More alarming is that, although the total number of school teachers increased from 256 000 in 2004 to 287 000 in 2005 (an increase of 31 000), the percentage of teachers with just a grade 12 - the lowest qualification - has also increased (from 1.8% to 2.1%) while the percentage of teachers with postgraduate qualifications – the highest qualification - has declined (from 12.4% to 11.6%) (Skills and Vacancies project, 2006). Speaking in Pretoria in June 2005, Education Minister Naledi Pandor said that there were not enough jobs being created to provide employment for young people and there are not enough training opportunities to meet their needs. Many school leavers, however, do not have marketable skills or training opportunities, meaning that, while young people suffer debilitating unemployment, there are half a million job vacancies that cannot be filled (Pandor, 2005; SAPA, 2007). A 2005 JCP International research document entitled “Employment Trends in South Africa” found that grade 12-level unemployment rates had risen from 25% to 40% since 1995 and tertiary-level unemployment rates from 6% to 15%. A study, “The Post-Apartheid South African Labour Market” published by the Development Policy Research Unit at the University of Cape Town in April 2005, showed that the unemployment rate of “degreed African and white workers” had increased from 18 000 in 1995 to more than 44 000 in 2005 (Skills and Vacancies project, 2006). Where it all starts: grade 12 pass rates The grade 12 pass-rate is important as it is the trigger of the supply chain pertaining to the skills sets required to address the skills shortage not only in the transport sector, but also on a national basis. Figure 3.1 reflects the percentage of grade 12’s that wrote and passed the senior certificate exam between 1994 and 2006.
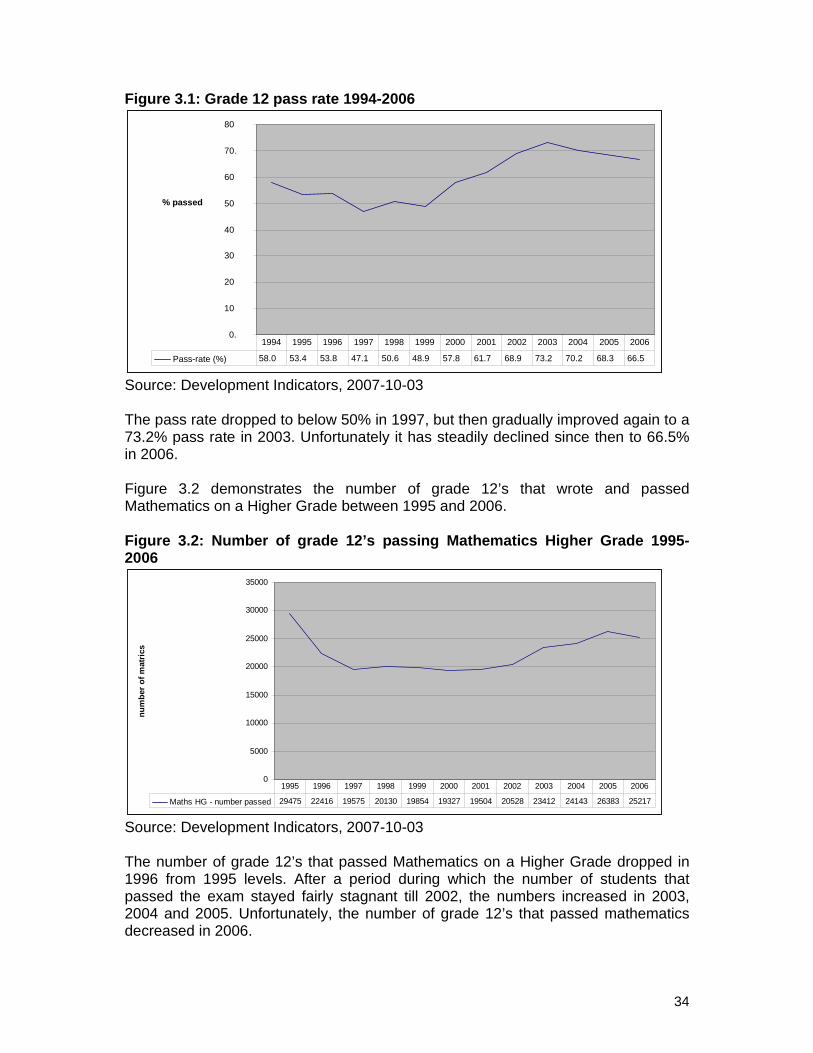
34
Figure 3.1: Grade 12 pass rate 1994-2006
Source: Development Indicators, 2007-10-03 The pass rate dropped to below 50% in 1997, but then gradually improved again to a 73.2% pass rate in 2003. Unfortunately it has steadily declined since then to 66.5% in 2006. Figure 3.2 demonstrates the number of grade 12’s that wrote and passed Mathematics on a Higher Grade between 1995 and 2006. Figure 3.2: Number of grade 12’s passing Mathematics Higher Grade 1995-2006
0
5000
10000
15000
20000
25000
30000
35000
num
ber o
f mat
rics
Maths HG - number passed 29475 22416 19575 20130 19854 19327 19504 20528 23412 24143 26383 25217
1995 1996 1997 1998 1999 2000 2001 2002 2003 2004 2005 2006
Source: Development Indicators, 2007-10-03 The number of grade 12’s that passed Mathematics on a Higher Grade dropped in 1996 from 1995 levels. After a period during which the number of students that passed the exam stayed fairly stagnant till 2002, the numbers increased in 2003, 2004 and 2005. Unfortunately, the number of grade 12’s that passed mathematics decreased in 2006.
0.
10
20
30
40
50
60
70.
80
% passed
Pass-rate (%) 58.0 53.4 53.8 47.1 50.6 48.9 57.8 61.7 68.9 73.2 70.2 68.3 66.5
1994 1995 1996 1997 1998 1999 2000 2001 2002 2003 2004 2005 2006

35
Trevor Manual mentioned at a post budget seminar in February 2007 that the number of grade 12’s that passed higher grade mathematics in 2006, constitute only 7% of all candidates that wrote and passed grade 12 (Pickworth, 2007). Of these only approximately 3000 were African/Black students (Star, 2007) Table 3.1 demonstrates the number of grade 12’s that wrote and passed Physical Science on a Higher Grade in 2000 and 2005. Table 3.1: Examination results for Physical Science, 2001 and 2005 Year Number of
candidates that wrote exam
Candidates passing subject
Number of candidates that wrote on higher grade
Candidates passing on higher grade
2001 153 847 68.6% 24 280 15.8% Physical Science 2005 181 828 71.1% 45 652 25.1% Source: Shindler, 2004; DoE 2005d (DoL, State of Skills, 2006) The pass rate for Physical Science rose by approximately 3% between 2001 and 2005. However, although candidates passing Physical Science can be considered to be relatively high, the number of students passing on higher grade is very low. A higher grade pass is required for entry into most tertiary engineering and technology training courses. Science, engineering and technology (SET) SET graduates are key skilled workers who support economic growth and investment in social infrastructure. The current rate of graduation in this sector is a reflection of future prospects for the economy. Figure 3.3 demonstrates the percentage of students that graduated in science, engineering and technology related disciplines of study for the period 1994 to 2005.

36
Figure 3.3: SET student pass rate 1994-2005
Source: Development Indicators, 2007-10-03 After an initial decline, followed by a relatively stagnant pass rate, there has been a dramatic improvement in the percentage of students that passed SET-related study fields since 2001, with 2005-levels returning to the 1994 level of 27.8%. FET AND HET SUPPLY Pokroy (date unknown) states that South Africa is suffering from a drastic skills shortage predominantly in the science and technology sectors. Reasons for this include school leavers not becoming engineers or going into the science and technology arena, graduates not furthering their studies in the science and technology arenas and the over supply of university graduates in the social and other sciences with few if any of these being in the required science and technology sectors. Sasol media manager Johan van Rheede stated in 2005 that Sasol needed to bring in skills from overseas for major projects, not because South Africa lacked the relevant skills, but because the quality of those skills was so poor that people would need to be retrained (Skills and Vacancies project, 2006). Speaking at a recent skills conference, the director of the University of Cape Town’s Development Policy Research Unit, Dr Haroon Bhorat, said that the skills shortage in South Africa could be attributed to insufficient technical training at company-level as well as at educational institutions. School learners performed poorly in key study areas, such as mathematics and science. The enrolment of large numbers of students, instead of focusing on the quality of education, exacerbated the problem (Le Roux, 2007). According to Sandra Burmeister, the CEO of Landelahni Recruitment Group, the high level of dropouts at tertiary level is disconcerting.
23.5
24
24.5
25
25.5
26
26.5
27
27.5
28
28.5
% SET graduates
SET graduates (%) 27.8 25 25.2 26 26 25.2 25.7 25.2 26.7 26.9 27 27.8
1994 1995 1996 1997 1998 1999 2000 2001 2002 2003 2004 2005

37
The government’s vision is for colleges to provide alternative opportunities beyond school and enable jobless adults to acquire new skills. Further Education and Training (FET) colleges need to become modern, responsive institutions, differentiated according to national and provincial priorities, with a key role in skills development and high quality vocational programs. This can be achieved by bolstering college resources, reworking courses to respond to skills needs, constructing a coherent framework of qualifications that bridge those offered by schools and higher education, growing participation in FET and improving the performance of both learners and colleges. One concern is that funding will be redistributed away from Higher Education and Training (HET) institutions to FET institutions in favour of further education. The focus on the school-level curriculum has disappointed some who are looking at FET colleges to help South Africa train more skilled workers. FET colleges serve two masters, the education and labour departments. Developing training programs for artisans and other workers who should be trained through the colleges has been left to the labour department and SETA’s whilst the education department is working on making the curriculum it is designing, acceptable to Higher Education South Africa (Hesa), the umbrella body for South Africa’s universities and universities of technology. The mismatch between the activities of the two government departments has perhaps caused more confusion. The problems encountered at primary and secondary educational levels have a direct bearing on what is happening at tertiary level. Higher education can do very little to correct poorly educated school leavers. Half the country’s undergraduate students drop out without completing their degrees and diplomas and only 30% obtain their qualifications within five years of enrolling as first-year students. Inadequate academic preparation and financial difficulties are the two key reasons advanced for the high dropout rate. FET and HET data Data was extracted from several reports and the Higher Education Management Information System (HEMIS) database which reflect the movements and trends of registration and graduation over the past decade pertaining to transport related studies. As information is not available to identify which specific fields of study feeds the transport sector in particular and on an exclusive basis, and accepting that many fields of study probably serve this purpose, the data is a reflection of a variety of disciplines grouped together. Study fields analysed below include these Classification of Education Subject Matter codes (CESM) and FET codes:
0801 Aerospace and Aeronautical Engineering and Technology 0802 Agricultural Engineering and Technology 0803 Automotive Engineering & Technology 0805 Chemical Engineering and Technology 0806 Civil Engineering and Technology 0809 Graphics & Drafting for Engineering & Technology 0810 Engineering Mechanics 0811 Engineering Science 0812 Environmental Engineering & Technology 0817 Marine Engineering and Naval Architecture

38
0819 Mechanical Engineering and Technology 0825 Surveying and Mapping 1106 Transportation
Although the fields of study cover a range of engineering, technology and transport related disciplines, it provides some insight into trends of supply-side factors which influence the levels of shortages experiences in the transport sector. Engineering and Transportation graduates distributed by race and gender Figure 3.4 and Figure 3.5 reflect the number of engineering and transportation students that graduated from universities and technicons (Universities of Technology) by race and gender over the past decade. Figure 3.4: HET Graduates in Engineering and Transportation by race 1996-2005
0
50
100
150
200
250
300
350
400
1996
1997
1998
1999
2000
2001
2002
2003
2004
2005
Nu
mbe
r of
Gra
duat
es
Inde
xed
AfricanColouredIndianWhite
2005 Distribution
1995 1996 1997 1998 1999 2000 2001 2002 2003 2004African 430 495 569 789 739 915 1005 1120 1476 1579Coloured 108 80 102 150 133 158 195 171 189 175Indian 178 210 155 133 237 205 218 233 245 242White 1783 1496 1390 1097 1080 1125 1216 1112 1095 1119
Source: HEMIS The number of African/Black graduates increased the most, followed by Coloureds and then Indian/Asian graduates.
115238%
427 14% 138
4% 371%
1705%
722%
92930%
190 6%
African malesAfrican femalesColoured malesColoured femalesIndian malesIndian femalesWhite malesWhite females

39
Figure 3.5: HET Graduates in Engineering and Transportation by gender 1996-2005
050
100150200
250300
350400
1995
1996
1997
1998
1999
2000
2001
2002
2003
2004
Num
be o
f Gra
duat
es In
dexe
d
Males
Females
2005 Distribution
1995 1996 1997 1998 1999 2000 2001 2002 2003 2004Males 2282 2055 1968 1885 1811 1925 2121 2087 2260 2389Females 217 226 248 284 378 478 513 549 745 726
Source: HEMIS With regards to gender, the number of males graduating has remained relatively stagnant, while there has been a significant increase in the number of females graduating with transport related qualifications. Fields of Study Figure 3.6 reflects the fields of study that contributed to graduate output from universities and technicons over the past decade. Figure 3.6: Fields of study in engineering and transportation 1996–2005
050
100150200250300350400450
1996
1997
1998
1999
2000
2001
2002
2003
2004
2005
Nu
mbe
r o
f S
tud
ent
s In
de
xe
d
MechanicalengineeringMarine engineering
Civil engineering
Chemical engineering
Other
Mechanical engineering
85628%
Marine engineering
502%
Civil engineering
103633%
Chemical engineering
73824%
Other41313%
2005 Distribution
Source: HEMIS
1996 1997 1998 1999 2000 2001 2002 2003 2004 2005Mechanical engineering 872 853 766 631 577 706 695 718 765 856Marine engineering 13 7 26 17 13 25 36 49 51 50Civil engineering 817 747 767 787 731 811 901 886 1043 1036Chemical engineering 554 463 523 351 520 596 575 615 737 738Other 244 210 130 392 353 272 421 364 397 413
115238%
427 14% 138
4% 371%
1705%
722%
92930%
190 6%
African malesAfrican femalesColoured malesColoured femalesIndian malesIndian femalesWhite malesWhite females

40
The most preferred field of study was Civil Engineering and Technology, followed by Mechanical Engineering and Technology and Chemical Engineering and Technology. Between these three fields of study, they produced more than 80% of the engineering and transportation graduate output. Types of qualification Figure 3.7 reflects the types of engineering and transportation qualifications which graduates obtained as output from universities and technicons (Universities of Technology) over the past decade. Figure 3.7: Types of qualifications obtained in engineering and transportation 1996-2005
0
50
100
150
200
250
1996
1997
1998
1999
2000
2001
2002
2003
2004
2005
Num
ber
of S
tud
ents
Ind
exed
DiplomaDegreePostgrad
2005 Distribution
1996 1997 1998 1999 2000 2001 2002 2003 2004 2005Diploma 1157 998 956 1044 872 924 1141 1117 1349 1424Degree 1137 1069 1051 897 969 1131 1141 1164 1231 1268Postgrad 207 215 209 272 353 363 355 356 424 423
Source: HEMIS Diplomas provided for 45% of the qualifications obtained, followed by degrees and then post-graduate qualifications. Attrition rates Table 3.2 reflects the attrition rates in HET institutions, for the period 2000 – 2004. Unfortunately similar data could not be obtained for earlier and later years pertaining to this study. Table 3.2: Attrition rates in HET 2000-2004
Institutions First-time undergraduates
in 2000
Dropped-out by 2004
Graduated by 2004
Not completed by 2004
Universities 38 407 38% 50% 12% Technicons (Universities of
43 484 58% 32% 10%
Diploma142445%
Degree126841%
Postgrad42314%

41
Technology) Distance Education
37 798 71% 9% 20%
Source: The Minister of Education released these figures in a written answer to a question in Parliament, September 2006 It is evident that more students graduate from universities than they do from technicons or distance learning facilities. The high drop-out rate from technicons and distance learning facilities need attention. IMMIGRATION AND EMIGRATION Figure 3.8 reflects the influx and exodus of transport and communications occupations as provided by StatsSA. It is assumed that most of the relevant migration figures are embedded in die broader categories for professionals and managers. StatsSA has also recognized the possibility of statistics supplied for migration may be underestimated by as much as 57%. Figure 3.8: Transport and communication migration 1996-2002
0
50
100
150
200
250
300
350
1996 1997 1998 1999 2000 2001 2002
Num
ber
of
peo
ple
ind
exe
d
ImmigrationEmigration
2005 Distribution
1996 1997 1998 1999 2000 2001 2002Immigration 18 19 8 25 5 3 5Emigration 23 34 43 32 67 53 54Source: StatsSA, Tourism and migration 1994-1996 (report 03-51-01) and documented migration (Report 03-51-03) In some instances, especially since the start of the new millennium, the number of people leaving the country seems to be up to ten times more than those that enter. However, as previously mentioned, it is believed that most of the transport specific professions are perhaps embedded in general immigration and emigration statistics. Figure 3.9 provides more information on trends associated with professionals and managerial/administrative occupational movement in the transport, storage and communications industry.
Immigration5
8%
Emigration54
92%

42
Figure 3.9: Professional and Managerial/Administrative migration 1996-2002
020406080
100120140160180
1996 1997 1998 1999 2000 2001 2002
Nu
mb
er
of
peo
ple
ind
exe
d Immigration :professionals
Immigration :managarial andadminEmigration :professionals
Emigration :managarial andadmin
2005 Distribution
1996 1997 1998 1999 2000 2001 2002Immigration : professionals 843 551 449 378 331 524 576Immigration : managerial and admin 461 418 424 258 241 258 382Emigration : professionals 1970 1924 1968 1855 2439 2929 2689Emigration : managerial and admin 737 703 787 680 891 954 1146
Source: StatsSA, Tourism and migration 1994-1996 (report 03-51-01) and documented migration (Report 03-51-03) In some instances the number of people emigrating is up to four times more than those entering the country. It is also noted that official figures apparently do not record all emigration. A study by the University of Cape Town found that between 1989 and 1997 more than 233 000 people emigrated to the five most common destinations. This was nearly three times the official figure, apparently including those leaving under the pretext of temporary visits. LIFE EXPECTANCY One other factor that needs to be noted and which impacts the availability of future skills is HIV/AIDS and the negative population growth rate prevalent in the country today. Figure 3.10 demonstrates present life expectancy (LE) rates in average expected age obtained from StatsSA and the Actuarial Society of South Africa (ASSA).
57612%
3828%
268956%
114624% Immigration :
professionals
Immigration :managarial and admin
Emigration :professionals
Emigration : managarialand admin

43
Figure 3.10: Life expectancy (RSA) 2001-2007
44
46
48
50
52
54
56
58
2001 2002 2003 2004 2005 2006 2007
Ave
rag
e a
ge
MaleFemale
Age: years 2001 2002 2003 2004 2005 2006 2007Male 52.1 51.4 50.8 50.2 50 49 48.4Female 57.2 56.3 55.3 54.4 54 52.5 51.6
Source: Source: Development Indicators, 2007-10-03 The life expectancy is declining rapidly. Presently males are expected to live to 48 and females to 51. The tragedy of these statistics is that it is not due to a lowering of the birth rate but rather due to a massive increase in the death rate. This has a significant effect on the economy as many of the people that are dying are in the economically active age bracket. The impact on skills development is two-fold. Firstly, skilled workers are being lost to the pandemic and thus the pool of workers is shrinking. Secondly, companies may become more hesitant to invest in training and development as the number of trained workers lost to HIV/Aids increase (DTI, 2006). VACANCY RATES In general, it is difficult to calculate skills shortages. For there to be a shortage, it is necessary for the demand for a particular type of worker to exceed the supply of such workers, but the concepts of supply and demand are in themselves problematic enough. It is necessary to draw on a range of indicators, perhaps the most important of which is the time it takes to fill vacancies for the skill in question (Richardson, 2006). Transport sector (HSRC Vacancy Study) A study concluded by the HSRC on the advertisement of vacancies over the past three years provided the following information related to selected transport occupations:
Table 3.3: Selected vacancy data Period
04/04 – 03/05 Period
04/05 – 03/06 Period
04/06 – 03/07
Total Occupation OFO code No. of vacancies advertised
Supply and distribution managers (skill level 5) 1336 107 223 158 488
Transport Service Managers (skill level 4) 1494 7 12 8 27
Air Transport Professionals (skill level 5) 2311 28 24 35 87
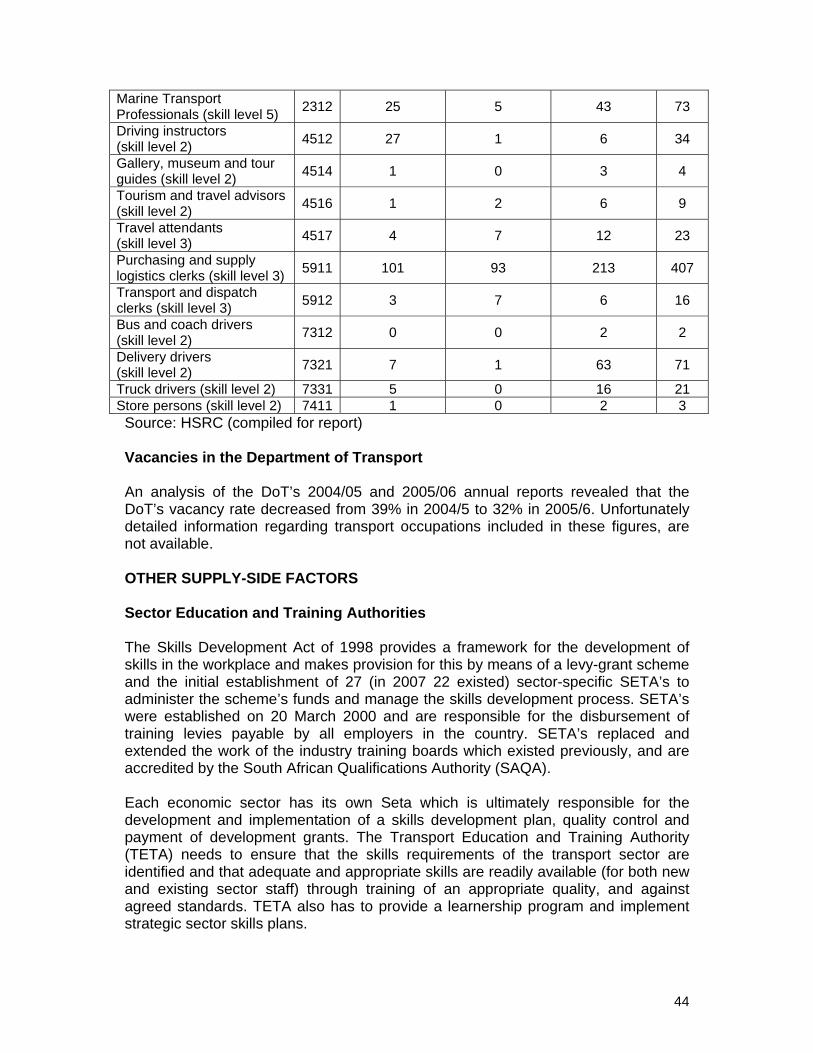
44
Marine Transport Professionals (skill level 5) 2312 25 5 43 73
Driving instructors (skill level 2) 4512 27 1 6 34
Gallery, museum and tour guides (skill level 2) 4514 1 0 3 4
Tourism and travel advisors (skill level 2) 4516 1 2 6 9
Travel attendants (skill level 3) 4517 4 7 12 23
Purchasing and supply logistics clerks (skill level 3) 5911 101 93 213 407
Transport and dispatch clerks (skill level 3) 5912 3 7 6 16
Bus and coach drivers (skill level 2) 7312 0 0 2 2
Delivery drivers (skill level 2) 7321 7 1 63 71
Truck drivers (skill level 2) 7331 5 0 16 21 Store persons (skill level 2) 7411 1 0 2 3 Source: HSRC (compiled for report) Vacancies in the Department of Transport An analysis of the DoT’s 2004/05 and 2005/06 annual reports revealed that the DoT’s vacancy rate decreased from 39% in 2004/5 to 32% in 2005/6. Unfortunately detailed information regarding transport occupations included in these figures, are not available. OTHER SUPPLY-SIDE FACTORS Sector Education and Training Authorities The Skills Development Act of 1998 provides a framework for the development of skills in the workplace and makes provision for this by means of a levy-grant scheme and the initial establishment of 27 (in 2007 22 existed) sector-specific SETA’s to administer the scheme’s funds and manage the skills development process. SETA’s were established on 20 March 2000 and are responsible for the disbursement of training levies payable by all employers in the country. SETA’s replaced and extended the work of the industry training boards which existed previously, and are accredited by the South African Qualifications Authority (SAQA). Each economic sector has its own Seta which is ultimately responsible for the development and implementation of a skills development plan, quality control and payment of development grants. The Transport Education and Training Authority (TETA) needs to ensure that the skills requirements of the transport sector are identified and that adequate and appropriate skills are readily available (for both new and existing sector staff) through training of an appropriate quality, and against agreed standards. TETA also has to provide a learnership program and implement strategic sector skills plans.
45
The SETA’s unfortunately failed to accomplish their mandate of empowerment and education. This is mainly due to ineffective budget utilization and an inability to identify skills shortages efficiently. SAQA revealed that in September 2003, only 17% of graduates from Seta-funded learnerships received the certificates to which they were entitled. Data from the National Skills Authority indicated that only 9 502 of the total of 70 000 learners enrolled since the system was implemented in March 2001 had completed their learnerships by June 2004 – a completion rate of 14% in three years for courses that typically last one year each. A research publication of the Human Sciences Research Council, An Overview of South African Human Resources Development, noted in 2004 (Kraak, 2004) questioned the quality of the training being funded by SETA’s: “Much of the training was of the short-course variety and narrow in focus to meet specific employer requirements. It included training of the ‘soft’ variety – for example, training in health and safety issues or on industrial relations – and far less of the hard variety that would lead to whole qualification acquisition and significant up-skilling of the workforce along the National Qualifications Framework.” SUMMARY It is evident that the schooling system firstly does not produce sufficient numbers of potential students in mathematics, and most probably science and technology. Unfortunately owing to a lack of detailed data, it cannot be established how many of the successful graduates do indeed eventually join the transport, storage and communications industry. The industry, because of its need for knowledge and skill in subject areas such as mathematics, physical science, technology and engineering, competes with most other professional disciplines in the pool of potential resources becoming available through training institutions. As South Africa prepares for major shifts in the transport field in order to contribute to the millennium goals of 50% eradication of poverty and unemployment in less than ten years, feedstock in terms of especially operational disciplines are not being developed. Basic engineering and mathematical skills will be needed and as usual, in the time of major national technological shifts, engineering skills requirements relative to other skills requirements are at its highest. Furthermore, when this gap might be filled in future, most of the older skilled workers, that could have mentored new entrants and transfer knowledge, will be retired as the workforce in this sector becomes younger.

46
CHAPTER 4: FREIGHT TRANSPORT CASE STUDY
This chapter provides a case study of the freight transport utility.
INTRODUCTION As industries in die first world mature, power in the value chain moves downstream (towards the consumer). This means that consumer demand increasingly dictates flow through the value chain and primary producers such as mining and agriculture and even manufacturers (beneficiators of primary products) have less control over prices and delivery of products. This trend increases complexity in the logistics system which in turn has a significant impact on transport. The increased complexity is due to requirements for more reliability, higher speed and lower costs from South Africa’s transport system, which is already under severe pressure because of historical imbalances. The current structure of freight transport in South Africa as well as its future challenges is informed by its history in which intrinsic geo-spatial considerations played a smaller role than in most countries in the world. Developments in most countries are aligned to natural physical characteristics of the geography where the positioning of rivers, valleys and mountains, the availability of drinking water and arable land inform such developments. In South Africa, however, some harbours are not positioned in the right place, most of the population and industry is incorrectly located and major population concentrations arose far away from water sources. This situation arose because of the development of infrastructure by colonists driven by especially two non-geographical forces i.e. the need for a supply post on the east-west sea route and the strife between two sets of colonists, i.e. the Dutch and English. Although the discovery of gold and diamonds (mining) can also be viewed as a key force in determining the concentration of populations and infrastructure in specific areas, this is, however, recognized as a key catalyst for economic growth. Today South Africa generates 0.4% of the global GDP, but consumes 2.2% of the world’s tonkilometers and 6% of maritime tonmiles. The country is freight transport hungry and produces only $0.64 of GDP per tonkilometer, compared to the average production of $3.34 for the world in total (Figure 4.1).

47
Figure 4.1: South African freight transport as a percentage of world figures (2004) Source: University of Stellenbosch modelling, 2004 SURFACE TRANSPORT BY ROAD AND RAIL IN SOUTH AFRICA Introduction The spatial challenges faced by the South African freight transport utility can best be geographically depicted by considering the three major concentration nodes and the stylised flow of surface transport between these (air and water transport play a small or no role here) (Figure 4.2).
0.4 0.5 0.7
22.2 2.4
6
00.5
11.5
2
2.53
3.5
44.5
5
5.56
GDP Logistics costs Transportcosts
Rail freighttonkm
Surface freighttonkm
Road freighttonkm
Maritime freighttonkm
SA a
s %
of w
orld
figu
re

48
Figure 4.2: Freight transport flow between the major concentration nodes
Source: University of Stellenbosch modelling, 2008 South Africa currently ships 1 416 million tons of freight in essentially four different network segments, i.e. rural, metropolitan, corridor and primary segments (Figure 4.3). Figure 4.3: South African freight transport network segments Source: University of Stellenbosch modelling, 2008
6mt
127mt
66mt
Primary, 111, 8%
Corridor, 218, 15%
Rural, 399, 28% Metropolitan, 688, 49%

49
The description of and challenges for each of these network segments are depicted in Figure 4.4. Figure 4.4: Description and challenges for South African freight transport network segments
•Few OD’s•One-directional, bulk traffic•Low value•Long distance•Challenge - competitiveness with global mining deposits
•Many OD’s •Local deliveries•Higher value•Shorter distances•Challenge is alleviating congestion
•Many OD’s•Shorter & longer distances•Feed into corridors and metropoles•Challenge is to enable development
•Long distance, between metropoles•Long distance OD’s few, short distance OD’s for distribution many
•Challenges are spatial reorganisation in the longer term and inter-modal solutions in the shorter term
Cor
ridor
Rur
alPrim
aryM
etro
Source: University of Stellenbosch modelling, 2008 Mode usage of the different network segments is depicted in Figure 4.5. The current and expected future usage of these modes play an important role in understanding the specific skills challenges experienced currently and expected in the future. Three modes have been excluded from this part of the analysis i.e. water, air and pipeline, but is briefly summarised later. Freight transport by water accounts for less than a quarter percent of domestic freight transport whilst freight transport by air accounts for less than 0.1%. In addition, the country’s domestic pipelines are responsible for less than 1% of freight transport, meaning that the three excluded freight transport modes together account for less than 1.5% of total freight transport. Figure 4.5: Mode usage of the different freight transport segments
M etropolitan - Rail, 3, 0%
M etropolitan - Road, 685, 49%
Rural - Rail, 49, 3%
Primary - Rail, 111, 8%
Rural - Road, 350, 25%
Corridor - Road, 175, 12%
Corridor - Rail, 43, 3%

50
Source: University of Stellenbosch modelling, 2008 The status quo of the mode structure of South Africa’s freight transport market is not tenable. Forecasts done by the University of Stellenbosch for Transnet indicate that freight transport demand will grow by approximately 250% over the next twenty years. Some corridors, such as the corridors between Gauteng, Johannesburg and Cape Town (which amount to 50% of all corridor transport) will densify even faster than this. Even in a low growth scenario the challenges of alleviating congestion in metropoles, providing cheap corridor transport and developing rural infrastructure cannot be met with the current mode configuration. Freight transport by road over long distances is too expensive and, as was illustrated in chapter 2, although the tonkilometers per employee is higher than that for rail, further productivity improvements are not feasible. Rail transport productivity as measured in tonkilometers per employee, has, however, improved markedly over the last ten years, in a time when the rail system faced serious challenges and lost significant market share (events that normally challenge productivity). It is clear that a shift from road freight transport back to rail could solve some of the high-cost related problems and provide some opportunity for a more competitive position for South Africa as a whole. Long distance truck travel is, in addition, also a contributing factor to socio-economic problems within the driver population as is evidenced by the prevalence of AIDS (a problem that the industry reported in the research) and other social issues amongst truck drivers. The road freight transport sub-sector acknowledges that required future adherence to SHEQ (safety, health, environment and quality) standards will put more pressure on the sub-sector in terms of driver education and working conditions. The debate around how and when this step change will be facilitated is not the subject of this research, but the fact that a shift is required back to the railway corridors, the need for rail dedicated metropolitan solutions and more effective rural road infrastructure with intermodal nodes, cannot be disputed. Interestingly enough, the road transport sub-sector reports in the research that this shift is possible and might become a reality as soon as in the middle of the next decade. The above-mentioned shift implies that: • The transport sector skills plan will have to be aligned closely to the Transnet
national infrastructure plan, the national transport masterplan of DoT and the deployment of Moving South Africa and the National Freight Logistics Plan (an alignment which has not been achieved in the present sector skills plan);
• A skills demand shift from long haul road to long haul rail will happen; but • The timing is not yet clear (although more certainty will emerge over the next
five to ten years); and • The required shift is not widely recognised yet (for various reasons – including a
shortage of strategic planning skills at DoT, a lack of integrative master planning thinking between the two infrastructure owners, i.e. Transnet and DoT and the scarcity of market intelligence), which makes it challenging to prepare for this shift and which means that current operators can not raise alarms this regard.

51
Expected skills shift A skills demand shift from long haul road to long haul rail transport will have a specific impact on skills categories. It is possible to map the degree of different skills required (as is evidenced by the step change described in this case study) with current skills levels (as analyzed in chapter 2) and develop three categories of criticality (Figure 4.6): Figure 4.6: Degree of skills shift required to enable step change from long haul road to long haul rail freight transport Source: University of Stellenbosch modelling, 2008 As market demand grows and even where different skills will be required because of a supply side shift in modality it is still relatively easy to re-skill elementary, service and administrative employees. It’s more difficult to re-skill operational, professional and senior management employees. Within this group, operational is the most critical problem as the current levels of skills is very low and the degree of shift expected very high. This correlates with the responses received from infrastructure owners such as Transnet and SANRAL, large operators such as Imperial, Unitrans, Bidvest and McDonalds and Safmarine, upstream providers such as Robhitech and freight owners such as Tiger Brands. The degree of shift is, however, not always recognized. The figure above demonstrates that three categories of criticality will emerge as: a) Highly critical skills:
• Operational transport workers: train drivers, crane operators, train control personnel, diesel mechanics and truck drivers.
In the research, the trucking industry reported long working hours for drivers causing drivers to search alternative employment. The shortage of drivers is also reported as being the most critical skills shortage with too little
High
HighLow
Low
Deg
ree
of s
hift
Level of skill
Elementary
Semi-skilled
Operational
Professional
Senior management
Administrative
Service
High
HighLow
Low
Deg
ree
of s
hift
Level of skill
Elementary
Semi-skilled
Operational
Professional
Senior management
Administrative
Service

52
investment in the proper education of drivers. The shortage could reach levels as high as one third, according to the industry, before the expected shift results in the alleviation of this problem, but leads to new challenges in the rail freight sub-sector. This means that the shift will then solve some problems, but at some stage requires the retraining and skills development of operational transport workers in a totally new direction. The sub-sector also sites mechanization as a major future trend, but interestingly enough this trend will not impact truck drivers as much as the shift from road to rail.
In addition, learnerships and apprenticeships confusion caused by new educational systems is causing skills migration and shortages amongst diesel mechanics.
b) Critical skills:
• Elementary transport workers: Labourers. • Semi skilled transport workers: Security. • Professionals: Engineering (all sub-disciplines i.e. Electrical, Mechanical,
Civil, Industrial) and Logistics. The road freight sub-sector is concerned about available technical and engineering expertise. Training standards and processes exist, which means that average skills levels of existing employees are reasonable, but supply is far too low.
c) Concerns:
• Senior Management: A lack of supervisory skills in third line and middle management also feeds into senior management deficiencies, but training programs are available. It is mostly a lack of feedstock in this area that plays a role.
• Administration and services: Call centers, clerical: Concern in this area was expressed in the research with low levels of skills in especially generic areas such as computer literacy, customer service and communication. These challenges are caused by the reconfiguration of the South African workforce, which is beginning to take hold in these areas, with a certain training backlog. The most critical skills shortage in this area is in commercial contract management, for which training programs do exist, but once again the lack of numerical abilities in the feedstock remains a challenge.
WATER TRANSPORT IN SOUTH AFRICA Introduction The development of super ports around the world, such as Dubai and Singapore, and densified global maritime routes cause a reclassification of world ports into long distance connected and short distance connected transhipment ports. The port of Durban in terms of container capacity and handling, ranks fiftieth in the world. The

53
issue of super port versus feeder port development for Southern Africa has not yet been settled and could have a profound impact on skills requirements. South Africa’s port infrastructure is well-developed but various initiatives such as Nacala and Lobito could impact the landscape on the sub-continent. South Africa is very fortunate to have direct access to seven (in due course eight when Coega becomes operational) well developed deep sea ports. These facilities place South Africa in a position to trade directly with other trading nations of the world. In addition South Africa can render a service to land-locked neighbouring countries such as Lesotho, Botswana, Zimbabwe, Zambia and Malawi, but new corridors such as the Trans-Kalahari corridor could also impact on this position. South Africa’s ports and infrastructure meet international standards and can currently accept and handle most (of the smaller) ocean-going vessels. In future, upgrades and or extensions will be required to cater for new generation (larger) container ships. Shipping lines Over the past fifty years, a national shipping line was formed which played a major role in introducing our country to containerization. This step assisted South African exporters to market their produce at competitive prices on a door-to-door basis. This in turn created job opportunities and foreign exchange earnings. The shipping scene has since changed and it now includes mainly the successful larger international players that can successfully run a shipping service. Our national liner corporation was sold to the international (Danish) A P Möller-group. Shipping is the most important mode of transport for low-value products. In excess of 80% of total international business is moved by sea of which crude oil, coal and iron ore constitute some of the more important commodities. South Africa also produces large quantities of agricultural products that can only be exported in a financially viable manner by sea. The major shift in port demand is caused by a shift in the economy from raw material export to export of beneficiated products. The second shift is the propensity to containerize more and more of the beneficiated products. This means that dry bulk and break-bulk exports will grow at rates slower than the economic growth but containerization growth will outstrip economic growth by far. The international shipping container business, which is currently underpinning global (and of course South African) trade is growing at approximately 10% a year. It is estimated that container volumes will double in the next eight years and that the global container shipping fleet will grow by 60% over the next decade. One of the fundamental obstacles inhibiting growth and efficiency is the lack (worldwide) of port infrastructure capacity. Most major ports in Asia, the US and Europe as well as South Africa are experiencing bottlenecks owing to a lack of infrastructure capacity and in South Africa also intermodal system efficiency. Both Safmarine and Maersk Line indicated in responses that a great deal more skills, as well as intermodal system development and management will be required in the future. These skills are mostly lacking (nearly non-existing) in South Africa at present. In addition, closer working partnerships are required between carriers, suppliers and customers to increase efficiency.
54
Productivity in a port is measured by the average number of containers handled per gantry crane per hour. The present number of containers handled varies between 15 and 18 containers, whilst the international benchmark is a minimum of 25 containers. Productivity in ports therefore seems to be below the international norm. Inefficient cargo handling seriously impacts on South Africa’s ability to compete internationally. The inability to handle the rising volume of containers handled at Durban Container Terminal resulted in additional costs caused by congestion being added as a congestion surcharge to basic ocean freight rates. This surcharge of USD $100 per container is passed on as an increase in consumer prices at the end of the day. An initiative has been launched by Transnet Port Terminals to upgrade the Container Terminal and inject R1.4 billion over the next five years. These problems will multiply exponentially in the next twenty years if solutions are not found and the necessary skills not developed. Expected skills shift A skills demand shift is required to accommodate effective cargo handling and intermodal system development and management. Figure 4.7: Degree of skills shift required to enable water freight transport Source: University of Stellenbosch modelling, 2008 It will be easy to re-skill elementary and administrative employees, but more difficult to re-skill service, semi-skilled, operational, professional and senior management employees. Re-skilling operational employees as well as training professionals and senior management is the most critical problem as the current levels of skills is very low and/or non-existent. Two categories of criticality include:
High
HighLow
Low
Deg
ree
of s
hift
Level of skill
Elementary
Semi-skilled
Operational ProfessionalSenior Management
Administrative
Service
High
HighLow
Low
Deg
ree
of s
hift
Level of skill
Elementary
Semi-skilled
Operational ProfessionalSenior Management
Administrative
Service

55
a) Highly critical skills:
• Operational water transport workers: port operators, crane operators, port control personnel, systems control personnel, mechanics, artisans and drivers.
• Professionals: Engineering (all sub-disciplines i.e. Electrical, Mechanical, Civil, Industrial, Marine, Systems), Logistics and port operations management.
• Senior Management: A lack of supervisory skills in third line and middle management also feeds into senior management deficiencies, but training programs are available. It is mostly a lack of feedstock in this area that plays a role.
b) Critical skills:
• Semi skilled transport workers: Security, marines. • Administration and services: Call centers, clerical, forwarding and clearing
agents. PIPELINE TRANSPORT IN SOUTH AFRICA Introduction For many years South Africa only operated one pipeline service provided by Petronet which has since changed its name to Transnet Pipelines and which are 100% owned by government through Transnet. Petronet had no competition and it had the monopoly in moving mostly fossil fuels from the KwaZulu Natal coast to Sasolburg and the Reef. However, even though the monopoly in fossil fuel transport remains, other pipeline solutions are being developed by privately owned companies, especially the transport of vastly available gas reserves to conversion plants in South Africa. This means that the skills management in pipeline technology will migrate away from Transnet over the next twenty years and additional pipeline transport related skills will be required in the fields of gas technology, civil engineering and materials management. Transnet Pipelines pumps 5 000 kilolitres of fuel over a 3 000 km network with less than 500 employees. In comparison Sasol, with the installation of the 865 km pipeline between South Africa and the Pande/Temane gas fields in Mozambique already operates a network in excess of 2 000 kilometers. Expected skills shift The new markets that are expected to open up to pipeline transport will demand a totally new set of skills, not currently available in South Africa. This will impact especially elementary workers, professionals, operational employees and to a lesser extent senior management.

56
Figure 4.8: Degree of skills shift required to enable pipeline transport Source: University of Stellenbosch modelling, 2008 Two categories of criticality include: a) Highly critical skills:
• Operational pipeline transport workers: pipeline operators, pipeline control personnel, systems control personnel, mechanics, artisans, stevedores.
• Professionals: Engineering (all sub-disciplines i.e. Electrical, Mechanical, Civil, Industrial, Material, Systems, Fluid, Project), Logistics, pipeline operations management, fluid technology, network management.
• Senior Management: A lack of supervisory skills in third line and middle management also feeds into senior management deficiencies, but training programs are available. It is mostly a lack of feedstock in this area that plays a role.
b) Critical skills:
• Semi skilled transport workers: Security. • Administration and services: Control centers, clerical.
SUMMARY This chapter provided the various scenarios applicable to freight transport in South Africa and discussed in brief the upstream and downstream implications of expected shifts in freight transport delivery. The chapter further indicated expected shifts in skills requirements for the various modes of freight transportation. It is expected that skills gaps will need to be addressed in especially operational, semi-skilled and professional categories to enable integrated and intermodal transport delivery.
High
HighLow
LowD
egre
e of
shi
ft
Level of skill
Elementary Semi-skilled
Operational
Professional
Senior management
Administrative
Service
High
HighLow
LowD
egre
e of
shi
ft
Level of skill
Elementary Semi-skilled
Operational
Professional
Senior management
Administrative
Service

57
CHAPTER 5: PASSENGER TRANSPORT CASE STUDY
This chapter provides a case study of the passenger transport utility.
INTRODUCTION South Africa’s millennium goals to reduce poverty and unemployment by 50% and create a larger middleclass will have a profound effect on passenger transport. The current solution of choice is for middle class South Africans to use private transport (i.e. private motor cars). Previously disadvantaged citizens use public transport systems which are mostly unregulated (i.e. taxis) and poorly maintained, whereas a small group of wealthy citizens make use of air public transportation. Passenger transport in South Africa, when described according to the need that is satisfied or the utility that is provided, can be characterised as business, tourist, commuter and family journeys. Statistics are scarce, but for the sake of discussion and analysis certain groupings were made. Domestic flights used for mostly business reasons, but including tourism applications, amount to more than 9 million flights per annum and international flights with the same application more than 34 million flights per annum. Long distance rail and bus journeys used mostly for family and tourism amounts to close to 6 million journeys per annum. More than 6 billion commuter journeys take place every year, which means that more than 20% of the population, on average, make use of public transport to commute. (In fact, the average South African will do 70 public commuter journeys per annum and do one public long haul domestic trip every third year). The National Household Travel Survey released in 2005 (Radebe, 2006) highlighted that:
• Approximately 74% of SA households do not have access to a car and 79% of SA adults have no driver's licence. This means that over 9 million households lack access to a car.
• Public transport costs are high for both government and users - 18% of all South African households spend more that 20% of their income on public transport and 31% of households spend more than 10%. It is also a high cost Government, with a combined R5 billion allocated to bus and rail subsidies per annum to serve an estimated total of 2 million daily commuters.
• Access to public transport at a national level is uneven. 76% of all households in SA lack access to a train, 38% lack access to a bus and 8% to a taxi.
• On a weekly basis, 15% of the total population used a car at least once versus 32% of the population who used a public transport mode at least once. Minibus taxis carry 64% of the 3.8 million public transport worker travellers and are dominant in all areas, even without receiving a direct subsidy. Subsidised train services are fairly significant in metropolitan areas (24% of public transport commuters) and the subsidised bus mode features strongly in rural areas (42.5% of public transport commuters).
The same spatial challenges that exist in freight transport in South Africa exist in passenger transportation with added dimensions of spatial imbalance that is external

58
to normal geographical characteristics. The long distance Gauteng to Cape Town and Gauteng to Durban routes are highly densified and abnormal, given the size of the South African economy, and for the same reason as the unnatural freight demand, caused by the location of industries and mining activities in Gauteng. In metropolitan areas large numbers of workers who have no choice, use public transport, because they are displaced far away from places of work as a result of the previous government’s policies. Long haul (flight, bus and rail mode) and short haul (taxi, bus and rail mode) passenger journeys are subsequently discussed as separate case studies. PASSENGER TRANSPORT IN SOUTH AFRICA Air The passenger air transport dimension is described by the number of domestic and international flights per annum i.e. 12.9 million flights originate or depart from a South African airport each year. 0.2% of all international passenger journeys originates or departs from South Africa, with 0.4% of domestic air passenger journeys in the world taking place within the borders of South Africa. These figures provide an interesting perspective on South Africa’s disproportionate demand for fast long haul domestic journeys compared to international journeys, but currently in line with global demand for domestic flights. The growth curve for domestic flights is, however, unnaturally high, and future demand growth will outstrip world growth for Africa and South Africa (Figure 5.1). Domestic passengers have more than doubled in the ten year report period, in fact has grown by 130% compared to world growth of 40% (measured for the 1998-2007 period; ICAO News Release, PIO 13/07) Figure 5.1: South Africa’s demand for fast long haul domestic journeys
Source: Airports Council International Global Forecast 2006-2025 This state of affairs will place huge pressures on air transport orientated skills, especially in air traffic control and aircraft maintenance (both professions reporting extremely high emigration trends in recent years). As far as the upgrading of airports is concerned, civil engineering and technical building skills will also be put under pressure in the foreseeable future.

59
Road and Rail (Surface) Long haul surface public passenger journeys are unnaturally low. In a comparison with rail and bus journeys, rail has a 56% market share, but only 0.01% of long haul rail journeys in the world take place in South Africa. This is an incredibly low figure and needs to be put into perspective (Figure 5.2). Figure 5.2: Long haul journeys compared to other modes of transport as a percentage of world figures
0
1
2
3
4
5
6
7
GDP Rail pasjourneys
(56% longhaul mrkt
share)
Longdistance
flight(faster
growth thanglobal)
Domesticflights(faster
growth thanglobal)
Surfacefreighttonkm
Maritimefreighttonkm
Source: Stellenbosch University modelling, 2008 Most South Africans still do long haul passenger journeys by private car (although the percentage of taxi journeys is unknown). If the economy matures such as AsgiSA/GEAR is aspiring to do, and poverty and unemployment is halved, this picture could change dramatically (Figure 5.3).

60
Figure 5.3: Expected shift in long haul journeys if economy matures
0
1
2
3
4
5
6
7
GDP Rail pasjourneys
(56% longhaul mrkt
share)
Longdistance
flight(faster
growth thanglobal)
Domesticflights(faster
growth thanglobal)
Surfacefreighttonkm
Maritimefreighttonkm
Source: Stellenbosch University modelling, 2008 The critical argument in this regard is that demand will grow much faster than economic growth (much more than for freight) as a growth in personal wealth for the middle class is expected, plus the mode switch from private to public transport for long haul from a much lower base as for freight. This means that an extreme growth of long haul public transport could take place in 10 to 20 years’ time, which is mostly not foreseen, though some service providers to the industry already report a backlog in rail capacity, even with the current unnaturally low rail demand. At the same time the current solution mostly cited is to extend working hours, one of the major reasons why employees leave the industry, therefore creating a classic viscous circle. Approximately 1200 employees work in the dedicated service portion of rail long haul. As new rail solutions are developed in the next decade the country will have to deal with the fact that even with the current configuration an extreme shortage of railway orientated engineering disciplines are experienced. At the same time, and also with the current configuration, providers report that unnaturally high salary expectations are created by this shortage and at the hint of new projects. The fact is that the country cannot afford the shortage, which will stunt growth as with electricity, and the exorbitant salaries expected cannot be afforded, even with the shortage. Short Haul Short haul public journeys are mostly commuter orientated with two thirds taking place on taxis, a quarter by bus and only one-twelfth by rail. As clearly evidenced by the Gautrain project this trend needs to be reversed as congestion overtakes all the major metropolitan areas in South Africa. This means that skills requirements have to consider a complex array of issues such as: a) Formalising taxi industry employment.
Drivers:1. Environmental
issues 2. Costs 3. Congestion 4. Growing middle
class
As the economy
matures, this space will fill

61
b) The extreme engineering/operating skills gap in various disciplines, but especially:
o Civil engineering. o Mechanical engineering. o Electrical engineering. o Technical metropolitan train operational skills. o Intermodal operation skills.
The systemic cumulative effect of this shortage can be described by the following cumulative effect and compared to the recent electricity shortage: a) The first level of shortage arises when inadequate investments are made for a
low growth scenario (This is especially true in South Africa for energy and transport infrastructure).
b) The shortage is compounded by higher than expected growth (true for both). c) This is further compounded by structural changes on the demand side which
causes most infrastructure types to outgrow GDP (also true for both). Examples are a growing black middle class, lowering of the gini coefficient, specialisation in the economy, etc.
d) This is further compounded by structural changes in the supply side. For energy this would also be required eventually, driven by environmental concerns, causing skills demand changes, but this trend is much longer in the future. For transport this change is critical, driven by corridor densification, metropolitan congestion, rural backlogs, export competitiveness concerns, and obviously, also environmental concerns.
e) This cumulative effect is at its worst for passenger transport in South Africa (even more than freight) where a propensity to outsource will grow suddenly and need different skills. (In freight transport long haul, for instance, is outsourced to a reasonably large extent already and is provided as a service – the same is not true for passenger transport - and if metropolitan freight transport is outsourced the skills and technology required do not change much, but for passenger transport it does).
One of the worrying aspects of this utility is the number of people employed by the taxi industry, which is mostly informal, and which far outstrips any other sub-sector employment area. Various figures are cited, but if these estimates are correlated with the indicated relationship between vehicles and workers, as much as 360 000 people could be involved. This figure is equal to total formal employment in all the subsectors of the total transport sector and eighteen times higher than the informal workers reported in official statistics for the total sector. This also means that, if the minimum assumption for informal employment in the non-taxi sub-sectors is fixed on the low figure of 10%, then the total informal employment amounts to 55% for the sector, i.e. reported official statistics include less than half of the number of workers in the sector. Massive structural changes are necessary in this industry. Where-as growth in the country’s economy is difficult without engineering, technical and management expertise, no growth is possible without infrastructure and the expertise to do just that, i.e. building and maintaining the necessary infrastructure for the first half of this century.

62
This correlates with responses received from infrastructure owners such as Airports Company (ACSA) and SANRAL and service providers such as Imperial Car Rental and the Taxi Association of South Africa. EXPECTED SKILLS SHIFT The expected skills shift is reflected in Figure 5.4 below. Figure 5.4: Degree of skills shift compared to current levels of skill (Passenger) Source: University of Stellenbosch modelling, 2008 The figure above demonstrates that three categories of criticality will emerge as: a) Highly critical skills:
• Operational passenger transport workers: train drivers, train control personnel, luggage handling operators, flight attendants, air crew personnel, traffic control (air, road, etc.), ground crew personnel.
b) Critical skills:
• Elementary transport workers: Labourers. • Semi skilled transport workers: Security. • Professionals: Engineering (all sub-disciplines i.e. Electrical, Mechanical,
Civil, Industrial, Aeronautic, Rail, Systems), technology.
c) Concern:
• Senior Management:
High
HighLow
Low
Deg
ree
of s
hift
Level of skill
Elementary
Semi-skilled
Operational
Professional
Senior management
Administrative
Service
High
HighLow
Low
Deg
ree
of s
hift
Level of skill
Elementary
Semi-skilled
Operational
Professional
Senior management
Administrative
Service
63
A lack of supervisory skills in third line and middle management also feeds into senior management deficiencies, but training programs are available. It is mostly a lack of feedstock in this area that plays a role.
• Administration and services: Call centers, clerical, scheduling
SUMMARY This chapter provided the various scenarios applicable to passenger transport in South Africa and discussed in brief the upstream and downstream implications of expected shifts in passenger transport delivery on air traffic, bus operators, long and short haul journeys and infrastructure. The chapter further indicated expected shifts in skills requirements for passenger transportation driven by an expected shift in outsourcing from private to public transport and an expected shift in solutions from road to rail.

64
CHAPTER 6: TELECOMMUNICATIONS CASE STUDY
INTRODUCTION Telecommunication operators worldwide, increasingly endeavour to position their businesses downstream. The upstream component of telecommunication utilities is the development of networks and infrastructure, whilst downstream components include software and content solutions such as for internet service providers, entertainment, and other multi-media solutions. The global telecommunications sector is affected by changes in infrastructure, increased demand for connectivity and differentiation of services provided. Global fixed line revenue will decline from 54% to 44% of total spend in the next five years (Figure 6.1). Figure 6.1: Global wireless revenue as a percentage of the total Source: 2006 Telecommunications Industry Review by the Insight Research Corporation In addition, the compound annual growth rate of broadband wireless revenue between 2005 and 2010 is expected to be 61.7% compared to the 7.8% expected for narrow band wireless revenue and the decline of 1.4% in narrow band fixed line.
46% of all telecomm revenue
56% of all telecomm revenue
Wire
less
Sub
scrib
ers
Gro
wth
200
5-20
11 (M
illio
ns)
46% of all telecomm revenue
56% of all telecomm revenue
Wire
less
Sub
scrib
ers
Gro
wth
200
5-20
11 (M
illio
ns)

65
Table 6.1: Global broadband wireless will grow six times faster than broadband fixed line
Source: 2006 Telecommunications Industry Review by the Insight Research Corporation Furthermore, the growth in Africa of wireless technology of 166% expected over the next few years is much higher than expected global growth of 70%. Demand will significantly outstrip supply in terms of labour and technology inputs. Voice over internet protocol (VoIP) traffic for Africa also rose from 304 million minutes in 1998 to about 4 billion minutes in 2004. This trend is expected to continue. Telecommunication services have traditionally been typified as a voice communication utility. In the new age, this technology also supports multi-media messaging, multi-media commerce and finance, corporate services and machine to machine communication. By the turn of the century almost all transmission volumes were by voice and this is expected to change radically and by 2020 only 40% of transmission will be for voice utility. This convergence means that increasing elements of this sector becomes business services, causing confusing boundaries within the SIC classification.

66
Figure 6.2: Global mobile data volumes Source: Arthur D. Little, Global Broadband Report, Update 2005 In the light of the challenges mentioned above and the drive to move downstream, many high level content driven businesses in this sector are expected to appear which includes for instance software development, data management and differentiated journalistic skills. Again, many of the challenges flow over the boundaries of the SIC sector 7 group and converge with other sectors such as business services. Telkom has managed to provide main fixed line telephone lines to more or less 11% of South Africa’s population. This compares well with other sub-Saharan countries. Cellular mobile companies has achieved a penetration rate of 27% and internet service providers a rate of 7% (Table 6.2).
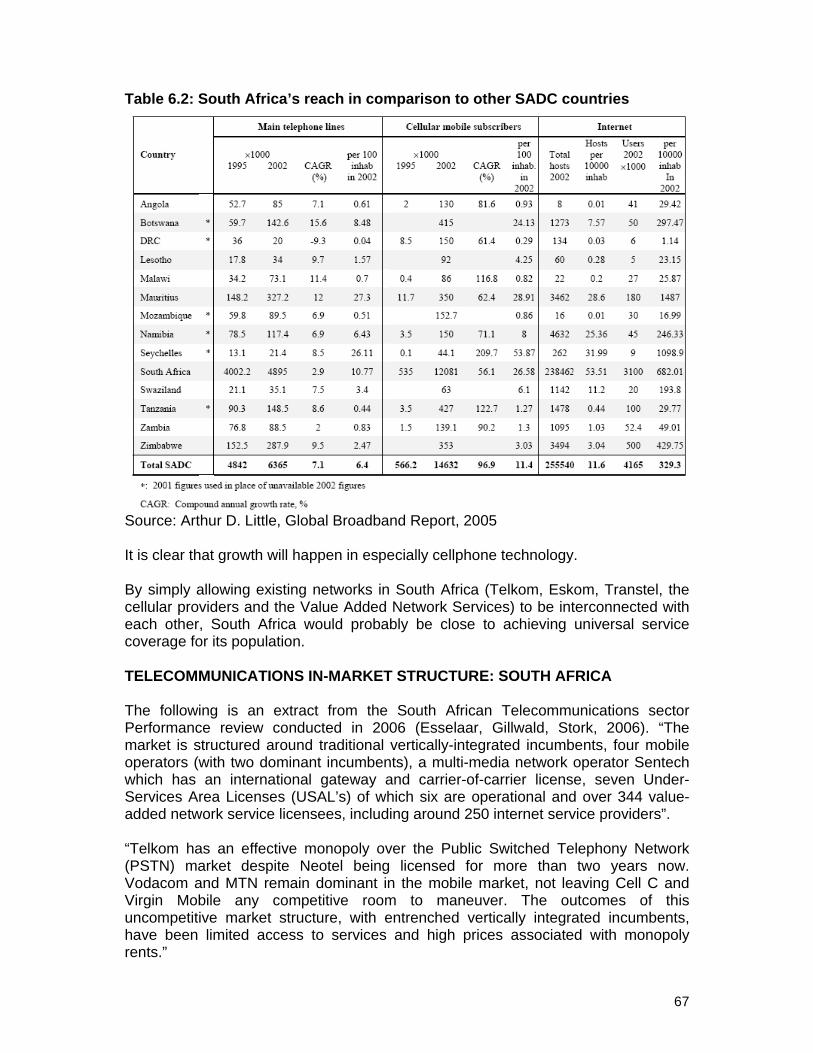
67
Table 6.2: South Africa’s reach in comparison to other SADC countries
Source: Arthur D. Little, Global Broadband Report, 2005 It is clear that growth will happen in especially cellphone technology. By simply allowing existing networks in South Africa (Telkom, Eskom, Transtel, the cellular providers and the Value Added Network Services) to be interconnected with each other, South Africa would probably be close to achieving universal service coverage for its population. TELECOMMUNICATIONS IN-MARKET STRUCTURE: SOUTH AFRICA The following is an extract from the South African Telecommunications sector Performance review conducted in 2006 (Esselaar, Gillwald, Stork, 2006). “The market is structured around traditional vertically-integrated incumbents, four mobile operators (with two dominant incumbents), a multi-media network operator Sentech which has an international gateway and carrier-of-carrier license, seven Under-Services Area Licenses (USAL’s) of which six are operational and over 344 value-added network service licensees, including around 250 internet service providers”. “Telkom has an effective monopoly over the Public Switched Telephony Network (PSTN) market despite Neotel being licensed for more than two years now. Vodacom and MTN remain dominant in the mobile market, not leaving Cell C and Virgin Mobile any competitive room to maneuver. The outcomes of this uncompetitive market structure, with entrenched vertically integrated incumbents, have been limited access to services and high prices associated with monopoly rents.”
68
Government’s involvement in the telecommunications sector is large and increasing. In the broadcasting sector, government ownership is also dominant through the SABC. Basically, the trend is towards increased state involvement in the sector, rather than the declining state involvement that is the international trend”. “The introduction of Neotel into the South African market introduces a link to a major global telecommunications operator, VSNL, the latter which is driven primarily by global economies of scale and sees the South African market as one with healthy margins and continued state involvement that is likely to guarantee future profits and reduce capitalization”. “Telkom’s voice services have been showing a steady decline and it is placing increasing reliance on its data services. In the corporate sector, it showed strong growth in its managed data network sites. Mobile operators are also facing declining growth in the voice market and are targeting data to provide them with the growth necessitated by their share prices”. “There has also been a strong take-up of Telkom’s broadband services. The frustration with Telkom’s long waiting list for ADSL services has provided wireless competitors with an edge – virtually all competitors advertise short delivery time. However, Telkom still dominates the broadband market with over two-thirds market share. Even with some competition in the broadband arena, South Africa still lags behind other lower middle and middle income countries in broadband. Broadband penetration will have to increase exponentially if South Africa is to unleash the potential of information communication technology for economic growth and development”. EXPECTED SKILLS SHIFT The expected changes in the long term industry growth rate (negative growth of traditional telecommunications), product innovation (VoIP, virtual private networks, call back services leading to bundling of services and differentiation), technological changes (wireless, data, broadband, etc.) and changes in cost and efficiency, will have profound effects on skills with the expected shift from civil to differentiated electronic engineering (signal technology and high end electronic engineering skills). The lack of specific emphasis on converged technologies and solutions in current academic curricula is a concern. Limited emphasis is placed on converged telecommunications, virtual networking, information technology and electronic multimedia engineering. The expected skills shift is reflected in Figure 6.3 below.

69
Figure 6.3: Degree of skills shift compared to current levels of skill (Telecommunication) Source: University of Stellenbosch modelling, 2008 The figure above demonstrates that three categories of criticality will emerge as: a) Highly critical skills:
• Operational telecommunications: telecommunications and systems control personnel, network provisioning, electronics, and security.
• Professionals: Engineering (all sub-disciplines i.e. Electrical, Mechanical, Civil, Industrial, Signal, Systems, Telecommunications), technology, networks.
New technology will result in differentiated and high end electronic engineering, software engineering and computer science skills required. In addition, spectrum management skills are also required.
b) Critical skills:
• Semi skilled workers: technicians and technical assistants. A lack of skills exists regarding multimedia technology, network technologies, spectrum technologies, emerging access technologies, etc.
c) Concern:
• Senior Management: A lack of supervisory skills in third line and middle management also feeds into senior management deficiencies, but training programs are available. It is mostly a lack of feedstock in this area that plays a role.
High
HighLow
LowD
egre
e of
shi
ft
Level of skill
Elementary
Semi-skilled
Operational
Professional
Senior management
Administrative
Service
High
HighLow
LowD
egre
e of
shi
ft
Level of skill
Elementary
Semi-skilled
Operational
Professional
Senior management
Administrative
Service
70
• Administration and services: Call centers, clerical
Skills requirements in this area include helpdesk functionality and network security.
SUMMARY This chapter provided the various scenarios applicable to telecommunications in South Africa and discussed in brief the upstream and downstream implications of expected shifts in telecommunications delivery. The chapter further indicated expected shifts in skills requirements driven by the convergence of fixed line/wireless, voice/content/data trends in the industry.
71
CHAPTER 7: SUMMARY
This chapter summarises findings and recommendations.
INTRODUCTION A secondary literature review was conducted to determine the nature and scope of the transport, storage and communications industry. The industry was then demarcated to identify the sub-sectors for inclusion in case studies. Several key enterprises were approached for information in questionnaire format and also by means of telephonic interviews. It is widely recognized that transport is very important for any country where resources and manufactured goods are far removed from their markets. The transport cost will under these conditions form a major component of the delivered cost of the product. The latter will to a large degree determine the size of the market and whether these products could be marketed on a competitive basis. If the transport cost element forms a high percentage of the value of the article, the product will not move under most circumstances, unless of course, the market is willing to pay or depending on the availability of a similar product with lower transport costs. Production, without transport to create place utility, will soon lead to production activities coming to a standstill and job opportunities lost, causing a relapse of economic activity in the region which leads to poverty, crime and unrest. In the case of exports, important foreign exchange will be lost, placing South Africa’s economy under pressure when importing critically important machinery for wealth creation and regional development. The following paragraphs present final conclusions on the transport sub-sectors included in the case studies. TRANSPORT SUB-SECTORS (CASE STUDIES) Freight Transport Freight transport in South Africa is dominated by two modes, namely road and rail transport. The current dominance of road is not only linked to high value commodities, perishables or short transport distances, but has over the past years been extended to include freight transport of bulk low value goods such as coal and iron ore, previously the domain of rail transport. The railway operator has always funded its own infrastructure maintenance costs from revenue. Road operators by comparison operate over selected public roads and contribute to road maintenance through fuel taxes. The way in which government has used these taxes has become a major issue, since only a fraction of the total has been ploughed back into road maintenance. This matter remains unresolved to this day, as does the fact that rail now pays the same taxes - but are not road users.
72
In addition, government has progressively relaxed the restriction on vehicle size and axle massloads. Some of the world's largest heavy road freight vehicles are allowed on an unrestricted basis, countrywide - on District, Provincial and National highways. Most of these roads were never constructed to cater for the volume and massloads of this heavy vehicular traffic. The result has been dramatic - South Africa's collapsing roads are the result of government underfunding and allowing such large road vehicles in the first place. The condition of the rural road network is deteriorating rapidly as traffic volumes and axle loads increase on an ageing network. Rail transport had been neglected for many years and it is only recently that government has given consent for large capital investments to be made in rolling stock and infrastructure to enable a comparative level of service to road. With the number of employees drastically reduced over time, rail transport has no other option but to largely depend on outsourced contractors to provide technical, maintenance and technological support. It is expected that this modus operandi will continue until increased demand dictates a larger portion of control over in-house activities. Road transport is of particular value in delivering goods on a door-to-door basis. In addition, and from a second economy point of view, road transport is vital for rural and underdeveloped areas. The movement of goods/containers can in the long term be carried by rail with collection and delivery provided by road. This shift in the mode of transport will contribute to the improved utilization of available infrastructure, which will positively impact the availability of skills amongst long distance heavy vehicle drivers. Regulation may initially be required enable the shift. With the planned shift back to rail transport, critical skills shortages exist in all areas of rail transport management, operation, administration and management. In addition, all areas of engineering are also in short supply. Aquatic transport is of vital importance to the export of South African minerals (low value, high density) and agricultural produce. The foreign earnings received from these shipments, to a large degree, drive our economy and contribute to the financial upliftment of the South African population. Until recently, it was important to support the national shipping line in an attempt to keep money in the country. Lately it has become uneconomical for smaller shipping lines to compete with large world class shipping lines on a cost or service basis. Fortunately, these larger shipping lines are prepared to sail their capacity on routes where demand is sufficient to induce calling at major ports. Port development has also recently come under the spotlight. This node in the supply chain is of critical importance when it comes to the provision of docking, loading and off-loading facilities. Large scale capital investment in various facility improvements is taking place to ensure the free flow of goods through South Africa’s ports.
73
Shortages experienced in respect of skills on the marine and ports’ side contribute to a reduction in the levels of productivity whilst increasing the cost to shippers. Pipelines can be considered the natural method of transporting liquid and gas commodities in a clean, efficient and safe manner, with very limited effects on the environment. Large capital investment has only recently been approved for the provision of an additional line between Durban and the Reef. With proper maintenance of pumps, valves and storage tanks, these facilities could provide a cost-efficient service indefinitely. Critical skills required include all present areas of engineering, differentiated engineering such as fluid engineering and in addition, operational, administration and service related skills. Passenger transport Alternative ways of moving commuters must be given preference in an attempt to reduce congestion on roads and alleviate the blockage of cities. Particularly between main centers, air transport can play a large role in alleviating the pressures of demand and road transport usage. Air transport has been the fastest growing mode of transport for passengers over most recent years. When considering the importance of air transport for South Africa one could argue that in the field of tourism its value is undeniably high, particularly if the side effects are the inflow of foreign exchange, job creation and the stimulation of local businesses. Current passenger transport issues in South Africa are complex. We have a legacy dating from the segregation of population groups through Apartheid and urban demographics cannot simply be willed away. The present urban rail routes will continue to serve the needs of major community groups but additional lines must be constructed to further integrate entire communities. The investment in the Gautrain will in due course also indicate to National Treasury whether other similar projects should to be undertaken. As mass movers of people in urban areas, the railway system can provide unmatched services but it must interface proactively with effective road feeder services and on an intermodal basis. The taxi industry has grown in an almost totally uncontrolled manner. This has led to excessive route congestion and confrontation between competing operators. Traditional bus service operators have suffered and continued industry violence has marred the image of South Africa internationally. Telecommunications The telecommunications sub-sector is one of the fastest changing sectors as new technologies are being explored and developed. Future skills shortages are expected to be in systems engineering, integration, networking and business analysis. These will be driven by the growth in the electronic communications network, mobile computing and the speed of work processes. POLICY RECOMMENDATIONS Policy recommendations are difficult to formalize due to the unique structure of the industry. Infrastructure is owned by various entities, i.e. the government directly
74
through agencies such as ACSA and SANRAL and indirectly through Transnet. In road and air transport only private undertakings operate on this infrastructure, but for rail, pipeline and harbours, operations are mostly effected by the infrastructure owner. The National Freight Logistics strategy calls for a separation of these responsibilities, but there is no clear cut agreement on this issue and many obstacles exist that could make vertical separation and open access difficult. The Department of Transport’s ability to strategically manage the various utilities of transport is varied with some successes in certain areas, but poor performance in others. This will have a profound effect in strategy formulation as statistics and market intelligence remain scattered and unorganized, strategies unfocussed and no single entity taking accountability for the sector. Central control will be difficult and probably unsuccessful, but policies could enforce central participation, harmonized statistics and combined planning systems. These should look at solutions for both the utilities and for the inputs required, such as labour, Solutions will only be found through a credible central planning agency to manage the many transitions that will be required. CONCLUSION All measures undertaken by government to advance economic growth, particularly ASGISA, JIPSA, GEAR and RDP initiatives will make a positive contribution in creating job opportunities and the upliftment of the poorer communities. It must be ensured that proper management is put in place to monitor and manage the implementation of plans and the streamlining and execution of these activities. Healthy competition will keep salary demands in check and also provide for increased levels of productivity amongst all workers. The latter will contribute towards bringing the cost of production and transport under control, providing competitive advantage when marketing locally and abroad. Under these conditions it is expected that economic growth and investment will flourish and predicted growth rate of 6% should be within easy reach. The negative effect of strikes and the ongoing threat of increased wages and higher levels of interest on loans will make it increasingly difficult for the South African economy to grow at envisaged levels. Job creation will also be negatively influenced by these latter developments.

75
REFERENCES 1 Time to list on ALTx.2007 [online] Available: http://www.altx.co.za/docs/altx/articles20070814 ACSA www.airports.co.za ASCA, (2007) ACSA Company Profile, Introduction of Annual Financial Statements Report 2007. [online] Available: http://www.airports.co.za/home.asp Airports Council International Global Forecast, 2006-2025 Author unknown, (2007) The big job call-up, Star. 01/02/07, p6. Bruggemans, C (2007) Business expansion to briskly enter 2008, Weekly Comment. FNB, 02/10/07 [Online] Available: https://www.fnb.co.za/economics/servlet/Economics?ID=3244 Burmeister, S (2006). The bricks and mortar of SA, Mail and Guardian, 16/11/2006, p6. Business Watch (2007) Nitty-gritty sectoral trends get lost in the GDP overview fog. 29/08/07 [Online] Available: http://www.busrep.co.za/index.php?fArticleId=4006615&fSectionId=554&fSetId=662 Cosatu (2006) Cosatu Secretariat Report to the Ninth National Congress to be held on 18 to 21 September 2006, Gallagher Estate, Midrand. CSIR (2004), The first State of Logistics Survey for South Africa 2004, CSIR. CSIR (2005), Second Annual State of Logistics Survey for South Africa 2005, CSIR. CSIR (2006), The Third Annual State of Logistics Survey for South Africa 2006, CSIR. Daniels, R.C. (2007) Skills Shortages in South Africa: A Literature Review. Development Policy Research Unit. DPRU Working Paper 07/121. ISBN: 978-1-920055-44-8. May. Department of Labour (date unknown) National Skills Development Strategy 1 April 2005 – 31 March 2010. [Online]. Available: www.labour.gov.za Department of Labour (2005) Department of Labour Market Review 2005. Online]. Available: www.labour.gov.za
76
Department of Labour (2006) State of Skills in South Africa, [Online]. Available: www.labour.gov.za Department of Trade and Industry (2006) Research Report: South African Labour Market: International Benchmarking against Selected Economies, 2006 Department of Trade and Industry (2007) Implementation of government’s national industrial policy framework: Industrial Policy Action Plan, August 2007 Department of Transport (2006) Moving South Africa: A Transport Strategy for 2020, [Online] Available: http://www.transport.gov.za/projects/msa/msa.html Department of Transport (2007) Public Transport Action Plan Phase 1 (2007-2010) Catalystic Integrated Rapid Public Transport Network Projects, published February 2007. Department of Transport (2007) Public Transport Strategy Department of Transport Annexure 1. March 2007. Esselaar, S, Gillwald, A, Stork, C. (2006) South African Telecommunications Sector Performance Review 2006. Link Centre Public Policy Research Paper No. 8. Witwatersrand University. Gantile, B (2007) Developing ICT Capacity for 2010 and beyond. Telkom Centre for Learning, Telkom SA Limited. 19 March 2007. International Civil Aviation Organization (ICAO) (2007) Buoyancy in Airline Traffic Continues in 2007. ICAO News Release PIO 13/07 [Online] Available: http://www.icao.int/icao/en/nr/2007/pio200713_e.pdf IDC, (2007) Accelerated and shared growth initiative – South Africa (AsgiSA). [Online] Available: http://www.idc.co.za/Other%20Downloads/IDC%20Website%202007%20ASGISA.pdf. JPC (2005) Employment Trends in South Africa Kraak, A (2004) An Overview of South African Human Resources Development. HSRC Press Le Roux, H (2007) South Africa casts new skills-development die amid acute shortages. Engineering News. Little, A.D. (2005) The Arthur D. Little Global Broadband Report Update 2005. Growth Fuels Disruption

77
Milne, A.M. (1960) The Economics of Transport. Sir Isaac Pitman & Sons, London, p23-29 National Department of Education www.education.gov.za National Ports Authority of South Africa www.npa.co.za National Treasury (2006) Provincial Budgets and Expenditure Review: 2003/4 – 2009/10, Department of Treasury National Treasury (2007) 2007 Economic policy and outlook: Budget review [Online] Available www.treasury.gov.za Pandor, N (2005) CSIR Convention Centre, Pretoria. Address by the Minister of Education, Naledi Pandor, MP, at the launch of the National Qualification Framework Support Link, 6 June 2005. [Online]. Available: http://www.saqa.org.za/show.asp?include=docs/sp/sp0606-05.html Pickworth E. (2007) Manuel laments SA skills dearth. FIN24: Empowering Financial Decisions. [Online] Available: http://www.fin24.co.za/articles/print_article.asp?articleid-1518-25_2073431 Pokroy, J. (date unknown) Facilitating the importation of skills into South Africa using the immigration act as a tool. [Online]. Available: http://196.35.70.185/apso/index.php?option=com_content&task=view&id=111&Itemid=164, Association of Personnel Service Organizations Radebe, J (2006) Address by Minister of Transport Jeff Radebe, MP at the Launch of Widney Transport Components (Pty) Ltd. 18 April 2006. [Online]. Available: http://www.arrivealive.co.za/oldletter.asp?p=letter&t=department&id=82 Ramos, M. (2007) [online], Available: http://www.transnet.ca.za/documents/GCE-medipercentationppt#757,32,Thewayforward Schumer, L.A. (1974) Elements of transport. Butterworth, Sydney, p1-7 Skills and Vacancies Project (2006) [online], Available: http://www.da.org.za/da/Site/Eng/campaigns/DOCS/SkillsVacancies_Project_2006.doc South African Reserve Bank www.resbank.co.za SAPA (2007) Boost for Maths and Science. Sunday Times. 19 August 2007.

78
Insight Research Corporation (2006) Telecommunications Industry Review The Presidency (2007) Development Indicators Mid-term review. Republic of South Africa, June 2007. [Online]. Available: www.info.gov.za/otherdocs/2007/developmentindicator/education.pdf Richardson, S (2006) What is a skill shortage? The National Institute of Labour Studies, Flinders University, Adelaide, Australia, August Sapa, (2007) Skills survey slams SA education. [Online]. Available: http://www.iol.co.za/index.php?set_id=1&click_id=105&art_id=nw20070620131754606C434318 [20/06/2007] Standard Bank (2007) Economic Profile, South Africa 2007. [Online] Available: http://ws9.standardbank.co.za/sbrp/DocumentDownloader?docId=1187 Standard Bank (2007) Labour alert. Research Economics. South Africa, 26/09/07 StatsSA (2005) P7000 StatsSA (2003) Land Freight transport. StatsSA, December 2003 Statistics South Africa www.statssa.gov.za Tourism Highlights 2006 Edition (World Tourism Organization) Transnet www.transnet.co.za www.gautrain.co.za www.info.gov.za www.mbendi.co.za www.polity.org.za www.sagoodnews.co.za www.southafrica.info www.transport.gov.za

79
APPENDIX 1: ACRONYMS
Acronym ACSA Airports Company of South Africa AsgiSA Accelerated and Shared Growth initiative for South Africa CESM Classification of Education Subject Matter DoL Department of Labour DoT Department of Transport FET Further Education and Training GDP Gross Domestic Product GFB General Freight Business GSM Groupe Speciale Mobile Hesa Higher Education South Africa HET Higher Education and Training HEMIS Higher Education Management Information System ICT Information, communications and technology JIPSA Joint Initiative for Priority Skills Acquisition LFS Labour Force Survey NGO Non Government Organizations NQF National Qualifications Framework OHS October Household Survey PSTN Public Switched Telephony Network SAQA South African Qualifications Authority SARB South African Reserve Bank SET Science, Engineering and Technology SETA Sector Education and Training Authority SHEQ Safety, Health, Environment and Quality SIC Standard Industrial Classification StatsSA Statistics South Africa TETA Transport SETA TSA Tourism Satellite Account VoIP Voice over internet protocol USAL Under-Services Area License