transport trends and challenges in the road sector filetransport trends and economics geneva, ......
TRANSCRIPT

(c) International Road Transport Union (IRU) 2011(c) International Road Transport Union (IRU) 2011
Transport Trends and Challenges in the Road Sector
UNECE Working Party on UNECE Working Party on Transport Trends and EconomicsTransport Trends and Economics
Geneva, 6Geneva, 6--7 September 20117 September 2011
Jens HügelHead – Sustainable DevelopmentJens Jens HHüügelgelHead Head –– Sustainable DevelopmentSustainable Development
Informal document No. 5Agenda item 6 (c)

This is the IRUThis is the IRU
(c) International Road Transport Union (IRU) 2011(c) International Road Transport Union (IRU) 2011

Evolution of IRU Evolution of IRU MembershipMembership
(c) International Road Transport Union (IRU) 2011(c) International Road Transport Union (IRU) 2011
CreatedCreatedin 1948in 1948
National Associations National Associations from 8 founding countriesfrom 8 founding countries
2011 2011 180 Members180 Members74 Countries74 Countries
BelgiumBelgiumBelgium DenmarkDenmarkDenmark FranceFranceFrance NetherlandsNetherlandsNetherlands
SwedenSwedenSweden UKUKUK SwitzerlandSwitzerlandSwitzerlandNorwayNorwayNorwayPage Page 33

Data SourceData Source
IRU Road IRU Road Transport IndicesTransport Indices
(GDP, transported t., (GDP, transported t., vehicle registrations)vehicle registrations)
(c) International Road Transport Union (IRU) 2011(c) International Road Transport Union (IRU) 2011
Survey ofSurvey ofIRU Members IRU Members
Page Page 44

BRIC CountriesBRIC Countries
(c) International Road Transport Union (IRU) 2011(c) International Road Transport Union (IRU) 2011
Continuous growth through and after crisisContinuous growth through and after crisisIn 2010: + 8.2% increase in transported In 2010: + 8.2% increase in transported tonnestonnesIn 2010: +13.7% increase in registered vehicles In 2010: +13.7% increase in registered vehicles
Page Page 55
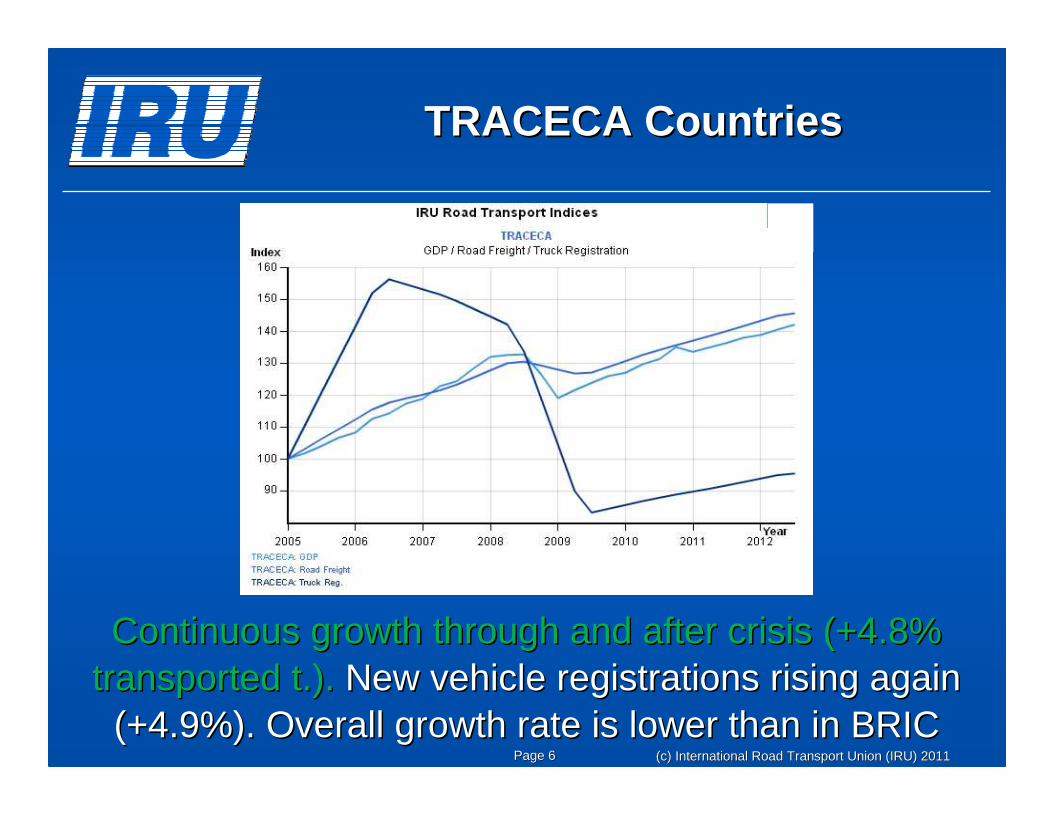
TRACECA CountriesTRACECA Countries
(c) International Road Transport Union (IRU) 2011(c) International Road Transport Union (IRU) 2011
Continuous growth through and after crisis (+4.8% Continuous growth through and after crisis (+4.8% transported t.). transported t.). New vehicle registrations rising again New vehicle registrations rising again
(+4.9%). Overall growth rate is lower than in BRIC (+4.9%). Overall growth rate is lower than in BRIC Page Page 66

OECD CountriesOECD Countries
(c) International Road Transport Union (IRU) 2011(c) International Road Transport Union (IRU) 2011
Reaching preReaching pre--crisis levels (transported t.)crisis levels (transported t.)Dramatic drop in new vehicle registrationsDramatic drop in new vehicle registrations
=>Transporting the same amount but with an older fleet=>Transporting the same amount but with an older fleetPage Page 77

EU CountriesEU Countries
(c) International Road Transport Union (IRU) 2011(c) International Road Transport Union (IRU) 2011
Recovering but still below preRecovering but still below pre--crisis levels crisis levels Pre/post crisis comparison (2008Pre/post crisis comparison (2008--11): 11): --10.4% in transported t. and 10.4% in transported t. and -
42.4% in new vehicle registrations42.4% in new vehicle registrations=>Transporting less with an older fleet=>Transporting less with an older fleet
Page Page 88

In focus: GreeceIn focus: Greece
..
(c) International Road Transport Union (IRU) 2011(c) International Road Transport Union (IRU) 2011
Not recovering and below preNot recovering and below pre--crisis levelscrisis levelsPre/Post crisis comparison (2008Pre/Post crisis comparison (2008––11): 11): --18% in 18% in
transported t. In 2010: transported t. In 2010: --3.6% decrease in transported t.3.6% decrease in transported t.Page Page 99

In focus: GreeceIn focus: Greece
(c) International Road Transport Union (IRU) 2011(c) International Road Transport Union (IRU) 2011
Not recovering and below preNot recovering and below pre--crisis levelscrisis levelsPre/Post crisis comparison (2008Pre/Post crisis comparison (2008––11): 11): --53.8% in new 53.8% in new
vehicle registrations. In 2010: vehicle registrations. In 2010: --15% decrease in new vehicle 15% decrease in new vehicle registrationsregistrations
Page Page 1010

In Focus: GreeceIn Focus: GreeceChallenges and OpportunitiesChallenges and Opportunities
Transport Transport licencelicence was necessary: was necessary: Investments of ~100,000 Investments of ~100,000 €€ ((LicencesLicences were were limited to 33,000. No additional licenses limited to 33,000. No additional licenses issued since 1970!)issued since 1970!)
Financial crisis and economic slowdown Financial crisis and economic slowdown made it hard to repay loanmade it hard to repay loan
Since 2010: Since 2010: LiberalisationLiberalisation of road transport of road transport market lead to increase of competition and market lead to increase of competition and decrease value of licensesdecrease value of licenses
(c) International Road Transport Union (IRU) 2011(c) International Road Transport Union (IRU) 2011Page Page 1111

In Focus: GreeceIn Focus: GreeceChallenges and OpportunitiesChallenges and Opportunities
Austerity measures lead to increased taxesAusterity measures lead to increased taxes
Increased fuel priceIncreased fuel price
(c) International Road Transport Union (IRU) 2011(c) International Road Transport Union (IRU) 2011Page Page 1212

In Focus: GreeceIn Focus: GreeceChallenges and OpportunitiesChallenges and Opportunities
Economic decline and decrease in Economic decline and decrease in purchase power lead to less international purchase power lead to less international transport of goods (import and export)transport of goods (import and export)
PrivatisationPrivatisation of state companies (railways, of state companies (railways, harboursharbours, logistic , logistic centrescentres, etc.) opens new , etc.) opens new investment and transport opportunitiesinvestment and transport opportunities
(c) International Road Transport Union (IRU) 2011(c) International Road Transport Union (IRU) 2011Page Page 1313

Key cost and efficiency drivers in Key cost and efficiency drivers in the road transport sectorthe road transport sector
(c) International Road Transport Union (IRU) 2011(c) International Road Transport Union (IRU) 2011Page Page 1414Source: Source: CapgeminiCapgemini 20112011
The only certainty is the uncertainty!The only certainty is the uncertainty!Recommendation to Transport Operators:Recommendation to Transport Operators:
Transport only if you can make profit!Transport only if you can make profit!
Key cost drivers in 2011 are fuel price, vehicle costs and labour costs
* * * * *

IRU Resolution –Strategy for Governments
• Road transport is a production tool
• Stop penalising road transport with new regulatory burdens and new fiscalities
• Facilitate trade and road transport
(c) International Road Transport Union (IRU) 2011(c) International Road Transport Union (IRU) 2011Page Page 1515

Save the date!Save the date!
Page Page 1616 (c) International Road Transport Union (IRU) 2011(c) International Road Transport Union (IRU) 2011

www.iru.orgwww.iru.org
(c) International Road Transport Union (IRU) 2011(c) International Road Transport Union (IRU) 2011Page Page 1717