transportation annual report forecastpreview.thenewsmarket.com/previews/cnha/document... · it’s...
TRANSCRIPT
Provided as a service to the industry through the partnership of Construction Equipment and Case Construction Equipment.
SPECIAL REPORT2016 ANNUAL REPORT&FORECAST
Construction Overview
Equipment Fleets
Transportation
Water Infrastructure
Home Building
Nonresidential
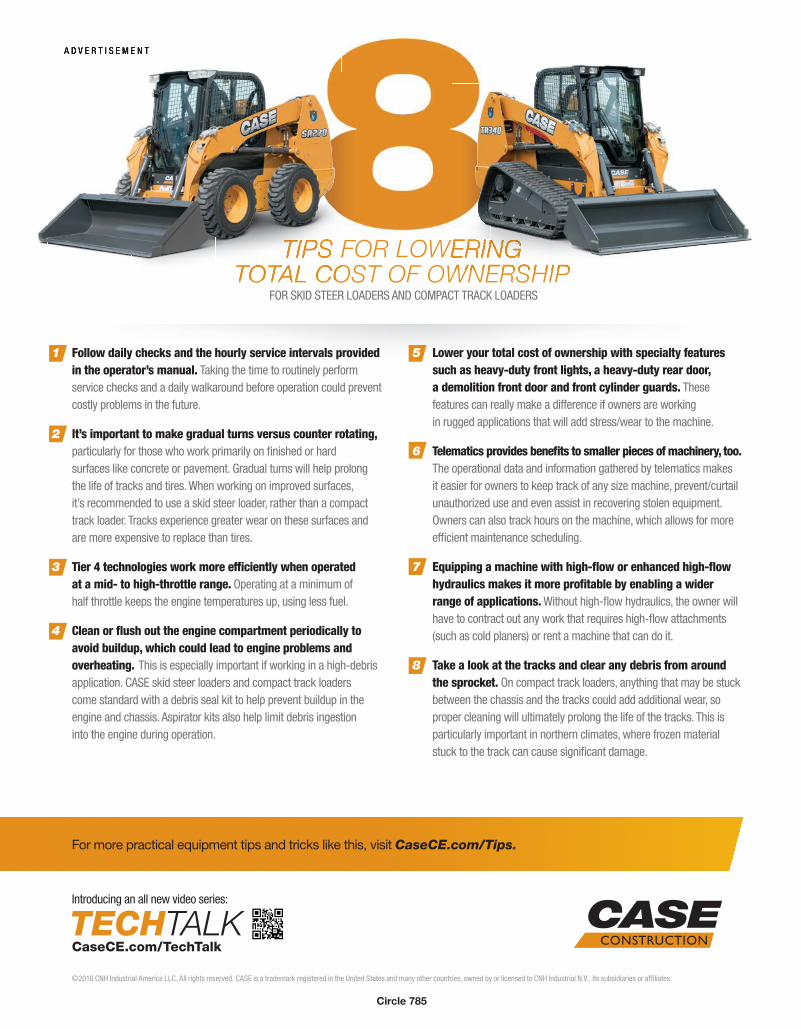
1 Follow daily checks and the hourly service intervals provided in the operator’s manual. Taking the time to routinely perform service checks and a daily walkaround before operation could prevent costly problems in the future.
2 It’s important to make gradual turns versus counter rotating,particularly for those who work primarily on fi nished or hard surfaces like concrete or pavement. Gradual turns will help prolong the life of tracks and tires. When working on improved surfaces, it’s recommended to use a skid steer loader, rather than a compact track loader. Tracks experience greater wear on these surfaces and are more expensive to replace than tires.
3 Tier 4 technologies work more effi ciently when operated at a mid- to high-throttle range. Operating at a minimum of half throttle keeps the engine temperatures up, using less fuel.
4 Clean or fl ush out the engine compartment periodically to avoid buildup, which could lead to engine problems and overheating. This is especially important if working in a high-debris application. CASE skid steer loaders and compact track loaders come standard with a debris seal kit to help prevent buildup in the engine and chassis. Aspirator kits also help limit debris ingestion into the engine during operation.
5 Lower your total cost of ownership with specialty features such as heavy-duty front lights, a heavy-duty rear door, a demolition front door and front cylinder guards. These features can really make a difference if owners are working in rugged applications that will add stress/wear to the machine.
6 Telematics provides benefi ts to smaller pieces of machinery, too. The operational data and information gathered by telematics makes it easier for owners to keep track of any size machine, prevent/curtail unauthorized use and even assist in recovering stolen equipment. Owners can also track hours on the machine, which allows for more effi cient maintenance scheduling.
7 Equipping a machine with high-fl ow or enhanced high-fl ow hydraulics makes it more profi table by enabling a wider range of applications. Without high-fl ow hydraulics, the owner will have to contract out any work that requires high-fl ow attachments (such as cold planers) or rent a machine that can do it.
8 Take a look at the tracks and clear any debris from around the sprocket. On compact track loaders, anything that may be stuck between the chassis and the tracks could add additional wear, so proper cleaning will ultimately prolong the life of the tracks. This is particularly important in northern climates, where frozen material stuck to the track can cause signifi cant damage.
S T
For more practical equipment tips and tricks like this, visit CaseCE.com/Tips.
CaseCE.com/TechTalk
Introducing an all new video series:
©2016 CNH Industrial America LLC. All rights reserved. CASE is a trademark registered in the United States and many other countries, owned by or licensed to CNH Industrial N.V., its subsidiaries or affi liates.
TIPS FOR LOWERINGTOTAL COST OF OWNERSHIP
FOR SKID STEER LOADERS AND COMPACT TRACK LOADERS
Circle 785

Construction Equipment/Annual Report & Forecast | January 2016
sional Builder, representing the home
building industry; Roads & Bridges,
reporting on the transportation indus-
try; and Water & Wastes Digest, which
covers the country’s water infrastruc-
ture issues.
Inside our 2016 Annual Report &
Forecast, we report on the industry as a
whole, then each magazine’s editor an-
alyzes the individual market for a more
detailed look at the upcoming year.
We express our appreciation and
thanks to Case Construction Equip-
ment for its continuing partnership
with us in presenting this analysis of
the construction industry. Case is a
full-line manufacturer of earthmoving
equipment, and its support of this proj-
ect allows us to publish substantial
amounts of data and analysis for the
industry’s use.
3
A s 2015 ended, indications from all construction sectors were that the year
was better than expected. Initial forecasts predict ongoing growth, at least
those from two major construction data fi rms.
By ROD SUTTON, Editorial Director
3
The 2016 Dodge Construction Out-
look suggests that overall construction
starts will grow in the range of 6 per-
cent following estimated growth of 13
percent in 2015. CMD Group says
starts will grow 8.4 percent in 2016.
Several factors contribute to the rosy
outlook, spearheaded by the five-year,
$305 billion federal highway funding
program signed into law as the year
wrapped up.
The residential housing market has
rebounded strongly. Although it re-
mains cautious, the outlook for new-
home construction is fueling overall
construction optimism. Water infra-
structure funding was included in fed-
eral legislation in 2014, and those dol-
lars are reaching the sector.
The thorn on the rose, however, is
construction labor. Some observers
speculate that finding qualified skilled
labor may even delay projects. Nearly
every respondent in this year’s An-
nual Report & Forecast consider it a
challenge for 2016.
Respondents are managers in the
various construction markets. Con-struction Equipment has surveyed
equipment users and construction
managers about business and fleet
performance for more than 30 years in
order to present an annual business
review and outlook for the industry.
Once again, we have partnered with
several sister publications in specific
construction vocations to obtain a
broad view of the construction indus-
try overall. Our Scranton Gillette/SGC
Horizon partners include Building Design+Construction, representing
the nonresidential market; Profes-
Another Step Forward In Business Confidence
®
Economists and survey respondents in all sectors forecast another year of construction growth to follow up a strong 2015. On the horizon, however, looms growing concern about labor to do the work.
INTRODUCTION2016 ANNUAL REPORT & FORECAST

January 2016 | Construction Equipment/Annual Report & Forecast4
Expectations for 2015 included
pockets of confidence across
the country and within the con-
struction industry. The year turned
out “good” in every region except
the booming Southern Plains, which
was “very good.” Last year also was
“good” for each of the markets cov-
ered by the Scranton Gillette/SGC
Horizon publications. Fleet managers,
which work within all construction
markets and have a more nuanced
view of business conditions, said 2015
was a “very good” year.
Forecasts for this year are even
better as confidence appears to be
solidifying.
Home building and nonresidential
markets have a marked change in the
way they view 2016 compared to 2015.
Both expect this year to be a “very
good” business year after 2015,
which both rated as “good.” The water
infrastructure market expects 2016 to
mirror last year for business, forecast-
ing another “good” year. Overall, ex-
pect 2016 to be a “very good” year
for construction.
This positive outlook also transcends
region. Whereas the Southern Plains
was the only region reporting a “very
good” year for 2015, all regions have
similar expectations for 2016.
Revenue within the industry should
be on the uptick, based on respon-
dents’ expectations for contract vol-
ume. As an industry, 53.7 percent ex-
pect volume to increase and 11.4
expect it to decrease, resulting in a
positive net of 42.3 percent across all
vocations. Home builders, not surpris-
ing given the length of that industry’s
downturn, have the strongest net at
55.5 percent (60.8 percent expecting
contract volume increases minus 5.3
Nonresidential reported the most positive business year, aside from fl eet managers. For
2016, home building shows renewed confi dence and co-leads expectations along with
nonresidential.
By ROD SUTTON, Editorial Director
Markets Rebound,Continue Upward
2016 ANNUAL REPORT & FORECAST
Annual Report & Forecast MethodologyScranton Gillette Communica-tions and SGC Horizon publish several magazines in the con-struction sector. Participants in the 2016 Annual Report &
Forecast asked their sub-scriber base about not only overall construction trends, but also trends specific to the con-struction sector in which they
work. Each publication sent email invitations to its sub-scribers, inviting participation in an online survey.
More than 1,200 responded.
Respondents by market include nonresidential, 332; fleet man-agers, 276; home builders, 209; transportation, 198; water infra-structure, 221.

Construction Equipment/Annual Report & Forecast | January 2016 5
percent expecting decreases). Trans-
portation reported a net of 21.4 percent
(38.2 expected increases minus 16.8
expecting decreases).
Less difference exists across region-
als. The net for the South Atlantic re-
gion tops out the country at 55.5 per-
cent (63.9 percent expecting increases
minus 8.4 expecting decreases). The
Great Lakes region has the lowest net,
44.3 percent, representing 56.1 percent
expecting increases minus 11.8 expect-
ing decreases.
Bid prices should also increase next
year, with a net of 60.8 percent (64.6
percent of respondents expecting bid
prices to increase minus only 3.8 per-
cent expecting decreases). Nonresi-
dential respondents are the most bull-
ish, with 72 percent expecting bid price
increases, and transportation the least,
with 58 percent expecting increases.
Material prices will contribute to in-
creases in bid pricing, with the indus-
try reporting a net of 73.5 percent (75.5
percent expecting increases in material
prices minus 2 percent expecting de-
creases). Among home building re-
spondents, 83 percent expect material
prices to increase in 2016; among
transportation and water infrastructure
respondents, 70.1 percent expect
increases.
Even so, several industry reports cite
labor cost as the true driver of increas-
ing construction costs. “My No. 1 con-
cern is the availability of labor,” said
Ken Simonson, economist with Associ-
ated General Contractors of America.
Competition within industries and in
construction as a whole continues
strong, according to respondents. In
This year has high expectations written all over it, as every region
is forecasting a “very good” business year for 2016.
Expectations for gains in revenue in 2016 differ by market group. The net is positive, but
the range runs from 21 percent in transportation to 56 percent among home builders.
Business was uniformly “good” last year, with New England,
Mid-Atlantic, Great Lakes, Southern Plains and Pacifi c States
beating expectations.
5
INDUSTRY OVERVIEW

January 2016 | Construction Equipment/Annual Report & Forecast6
The national net for material prices is 74, with only slight variances
across regions.
The national net for bid prices is 61, but regional forecasts are
tempered by market differences.
All markets forecast bid prices to increase this year. Nonresidential
has the greatest expectations for increases.
Expect material prices to go up in 2016. Home building and nonresi-
dential forecasts are the strongest.
INDUSTRY OVERVIEW
2015, 68 percent of respondents said
their markets were “intensely” or
“very” competitive. This response mir-
rors the 2014 results.
Market competition varies, with non-
residential reporting the most competi-
tive construction market: 84 percent
said their market was “intensely” or
“very” competitive. Seven of 10 trans-
portation respondents said their mar-
ket was “intensely” or “very” competi-
tive, and 63 percent of home builders
said the same. The water infrastructure
market was labeled “intensely” or
“very” competitive by fewer than half
of respondents: 46 percent.
Overall firm health continues strong,
with 67 percent of respondents de-
scribing it as “very good” or “good” in
2015. Managers of firms in the water
infrastructure sector were the most
positive, with 75 percent reporting that
overall firm health was either “very
good” or “good.”

Construction Equipment/Annual Report & Forecast | January 2016 7
As demand for construction
projects builds, so does the
demand for the equipment to
do that work. Construction equipment-
fleet managers who put in place ac-
quisition and maintenance strategies
to weather the downturn of the past
several years now see opportunity to
ramp up and replenish fleets.
Acquisition decisions, however, in-
clude new equipment with engine-
emission technology. Fleet managers
will consider the cost of Tier 4-Final
machines as they adjust strategies for
not only purchase and rental, but also
maintenance and lifecycle
management.
They will adjust, according to results
from this year’s survey of Construction Equipment subscribers. Among those
who responded to our 2015-16 Annual
Report and Forecast questionnaire, the
outlook is positive. They expect to ex-
pand their fleets of construction equip-
ment this year and replace machines
that have expended their useful lives.
Last year’s business-year rating ex-
ceeded expectations. At the end of
2014, fleet managers predicted a
“good” business year for 2015; in-
stead, 2015 turned out to be “very
good.” Notably, this is the highest rat-
ing for business in several years. The
momentum is expected to carry into
2016, with managers forecasting it to
also be “very good.” Since equipment
fleets represent the most capital-inten-
sive investment a construction organi-
zation has, fleet manager sentiment re-
flects the industry’s willingness and
ability to put machines to work.
Contract volume trends support this
notion. Expectations for 2015 were
solid, and the year outperformed the
forecast. In fact, 2015 marked the third
consecutive year that the percentage
of respondents reporting volume in-
creases outweighed the percentage re-
porting decreases. This net percentage
(increases minus decreases) was 39.6
percent for 2015, up from 31.9 in 2014
By ROD SUTTON, Editorial Director
Managers Stand Ready For Fleet Improvements
Fleets expanded at a rate much stronger than expected. The net of 30 percent is the
highest response since 2006 and well above the 20 percent net that was predicted.
Replacement rates continued their rebound, too, slightly higher than expected and now in
what has historically been a normal range of 9 percent to 10 percent.
7
2016 ANNUAL REPORT & FORECAST CONSTRUCTION EQUIPMENT FLEETS
January 2016 | Construction Equipment/Annual Report & Forecast8
and completely reversing the net of
-15.4 percent recorded in 2011.
Expectations for 2016 are even more
positive, with a net of 44.2 percent
(56.3 percent expecting contract vol-
ume to increase minus 12.1 percent
expecting it to decrease). The 5-point
increase in net compared to 2015
comes from a reduction in the percent-
age of managers expecting volume to
decline: 18 percent in 2015 versus 12.1
percent in 2016.
A similar trend exists with expecta-
tions for bid prices. Last year, the net
was 45.9 percent, with 55 percent of
managers expecting increases minus
9.1 expecting decreases in bid prices.
This year, the net is 58.9 percent. Some
62.9 percent expect their operations to
increase bid prices, and only 4 percent
expect those prices to go down.
Fleet trendsIn response, fleets expanded in 2015 at
a pace not seen since 2007. Last year,
fleet managers tempered their expec-
tations on fleet changes for several
reasons, including transportation fund-
ing uncertainties and new engine tech-
nologies on equipment. As the year
progressed, however, fleet expansion
opened up.
At the end of 2014, 27 percent of
fleet managers expected to increase
fleet size in 2015 and 10 percent ex-
pected to decrease fleet. That left a
forecast net of 17 percent. Actual per-
centages for 2015 provide a net of 29.9
percent (38.5 percent reporting fleet
expansion in 2015 minus 8.6 percent
with fleet decreasing in size).
For 2016, expectations continue
strong. Some 37.8 percent expect to
grow fleet this year minus 4.7 who
expect to decrease fleet for a net of
33.1 percent.
Machine-replacement rates are also
reaching pre-recession numbers. This
year, respondents forecast an average
replacement rate of 9.4 percent, well
within the historically healthy range of
9 percent to 10 percent. The rate in
2015 was also healthy at 9.1 percent
and also beat expectations; the fore-
cast rate was 8.8 percent.
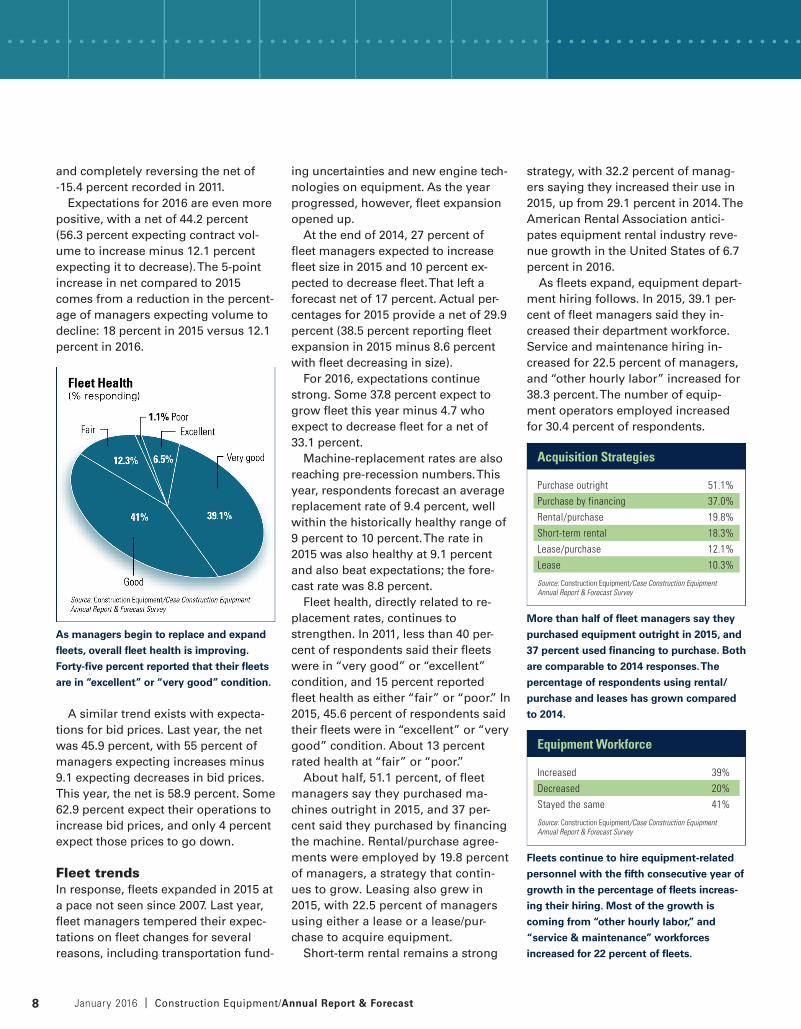
Fleet health, directly related to re-
placement rates, continues to
strengthen. In 2011, less than 40 per-
cent of respondents said their fleets
were in “very good” or “excellent”
condition, and 15 percent reported
fleet health as either “fair” or “poor.” In
2015, 45.6 percent of respondents said
their fleets were in “excellent” or “very
good” condition. About 13 percent
rated health at “fair” or “poor.”
About half, 51.1 percent, of fleet
managers say they purchased ma-
chines outright in 2015, and 37 per-
cent said they purchased by financing
the machine. Rental/purchase agree-
ments were employed by 19.8 percent
of managers, a strategy that contin-
ues to grow. Leasing also grew in
2015, with 22.5 percent of managers
using either a lease or a lease/pur-
chase to acquire equipment.
Short-term rental remains a strong
strategy, with 32.2 percent of manag-
ers saying they increased their use in
2015, up from 29.1 percent in 2014. The
American Rental Association antici-
pates equipment rental industry reve-
nue growth in the United States of 6.7
percent in 2016.
As fleets expand, equipment depart-
ment hiring follows. In 2015, 39.1 per-
cent of fleet managers said they in-
creased their department workforce.
Service and maintenance hiring in-
creased for 22.5 percent of managers,
and “other hourly labor” increased for
38.3 percent. The number of equip-
ment operators employed increased
for 30.4 percent of respondents.
As managers begin to replace and expand
fl eets, overall fl eet health is improving.
Forty-fi ve percent reported that their fl eets
are in “excellent” or “very good” condition.
Acquisition Strategies
Equipment Workforce
Purchase outright 51.1%Purchase by financing 37.0%Rental/purchase 19.8%Short-term rental 18.3%Lease/purchase 12.1%Lease 10.3%
Source: Construction Equipment/Case Construction Equipment Annual Report & Forecast Survey
Increased 39%Decreased 20%Stayed the same 41%
Source: Construction Equipment/Case Construction Equipment Annual Report & Forecast Survey
More than half of fl eet managers say they
purchased equipment outright in 2015, and
37 percent used fi nancing to purchase. Both
are comparable to 2014 responses. The
percentage of respondents using rental/
purchase and leases has grown compared
to 2014.
Fleets continue to hire equipment-related
personnel with the fi fth consecutive year of
growth in the percentage of fl eets increas-
ing their hiring. Most of the growth is
coming from “other hourly labor,” and
“service & maintenance” workforces
increased for 22 percent of fl eets.

CONSTRUCTION EQUIPMENT FLEETS
Higher acquisition costs associated with Tier 4 equipment is the top concern for fl eet
managers, with nearly half of respondents citing it. A collection of maintenance items
concern more than one-third of respondents, and 21 percent expressed concern over fuel
cleanliness.
Tier 4 Equipment’s Effect on Plans
Nearly all models in major ma-chine categories have been up-dated with Tier 4-Final engines.
Yet many fleet managers have hesi-tated to purchase the new equipment. Many fleets have Tier 3 machines with many hours of useful life available; oth-ers are cautious about investing in equipment when project backlogs are still light.
Still others, according to our research, are concerned about increased prices of machines equipped with the latest emission-reducing technologies.
The re-engineering and research-and-development costs associated with producing machines that meet EPA-mandated emissions standards must be recouped, so manufacturers haved increased prices for equipment with Tier 4-Final engines.
Fleet managers have responded to cost increases in three ways: They have or will boost equipment-acquisi-tion budgets, they will reduce the num-ber of machines they replace, or they will turn to alternative acquisition strategies such as rental or used-equipment purchases.
But purchase price isn’t the only concern, although it is the No. 1 issue. Maintenance of machines with emis-sions technologies also causes heartburn.
The population of Tier 4 equipment is small, so managers do not have histori-cal data or actual experience with maintenance to know what to expect. Diesel exhaust fluid must be managed and integrated into field-maintenance procedures. Technicians must be trained. Diesel particulate filters must be properly regenerated and cleaned.
Only 10 percent of respondents are “generally prepared” for Tier 4 equip-ment. The accompanying data show why the other 90 percent are not.
Slightly more than
one-fourth of respon-
dents said cost increases
will not affect acquisition
plans this year, and
another 14 percent said
they will increase
budgets for purchases.
About 25 percent will
rent Tier 4 equipment or
buy used equipment
rather than buy higher-
priced Tier 4 machines.
Construction Equipment/Annual Report & Forecast | January 2016 9

ARON RODMANVALUES SETTINGS THAT ACCOMMODATE BOTH NEW AND SKILLED OPERATORS
YANNICK GAGNEDOES MORE WITH THE SAME AMOUNT OF FUEL
GEORGE HARDAWAYFOUND UNEXPECTED POWER AND FINESSE
©2016 CNH Industrial America LLC. All rights reserved. CASE is a trademark registered in the United States and many other countries, owned by or licensed to CNH Industrial N.V., its subsidiaries or affi liates.
HEAR WHAT REAL OWNERS HAVE TO SAY. CaseCE.com/RealStories
POWERFUL. INTUITIVE. EASY MAINTENANCE. FUEL EFFICIENT.
BUT DON’T TAKE OUR WORD FOR IT.

STEPHEN CHAMNESSOPTS FOR LOW TCO AND SIMPLE MAINTENANCE
BILL STEELEBELIEVES CAB COMFORT INCREASES OPERATOR PRODUCTIVITY
SINCE 1842
Circle 786
January 2016 | Construction Equipment/Annual Report & Forecast12
Tom Foss is starting to hear the
threats just when the teasing ap-
pears to be coming to an end.
For years, Congress had played with
the minds of those in the road and
bridge industry regarding the passage
of a multiyear highway bill. Hope
would build and then be snuffed out in
the form of another funding extension.
Recent developments on Capitol Hill
had anticipation finally feeling like re-
alization. After members of the House
and Senate came together and agreed
on a five-year, $305 billion bill, called
the Fixing America’s Surface Transpor-
tation (FAST) Act, both chambers
quickly passed the measure. President
Obama signed it into law on Dec. 4.
Back in California, Foss, who leads
Griffith Co. in the city of Brea, is eager
to see an influx of federal dollars fun-
nel through, but he also is making sure
his operation is running a tight ship,
otherwise it could be raided by a new
band of fines.
New storm-water regulations will be
enforced in California, and will require
transportation contractors to use silt
fences, sand bags, straw wattles, and
bales of hay to prevent runoff from the
job site from entering the state’s water
system.
Two other requirements affect the
labor end of the operation. One is a
federal rule calling for the hiring of
local workers.
Griffith Co. has projects all over
southern California, and when they
enter a city or town they must actively
pursue the laborers in the area. When
Foss has to rotate people in and out to
meet local hiring regulations, it affects
his production. Another rule, which re-
quires workers to take a 10-minute
break for every four hours of work, has
been in play since 2002, but many con-
tractors such as Griffith are still trying
to make sure everything is properly
documented. Foss could have hun-
dreds of workers covering a 16-mile
project, so the process is extremely dif-
ficult. Every week or so each crew
member is required to sign a docu-
ment stating that they have been re-
ceiving their breaks.
The now infamous and more strin-
gent air-quality regulations from the Cal-
ifornia Air Resources Board (CARB) also
loom on the horizon. Like most contrac-
tors, Griffith Co. is in the process of re-
placing or retrofitting its fleet of equip-
ment so that all machines have Tier
4-Final engines.
Comfortable enoughDespite the pressure of the law, Griffith
Co. had a solid year in 2015. The Or-
ange County contractor was expected
to register $300 million in volume. As
for 2016, Foss is expecting more of a
normal construction season, which is
about $200-$230 million in volume.
Griffith and Co. could benefit slightly
from the new federal multiyear bill, but
it will not come in the form of new jobs
until the tail end of the year. Currently,
Griffith is handling a lot of work that
was awarded over the past two years,
and for most of 2015 cities and coun-
ties were slow to advertise new jobs
because of the funding situation in
Washington.
“Getting a bill I think will allow the
city and county agencies to begin to
put out their projects, and that will ease
up everything for a company like ours
as far as competition and things like
that,” said Foss. “There will be more
work, and the contractor pool will just
get spread a little further so there will
be less bidders on every job.”
For bridge contractors in the state of
New York, the funding pool received
some needed depth in 2015. New
York’s Critical Bridges over Water
(CBOW) initiative was fed with billions
of dollars, with some coming from
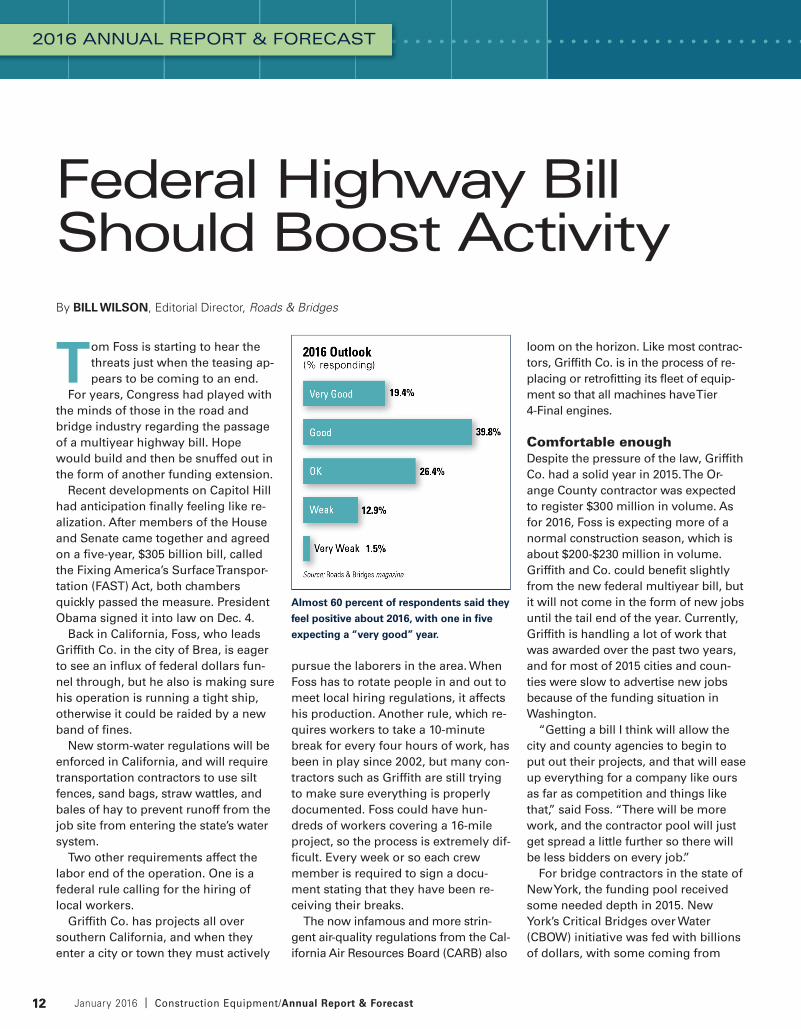
Almost 60 percent of respondents said they
feel positive about 2016, with one in fi ve
expecting a “very good” year.
By BILL WILSON, Editorial Director, Roads & Bridges
Federal Highway Bill Should Boost Activity
12
2016 ANNUAL REPORT & FORECAST
Construction Equipment/Annual Report & Forecast | January 2016 13
Housing and Urban Development and
even more from bank settlements.
Gov. Andrew Cuomo also supplied
New York City and its Metropolitan
Transit Authority with $8.3 billion, and
a group called Rebuild New York called
for funding parity.
“If the MTA needs $25 billion over
the next five years, we are saying the
highway guys upstate need $25 billion
over the next five years,” Jeff DiSte-
fano, co-owner and CEO of Harrison
Burrowes Bridge Constructors, said.
“Ten years ago, we had close to parity
with the MTA and then through some
governor and assembly leader
changes it kind of fell off track.”
You might say Harrison Burrowes is
a VIP of New York’s bridge bash. The
company experienced 20 to 30 percent
growth last year compared to 2014,
and the backlog is full for 2016.
One of the 2016 projects is a design-
build joint venture, which falls under
CBOW, that involves 18 bridges, and
there are two more jobs that will in-
volve single structures.
A part of Harrison Burrowes’ profit
will turn into investment, especially on
the equipment side. DiStefano said six
to eight pieces were new in 2015, and
four to six pieces could be bought in
2016 if revenues continue to be on the
upswing.
“We are a little bit concerned about
next year with the ongoing projects in
the Hudson Valley,” said DiStefano.
“There is...a lot of work down there in
the Hudson Valley, and I’m questioning
if the unions can supply the help that
we need.”
Good way of looking at itAs a whole, contractors in the road
and bridge industry have not been
searching for many answers when it
has come to generating capital. Ac-
cording to the most recent state of the
industry survey conducted by Roads & Bridges, almost 70 percent of respon-
dents rated 2015 as either a “good” or
“very good” year, and almost 60 per-
cent said 2016 will be a success as
well. More money could be on the
table, too. When asked if they expect
bid prices to go up, down or stay the
same in 2016, more than 57 percent
said they believe the prices will go up.
Alison Premo Black is the chief econ-
omist for the American Road and
Transportation Builders Association
(ARTBA) and puts together a market
report every year. Her numbers
showed 7 percent growth in the road
and bridge industry for 2015, and most
of the contractors are feeling better
about the business climate.
“They feel like things are returning to
more of a normal market,” Premo Black
said. “After 10 years of short exten-
sions, the industry also has adapted.
This has been the new normal, so I
think to a large extent that mentality
has been adopted by the industry.”
Breaking it down, according to
ARTBA, which looks at the value of
construction put in place, work in the
highway sector (pavements) ended up
at $55.9 billion in 2015. The average
since 2000 has been about $60 billion,
but it was as low as $51 billion in 2013.
On the flip side, bridge work contin-
ues to do its best work. The value of
construction put in place for 2015 was
$33.3 billion.
Construction activity in Florida, New
York, Indiana and California was partic-
ularly high in 2015, but contract
awards were up in almost half of the
states. Big projects stoked the overall
numbers.
Even with a long-term highway bill,
ARTBA is only projecting 3.9 percent
growth in the road and bridge market
in 2016. Premo Black believes the re-
covering economy will play a larger
role than will a new dose of federal
funding. ARTBA is predicting $58.1 bil-
lion worth of work in the highway sec-
tor and $34.6 billion for bridges in
2016.
Funding is still falling far short of
what is needed to address an overall
network that remains in critical condi-
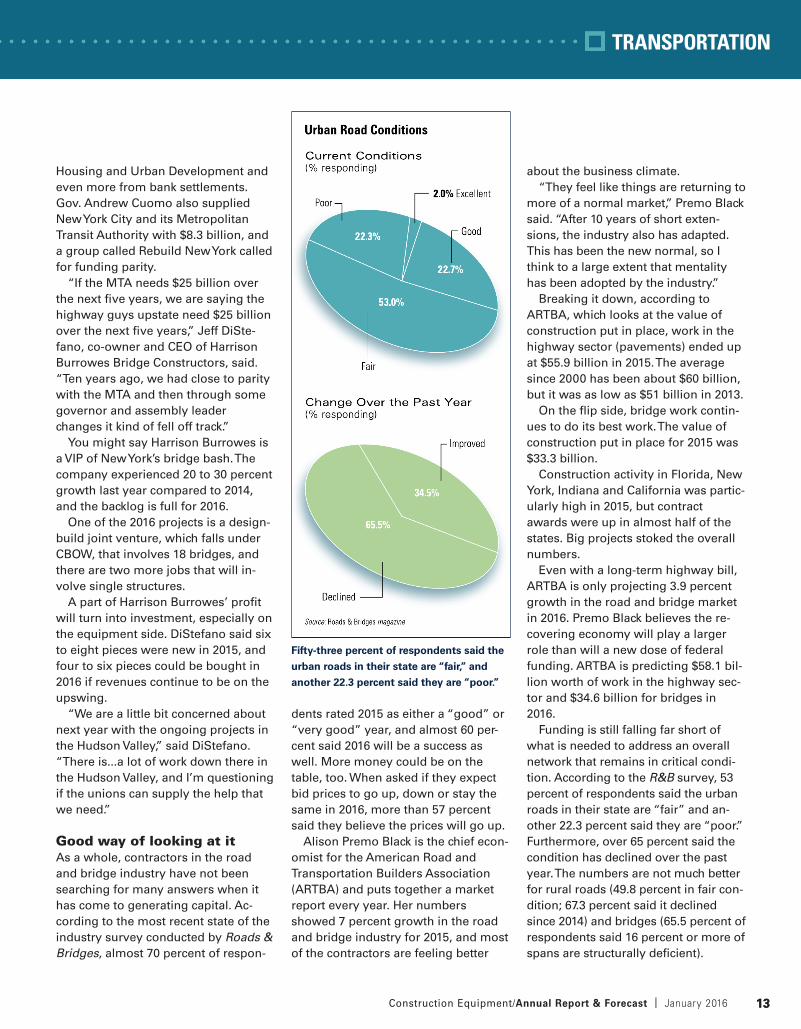
tion. According to the R&B survey, 53
percent of respondents said the urban
roads in their state are “fair” and an-
other 22.3 percent said they are “poor.”
Furthermore, over 65 percent said the
condition has declined over the past
year. The numbers are not much better
for rural roads (49.8 percent in fair con-
dition; 67.3 percent said it declined
since 2014) and bridges (65.5 percent of
respondents said 16 percent or more of
spans are structurally deficient).
Fifty-three percent of respondents said the
urban roads in their state are “fair,” and
another 22.3 percent said they are “poor.”
13
TRANSPORTATION

January 2016 | Construction Equipment/Annual Report & Forecast14
Despite a steady decline in fund-
ing, the water industry remains
positive-thinking and poised for
growth. This positivity, however, is a
muted shade of the assurance noted a
year ago.
Last year, Water & Wastes Digest’s
2014 State of the Industry report
showed a modest upswing in the
works; however, that optimism was
quieter in the 2015 State of the Indus-
try. Seventy-six percent of respondents
called 2015 good to excellent, while 80
percent stated last year that 2014 was
good to excellent. It appears as though
2015 fell short of last year’s expecta-
tions, too, as 86 percent of last year’s
respondents thought 2015 was going
to be good to excellent.
Although 2014 saw 44.1 percent of
respondents’ revenues increase, 2015
yielded only 31.6 percent of respon-
dents with the same good fortune. The
portion of respondents who claimed a
revenue decrease remained the same
between 2014 and 2015—18.9 percent.
There is markedly less confidence in
next year panning out to be a good
year than was noted in last year’s sur-
vey: In 2014, only 6.9 percent of survey
respondents predicted a revenue de-
crease for 2015; but in this year’s sur-
vey, 12.6 percent of respondents think
their revenue will decrease next year.
Similarly, the number of respondents
reporting a good or very good overall
firm health dropped about four per-
centage points between 2014 and 2015,
with 69 percent of respondents claim-
ing good to very good overall firm
health, compared with 73 percent who
claimed the same thing in 2014.
Almost one-third (30 percent) of re-
spondents are planning construction
of new water/wastewater facilities
within the next 24 months. An addi-
tional 10 percent have new construc-
tion plans within 36 months. More
than half (55 percent) are planning to
upgrade their facilities. This number is
slightly down from last year, when it
was 59 percent of respondents plan-
ning an upgrade.
The largest percentage of respon-
dents’ budgets will be invested in pipe/
distribution over the next 24 months.
This will account for 12 percent of bud-
get expenditure. Sewer/collection and
pumping equipment are the next-high-
est expenditures, with 10 percent of
budget allocated for each over the next
24 months.
Almost three-quarters (72 percent) of
survey respondents are involved with
determining needs, 50 percent evalu-
ate brands, 62 percent specify prod-
ucts and vendors, and 39 percent have
authorizing and approval responsibil-
ity. Overall, 87 percent of respondents
are involved in the buying process.
What keeps the water industry up at
night? According to WWEMA, it’s fund-
ing—or, more accurately, the lack
thereof. In June, Senate Appropria-
tions Committees approved FY16 fed-
eral spending bills for the Department
of the Interior, which includes funding
for the Clean Water and Drinking Water
state revolving loan funds (SRFs). Not
More than eight in 10 water and wastewater respondents anticipate a “good,” “very good,”
or “excellent” business climate in 2016.
By ELISABETH LISICAN, Managing Editor, Water & Wastes Digest
Water Industry Poised for Growth
14
2016 ANNUAL REPORT & FORECAST

Construction Equipment/Annual Report & Forecast | January 2016 15
surprisingly, funding levels for both
were decreased as compared to their
FY15 levels: at $1.853 billion for FY16,
down from $2.35 billion in FY15.
The SRFs have always been impor-
tant to water and wastewater projects,
but as the amount of money in those
programs continues to decrease each
year, industry members must seek
new and creative ways to support the
needs of communities.
In 2014, The Water Resources and Re-
form Development Act (WRRDA)
prompted a flourish of optimism in the
industry. WRRDA established the Water
Infrastructure Finance and Innovation
Act to provide low-interest federal
loans and loan guarantees for water
infrastructure projects. The act also cre-
ated the Water Infrastructure Public-
Private Partnership Program for the
Army Corps of Engineers to lead to in-
creased financing of critical infrastruc-
ture projects through the use of P3s.
One year later, an American Society
of Civil Engineers (ASCE) analysis con-
cluded that much has been done since
WRRDA was signed, but much work
lays ahead. There is still a $60 billion
backlog of projects at the Army Corps
and skepticism remains that WRRDA’s
P3s can help reduce the backlog. ASCE
reported, “President Obama’s proposal
for new public infrastructure financing
still needs support in Congress. We
hope Congress will stick to its goal of
passing a WRRDA every two years. In
the meantime, they should appropriate
funds for the programs that were au-
thorized in the last WRRDA.”
W&WD’s survey indicated an aver-
age respondent age of 55, an ever-so-
slight decrease from last year’s aver-
age age of 56, indicating that the
workforce is getting younger as profes-
sionals retire and make way for young,
or younger, professionals. There will
be a notable generation gap between
exiting industry professionals and the
new slew of their younger
counterparts.
As the average respondent age de-
clined, this year’s survey also indicated
a boost from 2.9 percent in 2014 to 6.7
percent of respondents in the age
group of 35 to 39, as well as a slight
bump in the number of respondents
under the age of 30.
One of the biggest questions the
water industry must ask itself is, how
are they going to pass on precious in-
dustry knowledge to those much
younger and less experienced? This is
going to be a real and tangible issue
for the water industry to grapple with
as it loses more and more of its wise
workforce.
The water industry also must feel as
if it is competing for its chance to serve
the American people. A little cam-
paigning may be in order. In Novem-
ber, the House approved a bill to spend
up to $325 billion on transportation
projects. If there is money for roads,
there is money for water, and perhaps
water as an industry should do as the
loudest presidential candidates do in
order to make a splash: Scream, shout
and make some noise in the name of
water infrastructure.
Almost four in 10 municipal water and wastewater facilities are planning for new construc-
tion in the next 24 to 36 months.
More than three in 10 water and wastewater respondents are projecting a budget increase
this year.
15
WATER INFRASTRUCTURE
January 2016 | Construction Equipment/Annual Report & Forecast16
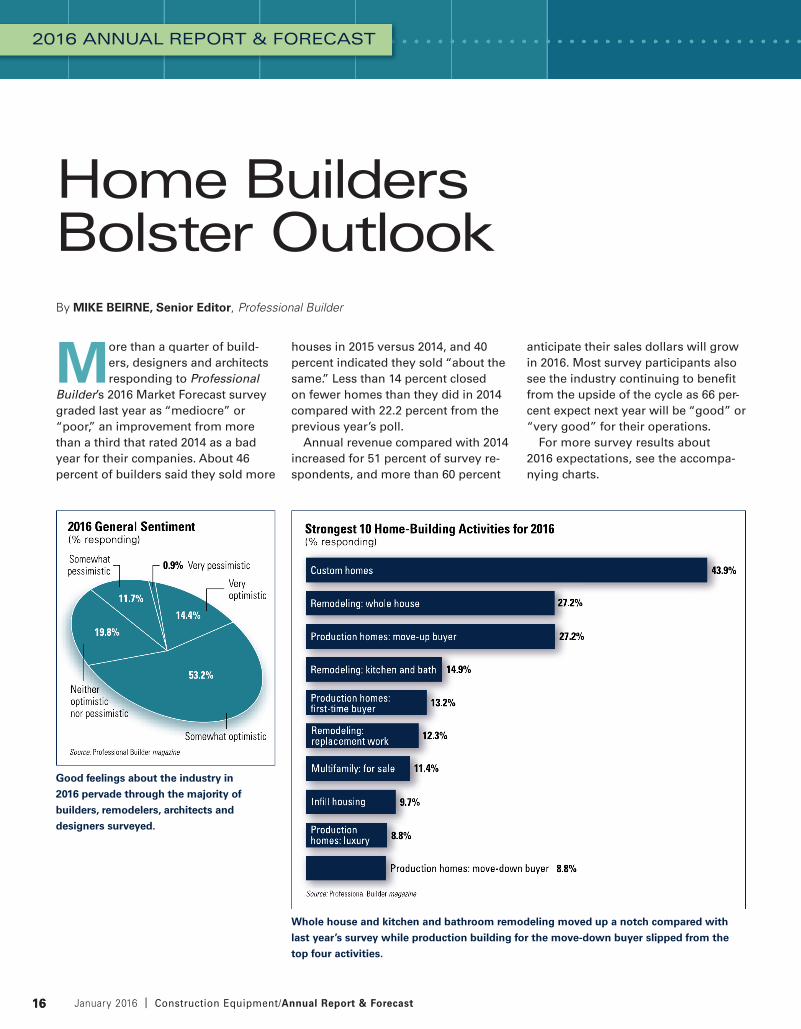
More than a quarter of build-
ers, designers and architects
responding to Professional Builder’s 2016 Market Forecast survey
graded last year as “mediocre” or
“poor,” an improvement from more
than a third that rated 2014 as a bad
year for their companies. About 46
percent of builders said they sold more
houses in 2015 versus 2014, and 40
percent indicated they sold “about the
same.” Less than 14 percent closed
on fewer homes than they did in 2014
compared with 22.2 percent from the
previous year’s poll.
Annual revenue compared with 2014
increased for 51 percent of survey re-
spondents, and more than 60 percent
anticipate their sales dollars will grow
in 2016. Most survey participants also
see the industry continuing to benefit
from the upside of the cycle as 66 per-
cent expect next year will be “good” or
“very good” for their operations.
For more survey results about
2016 expectations, see the accompa-
nying charts.
Good feelings about the industry in
2016 pervade through the majority of
builders, remodelers, architects and
designers surveyed.
Whole house and kitchen and bathroom remodeling moved up a notch compared with
last year’s survey while production building for the move-down buyer slipped from the
top four activities.
By MIKE BEIRNE, Senior Editor, Professional Builder
Home BuildersBolster Outlook
16
2016 ANNUAL REPORT & FORECAST

Construction Equipment/Annual Report & Forecast | January 2016 17
Smaller homes moved up from No. 9 in the 2015 survey. Most of the builders who
indicated smaller houses as their top opportunity also mentioned that infi ll will be their
strongest building activity for next year.
Recruiting qualifi ed labor is a top concern
for next year after being No. 2 in the poll
for 2015 expectation. An Ohio builder
wrote that he was anxious about house
prices outpacing income gains for
potential buyers.
17
Once again, most builders intend to buy
land, but fl ip-fl opped compared with last
year as most respondents said they do not
have plans for adding staff next year.
HOME BUILDERS

January 2016 | Construction Equipment/Annual Report & Forecast18
By all indications, 2015 was
another solid year for U.S. ar-
chitecture, engineering and con-
struction firms. Despite facing a litany
of market impediments—the still-
sluggish economy, construction labor
shortages, the slow-to-recover educa-
tion and healthcare markets—the ma-
jority of AEC firms saw revenues grow
in 2015, and an even greater number
expect earnings to rise in 2016, accord-
ing to a survey of AEC professionals by
Building Design+Construction.
Nearly six out of 10 survey respon-
dents (56.7 percent) indicated that rev-
enues had increased at their firms in
2015, and 59.9 percent expect income
from nonresidential building work to
rise this year. This represents a slight
uptick from 2014’s survey, when 54.4
percent reported higher revenue for
the year.
About half of the respondents (45.7
percent) rated their firm’s 2015 busi-
ness year as either “excellent” or “very
good,” and just 2.1 percent said it was
a “poor” year. Looking to 2016, 52.7
percent believe it will be “excellent” or
“very good” from a revenue stand-
point. Nearly three-quarters (71.4 per-
cent) rated the overall health of their
firm either “very good” or “good.”
Asked to rate their firm’s top busi-
ness development tactics for 2016, re-
spondents noted strategic hiring (56.7
percent rated it as a top tactic for
growth), marketing/public relations
(54.6 percent), and technology up-
grades (49.3).
Among the top concerns for AEC
firms are competition from other firms
(58.2 percent ranked it as a top-three
concern), general economic conditions
(50.4 percent), managing cash flow
(30.3 percent), and softness in fees/
bids (27.6 percent).
The adoption of building information
modeling (BIM) and virtual design and
construction (VDC) tools and processes
continues to grow. More than eight in
10 respondents (82.1 percent) said their
firm uses BIM/VDC tools on at least
some of its projects, up from 80 per-
cent in 2014 and 77.3 percent in 2013.
Healthcare sector reboundsRespondents were asked to rate their
firms’ prospects in specific construc-
tion sectors on a five-point scale from
Nearly three-quarters of respondents to the
survey rated the overall health of their fi rm
either “very good” or “good.”
About 60 percent of survey respondents are forecasting revenue growth for 2016, a slight
uptick from the previous year. Just 11 percent are expecting lower revenue.
By DAVID BARISTA, Editorial Director, Building Design+Construction
Optimistic 2016 FollowsSolid Growth in 2015
18
2016 ANNUAL REPORT & FORECAST

Construction Equipment/Annual Report & Forecast | January 2016 19
“excellent” to “very weak.” (Respon-
dents who checked “Not applicable/No
opinion/Don’t know” are not counted
here.) Among the findings:
The multifamily boom continues, as
the Millennials and Baby Boomers grav-
itate to rental housing and an urban life-
style. Multifamily ranked as the most
active sector, with 69.7 percent of re-
spondents rating it in the good/excellent
category, up from 62.3 percent last year
and 56.1 percent in 2013.
The healthcare market is starting to
stabilize and grow, as hospitals and
healthcare providers adjust to the post-
Affordable Care Act world. The sector
ranked as the second most active; 68.0
percent gave it a good/excellent rating,
up from 63.6 percent in 2014 and 62.5
percent the previous year.
Other active sectors include senior/
assisted living (63.1 percent rated it in
the good/excellent category), office in-
teriors/fitouts (62.4 percent), and data
centers/mission critical (59.3 percent),
higher education (48.6 percent), and
industrial/warehouse (46.7 percent).
Perhaps a sign of growing confi dence in the U.S. economy, “general economic conditions”
did not top the list of major concerns heading into the new year—a fi rst for this report.
Nearly three-quarters of respondents
expect bid prices to rise in 2016.
The vast majority of survey respondents
said they expect prices of materials to
increase in 2016.
Among the top tactics for growth are strategic hires, increased PR/marketing efforts,
investment in technology, and more staff training and education.
19
DESIGN AND CONSTRUCTION FIRMS

We’re proud to be named four times on Construction Equipment’s 2015 Top 100 New Products.
These solutions represent our 170+ year commitment to solving real customer challenges through
practical innovation. Hear why people choose CASE at CaseCE.com/RealStories.
SKID STEER LOADERS AND COMPACT TRACK LOADERSTR340, TV380, SR270, SV300, SR240 and SV280
3-IN-1 COMPRESSOR/ GENERATOR/WELDER
580N EP BACKHOE LOADER
D SERIES EXCAVATORSCX210D, CX250D, CX300D, CX350D and CX250D LR
ENHANCED HYDRAULICS EASIER MAINTENANCE TIER 4 FINAL MORE EFFICIENT POWER PRACTICAL DESIGN
INNOVATIONS THAT MATTER ALSO GET HONORED.
©2016 CNH Industrial America LLC. All rights reserved. CASE is a trademark registered in the United States and many other countries, owned by or licensed to CNH Industrial N.V., its subsidiaries or affi liates.
Circle 787