transportation development charges study here. - …€¦ · 2014 transportation development charge...
TRANSCRIPT

Prepared by:
AECOM 410 – 250 York Street, Citi Plaza 519 673 0510 tel London, ON, Canada N6A 6K2 519 673 5975 fax www.aecom.com Project Number:
60275642 Date:
May 2014
The Corporation of the City of London
2014 Transportation Development Charge Background Study Executive Summary
AECOM The Corporation of the City of London 2014 Transportation Development ChargeBackground Study
Executive Summary
AECOM: 2012-01-06 © 2009-2012 AECOM Canada Ltd. All Rights Reserved. 2014 Trans DC Executive Summary - 05-28-2014.Docx
Table of Contents Statement of Qualifications and Limitations
page
1. Introduction ..................................................................................................................................... 4
1.1 Project Requirements .......................................................................................................................... 5 1.2 Context................................................................................................................................................. 5 1.3 Service Level and Design Criteria ....................................................................................................... 6 1.4 Policy Considerations .......................................................................................................................... 7 1.5 Service Period and/or Area Confirmation ............................................................................................ 7 1.6 Works Basis ......................................................................................................................................... 7 1.7 Affordability .......................................................................................................................................... 8
2. Costing of Works ............................................................................................................................ 8
2.1 Major Roadworks ................................................................................................................................. 8 2.2 Two Lane Arterial Upgrades ................................................................................................................ 9 2.3 Minor Roadworks ................................................................................................................................. 9 2.4 Programs ............................................................................................................................................. 9
3. Rapid Transit System Costs and Alternatives ........................................................................... 10
4. Highway 401 Interchanges ........................................................................................................... 10
5. Development Charge Implications .............................................................................................. 10
5.1 Benefit to Existing (Growth/Non-Growth) Determination ................................................................... 10 5.2 Post Period Benefit Considerations ................................................................................................... 11 Major Roadworks ............................................................................................................................................ 11 Rapid Transit .................................................................................................................................................. 12 Two Lane Arterial Upgrades ........................................................................................................................... 12 Minor Roadworks ............................................................................................................................................ 12 5.3 Level of Service ................................................................................................................................. 12
6. Conclusions and Recommendations .......................................................................................... 13
6.1 Conclusions ....................................................................................................................................... 13 6.2 Recommendations ............................................................................................................................. 13
Appendices Appendix A – Local Servicing Policy Appendix B – Strategic Priorities & Policy Report Appendix C – Minor Roadworks Table List of Figures Figure ES-1 – Typical Roadway Sections Figure ES-2 – Major Transportation Roadworks List of Tables Table ES-1 – Major Roadway Construction Costs Table ES-2 – Future Major Transportation Roadworks Table ES-4 – Future Roadworks – Two Lane Arterial Upgrades
AECOM The Corporation of the City of London 2014 Transportation Development ChargeBackground Study
Executive Summary
AECOM: 2012-01-06 © 2009-2012 AECOM Canada Ltd. All Rights Reserved. 2014 Trans DC Executive Summary - 05-28-2014.Docx
Statement of Qualifications and Limitations The attached Report (the “Report”) has been prepared by AECOM Canada Ltd. (“Consultant”) for the benefit of the client (City of London“) in accordance with the agreement between Consultant and Client, including the scope of work detailed therein (the “Agreement”). The information, data, recommendations and conclusions contained in the Report (collectively, the “Information”):
is subject to the scope, schedule, and other constraints and limitations in the Agreement and the qualifications contained in the Report (the “Limitations”);
represents Consultant’s professional judgement in light of the Limitations and industry standards for the preparation of similar reports;
may be based on information provided to Consultant which has not been independently verified; has not been updated since the date of issuance of the Report and its accuracy is limited to the time period and
circumstances in which it was collected, processed, made or issued; must be read as a whole and sections thereof should not be read out of such context; was prepared for the specific purposes described in the Report and the Agreement; and in the case of subsurface, environmental or geotechnical conditions, may be based on limited testing and on the
assumption that such conditions are uniform and not variable either geographically or over time. Consultant shall be entitled to rely upon the accuracy and completeness of information that was provided to it and has no obligation to update such information. Consultant accepts no responsibility for any events or circumstances that may have occurred since the date on which the Report was prepared and, in the case of subsurface, environmental or geotechnical conditions, is not responsible for any variability in such conditions, geographically or over time. Consultant agrees that the Report represents its professional judgement as described above and that the Information has been prepared for the specific purpose and use described in the Report and the Agreement, but Consultant makes no other representations, or any guarantees or warranties whatsoever, whether express or implied, with respect to the Report, the Information or any part thereof. Without in any way limiting the generality of the foregoing, any estimates or opinions regarding probable construction costs or construction schedule provided by Consultant represent Consultant’s professional judgement in light of its experience and the knowledge and information available to it at the time of preparation. Since Consultant has no control over market or economic conditions, prices for construction labour, equipment or materials or bidding procedures, Consultant, its directors, officers and employees are not able to, nor do they, make any representations, warranties or guarantees whatsoever, whether express or implied, with respect to such estimates or opinions, or their variance from actual construction costs or schedules, and accept no responsibility for any loss or damage arising therefrom or in any way related thereto. Persons relying on such estimates or opinions do so at their own risk. Except (1) as agreed to in writing by Consultant and Client; (2) as required by-law; or (3) to the extent used by governmental reviewing agencies for the purpose of obtaining permits or approvals, the Report and the Information may be used and relied upon only by Client. Consultant accepts no responsibility, and denies any liability whatsoever, to parties other than Client who may obtain access to the Report or the Information for any injury, loss or damage suffered by such parties arising from their use of, reliance upon, or decisions or actions based on the Report or any of the Information (“improper use of the Report”), except to the extent those parties have obtained the prior written consent of Consultant to use and rely upon the Report and the Information. Any injury, loss or damages arising from improper use of the Report shall be borne by the party making such use. This Statement of Qualifications and Limitations is attached to and forms part of the Report and any use of the Report is subject to the terms hereof.

AECOM The Corporation of the City of London 2014 Transportation Development Charge Background Study
Executive Summary
2014 Trans DC Executive Summary - 05-28-2014.Docx 4
1. Introduction
AECOM was retained by the City of London (City) to undertake an update to the Transportation Development Charge Background Study (DC). The primary goal of the study was to identify, prioritize and calculate the cost of transportation works required over a 20 year planning horizon, including an assessment of works that are attributable to Growth. The outputs of this Background Study will be used by the City to calculate the portion of development charge rates attributable to transportation works for urban land development in the City of London.
For the purposes of this study, transportation related undertakings are classified into three broad categories namely Major Roadworks, Minor Roadworks and Programs. Major Roadworks generally include widening or extension of arterial roadworks and freeways, Minor Roadworks generally refer to and include smaller capital works associated with one or more specific developments and Programs are represented by example studies and undertakings that are justified by spending of capital at various locations across the whole city.
Planning for Major Roadworks is undertaken through a master planning process, with the City’s most recent Transportation Master Plan (London 2030 TMP) being completed in 2013. An objective of the update was to identify the Major Roadworks needed to meet 20 year growth requirements. The outputs of this work, completed in February, 2014, include:
the identification of required Major Roadworks;
their prioritization over a 20 year growth period;
related costs for construction of the recommended improvements; and
implementation of programs, studies and new initiatives.
In contrast to Major Roadworks, Minor Roadworks have traditionally been defined as:
traffic signalization;
minor intersection improvements and channelization;
sidewalk and/or street lighting elements; and
the oversizing of Local and Secondary Collector roads to Primary Collector and Arterial Road status.
These works are driven by existing and future development within the City’s Urban Growth Boundary (UGB) as defined by the City’s Growth Management Implementation Strategy (GMIS). GMIS is a Council directed initiative to complement the Official Plan and assist with co-ordination and staging of infrastructure works and development approvals in the City. The preliminary outputs of the 2014 GMIS (March 2014) were incorporated into this Background Study.
Related Benefit to Existing (BTE) (Growth/Non-Growth) allocations for both the Major and Minor Roadworks components have been identified, along with Growth allocations to Residential (RES), Institutional, Commercial and Industrial (ICI). In addition, policy decisions have been made by the City in consultation with stakeholders from the development industry and members of the public to define “Local Services”. (See Appendix A Local Servicing Policy). Engaging and consulting the public and key stakeholders has been a critical part of the DC Background Study work. During the course of the study, several meetings were held and the minutes from those meetings can be found in Volume 2: DC Technical Meeting Proceedings.

AECOM The Corporation of the City of London 2014 Transportation Development Charge Background Study
Executive Summary
2014 Trans DC Executive Summary - 05-28-2014.Docx 5
Once the scope, cost, Growth share and funding source were determined, the City would use the outputs of this Background Study to calculate the cost recovery Development Charge attributable to Transportation Works and update the DC By-Law.
1.1 Project Requirements
Our assignment for this study was to provide engineering services for completion of the following tasks.
The identification of currently planned Major and Minor Roadworks in the City for the next 20 years, or for a defined service area as per the City’s GMIS based on existing community plan, draft plan, plan of subdivision, site plan, Environmental Assessment report or other available information, all as provided by the City.
The identification of representative channelization and traffic signal needs for right, left or center turn lane application for development specific or development area planning purposes.
The incorporation of development charge eligible studies and programs.
To determine typical Minor Roadworks needs and related servicing costs, and Major Roadworks construction, utility, engineering, contingency and land related costs, based on existing and/or future planning information.
Integrate outputs from the London 2030 TMP and the modeling outputs of our work applicable to Major Roadworks requirements and application.
To update cost information for all Major and Minor Roadworks identified to 2014 dollars, using appropriate unit costs and cost indexes.
To remove redundancies between Major and Minor Roadworks components.
Determination of BTE (Growth/Non-Growth) related components and residential, institution, commercial and industrial allocations.
The identification of those components to be included in the CSRF DC Rate, the UWRF DC Rate or those considered to be a development responsibility, in accordance with new cost sharing rules as provided by the City.
On-going co-ordination with the City’s EESD, Planning and Finance personnel.
Address peer review comments from the previous DC background work; incorporate outputs from more recently completed works and/or community plans; ensure consistency with the City’s Water, Stormwater Drainage/SWM and Sanitary DC Updates (2009), and support/assist in development of the City’s GMIS.
1.2 Context
The London 2030 TMP project provided the City of London with a vision and implementation plan to proactively respond to the way the City’s future population move, live, work, and play. This TMP was all encompassing and has embraced current provincial initiatives, sound engineering, financial prudence, and emergent planning principles that are shaping municipal growth across Ontario. Embracing the TMP enabled the City to adjust to major societal shifts that have been long predicted by major economists, demographers, scholars, and politicians. This shift included a movement away from an automobile focused society with an economy based on industrial production, to a different knowledge and service based economy that integrates all City functions into smaller activity nodes. This is a phenomenon that is fast becoming a reality for all North American population centres. The cost of following the previous century’s growth model is increasingly becoming unsustainable. This obsolete model based on outward peripheral expansion is swiftly being replaced by nodal redevelopment within the existing developed areas of cities. Continuing to facilitate the previous patterns of outward growth will become ever
AECOM The Corporation of the City of London 2014 Transportation Development Charge Background Study
Executive Summary
2014 Trans DC Executive Summary - 05-28-2014.Docx 6
increasingly difficult, expensive, and environmentally challenging, while also using valuable time and effort that could be marshalled and focused on facilitating oncoming changes. The City can best transition itself into a successful urban centre that attracts new and vibrant growth through acceptance and preparation for the consequences of these oncoming changes. The construction of rapid transit (RT) will minimize future capital outlay until a time that it is absolutely necessary or financially advantageous to invest, target future senior government programs, allow for local private developments to proceed with their projects confidently, reform London Transit Commission bus routing to compliment the rapid transit, and launch transportation demand management programs and advertising campaigns to target the population with the news about the success of the project. This will build ridership with service and ensure targets are met in a financially wise manner. As the City transitions from the previous century’s growth model to the new nodal redevelopment model, growth in green field locations is expected to continue with the completion of subdivisions and site plans in lands in the north of the city, along the Sunningdale Road corridor and the opening up of the southwest as per the Southwest Area Plan (secondary plan). Additionally, growth in general requires the strengthening of existing and the placement of new arterial and collector roads, with interchange improvements on Highway 401/ Veteran Memorial Parkway and other strategic links.
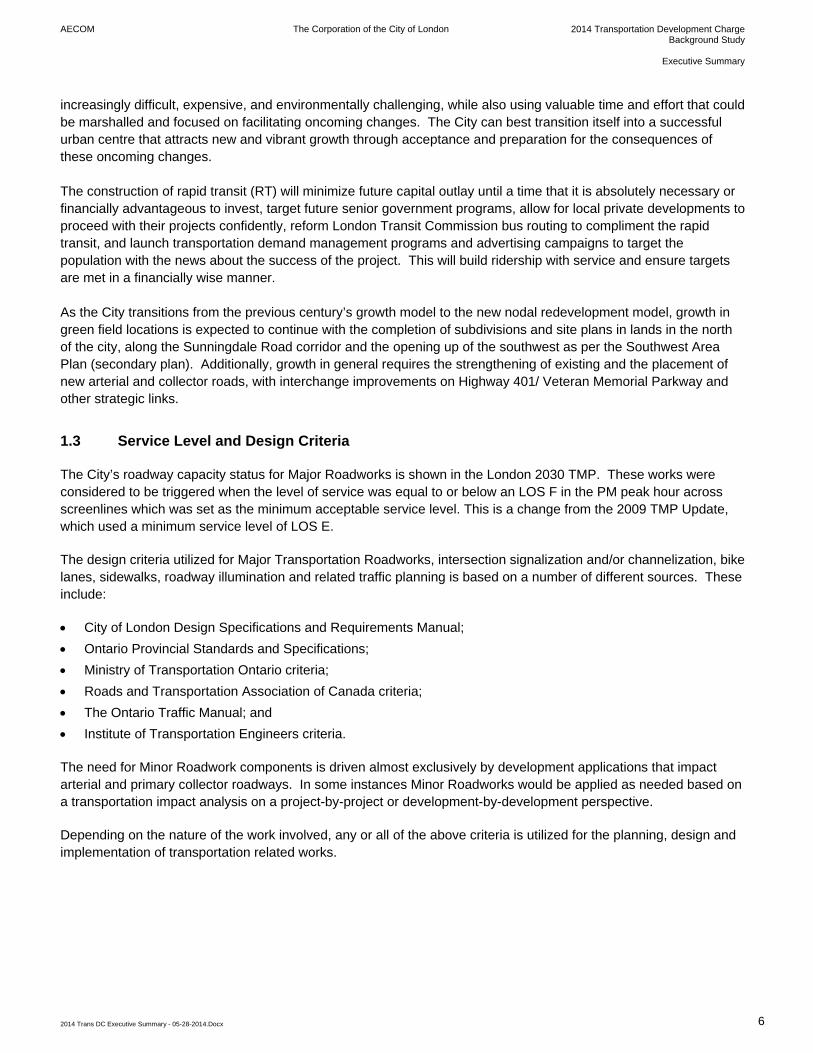
1.3 Service Level and Design Criteria
The City’s roadway capacity status for Major Roadworks is shown in the London 2030 TMP. These works were considered to be triggered when the level of service was equal to or below an LOS F in the PM peak hour across screenlines which was set as the minimum acceptable service level. This is a change from the 2009 TMP Update, which used a minimum service level of LOS E.
The design criteria utilized for Major Transportation Roadworks, intersection signalization and/or channelization, bike lanes, sidewalks, roadway illumination and related traffic planning is based on a number of different sources. These include:
City of London Design Specifications and Requirements Manual;
Ontario Provincial Standards and Specifications;
Ministry of Transportation Ontario criteria;
Roads and Transportation Association of Canada criteria;
The Ontario Traffic Manual; and
Institute of Transportation Engineers criteria.
The need for Minor Roadwork components is driven almost exclusively by development applications that impact arterial and primary collector roadways. In some instances Minor Roadworks would be applied as needed based on a transportation impact analysis on a project-by-project or development-by-development perspective.
Depending on the nature of the work involved, any or all of the above criteria is utilized for the planning, design and implementation of transportation related works.
AECOM The Corporation of the City of London 2014 Transportation Development Charge Background Study
Executive Summary
2014 Trans DC Executive Summary - 05-28-2014.Docx 7
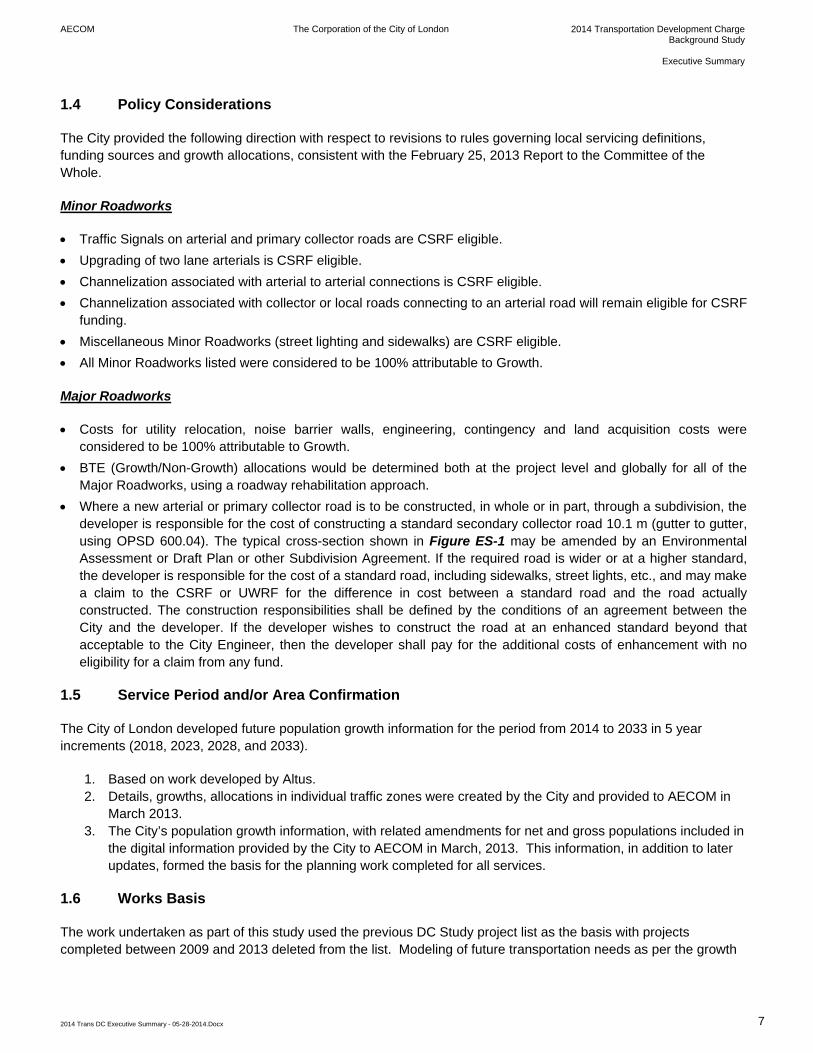
1.4 Policy Considerations
The City provided the following direction with respect to revisions to rules governing local servicing definitions, funding sources and growth allocations, consistent with the February 25, 2013 Report to the Committee of the Whole.
Minor Roadworks
Traffic Signals on arterial and primary collector roads are CSRF eligible.
Upgrading of two lane arterials is CSRF eligible.
Channelization associated with arterial to arterial connections is CSRF eligible.
Channelization associated with collector or local roads connecting to an arterial road will remain eligible for CSRF funding.
Miscellaneous Minor Roadworks (street lighting and sidewalks) are CSRF eligible.
All Minor Roadworks listed were considered to be 100% attributable to Growth.
Major Roadworks
Costs for utility relocation, noise barrier walls, engineering, contingency and land acquisition costs were considered to be 100% attributable to Growth.
BTE (Growth/Non-Growth) allocations would be determined both at the project level and globally for all of the Major Roadworks, using a roadway rehabilitation approach.
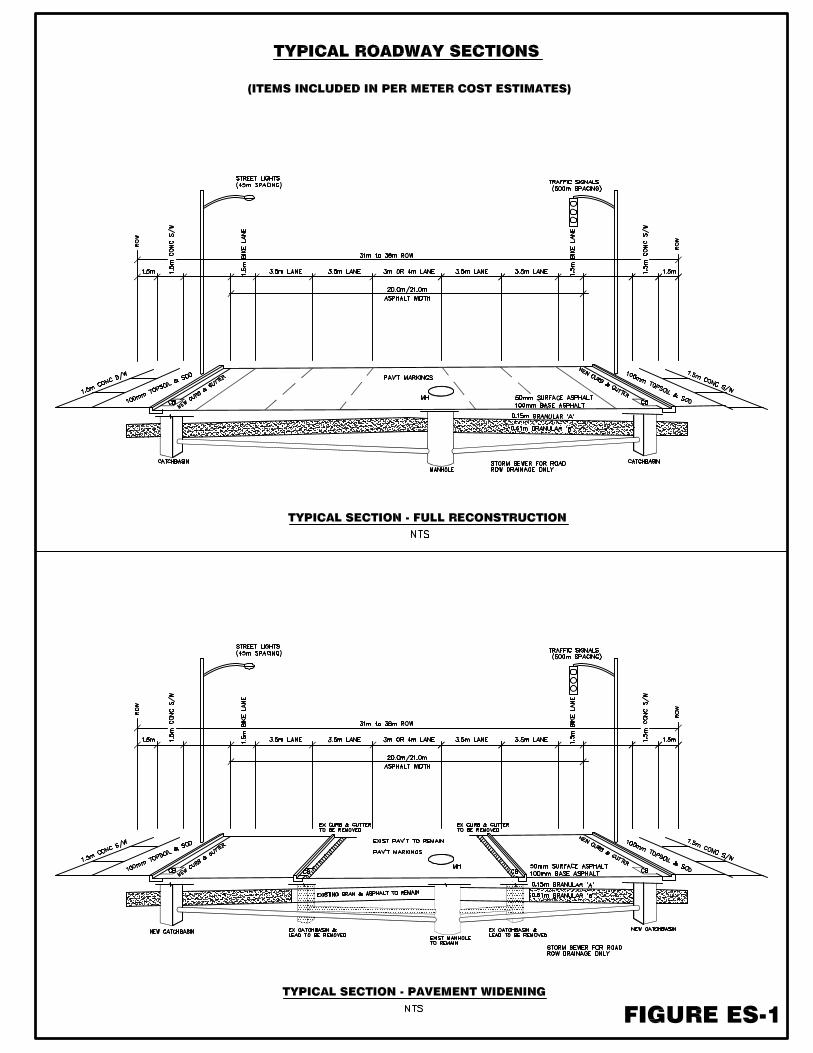
Where a new arterial or primary collector road is to be constructed, in whole or in part, through a subdivision, the developer is responsible for the cost of constructing a standard secondary collector road 10.1 m (gutter to gutter, using OPSD 600.04). The typical cross-section shown in Figure ES-1 may be amended by an Environmental Assessment or Draft Plan or other Subdivision Agreement. If the required road is wider or at a higher standard, the developer is responsible for the cost of a standard road, including sidewalks, street lights, etc., and may make a claim to the CSRF or UWRF for the difference in cost between a standard road and the road actually constructed. The construction responsibilities shall be defined by the conditions of an agreement between the City and the developer. If the developer wishes to construct the road at an enhanced standard beyond that acceptable to the City Engineer, then the developer shall pay for the additional costs of enhancement with no eligibility for a claim from any fund.
1.5 Service Period and/or Area Confirmation
The City of London developed future population growth information for the period from 2014 to 2033 in 5 year increments (2018, 2023, 2028, and 2033).
1. Based on work developed by Altus. 2. Details, growths, allocations in individual traffic zones were created by the City and provided to AECOM in
March 2013. 3. The City’s population growth information, with related amendments for net and gross populations included in
the digital information provided by the City to AECOM in March, 2013. This information, in addition to later updates, formed the basis for the planning work completed for all services.
1.6 Works Basis
The work undertaken as part of this study used the previous DC Study project list as the basis with projects completed between 2009 and 2013 deleted from the list. Modeling of future transportation needs as per the growth
AECOM The Corporation of the City of London 2014 Transportation Development Charge Background Study
Executive Summary
2014 Trans DC Executive Summary - 05-28-2014.Docx 8
information provided by the City, having regard for Altus growth forecast study to confirm 2014 to 2033 needs consistent with the London 2030 TMP.
The basis for the work to be completed for this study was for the City of London to provide through previous: UWRF claims; community plans; subdivision plans; draft plans; studies; or other information sources; details to identify those Minor Roadworks components (traffic signalization, channelization, sidewalks, street lighting), and the two lane arterial upgrades required, or proposed to be completed to service 20 year growth requirements as per the GMIS. Any available cost and/or location information was to be included if directly relevant and in sufficient detail to support overall work cost and DC Rate determination. In addition, the London 2030 TMP outputs were to be used to identify those Major Roadworks required to meet 20 year growth requirements, with completed works removed.
1.7 Affordability
The project list created for improvement of deficiencies in the network was examined further to optimize the list for affordability. A number of proposed roadworks projects in the 10-15 and 15-20 year increment were identified as the most acceptable projects to be deferred beyond the 20 year period. This deferral resulted in a reduction of $115 Million from the project list and was summarized in Strategic Priorities and Policy Committee Meeting on February 20, 2014, shown in Appendix B.
2. Costing of Works
2.1 Major Roadworks
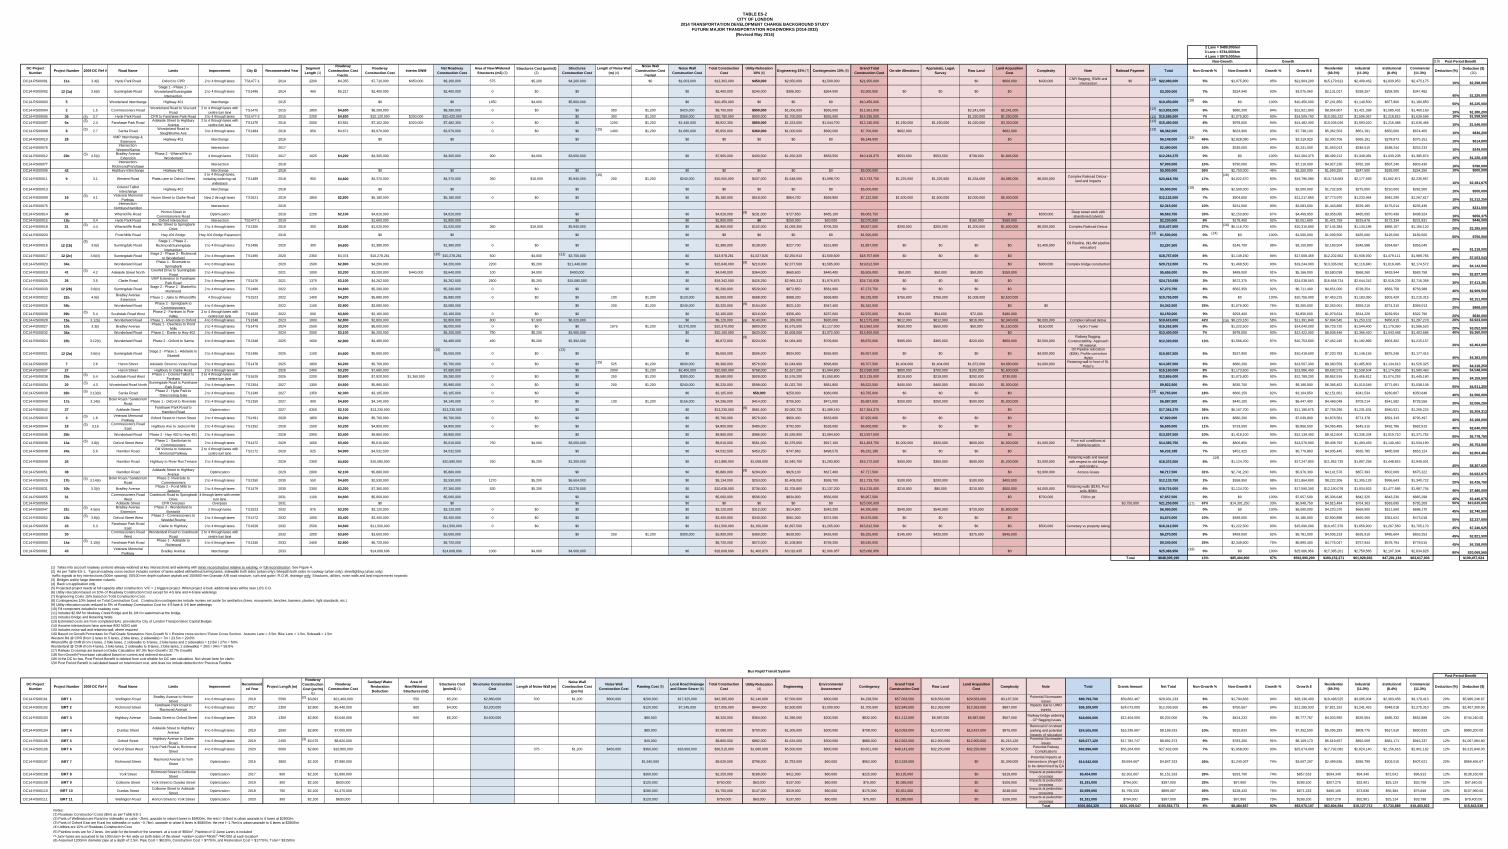
Future Major Transportation Roadworks to service growth for a 20 year period to 2033 are identified in Table ES-2 and shown on Figure ES-2. The City’s GMIS will be co-ordinated with the new DC project schedules.
Each Major Roadwork project was considered to consist of some or all of the following components.
Base cost per metre for the roadway construction cost based on the improvement.
Cost per square metre for structures to be widened or replaced unless more detailed information from environmental assessment materials and/or preliminary design data was available.
Cost per metre of noise barrier wall required.
Cost for land acquisition per metre (raw land cost, on-site alterations, appraisals, surveying, and legal).
Any complicated costs associated with railway diversions, bridges, Environmentally Sensitive Areas, large known utilities (high tension hydro towers), etc.
Each Major Roadworks project was assigned a utility relocation cost equal to 10% of the Net Roadway Construction Cost, and engineering and contingency costs equal to 15% and 10% of the Total Construction Cost, respectively.
Proposed unit costs for roadway construction, structures, and noise barrier walls are provided in 2014 dollars and were developed based either on pricing obtained on previous projects or recent cost estimates, with adjustments for annual construction cost escalation. The unit costs are provided in Table ES-1. A preliminary analysis of each project was undertaken by AECOM with preparation of base plan, draft alternative alignments and identification of complicated issues for drainage, traffic control, property acquisitions and major utilities.
The costs identified take into account any portions of each roadway section already widened at intersections. The total cost of Major Transportation Roadworks is $648.4 Million with Post Period Benefit of $199.5 Million and a 20 Year Cost amount of $448.9 Million, a net DC recoverable amount of $363.5 Million and a net Non-Growth cost of $85.4 Million.
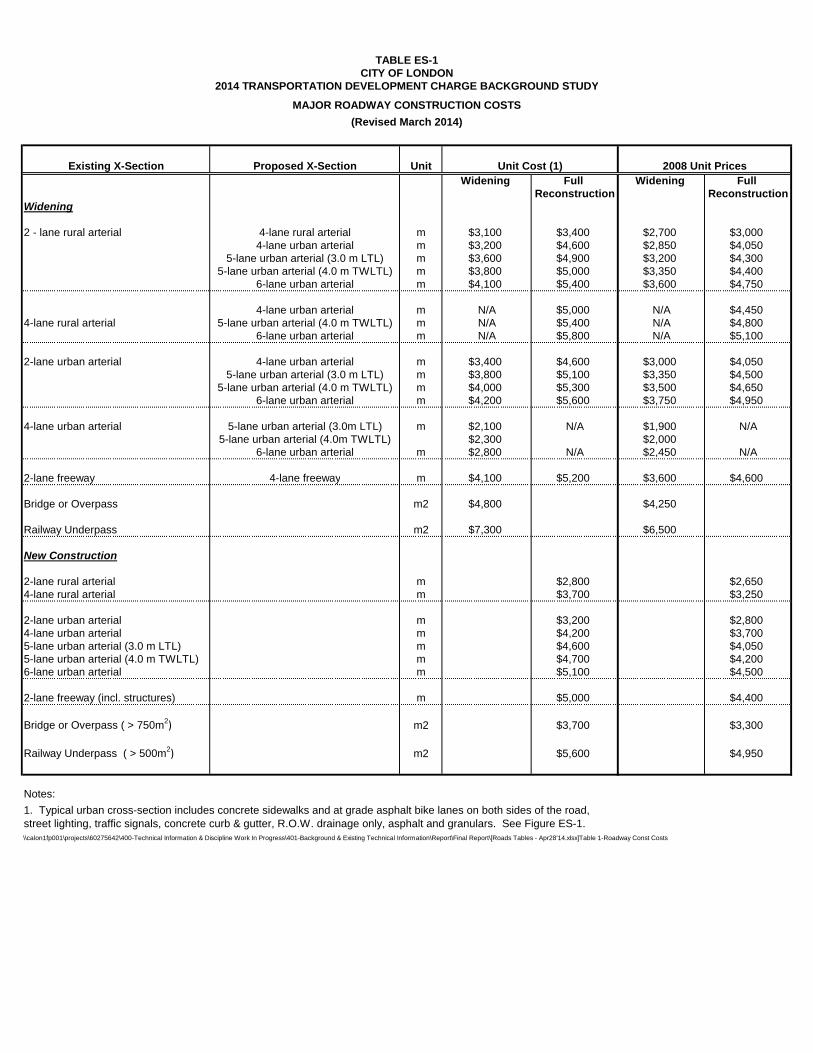
Existing X-Section Proposed X-Section UnitWidening Full Widening Full
Reconstruction ReconstructionWidening
2 - lane rural arterial 4-lane rural arterial m $3,100 $3,400 $2,700 $3,0004-lane urban arterial m $3,200 $4,600 $2,850 $4,050
5-lane urban arterial (3.0 m LTL) m $3,600 $4,900 $3,200 $4,3005-lane urban arterial (4.0 m TWLTL) m $3,800 $5,000 $3,350 $4,400
6-lane urban arterial m $4,100 $5,400 $3,600 $4,750
4-lane urban arterial m N/A $5,000 N/A $4,4504-lane rural arterial 5-lane urban arterial (4.0 m TWLTL) m N/A $5,400 N/A $4,800
6-lane urban arterial m N/A $5,800 N/A $5,100
2-lane urban arterial 4-lane urban arterial m $3,400 $4,600 $3,000 $4,0505-lane urban arterial (3.0 m LTL) m $3,800 $5,100 $3,350 $4,500
5-lane urban arterial (4.0 m TWLTL) m $4,000 $5,300 $3,500 $4,6506-lane urban arterial m $4,200 $5,600 $3,750 $4,950
4-lane urban arterial 5-lane urban arterial (3.0m LTL) m $2,100 N/A $1,900 N/A5-lane urban arterial (4.0m TWLTL) $2,300 $2,000
6-lane urban arterial m $2,800 N/A $2,450 N/A
2-lane freeway 4-lane freeway m $4,100 $5,200 $3,600 $4,600
Bridge or Overpass m2 $4,800 $4,250
Railway Underpass m2 $7,300 $6,500
New Construction
2-lane rural arterial m $2,800 $2,6504-lane rural arterial m $3,700 $3,250
2-lane urban arterial m $3,200 $2,8004-lane urban arterial m $4,200 $3,7005-lane urban arterial (3.0 m LTL) m $4,600 $4,0505-lane urban arterial (4.0 m TWLTL) m $4,700 $4,2006-lane urban arterial m $5,100 $4,500
2-lane freeway (incl. structures) m $5,000 $4,400
Bridge or Overpass ( > 750m2) m2 $3,700 $3,300
Railway Underpass ( > 500m2) m2 $5,600 $4,950
Notes:
\\calon1fp001\projects\60275642\400-Technical Information & Discipline Work In Progress\401-Background & Existing Technical Information\Report\Final Report\[Roads Tables - Apr28'14.xlsx]Table 1-Roadway Const Costs
1. Typical urban cross-section includes concrete sidewalks and at grade asphalt bike lanes on both sides of the road, street lighting, traffic signals, concrete curb & gutter, R.O.W. drainage only, asphalt and granulars. See Figure ES-1.
TABLE ES-1CITY OF LONDON
2014 TRANSPORTATION DEVELOPMENT CHARGE BACKGROUND STUDY
MAJOR ROADWAY CONSTRUCTION COSTS
(Revised March 2014)
Unit Cost (1) 2008 Unit Prices
DC Project Number
Project Number 2009 DC Ref # Road Name Limits Improvement City ID Recommended YearSegment Length (1)
Roadway Construction Cost
(per/m)
Roadway Construction Cost
Interim SWMNet Roadway
Construction CostArea of New/Widened
Structures (m2) (3)Structures Cost (per/m2)
(2)Structures
Construction Cost Length of Noise Wall
(m) (4)
Noise Wall Construction Cost
(per/m)
Noise Wall Construction Cost
Total Construction Cost
Utility Relocation 10% (6)
Engineering 15% (7) Contingencies 10% (8)Grand Total
Construction CostOn-site Alterations
Appraisals, Legal, Survey
Raw LandLand Acquisition
CostComplexity Note Railroad Payment Total Non-Growth % Non-Growth $ Growth % Growth $
Residential (69.3%)
Industrial (11.0%)
Institutional (8.4%)
Commercial (11.3%)
Deduction (%)Deduction ($)
(20)
DC14-RS00001 11a 3.4(i) Hyde Park Road Oxford to CPR 2 to 4 through lanes TS1477-1 2014 2200 $4,355 $7,710,000 $450,000 $8,160,000 575 $5,200 $4,200,000 $0 $1,003,000 $13,363,000 $450,000 $2,650,000 $1,500,000 $21,950,000 $0 $600,000 $430,000CNR flagging, SWM and
intersection$0 $22,980,000 5% $1,075,800 95% $21,904,200 $15,179,611 $2,409,462 $1,839,953 $2,475,175 10% $2,298,000
DC14-RS00002 12 (1a) 3.6(ii) Sunningdale RoadStage 1 - Phase 1 -
Wonderland/Sunningdale Intersection
2 to 4 through lanes TS1496 2014 460 $5,217 $2,400,000 $2,400,000 0 $0 $0 $0 $2,400,000 $240,000 $396,000 $264,000 $3,300,000 $0 $0 $0 $0 $3,300,000 7% $224,940 93% $3,075,060 $2,131,017 $338,257 $258,305 $347,48240% $1,320,000
DC14-RS00003 5 Wonderland Interchange Highway 401 Interchange 2015 $0 $0 1450 $4,000 $5,800,000 $0 $10,450,000 $0 $0 $0 $10,450,000 $10,450,000 0% $0 100% $10,450,000 $7,241,850 $1,149,500 $877,800 $1,180,850 50% $5,225,000
DC14-RS00004 2 1.5 Commissioners RoadWonderland Road to Viscount
Road2 to 4 through lanes with
centre turn laneTS1470 2015 1800 $4,600 $8,280,000 $8,280,000 0 $0 $0 350 $1,200 $420,000 $8,700,000 $900,000 $1,006,000 $955,000 $11,561,000 $2,241,000 $2,241,000 $13,802,000 6% $880,200 94% $12,921,800 $8,954,807 $1,421,398 $1,085,431 $1,460,163 10% $1,380,200
DC14-RS00005 39 3.7 Hyde Park Road CPR to Fanshawe Park Road 2 to 4 through lanes TS1477-2 2015 2200 $4,600 $10,120,000 $300,000 $10,420,000 $0 300 $1,200 $360,000 $10,780,000 $900,000 $1,700,000 $955,500 $14,335,500 $1,250,000 $1,250,000 $15,585,500 7% $1,075,800 93% $14,509,700 $10,055,222 $1,596,067 $1,218,815 $1,639,596 10% $1,558,550
DC14-RS00007 6a 2.4 Fanshawe Park RoadAdelaide Street to Highbury
Avenue2 to 4 through lanes with
centre turn laneTS1475 2016 2000 $3,581 $7,162,300 $320,000 $7,482,300 0 $0 $0 1200 $1,200 $1,440,000 $8,922,300 $850,000 $1,323,000 $1,044,700 $12,140,000 $1,150,000 $1,150,000 $1,020,000 $3,320,000 $15,460,000 6% $978,000 94% $14,482,000 $10,036,026 $1,593,020 $1,216,488 $1,636,466 10% $1,546,000
DC14-RS00008 8 2.7 Sarnia RoadWonderland Road to
Sleightholme Ave3 to 4 through lanes TS1484 2016 850 $4,671 $3,970,000 $3,970,000 0 $0 $0 1400 $1,200 $1,680,000 $5,650,000 $360,000 $1,000,000 $690,000 $7,700,000 $662,000 $662,000 $8,362,000 7% $623,900 93% $7,738,100 $5,362,503 $851,191 $650,000 $874,405 10% $836,200
DC14-RS00010 28VMP Interchange &
ExtensionHighway 401 Interchange 2016 $0 $0 $0 $0 $0 $0 $0 $0 $6,148,000 $0 $6,148,000 46% $2,828,080 54% $3,319,920 $2,300,705 $365,191 $278,873 $375,151 10% $614,800
DC14-RS00076Intersection-
Western/SarinaIntersection 2017 $2,490,000 10% $249,000 90% $2,241,000 $1,553,013 $246,510 $188,244 $253,233 10% $249,000
DC14-RS00012 22b 4.5(ii)Bradley Avenue
ExtensionPhase 2 - Wharncliffe to
Wonderland4 through lanes TS1523 2017 1025 $4,200 $4,305,000 $4,305,000 900 $4,000 $3,600,000 $0 $7,905,000 $430,500 $1,250,325 $833,550 $10,419,375 $553,500 $553,500 $738,000 $1,845,000 $12,264,375 0% $0 100% $12,264,375 $8,499,212 $1,349,081 $1,030,208 $1,385,874 10% $1,226,438
DC14-RS00077Intersection-
Richmond/FanshaweIntersection 2018 $7,900,000 10% $790,000 90% $7,110,000 $4,927,230 $782,100 $597,240 $803,430 10% $790,000
DC14-RS00006 42 Highbury Interchange Highway 401 Interchange 2018 $0 $0 $0 $0 $0 $0 $0 $0 $5,000,000 $5,000,000 55% $2,750,000 45% $2,250,000 $1,559,250 $247,500 $189,000 $254,250 10% $500,000
DC14-RS00011 9 3.1 Western Road Platts Lane to Oxford Street2 to 4 through lanes, including widening rail
underpassTS1489 2018 950 $4,600 $4,370,000 $4,370,000 360 $16,500 $5,940,000 200 $1,200 $240,000 $10,550,000 $437,000 $1,648,050 $1,098,700 $13,733,750 $1,225,500 $1,225,500 $1,634,000 $4,085,000 $6,000,000
Complex Railroad Detour - land and impacts
$23,818,750 17% $4,022,670 83% $19,796,080 $13,718,683 $2,177,569 $1,662,871 $2,236,95710% $2,381,875
DC14-RS00013Colonel Talbot
InterchangeHighway 401 Interchange 2018 $0 $0 $0 $0 $0 $0 $0 $0 $5,000,000 $5,000,000 50% $2,500,000 50% $2,500,000 $1,732,500 $275,000 $210,000 $282,500 10% $500,000
DC14-RS00009 19 4.1Veterans Memorial
ParkwayHuron Street to Clarke Road New 2 through lanes TS1621 2019 1850 $2,800 $5,180,000 $5,180,000 0 $0 $0 $0 $5,180,000 $518,000 $854,700 $569,800 $7,122,500 $1,500,000 $1,500,000 $2,000,000 $5,000,000 $12,122,500 7% $904,650 93% $11,217,850 $7,773,970 $1,233,964 $942,299 $1,267,617 10% $1,212,250
DC14-RS00075Intersection-
Highbury/HamiltonIntersection 2019 $2,315,000 10% $231,500 90% $2,083,500 $1,443,866 $229,185 $175,014 $235,436 10% $231,500
DC14-RS00014 36 Wharncliffe RoadHorton Street to
Commissioners RoadOptimization 2019 2200 $2,100 $4,620,000 $4,620,000 $0 $0 $4,620,000 $231,000 $727,650 $485,100 $6,063,750 $0 $500,000
Deep sewer work with abandoned culverts
$6,563,750 33% $2,153,800 67% $4,409,950 $3,056,095 $485,095 $370,436 $498,324 10% $656,375DC14-RS00015 11b 3.4 Hyde Park Road Oxford Intersection Intersection TS1477-1 2019 $1,600,000 $1,800,000 $0 $0 $1,800,000 $0 $250,000 $20,000 $2,070,000 $160,000 $160,000 $2,230,000 8% $178,400 92% $2,051,600 $1,421,759 $225,676 $172,334 $231,831 20% $446,000
DC14-RS00018 21 4.4 Wharncliffe RoadBecher Street to Springbank
Drive2 to 4 through lanes TS1355 2019 300 $3,400 $1,020,000 $1,020,000 360 $16,500 $5,940,000 $0 $6,960,000 $102,000 $1,059,300 $706,200 $8,827,500 $200,000 $200,000 $1,200,000 $1,600,000 $6,000,000 Complex Railroad Detour $16,427,500 37% $6,116,700 63% $10,310,800 $7,145,384 $1,134,188 $866,107 $1,165,120 20% $3,285,500
DC14-RS00020 Pond Mills Road Hwy 401 Bridge Hwy 401 Bridge Expansion 2019 $0 $0 $0 $0 $0 $0 $0 $0 $1,500,000 $1,500,000 0% $0 100% $1,500,000 $1,039,500 $165,000 $126,000 $169,500 50% $750,000
DC14-RS00016 12 (1b) 3.6(i) Sunningdale RoadStage 1 - Phase 2 -
Richmond/Sunningdale Intersection
2 to 4 through lanes TS1496 2020 300 $4,600 $1,380,000 $1,380,000 0 $0 $0 $0 $1,380,000 $138,000 $227,700 $151,800 $1,897,500 $0 $0 $0 $0 $1,400,000Oil Pipeline. ($1.4M pipeline
relocation)$3,297,500 4% $146,700 96% $3,150,800 $2,183,504 $346,588 $264,667 $356,040
40% $1,319,000
DC14-RS00017 12 (2c) 3.6(iii) Sunningdale RoadStage 2 - Phase 3 - Richmond
to Wonderland2 to 4 through lanes TS1496 2020 2350 $4,374 $10,278,261 $10,278,261 500 $4,000 $3,700,000 $0 $13,978,261 $1,027,826 $2,250,913 $1,500,609 $18,757,609 $0 $0 $0 $0 $18,757,609 6% $1,149,150 94% $17,608,459 $12,202,662 $1,936,930 $1,479,111 $1,989,756 40% $7,503,043
DC14-RS00023 34a Wonderland RoadPhase 1 - Riverside to
Springbank4 to 6 through lanes 2020 1500 $2,800 $4,200,000 $4,200,000 2200 $5,200 $11,440,000 $0 $15,640,000 $210,000 $2,377,500 $1,585,000 $19,812,500 $0 $900,000 Complex bridge construction $20,712,500 7% $1,468,500 93% $19,244,000 $13,336,092 $2,116,840 $1,616,496 $2,174,572 20% $4,142,500
DC14-RS00019 41 4.2 Adelaide Street NorthGrenfell Drive to Sunningdale
Road2 to 4 through lanes 2021 1000 $3,200 $3,200,000 $440,000 $3,640,000 100 $4,000 $400,000 $0 $4,040,000 $364,000 $660,600 $440,400 $5,505,000 $50,000 $50,000 $50,000 $150,000 $5,655,000 9% $489,000 91% $5,166,000 $3,580,038 $568,260 $433,944 $583,758 50% $2,827,500
DC14-RS00025 26 3.5 Clarke RoadVMP Extension to Fanshawe
Park Road 2 to 4 through lanes TS1476 2021 1375 $3,100 $4,262,500 $4,262,500 2900 $5,200 $15,080,000 $0 $19,342,500 $426,250 $2,965,313 $1,976,875 $24,710,938 $0 $0 $0 $0 $24,710,938 3% $672,375 97% $24,038,563 $16,658,724 $2,644,242 $2,019,239 $2,716,358 30% $7,413,281
DC14-RS00033 12 (2b) 3.6(iv) Sunningdale RoadStage 2 - Phase 2 - Bluebell to
Richmond2 to 4 through lanes TS1496 2022 1150 $4,600 $5,290,000 $5,290,000 0 $0 $0 $0 $5,290,000 $529,000 $872,850 $581,900 $7,273,750 $0 $0 $0 $0 $7,273,750 8% $562,350 92% $6,711,400 $4,651,000 $738,254 $563,758 $758,388 40% $2,909,500
DC14-RS00022 22a 4.5(i)Bradley Avenue
ExtensionPhase 1 - Jalna to Wharncliffe 4 through lanes TS1523 2022 1400 $4,200 $5,880,000 $5,880,000 0 $0 $0 100 $1,200 $120,000 $6,000,000 $588,000 $988,200 $658,800 $8,235,000 $756,000 $756,000 $1,008,000 $2,520,000 $10,755,000 0% $0 100% $10,755,000 $7,453,215 $1,183,050 $903,420 $1,215,315 20% $2,151,000
DC14-RS00026 34b Wonderland RoadPhase 2 - Springbank to
Commissioners4 to 6 through lanes 2022 1100 $2,800 $3,080,000 $3,080,000 $0 200 $1,200 $240,000 $3,320,000 $154,000 $521,100 $347,400 $4,342,500 $0 $0 $4,342,500 25% $1,076,900 75% $3,265,600 $2,263,061 $359,216 $274,310 $369,013 20% $868,500
DC14-RS00030 29b 5.4 Southdale Road WestPhase 2 - Farnham to Pine
Valley2 to 4 through lanes with
centre turn laneTS1629 2022 600 $3,600 $2,160,000 $2,160,000 0 $0 $0 $0 $2,160,000 $216,000 $356,400 $237,600 $2,970,000 $54,000 $54,000 $72,000 $180,000 $3,150,000 9% $293,400 91% $2,856,600 $1,979,624 $314,226 $239,954 $322,796 20% $630,000
DC14-RS00028 15a 3.12(i) Wonderland Road Phase 1 - Riverside to Oxford 4 to 6 through lanes TS1348 2023 1000 $2,800 $2,800,000 $2,800,000 800 $7,900 $6,320,000 $0 $9,120,000 $140,000 $1,389,000 $926,000 $11,575,000 $612,000 $612,000 $816,000 $2,040,000 $6,000,000 Complex railroad detour $19,615,000 42% $8,223,160 58% $11,391,840 $7,894,545 $1,253,102 $956,915 $1,287,278 20% $3,923,000
DC14-RS00027 10a 3.3(i) Bradley AvenuePhase 1 - Dearness to Pond
Mills2 to 4 through lanes TS1479 2024 2500 $3,200 $8,000,000 $8,000,000 0 $0 $0 1975 $1,200 $2,370,000 $10,370,000 $800,000 $1,675,500 $1,117,000 $13,962,500 $550,000 $550,000 $50,000 $1,150,000 $150,000 Hydro Tower $15,262,500 8% $1,222,500 92% $14,040,000 $9,729,720 $1,544,400 $1,179,360 $1,586,520 20% $3,052,500
DC14-RS00032 35a Wonderland Road Phase 1 - Exeter to Hwy 402 2 to 4 through lanes 2024 2000 $3,100 $6,200,000 $6,200,000 750 $5,200 $3,900,000 $0 $10,100,000 $620,000 $1,608,000 $1,072,000 $13,400,000 $0 $13,400,000 7% $978,000 93% $12,422,000 $8,608,446 $1,366,420 $1,043,448 $1,403,686 40% $5,360,000
DC14-RS00024 15b 3.12(ii) Wonderland Road Phase 2 - Oxford to Sarnia 4 to 6 through lanes TS1348 2025 1600 $2,800 $4,480,000 $4,480,000 460 $5,200 $2,392,000 $0 $6,872,000 $224,000 $1,064,400 $709,600 $8,870,000 $365,000 $365,000 $220,000 $950,000 $2,500,000Railway flagging.
Constructability. Approach fill material.
$12,320,000 13% $1,566,400 87% $10,753,600 $7,452,245 $1,182,896 $903,302 $1,215,15720% $2,464,000
DC14-RS00021 12 (2a) 3.6(iv) Sunningdale RoadStage 2 - Phase 1 - Adelaide to
Bluebell2 to 4 through lanes TS1496 2025 1100 $4,600 $5,060,000 $5,060,000 0 $0 $0 $0 $5,060,000 $506,000 $834,900 $556,600 $6,957,500 $0 $0 $0 $0 $4,000,000
Oil Pipeline relocation ($2M). Profile correction
($2M)$10,957,500 5% $537,900 95% $10,419,600 $7,220,783 $1,146,156 $875,246 $1,177,415
40% $4,383,000
DC14-RS00035 7 2.6 Huron Street Adelaide Street to Vesta Road 2 to 4 through lanes TS1478 2025 1800 $3,200 $5,760,000 $5,760,000 0 $0 $0 525 $1,200 $630,000 $6,390,000 $576,000 $1,044,900 $696,600 $8,707,500 $1,404,000 $1,404,000 $1,872,000 $4,680,000 $1,000,000Retaining wall in front of St.
Peter's$14,387,500 6% $880,200 94% $13,507,300 $9,360,559 $1,485,803 $1,134,613 $1,526,325 30% $4,316,250
DC14-RS00037 27 Huron Street Highbury to Clarke Road 2 to 4 through lanes 2026 2400 $3,200 $7,680,000 $7,680,000 $0 2000 $1,200 $2,400,000 $10,080,000 $768,000 $1,627,200 $1,084,800 $13,560,000 $800,000 $700,000 $100,000 $1,600,000 $15,160,000 8% $1,173,600 92% $13,986,400 $9,692,575 $1,538,504 $1,174,858 $1,580,463 30% $4,548,000
DC14-RS00038 29a 5.4 Southdale Road WestPhase 1 - Colonel Talbot to
Farnham2 to 4 through lanes with
centre turn laneTS1629 2026 2200 $3,600 $7,920,000 $1,360,000 $9,280,000 0 $0 $0 250 $1,200 $300,000 $9,580,000 $928,000 $1,576,200 $1,050,800 $13,135,000 $219,000 $219,000 $292,000 $730,000 $13,865,000 8% $1,075,800 92% $12,789,200 $8,862,916 $1,406,812 $1,074,293 $1,445,180 30% $4,159,500
DC14-RS00034 20 4.3 Wonderland Road NorthSunningdale Road to Fanshawe
Park Road2 to 4 through lanes TS1354 2027 1300 $4,600 $5,980,000 $5,980,000 0 $0 $0 200 $1,200 $240,000 $6,220,000 $598,000 $1,022,700 $681,800 $8,522,500 $400,000 $400,000 $500,000 $1,300,000 $9,822,500 6% $635,700 94% $9,186,800 $6,366,452 $1,010,548 $771,691 $1,038,108 50% $4,911,250
DC14-RS00039 16b 3.13(b) Sarnia RoadPhase 2 - Hyde Park to
Oakcrossing Gate2 to 4 through lanes TS1349 2027 1350 $2,300 $3,105,000 $3,105,000 0 $0 $0 $0 $3,105,000 $50,000 $250,000 $360,000 $3,765,000 $0 $0 $0 $0 $3,765,000 18% $660,150 82% $3,104,850 $2,151,661 $341,534 $260,807 $350,848 40% $1,506,000
DC14-RS00040 17a 3.14(i)Boler Road / Sanatorium
RoadPhase 1 - Oxford to Riverside 2 to 4 through lanes TS1350 2027 900 $4,600 $4,140,000 $4,140,000 0 $0 $0 130 $1,200 $156,000 $4,296,000 $414,000 $706,500 $471,000 $5,887,500 $250,000 $250,000 $500,000 $1,000,000 $6,887,500 6% $440,100 94% $6,447,400 $4,468,048 $709,214 $541,582 $728,556 30% $2,066,250
DC14-RS00042 37 Adelaide StreetFanshawe Park Road to
Hamilton RoadOptimization 2027 6300 $2,100 $13,230,000 $13,230,000 $0 $0 $13,230,000 $661,500 $2,083,725 $1,389,150 $17,364,375 $0 $17,364,375 36% $6,167,700 64% $11,196,675 $7,759,296 $1,231,634 $940,521 $1,265,224 30% $5,209,313
DC14-RS00043 3 1.8Veterans Memorial
ParkwayOxford Street to Huron Street 2 to 4 through lanes TS1491 2028 1800 $3,200 $5,760,000 $5,760,000 0 $0 $0 $0 $5,760,000 $576,000 $950,400 $633,600 $7,920,000 $0 $0 $0 $0 $7,920,000 11% $880,200 89% $7,039,800 $4,878,581 $774,378 $591,343 $795,497 40% $3,168,000
DC14-RS00044 18 3.16Commissioners Road
EastHighbury Ave to Jackson Rd 2 to 4 through lanes TS1352 2028 1500 $3,200 $4,800,000 $4,800,000 0 $0 $0 $0 $4,800,000 $480,000 $792,000 $528,000 $6,600,000 $0 $0 $0 $0 $6,600,000 11% $733,500 89% $5,866,500 $4,065,485 $645,315 $492,786 $662,915 40% $2,640,000
DC14-RS00045 35b Wonderland Road Phase 2 - Hwy 402 to Hwy 401 2 to 4 through lanes 2028 2900 $3,400 $9,860,000 $9,860,000 $0 $0 $9,860,000 $986,000 $1,626,900 $1,084,600 $13,557,500 $0 $13,557,500 10% $1,418,100 90% $12,139,400 $8,412,604 $1,335,334 $1,019,710 $1,371,752 50% $6,778,750
DC14-RS00036 13a 3.8(i) Oxford Street WestPhase 1 - Sanitorium to
Commissioners2 to 4 through lanes TS1472 2029 1650 $3,400 $5,610,000 $5,610,000 750 $4,000 $3,000,000 $0 $8,610,000 $561,000 $1,375,650 $917,100 $11,463,750 $1,000,000 $320,000 $600,000 $1,920,000 $1,000,000
Poor soil conditions at bridge location
$14,383,750 6% $806,850 94% $13,576,900 $9,408,792 $1,493,459 $1,140,460 $1,534,190 40% $5,753,500
DC14-RS00048 24a 5.6 Hamilton RoadOld Victoria to Veterans
Memorial Parkway2 to 4 through lanes with
centre turn laneTS2172 2029 925 $4,900 $4,532,500 $4,532,500 $0 $0 $4,532,500 $453,250 $747,863 $498,575 $6,232,188 $0 $0 $0 $0 $6,232,188 7% $452,325 93% $5,779,863 $4,005,445 $635,785 $485,508 $653,124 45% $2,804,484
DC14-RS00049 25 Hamilton Road Highbury to River Run Terrace 2 to 4 through lanes 2029 2300 $4,600 $10,580,000 $10,580,000 250 $5,200 $1,300,000 $0 $11,880,000 $1,058,000 $1,940,700 $1,293,800 $16,172,500 $350,000 $350,000 $500,000 $1,200,000 $1,000,000Retaining walls and lawsuit with respect to old bridge
and condo's$18,372,500 6% $1,124,700 94% $17,247,800 $11,952,725 $1,897,258 $1,448,815 $1,949,001
45% $8,267,625
DC14-RS00051 38 Hamilton RoadAdelaide Street to Highbury
AvenueOptimization 2029 2800 $2,100 $5,880,000 $5,880,000 $0 $0 $5,880,000 $294,000 $926,100 $617,400 $7,717,500 $0 $1,000,000 Access issues $8,717,500 31% $2,741,200 69% $5,976,300 $4,141,576 $657,393 $502,009 $675,322 45% $3,922,875
DC14-RS00029 17b 3.14(ii)Boler Road / Sanatorium
RoadPhase 2- Riverside to
Commissioners2 to 4 through lanes TS1350 2030 550 $4,600 $2,530,000 $2,530,000 1270 $5,200 $6,604,000 $0 $9,134,000 $253,000 $1,408,050 $938,700 $11,733,750 $100,000 $200,000 $100,000 $400,000 $12,133,750 2% $268,950 98% $11,864,800 $8,222,306 $1,305,128 $996,643 $1,340,722 20% $2,426,750
DC14-RS00031 10b 3.3(ii) Bradley AvenuePhase 2 - Pond Mills to
Jackson2 to 4 through lanes TS1479 2030 2300 $3,200 $7,360,000 $7,360,000 630 $5,200 $3,276,000 $0 $10,636,000 $736,000 $1,705,800 $1,137,200 $14,215,000 $210,000 $80,000 $210,000 $500,000 $4,000,000
Retaining walls ($1M), Poor soils ($3M)
$18,715,000 6% $1,124,700 94% $17,590,300 $12,190,078 $1,934,933 $1,477,585 $1,987,704 40% $7,486,000
DC14-RS00055 31Commissioners Road
WestCranbrook Road to Springbank
Drive4 through lanes with centre
turn lane2031 1100 $4,600 $5,060,000 $5,060,000 $0 $0 $5,060,000 $506,000 $834,900 $556,600 $6,957,500 $0 $700,000 Fill for pit $7,657,500 0% $0 100% $7,657,500 $5,306,648 $842,325 $643,230 $865,298 45% $3,445,875
DC14-RS00056 Adelaide Street CPR Overpass Overpass 2031 $0 $0 $0 $0 $0 $0 $0 $0 $25,000,000 $3,750,000 $21,250,000 67% $14,301,250 33% $6,948,750 $4,815,484 $764,363 $583,695 $785,209 50% $10,625,000
DC14-RS00047 22c 4.5(iii)Bradley Avenue
ExtensionPhase 3 - Wonderland to
Bostwick2 through lanes TS1523 2032 975 $3,200 $3,120,000 $3,120,000 0 $0 $0 $0 $3,120,000 $312,000 $514,800 $343,200 $4,290,000 $540,000 $540,000 $720,000 $1,800,000 $6,090,000 0% $0 100% $6,090,000 $4,220,370 $669,900 $511,560 $688,170 45% $2,740,500
DC14-RS00052 13b 3.8(ii) Oxford Street WestPhase 2 - Commissioners to
Westdel Bourne2 to 4 through lanes TS1472 2032 1000 $3,400 $3,400,000 $3,400,000 0 $0 $0 $0 $3,400,000 $340,000 $561,000 $374,000 $4,675,000 $0 $0 $0 $0 $4,675,000 10% $489,000 90% $4,186,000 $2,900,898 $460,460 $351,624 $473,018 50% $2,337,500
DC14-RS00058 23 5.3Fanshawe Park Road
EastClarke to Highbury 2 to 4 through lanes TS1628 2032 2500 $4,600 $11,500,000 $11,500,000 0 $0 $0 $0 $11,500,000 $1,150,000 $1,897,500 $1,265,000 $15,812,500 $0 $0 $0 $0 $500,000 Cemetary vs property taking $16,312,500 7% $1,222,500 93% $15,090,000 $10,457,370 $1,659,900 $1,267,560 $1,705,170 45% $7,340,625
DC14-RS00059 30Commissioners Road
WestWonderland Road to Cranbrook
Road2 to 4 through lanes with
centre turn lane2032 1000 $3,600 $3,600,000 $3,600,000 $0 250 $1,200 $300,000 $3,900,000 $360,000 $639,000 $426,000 $5,325,000 $145,000 $425,000 $375,000 $945,000 $6,270,000 8% $489,000 92% $5,781,000 $4,006,233 $635,910 $485,604 $653,253 45% $2,821,500
DC14-RS00053 14a 3.10(i) Fanshawe Park RoadPhase 1 - Adelaide to
Richmond4 to 6 through lanes TS1346 2033 2400 $2,800 $6,720,000 $6,720,000 $6,720,000 $672,000 $1,108,800 $739,200 $9,240,000 $9,240,000 25% $2,349,600 75% $6,890,400 $4,775,047 $757,944 $578,794 $778,615 45% $4,158,000
DC14-RS00061 43Veterans Memorial
ParkwayBradley Avenue Interchange 2033 $14,608,696 $14,608,696 1000 $4,000 $4,000,000 $0 $18,608,696 $1,460,870 $3,010,435 $2,006,957 $25,086,956 $0 $25,086,956 0% $0 100% $25,086,956 $17,385,261 $2,759,565 $2,107,304 $2,834,826 80% $20,069,565
Total $648,395,190 13% $85,404,900 87% $562,990,290 $390,152,271 $61,928,932 $47,291,184 $63,617,903 $199,457,624
(1) Takes into account roadway portions already widened at key intersections and widening with minor reconstruction relative to existing, or full reconstruction. See Figure 4.(2) As per Table ES-1. Typical roadway cross-section includes number of lanes added with/without turning lanes; sidewalks both sides (urban only); bikepath both sides in roadway (urban only); streetlighting (urban only); traffic signals at key intersections (500m spacing); 50/100 mm depth top/base asphalt and 150/600 mm Granular A/B road structure; curb and gutter; R.O.W. drainage only; Structures, utilities, noise walls and land requirements separate. (3) Bridges and/or large diameter culverts.(4) Back Lot application only. (5) Projected project needs at full capacity after construction. V/C = 1 triggers project. When project is built, additional lanes will be near LOS C-D.(6) Utility relocation based on 10% of Roadway Construction Cost except for 4-5 lane and 4-6 lane widenings(7) Engineering Costs 15% based on Total Construction Cost.(8) Contingencies 10% based on Total Construction Cost. Construction contingencies include monies set aside for aesthetics (trees, monuments, benches, banners, planters, light standards, etc.)
(14) Assume intersections have average 8/92 NG/G split(15) Includes noise wall and retaining wall, where required(16) Based on Growth Percentage for Rail Grade Separation. Non-Growth % = Existing cross section / Future Cross Section. Assume Lane = 3.5m, Bike Lane = 1.5m, Sidewalk = 1.5mWestern Rd @ CPR (from 2 lanes to 5 lanes, 2 bike lanes, 2 sidewalks) = 7m / 23.5m = 29.8%Wharncliffe @ CNR (from 3 lanes, 2 bike lanes, 2 sidewalks to 6 lanes, 2 bike lanes and 2 sidewalks) = 13.5m / 27m = 50%Wonderland @ CNR (from 4 lanes, 2 bike lanes, 2 sidewalks to 8 lanes, 2 bike lanes, 2 sidewalks) = 20m / 34m = 58.8%(17) Railway Crossings are based on Delay Calculation (67.3% Non-Growth / 32.7% Growth)(18) Non-Growth Percentage calculated based on current and widened structure(19) In the DC by-law, Post Period Benefit is deleted from cost eligible for DC rate calculation. Not shown here for clarity.(20) Post Period Benefit is calculated based on total project cost, and does not include deduction for Previous Funding.
DC Project Number
Project Number 2009 DC Ref # Road Name Limits ImprovementRecommend
ed YearProject Length (m)
Roadway Construction Cost (per/m)
(1)
Roadway Construction Cost
Sanitary/ Water Restoration Deduction
Area of New/Widened
Structures (m2)
Structures Cost (per/m2) (1)
Structures Construction Cost
Length of Noise Wall (m)Noise Wall
Construction Cost (per/m)
Noise Wall Construction Cost
Painting Cost (5)Local Road Drainage and Storm Sewer (6)
Total Construction Cost
Utility Relocation (4)
EngineeringEnvironmental Assessment
ContingencyGrand Total
Construction CostRaw Land
Land Acquisition Cost
Complexity Note Total Grants Amount Net Total Non-Growth % Non-Growth $ Growth % Growth $Residential
(69.3%)Industrial (11.0%)
Institutional (8.4%)
Commercial (11.3%)
Deduction (%) Deduction ($)
DC14-RS00101 BRT 1 Wellington RoadBradley Avenue to Horton
Street4 to 6 through lanes 2018 5500 $3,891 $21,400,000 550 $5,200 $2,860,000 500 $1,200 $600,000 $200,000 $17,325,000 $42,385,000 $2,140,000 $7,500,000 $800,000 $4,238,500 $57,063,500 $29,563,000 $29,563,000 $3,167,200
Potential Stormwater issues
$89,793,700 $59,862,467 $29,931,233 6% $1,794,833 94% $28,136,400 $19,498,525 $3,095,004 $2,363,458 $3,179,413 20% $5,986,246.67
DC14-RS00102 BRT 2 Richmond StreetFanshawe Park Road to
Raymond Avenue4 to 6 through lanes 2017 2300 $2,800 $6,440,000 800 $4,000 $3,200,000 $120,000 $7,245,000 $17,005,000 $644,000 $2,500,000 $1,000,000 $1,700,500 $22,849,500 $12,363,000 $12,363,000 $897,000
Impacts due to UWO egress
$36,109,500 $24,073,000 $12,036,500 6% $750,567 94% $11,285,933 $7,821,152 $1,241,453 $948,018 $1,275,310 20% $2,407,300.00
DC14-RS00103 BRT 3 Highbury Avenue Dundas Street to Oxford Street 4 to 6 through lanes 2019 1300 $2,800 $3,640,000 500 $5,200 $4,600,000 $80,000 $8,320,000 $364,000 $1,396,000 $200,000 $832,000 $11,112,000 $6,987,000 $6,987,000 $507,000Railway bridge widening
- CP flagging issues$18,606,000 $12,404,000 $6,202,000 7% $424,233 93% $5,777,767 $4,003,992 $635,554 $485,332 $652,888 12% $744,240.00
DC14-RS00104 BRT 4 Dundas StreetAdelaide Street to Highbury
Avenue4 to 6 through lanes 2019 2500 $2,800 $7,000,000 $80,000 $7,080,000 $700,000 $1,305,000 $300,000 $708,000 $10,093,000 $13,437,000 $13,437,000 $975,000
Removal of on street parking and potential impacts of relocation
$24,505,000 $16,336,667 $8,168,333 10% $815,833 90% $7,352,500 $5,095,283 $808,775 $617,610 $830,833 12% $980,200.00
DC14-RS00105 BRT 5 Oxford StreetHighbury Avenue to Clarke
Road4 to 6 through lanes 2019 2400 $3,675 $8,820,000 $40,000 $8,860,000 $882,000 $1,634,000 $300,000 $886,000 $12,562,000 $12,900,000 $12,900,000 $1,215,120
Potential Stormwater issues
$26,677,120 $17,784,747 $8,892,373 9% $783,200 91% $8,109,173 $5,619,657 $892,009 $681,171 $916,337 12% $1,067,084.80
DC14-RS00106 BRT 6 Oxford Street WestHyde Park Road to Richmond
Street4 to 6 through lanes 2020 6000 $2,800 $16,800,000 375 $1,200 $450,000 $360,000 $18,900,000 $36,510,000 $1,680,000 $5,500,000 $800,000 $3,651,000 $48,141,000 $32,250,000 $32,250,000 $2,505,000
Potential Railway Complications
$82,896,000 $55,264,000 $27,632,000 7% $1,958,000 93% $25,674,000 $17,792,082 $2,824,140 $2,156,616 $2,901,162 12% $3,315,840.00
DC14-RS00107 BRT 7 Richmond StreetRaymond Avenue to York
StreetOptimization 2016 3800 $2,100 $7,980,000 $1,640,000 $9,620,000 $798,000 $1,753,000 $60,000 $962,000 $13,193,000 $0 $1,349,000
Potential impacts at intersections (Angel St.) to be determined by EA
$14,542,000 $9,694,667 $4,847,333 26% $1,240,067 74% $3,607,267 $2,499,836 $396,799 $303,010 $407,621 20% $969,466.67
DC14-RS00108 BRT 8 York StreetRichmond Street to Colborne
StreetOptimization 2017 900 $2,100 $1,890,000 $360,000 $2,250,000 $189,000 $411,000 $60,000 $225,000 $3,135,000 $0 $319,000
Impacts at pedestrian crossings
$3,454,000 $2,302,667 $1,151,333 26% $293,700 74% $857,633 $594,340 $94,340 $72,041 $96,913 12% $138,160.00
DC14-RS00109 BRT 9 Colborne Street York Street to Dundas Street Optimization 2019 300 $2,100 $630,000 $120,000 $750,000 $63,000 $137,000 $60,000 $75,000 $1,085,000 $0 $106,000Impacts at pedestrian
crossings$1,191,000 $794,000 $397,000 25% $97,900 75% $299,100 $207,276 $32,901 $25,124 $33,798 12% $47,640.00
DC14-RS00110 BRT 10 Dundas StreetColborne Street to Adelaide
StreetOptimization 2018 700 $2,100 $1,470,000 $280,000 $1,750,000 $147,000 $319,000 $60,000 $175,000 $2,451,000 $0 $248,000
Impacts at pedestrian crossings
$2,699,000 $1,799,333 $899,667 25% $228,433 75% $671,233 $465,165 $73,836 $56,384 $75,849 12% $107,960.00
DC14-RS00111 BRT 11 Wellington Road Horton Street to York Street Optimization 2020 300 $2,100 $630,000 $120,000 $750,000 $63,000 $137,000 $60,000 $75,000 $1,085,000 $0 $106,000Impacts at pedestrian
crossings$1,191,000 $794,000 $397,000 25% $97,900 75% $299,100 $207,276 $32,901 $25,124 $33,798 20% $79,400.00
Total $301,664,320 $201,109,547 $100,554,773 8% $8,484,667 92% $92,070,107 $63,804,584 $10,127,712 $7,733,889 $10,403,922 $15,843,538Notes:(1) Roadway Construction Costs ($/m) as per Table ES-1(2) Parts of Wellington are Rural (no sidewalks or curbs ~2km), upgrade to urban 6 lanes is $5800/m, the rest (~3.5km) is urban upgrade to 6 lanes at $2800/m(3) Parts of Oxford East are Rural (no sidewalks or curbs ~0.7km), upgrade to urban 6 lanes is $5800/m, the rest (~1.7km) is urban upgrade to 6 lanes at $2800/m(4) Utilities are 10% of Roadway Construction Cost
(5) Painting costs are for 2 lanes, 4m wide for the length of the segment, at a cost of $50/m2. Painting of Q-Jump Lanes is includedQ-Jump lanes are assumed to be 100m long by 4m wide on both sides of the street, painting costing $50/m2 ($40,000 at each location)(6) Assumed 1200mm diameter pipe at a depth of 2.5m. Pipe Cost = $610/m, Construction Cost = $770/m, and Restoration Cost = $1770/m, Total = $3150/m
TABLE ES-2CITY OF LONDON
2014 TRANSPORTATION DEVELOPMENT CHARGE BACKGROUND STUDYFUTURE MAJOR TRANSPORTATION ROADWORKS (2014-2033)
(Revised May 2014)
Post Period Benefit
Post Period Benefit
Bus Rapid Transit System
(12) Includes Bridge and Retaining Walls(13) Estimated costs are from completed EAs, provided by City of London Transportation Capital Budget.
2 Lane = $489,000/km3 Lane = $734,000/km 4 Lane = $979,000/km
(11) Includes $2.6M for Medway Creek Bridge and $1.1M for watermain at the bridge.
Non-Growth Growth
(9) Utility relocation costs reduced to 5% of Roadway Construction Cost for 4-5 lane & 4-6 lane widenings(10) Fill component included in roadway cost.
( )
(14)
(9)
(9)
(9)
(9)
(14)
(16)
(16)
(16)
(18)
(18)
(17)
(9)
(5)(5)
(5)
(5)
(5)
(5)
(5)
(5)
(5)
(5)
(5)
(5)
(5)
(5)
(5)
(5)
(5)
(5)
(5)
(11)(10)
(12)
(9)
(9)
(13)
(13)(13)
(13)
(13)
(13)
(13)
(15)
(15)
(15)
(18)
(2)
(3)
(18)
(10)
(19)

HWY 401 E
DUNDAS ST
OXFORD ST E
RIC
HM
ON
D S
T
AD
EL
AID
E S
T N
HAMILTON RD
OXFORD ST W
HIG
HB
UR
Y A
VE
N
COMMISSIONERS RD
SUNNINGDALE RD E
WO
ND
ER
LA
ND
RD
S
WO
ND
ER
LA
ND
RD
N
HIG
HB
UR
Y A
VE
S
SUNNINGDALE RD W
HORTON ST E
AD
EL
AID
E S
T S
Figure ES-2:
Major TransportationRoadworks
Scale: As Shown Datum: NAD83 UTM17N
Date: February 2014 PN: 60275642
0 3 6 9 121.5Kilometres
City of London2014 TransportationDevelopment Charge
Background Study
Legend
Rail Line
City of London Limits
Water
Urban Growth Boundary
Road Improvements
Work Type
2 to 4 Lanes
2 Lane Upgrade
3 to 4 Lanes
4 to 6 Lanes
BRT (Optimization)
New 2 Lane
New 4 Lane
Optimization
Overpass
Widen for BRT (4-6 lanes)
Intersection Improvements
New Interchange\Improvements

AECOM The Corporation of the City of London 2014 Transportation Development Charge Background Study
Executive Summary
2014 Trans DC Executive Summary - 05-28-2014.Docx 9
2.2 Two Lane Arterial Upgrades
Table ES-4 identifies the two lane arterial roadway upgrades necessitated by growth over the next 20 years. Each work is identified by growth area complete with street from/to and segment length information with timing consistent with the City’s GMIS. Each work is shown on Figure ES-2.
Proposed unit costs per metre for two lane arterial roadway upgrades are provided in 2014 dollars and were derived by taking the unit costs from the previous Transportation DC Study and adjusting them for annual construction cost escalation. The proposed unit costs were back checked against recent tender information to confirm their validity.
The total cost for the two lane arterial upgrades is $97.6 Million as provided in Table ES-4, with a net Growth cost of $86.2 Million and a net Non-Growth cost of $11.4 Million.
2.3 Minor Roadworks
The Minor Roadworks required to service growth over the next 20 years were primarily identified from current ongoing development applications and anticipated emergent applications inside the City’s GMIS boundary. All of the Minor Roadworks to be completed are included in Appendix C.
Development in the City creates growth related pressures on the infrastructure not only in the specific area being built, but also in areas within close proximity. Minor Roadworks help alleviate the growth related pressures on the infrastructure. Needs are generated from growth that requires the building or realigning of the following items:
Traffic Signals, Channelization, Roundabouts, Sidewalks, and Street Lights.
The proposed unit costs for traffic signals, channelization, sidewalks and street lighting are provided in 2014 dollars and were derived by taking the unit costs from the previous Transportation DC Study and adjusting them for annual construction cost escalation. Proposed costs were back checked against recent tender information when available to confirm their validity.
2.4 Programs
Programs are represented by example studies and undertakings that are justified by spending of capital at various locations across the whole city, including:
Urban Intersections (Traffic Signals and Street Lights) Rural Intersections Active Transportation Advance Purchase of Land Road Class Oversizing / City Share
Proposed costs of programs are taken from known budget spending and related trends in tenders.

LENGTHSTRUCTURE
AREA
% $ % $ % $ % $ % $ % $Number of
IntersectionsCost per
Intersection (4) PPB%POST PERIOD
BENEFIT
DC14-RS00215 Kilally Phase 1175m west of Webster
to 225m east of Webster
2LRA 2 Lane Upgrade TS1411 2016 700 2,800 $1,960,000 $1,960,000 $196,000 $323,400 $215,600 $2,695,000 13% $342,300 87% $2,352,700 69.3% $1,630,421 11.0% $258,797 11.3% $265,855 8.4% $197,627
DC14-RS00202 Sarnia RoadStage 2 Phase 2 -
Hyde Park to Oakcrossing Gate
2LUA 2 Lane Upgrade TS1349 2017 1150 3,200 $3,680,000 $3,680,000 $368,000 $607,200 $404,800 $5,060,000 11% $562,350 89% $4,497,650 69.3% $3,116,871 11.0% $494,742 11.3% $508,234 8.4% $377,803
DC14-RS00204 SunningdaleSouth Winege to
Highbury2LUA 2 Lane Upgrade TS1406 2017 800 3,200 $2,560,000 $2,560,000 $256,000 $422,400 $281,600 $3,520,000 11% $391,200 89% $3,128,800 69.3% $2,168,258 11.0% $344,168 11.3% $353,554 8.4% $262,819
DC14-RS00205 Wonderland 401 to 402 2LRA 2 Lane Upgrade 2017 2700 2,800 $7,560,000 $7,560,000 $756,000 $1,247,400 $831,600 $10,395,000 13% $1,320,300 87% $9,074,700 69.3% $6,288,767 11.0% $998,217 11.3% $1,025,441 8.4% $762,275
DC14-RS00206 Wickerson Ironwood to Southdale 2LRA 2 Lane Upgrade TS1408 2018 670 2,800 $1,876,000 $1,876,000 $187,600 $309,540 $206,360 $2,579,500 13% $327,630 87% $2,251,870 69.3% $1,560,546 11.0% $247,706 11.3% $254,461 8.4% $189,157 1 $400,000 16% $400,000
DC14-RS00207 SouthdaleWickerson to
Bramblewood Place2LRA 2 Lane Upgrade TS1407 2018 1050 2,800 $2,940,000 $2,940,000 $294,000 $485,100 $323,400 $4,042,500 13% $513,450 87% $3,529,050 69.3% $2,445,632 11.0% $388,196 11.3% $398,783 8.4% $296,440 2 $400,000 20% $800,000
DC14-RS00208 SouthdaleWickerson to
Bramblewood Place2 Lane Upgrade TS1407 2018 $2,000,000 $2,000,000 $200,000 $330,000 $220,000 $2,750,000 0% $0 100% $2,750,000 69.3% $1,905,750 11.0% $302,500 11.3% $310,750 8.4% $231,000
DC14-RS00209 SouthdaleWickerson to Westdel
Bourne2LRA 2 Lane Upgrade 2018 400 2,800 $1,120,000 $1,120,000 $112,000 $184,800 $123,200 $1,540,000 13% $195,600 87% $1,344,400 69.3% $931,669 11.0% $147,884 11.3% $151,917 8.4% $112,930
DC14-RS00220 HuronVMP easterly to
Railway2LRA 2 Lane Upgrade 2019 450 2,800 $1,260,000 $1,260,000 $126,000 $207,900 $138,600 $1,732,500 13% $220,050 87% $1,512,450 69.3% $1,048,128 11.0% $166,370 11.3% $170,907 8.4% $127,046
DC14-RS00221 Wilton GroveCommerce Road to
City Limits2LRA 2 Lane Upgrade 2019 3260 2,800 $9,128,000 $9,128,000 $912,800 $1,506,120 $1,004,080 $12,551,000 13% $1,594,140 87% $10,956,860 69.3% $7,593,104 11.0% $1,205,255 11.3% $1,238,125 8.4% $920,376 2 $800,000 13% $1,600,000
DC14-RS00210 Bostwick Pack to Southdale 2LRA 2 Lane Upgrade TS1357 2021 750 2,800 $2,100,000 $2,100,000 $210,000 $346,500 $231,000 $2,887,500 13% $366,750 87% $2,520,750 69.3% $1,746,880 11.0% $277,283 11.3% $284,845 8.4% $211,743
DC14-RS00211 Pack RdColonel Talbot to
Bostwick2LRA 2 Lane Upgrade 2022 2000 2,800 $5,600,000 $5,600,000 $560,000 $924,000 $616,000 $7,700,000 13% $978,000 87% $6,722,000 69.3% $4,658,346 11.0% $739,420 11.3% $759,586 8.4% $564,648
DC14-RS00213 Hamilton Gore to Old Victoria 2LUA 2 Lane Upgrade TS1405 2023 3600 3,200 $11,520,000 100 $3,300 $330,000 $11,850,000 $1,185,000 $1,955,250 $1,303,500 $16,293,750 11% $1,760,400 89% $14,533,350 69.3% $10,071,612 11.0% $1,598,669 11.3% $1,642,269 8.4% $1,220,801
DC14-RS00203 Old Victoria Hamilton to Bradley 2LRA 2 Lane Upgrade 2024 1300 2,800 $3,640,000 $3,640,000 $364,000 $600,600 $400,400 $5,005,000 13% $635,700 87% $4,369,300 69.3% $3,027,925 11.0% $480,623 11.3% $493,731 8.4% $367,021 2 $400,000 16% $800,000
DC14-RS00217 Byron BaselineWickerson to Westdel
Bourne2LRA 2 Lane Upgrade TS1345 2025 650 2,800 $1,820,000 $1,820,000 $182,000 $300,300 $200,200 $2,502,500 13% $317,850 87% $2,184,650 69.3% $1,513,962 11.0% $240,312 11.3% $246,865 8.4% $183,511 1 $800,000 32% $800,000
DC14-RS00212 Colonel Talbot300m South of
Southdale to Kilbourne2LUA 2 Lane Upgrade 2026 2200 3,200 $7,040,000 $7,040,000 $704,000 $1,161,600 $774,400 $9,680,000 11% $1,075,800 89% $8,604,200 69.3% $5,962,711 11.0% $946,462 11.3% $972,275 8.4% $722,753 1 $400,000 4% $400,000
DC14-RS00222 Kilally Phase 2 Webster to Clarke 2LRA 2 Lane Upgrade TS1411 2030 1730 2,800 $4,844,000 $4,844,000 $484,400 $799,260 $532,840 $6,660,500 13% $845,970 87% $5,814,530 69.3% $4,029,469 11.0% $639,598 11.3% $657,042 8.4% $488,421
Total $97,594,750 12% $11,447,490 88% $86,147,260 69.3% $59,700,051 11.0% $9,476,199 11.3% $9,734,640 8.4% $7,236,370 $4,800,000
(4) Cost per intersection is assumed to be $800,000. Intesection that is on Urban Growth boundary is assumed to be half the cost, $400,000. Intersections outside of the boundary are assumed to be the full $800,000.
DC Project Number INSTITUTIONAL (3)GROWTH RESIDENTIAL (3) INDUSTRIAL (3) COMMERCIAL (3)UNIT $/M (2)
UTILITY RELOCATION
(10%)Project
M2
TOTAL CONST. COST
ENGINEERING (15%)
(M)
STRUCTURE COST
(2) From Table ES-1(1) See Figure ES-2 for work location
Fill
(3) Provided by the City of London
Limits
2 Lane = $489,000/km3 Lane = $734,000/km 4 Lane = $979,000/km
NON GROWTHRoad (1)
GROWTH ALLOCATIONS
TABLE ES-4CITY OF LONDON
2014 TRANSPORTATION DEVELOPMENT CHARGE BACKGROUND STUDYFUTURE ROAD WORKS - TWO-LANE ARTERIAL UPGRADES (2014-2033)
(Revised May 2014)
City IDImprovementCONTINGENCIES
(10%)TOTAL
Recommended Year
ROADWORKS COST
STRUCTURE UNIT COST
$/M2
(2)

AECOM The Corporation of the City of London 2014 Transportation Development Charge Background Study
Executive Summary
2014 Trans DC Executive Summary - 05-28-2014.Docx 10
3. Rapid Transit System Costs and Alternatives
Council have endorsed the implementation of the RT system and accepted the Bus Rapid Transit (BRT) business case that sets the cost of roadworks and hard infrastructure to be $301.7 Million and anticipates a 66% share of funding through senior governments. The Benefit to Existing (Non-Growth) for the roadworks was developed utilizing the rehabilitation method used for other road projects. This estimates an 8% split with a proposed 92% being DC eligible. A Post Period Benefit (PPB) was calculated based on a ratio of the future capacity and the usage in the last year of this DC study. Varying predicted usage of the two corridors lead to a 20% PPB on the North-South corridor and a 12% PPB on the East-West corridor. The estimated total charge to CSRF would be the remaining 33% share not covered by the anticipated funding from senior governments, for a total of $100.6 Million. The TMP placed significant focus on the RT system, nodal growth and infill and intensification. Alternatively, network improvements to roadworks could be made on parallel arterials. These short term improvements would require other future similar road improvements on other roads. Whereas the RT system lays the ground work for a system that can be readily expanded and optimized to meet future needs in a more economical and environmentally responsible manner. The implementation of the RT system is cost-effective for the DC because it leverages senior government funding and expands road capacity more effectively. Alternatively, if the RT system is not implemented, these and potentially other road widenings would be required at 100% Growth funding.
4. Highway 401 Interchanges
A number of Highway 401 Interchange improvements have been included in the program. These improvements provide the City with a cost-effective opportunity, as the Province is funding over three quarters of the project costs to cover the global growth need. The City’s share in principle estimates the growth share of London and the benefit to existing for London’s population. It is envisioned that this senior government investment will open up new lands for multiple growth uses along one of Canada’s most vibrant transportation corridors.
5. Development Charge Implications
The following sections outline the methodology used to determine BTE (Growth/Non-Growth) allocation, Post Period Benefit and final costs to be used to calculate development charge rates associated with future transportation needs driven by growth over a 20 year period from 2014 to 2033 consistent with the GMIS Boundary.
5.1 Benefit to Existing (Growth/Non-Growth) Determination
BTE (Growth/Non-Growth) allocation is based on previous DC policy as reiterated for completeness below:
1) For road widenings including arterial, two lane arterial upgrades and BRT, required for increased traffic growth, BTE (Growth/Non-Growth) components were determined as follows: The 20 year rehabilitation costs for roadways in question shall be estimated and become the Non-
Growth share for the DC calculation purposes. These rehabilitation credits were determined by calculating the cost of alternative roadway rehabilitation/replacement scenarios over the service life of the asphalt pavement and underlying granular road base (60 year timeframe assumed). The alternative that had the highest cost was pro-rated into a present value. In calculating the 20 year

AECOM The Corporation of the City of London 2014 Transportation Development Charge Background Study
Executive Summary
2014 Trans DC Executive Summary - 05-28-2014.Docx 11
rehabilitation costs provided in Table ES-2 (2 lane = $489,000/km; 3 lane = $734,000/km; 4 lane = $979,000/km), roadway rehabilitations (milling and asphalt resurfacing), were considered to have a service life of 13.3 years. Full roadway reconstruction was considered to be required at 30 year intervals.
100% credit to the Non-Growth portion was provided for full rehabilitation assuming no additional life of pavement due to recent restorations, or extended service life due to premium mix designs or low equivalent single axle loads.
2) For new infrastructure that is a network need identified in the London 2030 TMP, these are a 100% Growth need.
3) For the replacement of interchanges, the ratio share of existing foot print / proposed foot print on the structure is the Non-Growth share (including gore areas for ramps on the structure).
4) For new grade separations required for railway crossings where a bridge does not current exist, the ratio share of % delay attributed to Growth is taken as the Growth share.
5) For the reconstruction of existing rail grade separations the ratio share of existing foot print / proposed foot print of the structure is the Non-Growth share.
Summarizing this approach for all roadworks, the Non-Growth component was calculated to range on a project basis from 0% to 67% as shown in Table ES-2.
Considering all of the Major Roadworks identified in Table ES-2 to confirm rehabilitation and widening/reconstruction needs for 2, 4 and 6 lane roadways, resulted in a global BTE (Growth/Non-Growth) percentage of 87% Growth and 13% Non-Growth.
The minor road program addresses growth needs of emergent areas and adjacent or connected bottlenecks in the transportation system. Council has set the principle of Growth paying for Growth in the DC bylaw. The introduction of traffic control devices reduces current flow speed, and increases areas of conflict, potentially increasing the probability for congestion, friction, weaving and different types of collisions. As such, the Benefit to Existing for these pieces of infrastructure is set to be zero. City wide review and update of the previous RES/ICI allocations, or recommend an alternate approach to be utilized was undertaken and presented to Council on October 30, 2012.
The final recommended RES/ICI split was 69.3% (RES) / 11.0% (Industrial) / 11.3% (Commercial) / 8.4% (Institutional).
This allocation was globally applied to the Growth share of all Major Roadworks, Two Lane Arterial Upgrades and Minor Roadworks tables, studies and programs.
5.2 Post Period Benefit Considerations
The basis of calculating a Post Period Benefit is to determine what, if any, capacity built within the DC period is additional capacity that a later growth population would consume.
Major Roadworks
Post Period Benefit was determined with the consideration of the recommended timing of the project relative to the planning period for the DC Background Study In general, the following table values were applied as a minimum

AECOM The Corporation of the City of London 2014 Transportation Development Charge Background Study
Executive Summary
2014 Trans DC Executive Summary - 05-28-2014.Docx 12
with some individual projects receiving a higher PPB. Specifically, several projects outside the built out City have been provided up to a 50% PPB based on the expected utilization during the 20-year period on a project specific basis. The total PPB identified in the Major Roadworks is approximately $199.5 Million.
Project Timing PPB%
0-5 10%
5-10 20%
10-15 30%
15-20 45%
Rapid Transit
The London 2030 TMP and the BRT business case ran model scenarios to determine the headway that would be required to meet Growth needs. In 2030, headways would be at 5 minutes on the North-South corridors of the RT and 4 minutes of the East-West corridors. Typical average headways would be 15 minutes system wide at the RT start up. Maximum headway or maximum typical capacity is 2.5 minutes. These headways result in a PPB of 20% for the North-South corridor and 12% for the East-West corridor.
Two Lane Arterial Upgrades
Network needs may require the placement of infrastructure outside of the UGB. Analogous to other services, the City’s Global Service needs may have placed or routed in a manner that they are built on the edge outside of the UGB. In these cases, it’s appropriate to credit the “Local PPB Needs” of secondary road connections.
The improvements of intersections on roads that lay on or near the urban growth boundary can lead to the improvement of intersection legs at or near future residential or commercial entrances. These developments will occur in the future but economies of scale suggest overall savings in constructing them now. The value of these legs has been identified as the PPB with a total of $4.8 Million.
Minor Roadworks
The immediate nature of development responding to growth and the immediate nature of need for supporting infrastructure, coupled with the relatively low cost of each individual item makes estimation of Post Period Benefit to be extremely difficult as it is so small. This is negligible because the works are typically responding directly to development needs.
5.3 Level of Service
The Development Charges Act requires that the future level of service created by the infrastructure capacity improvement program that generated development charges does not exceed the average level of service that has been provided in the previous ten year period. Both the quantity and quality of a service shall be taken into account in determining the level of service and the average level of service. In determining the quantity of a service, the lane kilometer per capita method is typically used. The average lane kilometers per 1000 population is determined over the past 10 years (2004-2013), and compared to the predicted lane kilometer per 1000 population for the last year of the current study (2033). The future level of service shall not exceed the average level of service from the past 10 years.

AECOM The Corporation of the City of London 2014 Transportation Development Charge Background Study
Executive Summary
2014 Trans DC Executive Summary - 05-28-2014.Docx 13
In 2033, the anticipated lane kilometers of arterial roads will be 1421.4 km with a population of 442,569, resulting in a Lane km per capita of 3.21, which is lower than the average Lane km per capita of the past 10 years of 3.47. In determining the quality of a service, the replacement cost of municipal capital works, exclusive of any allowance for depreciation, shall be the amount used. In 2033, the anticipated replacement value of arterial roads will be $646,763,161 with a population of 442,569, resulting in a ratio of 1461.38, which is lower than the average of the past 10 years of 1578.51.
6. Conclusions and Recommendations
The following conclusions have been reached and recommendations made as a result of our work in completing the Transportation Development Charge Background Study.
6.1 Conclusions
The key conclusions reached through work completion are as follows:
The size of the transportation program is a function of the growth levels in the City since completion of the 2009 Background Study and the needs to reinforce expensive spines of the network; the City not keeping pace with the required arterial capacity improvements, and the additional projects added based on population growth forecasts.
The Rapid Transit projects reduce DC cost by expanding road capacity more efficiently and leveraging senior government funding.
All roadway unit cost items except noise wall were observed to increase since the last study was completed. This observation is consistent with province and industry-wide experiences supported by Stats Canada Indicators.
The application of a rehabilitation based approach for the calculation of Major Roadworks project for the BTE (Growth/Non-Growth) percentage, has resulted in similar Growth allocations as the last DC Study.
There is alignment between the Major Roadworks and two lane arterial upgrade projects listed in this study, with the GMIS and the City budget project listing will be adjusted to match the DC Background Study.
Cost containment strategies in the form of Post Period Benefit considerations, project phasing and staging have been implemented to reduce costs and develop a reasonable program.
The incorporation of phasing strategies that considered the relationship and timing of Major and Minor works on a given corridor, reduced the number of Minor Roadworks projects than would have otherwise been considered.
Staging of Major Roadwork projects has been implemented to reflect the likely progression of how a particular project will be constructed, based on existing and forecast needs within a corridor. Staging of works will also assist with the strategic investment of both Growth and Non-Growth dollars over time.
6.2 Recommendations
Based on the above conclusions, the following recommendations are made:
The Growth costs identified in the study form the basis for the DC rate determination.
The City should consider a series of internal and external educational sessions to present the new cost sharing principles for local services.
AECOM The Corporation of the City of London 2014 Transportation Development Charge Background Study
Executive Summary
2014 Trans DC Executive Summary - 05-28-2014.Docx 14
The 2014 budget and forecast should be based on the results of this study with project budgets to be refined as more information becomes available through completion of environmental assessments, preliminary and detailed design, and inflation tracking.
The DC By-law will need to be revised to reflect the cost sharing principles used to develop project costs provided in this study.
The City should keep appraised of the progression of new Development Charge related policies in other municipalities that set precedent in legislation.
Prepared by:
AECOM 410 – 250 York Street, Citi Plaza 519 673 0510 tel London, ON, Canada N6A 6K2 519 673 5975 fax www.aecom.com Project Number:
60275642 Date:
May 2014
The Corporation of the City of London
2014 Transportation Development Charge Background Study
AECOM The Corporation of the City of London 2014 Transportation Development ChargeBackground Study
AECOM: 2012-01-06 © 2009-2012 AECOM Canada Ltd. All Rights Reserved. 2014 Trans DC Final Report - 05-28-2014.Docx
Table of Contents Statement of Qualifications and Limitations
page
1. Introduction ..................................................................................................................................... 5
1.1 Project Requirements .......................................................................................................................... 6 1.2 Context................................................................................................................................................. 6 1.3 Current Transportation Roadworks Components in the City of London .............................................. 8 1.4 Service Level and Design Criteria ....................................................................................................... 8 1.5 Policy Considerations .......................................................................................................................... 8 1.6 Service Period and/or Area Confirmation ............................................................................................ 9 1.7 Works Basis ......................................................................................................................................... 9 1.8 Major Roadworks Modeling Outputs ................................................................................................. 10 1.9 Affordability ........................................................................................................................................ 10
2. Costing of Works .......................................................................................................................... 10
2.1 Major Roadworks ............................................................................................................................... 11 2.1.1 Intersections ......................................................................................................................... 11
2.2 Two Lane Arterial Upgrades .............................................................................................................. 13 2.3 Minor Roadworks ............................................................................................................................... 13
2.3.1 Traffic Signals ....................................................................................................................... 13 2.3.2 Channelization ...................................................................................................................... 13 2.3.3 Roundabouts ........................................................................................................................ 13 2.3.4 Sidewalk ............................................................................................................................... 14 2.3.5 Street Lights .......................................................................................................................... 14
2.4 Programs ........................................................................................................................................... 14 2.4.1 Urban Intersections (Traffic Signals and Street Lights) ........................................................ 14 2.4.2 Rural Intersections ................................................................................................................ 14 2.4.3 Active Transportation ............................................................................................................ 15 2.4.4 Advance Purchase of Land .................................................................................................. 15 2.4.5 Road Class Oversizing/ City Share ...................................................................................... 15
3. Rapid Transit System Costs and Alternatives ........................................................................... 15
4. The Southwest London Area Plan ............................................................................................... 16
5. Highway 401 Interchanges ........................................................................................................... 16
6. Discussion for Expansion of the Urban Growth Boundary ...................................................... 16
7. Development Charge Implications .............................................................................................. 16
7.1 Benefit to Existing (Growth/Non-Growth) Determination ................................................................... 17 7.2 Post Period Benefit Considerations for Major Roadworks ................................................................ 18 7.3 Post Period Benefit Considerations for Rapid Transit ....................................................................... 18 7.4 Post Period Benefit Considerations for Two Lane Arterial Upgrades ............................................... 19 7.5 Post Period Benefit Considerations for Minor Roadworks ................................................................ 19 7.6 Level of Service ................................................................................................................................. 19 7.7 Operating Cost ................................................................................................................................... 21
8. Conclusions and Recommendations .......................................................................................... 21
8.1 Conclusions ....................................................................................................................................... 21 8.2 Recommendations ............................................................................................................................. 21

AECOM The Corporation of the City of London 2014 Transportation Development ChargeBackground Study
AECOM: 2012-01-06 © 2009-2012 AECOM Canada Ltd. All Rights Reserved. 2014 Trans DC Final Report - 05-28-2014.Docx
Appendices Appendix A – Local Servicing Policy Appendix B – Strategic Priorities & Policy Report Appendix C – Minor Roadworks Table List of Figures Figure 1 – Typical Roadway Sections Figure 2 – Major Transportation Roadworks Figure 3 – Representative Channelization List of Tables Table 1 – Major Roadway Construction Costs Table 2 – Future Major Transportation Roadworks Table 3 – Intersection Improvements Table 4 – Future Roadworks – Two Lane Arterial Upgrades Table 5 – Post Period Benefit for Two Lane Arterial Upgrades
AECOM The Corporation of the City of London 2014 Transportation Development ChargeBackground Study
AECOM: 2012-01-06 © 2009-2012 AECOM Canada Ltd. All Rights Reserved. 2014 Trans DC Final Report - 05-28-2014.Docx
Statement of Qualifications and Limitations The attached Report (the “Report”) has been prepared by AECOM Canada Ltd. (“Consultant”) for the benefit of the client (City of London“) in accordance with the agreement between Consultant and Client, including the scope of work detailed therein (the “Agreement”). The information, data, recommendations and conclusions contained in the Report (collectively, the “Information”):
is subject to the scope, schedule, and other constraints and limitations in the Agreement and the qualifications contained in the Report (the “Limitations”);
represents Consultant’s professional judgement in light of the Limitations and industry standards for the preparation of similar reports;
may be based on information provided to Consultant which has not been independently verified; has not been updated since the date of issuance of the Report and its accuracy is limited to the time period and
circumstances in which it was collected, processed, made or issued; must be read as a whole and sections thereof should not be read out of such context; was prepared for the specific purposes described in the Report and the Agreement; and in the case of subsurface, environmental or geotechnical conditions, may be based on limited testing and on the
assumption that such conditions are uniform and not variable either geographically or over time. Consultant shall be entitled to rely upon the accuracy and completeness of information that was provided to it and has no obligation to update such information. Consultant accepts no responsibility for any events or circumstances that may have occurred since the date on which the Report was prepared and, in the case of subsurface, environmental or geotechnical conditions, is not responsible for any variability in such conditions, geographically or over time. Consultant agrees that the Report represents its professional judgement as described above and that the Information has been prepared for the specific purpose and use described in the Report and the Agreement, but Consultant makes no other representations, or any guarantees or warranties whatsoever, whether express or implied, with respect to the Report, the Information or any part thereof. Without in any way limiting the generality of the foregoing, any estimates or opinions regarding probable construction costs or construction schedule provided by Consultant represent Consultant’s professional judgement in light of its experience and the knowledge and information available to it at the time of preparation. Since Consultant has no control over market or economic conditions, prices for construction labour, equipment or materials or bidding procedures, Consultant, its directors, officers and employees are not able to, nor do they, make any representations, warranties or guarantees whatsoever, whether express or implied, with respect to such estimates or opinions, or their variance from actual construction costs or schedules, and accept no responsibility for any loss or damage arising therefrom or in any way related thereto. Persons relying on such estimates or opinions do so at their own risk. Except (1) as agreed to in writing by Consultant and Client; (2) as required by-law; or (3) to the extent used by governmental reviewing agencies for the purpose of obtaining permits or approvals, the Report and the Information may be used and relied upon only by Client. Consultant accepts no responsibility, and denies any liability whatsoever, to parties other than Client who may obtain access to the Report or the Information for any injury, loss or damage suffered by such parties arising from their use of, reliance upon, or decisions or actions based on the Report or any of the Information (“improper use of the Report”), except to the extent those parties have obtained the prior written consent of Consultant to use and rely upon the Report and the Information. Any injury, loss or damages arising from improper use of the Report shall be borne by the party making such use. This Statement of Qualifications and Limitations is attached to and forms part of the Report and any use of the Report is subject to the terms hereof.
AECOM The Corporation of the City of London 2014 Transportation Development Charge Background Study
2014 Trans DC Final Report - 05-28-2014.Docx 5
1. Introduction
AECOM was retained by the City of London (City) to undertake an update to the Transportation Development Charge Background Study (DC). The primary goal of the study was to identify, prioritize and calculate the cost of transportation works required over a 20 year planning horizon, including an assessment of works that are attributable to Growth. The outputs of this Background Study will be used by the City to calculate the portion of development charge rates attributable to transportation works for urban land development in the City of London.
For the purposes of this study, transportation related undertakings are classified into three broad categories namely Major Roadworks, Minor Roadworks and Programs. Major Roadworks generally include widening or extension of arterial roadworks and freeways, Minor Roadworks generally refer to and include smaller capital works associated with one or more specific developments and Programs represented by example studies and undertakings that are justified by spending of capital at various locations across the whole city.
Planning for Major Roadworks is undertaken through a master planning process, with the City’s most recent Transportation Master Plan (London 2030 TMP) being completed in 2013. An objective of the update was to identify the Major Roadworks needed to meet 20 year growth requirements. The outputs of this work, completed in February, 2014, include:
the identification of required Major Roadworks;
their prioritization over a 20 year growth period;
related costs for construction of the recommended improvements; and
implementation of programs, studies and new initiatives.
In contrast to Major Roadworks, Minor Roadworks have traditionally been defined as:
traffic signalization;
minor intersection improvements and channelization;
sidewalk and/or street lighting elements; and
the oversizing of Local and Secondary Collector roads to Primary Collector and Arterial Road status.
These works are driven by existing and future development within the City’s Urban Growth Boundary (UGB) as defined by the City’s Growth Management Implementation Strategy (GMIS). GMIS is a Council directed initiative to complement the Official Plan and assist with co-ordination and staging of infrastructure works and development approvals in the City. The preliminary outputs of the 2014 GMIS (March 2014) were incorporated into this Background Study.
Related Benefit to Existing (BTE) (Growth/Non-Growth) allocations for both the Major and Minor Roadworks components have been identified, along with Growth allocations to Residential (RES), Institutional, Commercial and Industrial (ICI). In addition, policy decisions have been made by the City in consultation with stakeholders from the development industry and members of the public to define “Local Services”. (See Appendix A Local Servicing Policy). Engaging and consulting the public and key stakeholders has been a critical part of the DC Background Study work. During the course of the study, several meetings were held and the minutes from those meetings can be found in Volume 2: DC Technical Meeting Proceedings.
AECOM The Corporation of the City of London 2014 Transportation Development Charge Background Study
2014 Trans DC Final Report - 05-28-2014.Docx 6
Once the scope, cost, Growth share and funding source were determined, the City would use the outputs of this Background Study to calculate the cost recovery Development Charge attributable to Transportation Works and update the DC By-Law.
1.1 Project Requirements
Our assignment for this study was to provide engineering services for completion of the following tasks.
The identification of currently planned Major and Minor Roadworks in the City for the next 20 years, or for a defined service area as per the City’s GMIS based on existing community plan, draft plan, plan of subdivision, site plan, Environmental Assessment report or other available information, all as provided by the City.
The identification of representative channelization and traffic signal needs for right, left or center turn lane application for development specific or development area planning purposes.
The incorporation of development charge eligible studies and programs.
To determine typical Minor Roadworks needs and related servicing costs, and Major Roadworks construction, utility, engineering, contingency and land related costs, based on existing and/or future planning information.
Integrate outputs from the London 2030 TMP and the modeling outputs of our work applicable to Major Roadworks requirements and application.
To update cost information for all Major and Minor Roadworks identified to 2014 dollars, using appropriate unit costs and cost indexes.
To remove redundancies between Major and Minor Roadworks components.
Determination of BTE (Growth/Non-Growth) related components and residential, institution, commercial and industrial allocations.
The identification of those components to be included in the CSRF DC Rate, the UWRF DC Rate or those considered to be a development responsibility, in accordance with new cost sharing rules as provided by the City.
On-going co-ordination with the City’s EESD, Planning and Finance personnel.
Address peer review comments from the previous DC background work; incorporate outputs from more recently completed works and/or community plans; ensure consistency with the City’s Water, Stormwater Drainage/SWM and Sanitary DC Updates (2009), and support/assist in development of the City’s GMIS.
1.2 Context
The London 2030 TMP project provided the City of London with a vision and implementation plan to proactively respond to the way the City’s future population move, live, work, and play. This TMP was all encompassing and has embraced current provincial initiatives, sound engineering, financial prudence, and emergent planning principles that are shaping municipal growth across Ontario. Embracing the TMP enabled the City to adjust to major societal shifts that have been long predicted by major economists, demographers, scholars, and politicians. This shift included a movement away from an automobile focused society with an economy based on industrial production, to a different knowledge and service based economy that integrates all City functions into smaller activity nodes. This is a phenomenon that is fast becoming a reality for all North American population centres. The cost of following the previous century’s growth model is increasingly becoming unsustainable. This obsolete model based on outward peripheral expansion is swiftly being replaced by nodal redevelopment within the existing developed areas of cities.
AECOM The Corporation of the City of London 2014 Transportation Development Charge Background Study
2014 Trans DC Final Report - 05-28-2014.Docx 7
The change from the old development patterns to the new is being influenced by factors outside of individual City’s control, such as:
shifting employment demands; family size; population growth; immigration; lifestyle choices; attitudes towards the automobile; increasing legislation identifying and protecting susceptible environments; and increasing servicing costs for water, sewer, and road projects.
These factors contribute to pressure for redevelopment and intensification of existing developed land. Continuing to facilitate the previous patterns of outward growth will become ever increasingly difficult, expensive, and environmentally challenging, while also using valuable time and effort that could be marshalled and focused on facilitating oncoming changes. The City can best transition itself into a successful urban centre that attracts new and vibrant growth through acceptance and preparation for the consequences of these oncoming changes. The construction of rapid transit (RT) will minimize future capital outlay until a time that it is absolutely necessary or financially advantageous to invest, target future senior government programs, allow for local private developments to proceed with their projects confidently, reform London Transit Commission bus routing to compliment the rapid transit, and launch transportation demand management programs and advertising campaigns to target the population with the news about the success of the project. This will build ridership with service and ensure targets are met in a financially wise manner. The TMP identified the major capital needs required for the immediate, interim, and long-term transportation needs of the City, the policy required to support a sustainable transportation system, the other emergent programs required to support the shift from the automobile based transportation system, and estimates for both capital and operational costs. As such, the TMP was based upon the following assumptions:
A growth rate of 1% utilized as a conservative baseline.
A growth rate of 2% be the corporate target.
Transportation goals, land use, development intensification and urban form be aligned and a minimum of 40% intensification to be adapted in the official plan.
Note that the 1% model was used for DC purposes which aligns with the Altus Growth projection.
The allocation of this 40% intensification around the existing built City is expected to occur in “Intensification Nodes” and be directed toward downtown and rapid transit villages as mentioned in the London 2030 TMP.
As the City transitions from the previous century’s growth model to the new nodal redevelopment model, growth in green field locations is expected to continue with the completion of subdivisions and site plans in lands in the north of the city, along the Sunningdale Road corridor and the opening up of the southwest as per the Southwest Area Plan (secondary plan). Additionally, growth in general requires the strengthening of existing and the placement of new arterial and collector roads, with interchange improvements on Highway 401/ Veteran Memorial Parkway and other strategic links.

AECOM The Corporation of the City of London 2014 Transportation Development Charge Background Study
2014 Trans DC Final Report - 05-28-2014.Docx 8
1.3 Current Transportation Roadworks Components in the City of London
The City of London’s roadway network currently consists of the following:
22 lane kilometers of Freeways;
39 lane kilometers of Expressways;
1264 lane kilometers of Arterial Roadways;
135 lane kilometers of Primary Collector Roadways;
507 lane kilometers of Secondary Collector Roadways;
1750 lane kilometers of Local Roadways;
101 Bridges; and
162 other structures (culvert crossings, retaining and noise walls, pedestrian bridges and/or tunnels).
1.4 Service Level and Design Criteria
The City’s roadway capacity status for Major Roadworks is shown in the London 2030 TMP. These works were considered to be triggered when the level of service was equal to or below an LOS F in the PM peak hour across screenlines which was set as the minimum acceptable service level. This is a change from the 2009 TMP Update, which used a minimum service level of LOS E.
The design criteria utilized for Major Transportation Roadworks, intersection signalization and/or channelization, bike lanes, sidewalks, roadway illumination and related traffic planning is based on a number of different sources. These include:
City of London Design Specifications and Requirements Manual;
Ontario Provincial Standards and Specifications;
Ministry of Transportation Ontario criteria;
Roads and Transportation Association of Canada criteria;
The Ontario Traffic Manual; and
Institute of Transportation Engineers criteria.
The need for Minor Roadwork components is driven almost exclusively by development applications that impact arterial and primary collector roadways. In some instances Minor Roadworks would be applied as needed based on a transportation impact analysis on a project-by-project or development-by-development perspective.
Depending on the nature of the work involved, any or all of the above criteria is utilized for the planning, design and implementation of transportation related works.
1.5 Policy Considerations
The City provided the following direction with respect to revisions to rules governing local servicing definitions, funding sources and growth allocations, consistent with the February 25, 2013 Report to the Committee of the Whole.
AECOM The Corporation of the City of London 2014 Transportation Development Charge Background Study
2014 Trans DC Final Report - 05-28-2014.Docx 9
Minor Roadworks
Traffic Signals on arterial and primary collector roads are CSRF eligible.
Upgrading of two lane arterials is CSRF eligible.
Channelization associated with arterial to arterial connections is CSRF eligible.
Channelization associated with collector or local roads connecting to an arterial road will remain eligible for CSRF funding.
Miscellaneous Minor Roadworks (street lighting and sidewalks) are CSRF eligible.
All Minor Roadworks listed were considered to be 100% attributable to Growth.
Major Roadworks
Costs for utility relocation, noise barrier walls, engineering, contingency and land acquisition costs were considered to be 100% attributable to Growth.
BTE (Growth/Non-Growth) allocations would be determined both at the project level and globally for all of the Major Roadworks, using a roadway rehabilitation approach.
Where a new arterial or primary collector road is to be constructed, in whole or in part, through a subdivision, the developer is responsible for the cost of constructing a standard secondary collector road 10.1 m (gutter to gutter, using OPSD 600.04). The typical cross-section shown in Figure 1 may be amended by an Environmental Assessment or Draft Plan or other Subdivision Agreement. If the required road is wider or at a higher standard, the developer is responsible for the cost of a standard road, including sidewalks, street lights, etc., and may make a claim to the CSRF or UWRF for the difference in cost between a standard road and the road actually constructed. The construction responsibilities shall be defined by the conditions of an agreement between the City and the developer. If the developer wishes to construct the road at an enhanced standard beyond that acceptable to the City Engineer, then the developer shall pay for the additional costs of enhancement with no eligibility for a claim from any fund.
1.6 Service Period and/or Area Confirmation
The City of London developed future population growth information for the period from 2014 to 2033 in 5 year increments (2018, 2023, 2028, and 2033).
1. Based on work developed by Altus. 2. Details, growths, allocations in individual traffic zones were created by the City and provided to AECOM in
March 2013. 3. The City’s population growth information, with related amendments for net and gross populations included in
the digital information provided by the City to AECOM in March, 2013. This information, in addition to later updates, formed the basis for the planning work completed for all services.
1.7 Works Basis
The work undertaken as part of this study used the previous DC Study project list as the basis with projects completed between 2009 and 2013 deleted from the list. Modeling of future transportation needs as per the growth information provided by the City, having regard for Altus growth forecast study to confirm 2014 to 2033 needs consistent with the London 2030 TMP.
The basis for the work to be completed for this study was for the City of London to provide through previous: UWRF claims; community plans; subdivision plans; draft plans; studies; or other information sources; details to identify

AECOM The Corporation of the City of London 2014 Transportation Development Charge Background Study
2014 Trans DC Final Report - 05-28-2014.Docx 10
those Minor Roadworks components (traffic signalization, channelization, sidewalks, street lighting), and the two lane arterial upgrades required, or proposed to be completed to service 20 year growth requirements as per the GMIS. Any available cost and/or location information was to be included if directly relevant and in sufficient detail to support overall work cost and DC Rate determination. In addition, the London 2030 TMP outputs were to be used to identify those Major Roadworks required to meet 20 year growth requirements, with completed works removed.
1.8 Major Roadworks Modeling Outputs
For each horizon year, model results were summarized on a screenline basis, and were compared to available capacity to determine if improvements were required. A deficiency was identified for any screenline where the ratio of volume to capacity was equal to or greater than 1.0 (LOS F) in the PM peak hour which means that the roadway is operating at 100% of its capacity. This is generally accepted as the threshold where improvements would be implemented in most urban municipalities.
The selection of recommended projects to address the deficiency was generally based on the recommended future improvements from the London 2030 TMP. The model was updated to include the recommended improvements for each deficiency and a new run was completed to determine if those improvements solved the problem. Since some improvements worked better than others in terms of addressing screenline deficiencies, an iterative process was used to determine the optimum set of improvements for each horizon year. Essentially, this work established an optimized implementation plan for the TMP projects based on 5 year increments of growth.
1.9 Affordability
The project list created for improvement of deficiencies in the network was examined further to optimize the list for affordability. A number of proposed roadworks projects in the 10-15 and 15-20 year increment were identified as the most acceptable projects to be deferred beyond the 20 year period. This deferral resulted in a reduction of $115 Million from the project list and was summarized in Strategic Priorities and Policy Committee Meeting on February 20, 2014, shown in Appendix B.
2. Costing of Works
Major Roadworks
Each Major Roadwork project was considered to consist of some or all of the following components.
Base cost per metre for the roadway construction cost based on the improvement (e.g., Two Lane Rural Arterial [2 LRA] to 5 Lane Urban Arterial [5 LUA] widening).
Cost per square metre for structures to be widened or replaced unless more detailed information from environmental assessment materials and/or preliminary design data was available.
Cost per metre of noise barrier wall required.
Cost for land acquisition per metre (raw land cost, on-site alterations, appraisals, surveying, and legal).
Any complicated costs associated with railway diversions, bridges, Environmentally Sensitive Areas, large known utilities (high tension hydro towers), etc.
Each Major Roadworks project was assigned a utility relocation cost equal to 10% of the Net Roadway Construction Cost, and engineering and contingency costs equal to 15% and 10% of the Total Construction Cost, respectively.
Proposed unit costs for roadway construction, structures, and noise barrier walls are provided in 2014 dollars and were developed based either on pricing obtained on previous projects or recent cost estimates, with adjustments for

AECOM The Corporation of the City of London 2014 Transportation Development Charge Background Study
2014 Trans DC Final Report - 05-28-2014.Docx 11
annual construction cost escalation. The unit costs are provided in Table 1. A preliminary analysis of each project was undertaken by AECOM with preparation of base plan, draft alternative alignments and identification of complicated issues for drainage, traffic control, property acquisitions and major utilities.
Two Lane Arterial Roadway Upgrades
Proposed unit costs per metre for two lane arterial roadway upgrades are provided in 2014 dollars and were derived by taking the unit costs from the previous Transportation DC Study and adjusting them for annual construction cost escalation. The proposed unit costs were back checked against recent tender information to confirm their validity.
Minor Roadworks Components
The proposed unit costs for traffic signals, channelization, sidewalks and street lighting are provided in 2014 dollars and were derived by taking the unit costs from the previous Transportation DC Study and adjusting them for annual construction cost escalation. Proposed costs were back checked against recent tender information when available to confirm their validity.
Program Components
Proposed costs of programs are taken from known budget spending and related trends in tenders.
2.1 Major Roadworks
Future Major Transportation Roadworks to service growth for a 20 year period to 2033 are identified in Table 2.
The City’s GMIS will be co-ordinated with the new DC project schedules.
All of the recommended Major Transportation Roadworks are shown on Figure 2. The costs identified take into account any portions of each roadway section already widened at intersections. The total cost of Major Transportation Roadworks is $648.4 Million with Post Period Benefit of $199.5 Million and a 20 Year Cost amount of $448.9 Million, a net DC recoverable amount of $363.5 Million and a net Non-Growth cost of $85.4 Million.
2.1.1 Intersections
The construction of intersections first is a standard methodology to phase large transportation project’s cost over a timeline that is both financially responsible and technically preferable. This results in the construction of needed infrastructure in a time period when it is justified without incurring costs of temporary works or front ending construction costs before they are absolutely needed, prolonging service life and reducing operational costs. AECOM and City of London Transportation staff reviewed current development plans in various degrees of completion to predict future and current operational improvements. The projects listed below in Table 3 present several challenges and intricacies that will likely need co-ordination of other City servicing infrastructure and utility relocations have to be considered along with the construction of phased or interim roadworks. These intersections are funded through the CSRF as per City of London Policy, with some intersections included in Table 2 as part of larger projects.
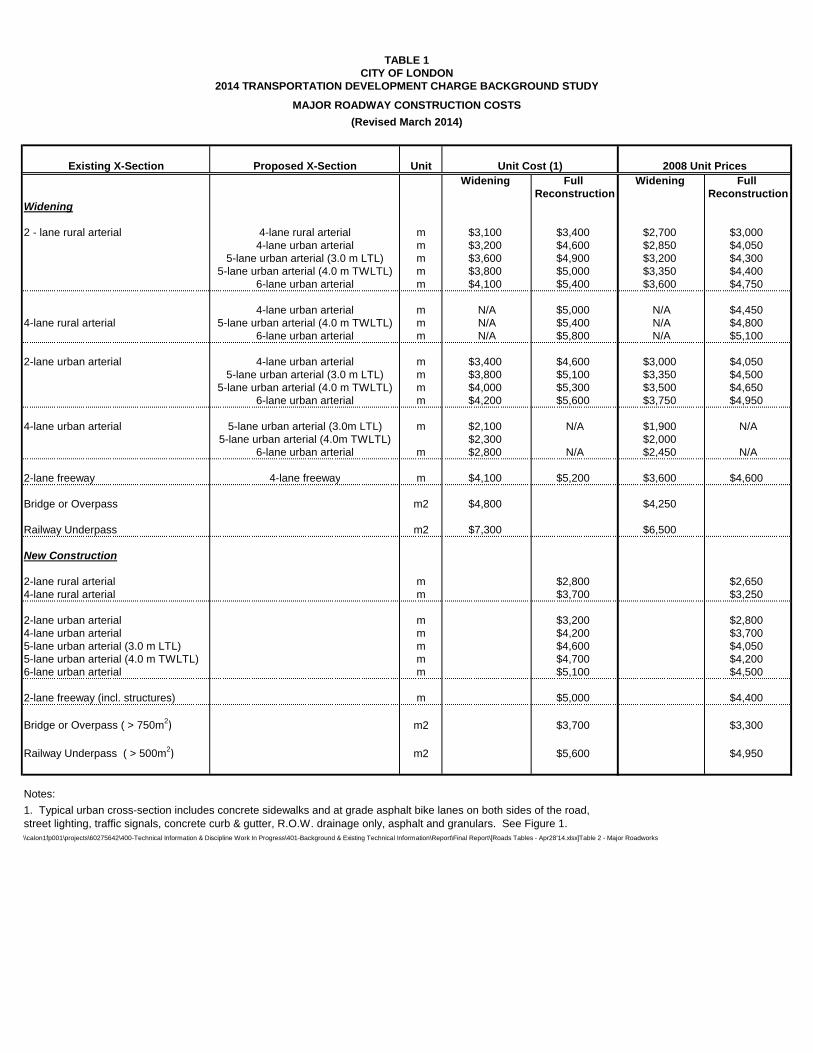
Existing X-Section Proposed X-Section UnitWidening Full Widening Full
Reconstruction ReconstructionWidening
2 - lane rural arterial 4-lane rural arterial m $3,100 $3,400 $2,700 $3,0004-lane urban arterial m $3,200 $4,600 $2,850 $4,050
5-lane urban arterial (3.0 m LTL) m $3,600 $4,900 $3,200 $4,3005-lane urban arterial (4.0 m TWLTL) m $3,800 $5,000 $3,350 $4,400
6-lane urban arterial m $4,100 $5,400 $3,600 $4,750
4-lane urban arterial m N/A $5,000 N/A $4,4504-lane rural arterial 5-lane urban arterial (4.0 m TWLTL) m N/A $5,400 N/A $4,800
6-lane urban arterial m N/A $5,800 N/A $5,100
2-lane urban arterial 4-lane urban arterial m $3,400 $4,600 $3,000 $4,0505-lane urban arterial (3.0 m LTL) m $3,800 $5,100 $3,350 $4,500
5-lane urban arterial (4.0 m TWLTL) m $4,000 $5,300 $3,500 $4,6506-lane urban arterial m $4,200 $5,600 $3,750 $4,950
4-lane urban arterial 5-lane urban arterial (3.0m LTL) m $2,100 N/A $1,900 N/A5-lane urban arterial (4.0m TWLTL) $2,300 $2,000
6-lane urban arterial m $2,800 N/A $2,450 N/A
2-lane freeway 4-lane freeway m $4,100 $5,200 $3,600 $4,600
Bridge or Overpass m2 $4,800 $4,250
Railway Underpass m2 $7,300 $6,500
New Construction
2-lane rural arterial m $2,800 $2,6504-lane rural arterial m $3,700 $3,250
2-lane urban arterial m $3,200 $2,8004-lane urban arterial m $4,200 $3,7005-lane urban arterial (3.0 m LTL) m $4,600 $4,0505-lane urban arterial (4.0 m TWLTL) m $4,700 $4,2006-lane urban arterial m $5,100 $4,500
2-lane freeway (incl. structures) m $5,000 $4,400
Bridge or Overpass ( > 750m2) m2 $3,700 $3,300
Railway Underpass ( > 500m2) m2 $5,600 $4,950
Notes:
\\calon1fp001\projects\60275642\400-Technical Information & Discipline Work In Progress\401-Background & Existing Technical Information\Report\Final Report\[Roads Tables - Apr28'14.xlsx]Table 2 - Major Roadworks
1. Typical urban cross-section includes concrete sidewalks and at grade asphalt bike lanes on both sides of the road, street lighting, traffic signals, concrete curb & gutter, R.O.W. drainage only, asphalt and granulars. See Figure 1.
TABLE 1CITY OF LONDON
2014 TRANSPORTATION DEVELOPMENT CHARGE BACKGROUND STUDY
MAJOR ROADWAY CONSTRUCTION COSTS
(Revised March 2014)
Unit Cost (1) 2008 Unit Prices

DC Project Number
Project Number 2009 DC Ref # Road Name Limits Improvement City ID Recommended YearSegment Length (1)
Roadway Construction Cost
(per/m)
Roadway Construction Cost
Interim SWMNet Roadway
Construction CostArea of New/Widened
Structures (m2) (3)Structures Cost (per/m2)
(2)Structures
Construction Cost Length of Noise Wall
(m) (4)
Noise Wall Construction Cost
(per/m)
Noise Wall Construction Cost
Total Construction Cost
Utility Relocation 10% (6)
Engineering 15% (7) Contingencies 10% (8)Grand Total
Construction CostOn-site Alterations
Appraisals, Legal, Survey
Raw LandLand Acquisition
CostComplexity Note Railroad Payment Total Non-Growth % Non-Growth $ Growth % Growth $
Residential (69.3%)
Industrial (11.0%)
Institutional (8.4%)
Commercial (11.3%)
Deduction (%)Deduction ($)
(20)
DC14-RS00001 11a 3.4(i) Hyde Park Road Oxford to CPR 2 to 4 through lanes TS1477-1 2014 2200 $4,355 $7,710,000 $450,000 $8,160,000 575 $5,200 $4,200,000 $0 $1,003,000 $13,363,000 $450,000 $2,650,000 $1,500,000 $21,950,000 $0 $600,000 $430,000CNR flagging, SWM and
intersection$0 $22,980,000 5% $1,075,800 95% $21,904,200 $15,179,611 $2,409,462 $1,839,953 $2,475,175 10% $2,298,000
DC14-RS00002 12 (1a) 3.6(ii) Sunningdale RoadStage 1 - Phase 1 -
Wonderland/Sunningdale Intersection
2 to 4 through lanes TS1496 2014 460 $5,217 $2,400,000 $2,400,000 0 $0 $0 $0 $2,400,000 $240,000 $396,000 $264,000 $3,300,000 $0 $0 $0 $0 $3,300,000 7% $224,940 93% $3,075,060 $2,131,017 $338,257 $258,305 $347,48240% $1,320,000
DC14-RS00003 5 Wonderland Interchange Highway 401 Interchange 2015 $0 $0 1450 $4,000 $5,800,000 $0 $10,450,000 $0 $0 $0 $10,450,000 $10,450,000 0% $0 100% $10,450,000 $7,241,850 $1,149,500 $877,800 $1,180,850 50% $5,225,000
DC14-RS00004 2 1.5 Commissioners RoadWonderland Road to Viscount
Road2 to 4 through lanes with
centre turn laneTS1470 2015 1800 $4,600 $8,280,000 $8,280,000 0 $0 $0 350 $1,200 $420,000 $8,700,000 $900,000 $1,006,000 $955,000 $11,561,000 $2,241,000 $2,241,000 $13,802,000 6% $880,200 94% $12,921,800 $8,954,807 $1,421,398 $1,085,431 $1,460,163 10% $1,380,200
DC14-RS00005 39 3.7 Hyde Park Road CPR to Fanshawe Park Road 2 to 4 through lanes TS1477-2 2015 2200 $4,600 $10,120,000 $300,000 $10,420,000 $0 300 $1,200 $360,000 $10,780,000 $900,000 $1,700,000 $955,500 $14,335,500 $1,250,000 $1,250,000 $15,585,500 7% $1,075,800 93% $14,509,700 $10,055,222 $1,596,067 $1,218,815 $1,639,596 10% $1,558,550
DC14-RS00007 6a 2.4 Fanshawe Park RoadAdelaide Street to Highbury
Avenue2 to 4 through lanes with
centre turn laneTS1475 2016 2000 $3,581 $7,162,300 $320,000 $7,482,300 0 $0 $0 1200 $1,200 $1,440,000 $8,922,300 $850,000 $1,323,000 $1,044,700 $12,140,000 $1,150,000 $1,150,000 $1,020,000 $3,320,000 $15,460,000 6% $978,000 94% $14,482,000 $10,036,026 $1,593,020 $1,216,488 $1,636,466 10% $1,546,000
DC14-RS00008 8 2.7 Sarnia RoadWonderland Road to
Sleightholme Ave3 to 4 through lanes TS1484 2016 850 $4,671 $3,970,000 $3,970,000 0 $0 $0 1400 $1,200 $1,680,000 $5,650,000 $360,000 $1,000,000 $690,000 $7,700,000 $662,000 $662,000 $8,362,000 7% $623,900 93% $7,738,100 $5,362,503 $851,191 $650,000 $874,405 10% $836,200
DC14-RS00010 28VMP Interchange &
ExtensionHighway 401 Interchange 2016 $0 $0 $0 $0 $0 $0 $0 $0 $6,148,000 $0 $6,148,000 46% $2,828,080 54% $3,319,920 $2,300,705 $365,191 $278,873 $375,151 10% $614,800
DC14-RS00076Intersection-
Western/SarinaIntersection 2017 $2,490,000 10% $249,000 90% $2,241,000 $1,553,013 $246,510 $188,244 $253,233 10% $249,000
DC14-RS00012 22b 4.5(ii)Bradley Avenue
ExtensionPhase 2 - Wharncliffe to
Wonderland4 through lanes TS1523 2017 1025 $4,200 $4,305,000 $4,305,000 900 $4,000 $3,600,000 $0 $7,905,000 $430,500 $1,250,325 $833,550 $10,419,375 $553,500 $553,500 $738,000 $1,845,000 $12,264,375 0% $0 100% $12,264,375 $8,499,212 $1,349,081 $1,030,208 $1,385,874 10% $1,226,438
DC14-RS00077Intersection-
Richmond/FanshaweIntersection 2018 $7,900,000 10% $790,000 90% $7,110,000 $4,927,230 $782,100 $597,240 $803,430 10% $790,000
DC14-RS00006 42 Highbury Interchange Highway 401 Interchange 2018 $0 $0 $0 $0 $0 $0 $0 $0 $5,000,000 $5,000,000 55% $2,750,000 45% $2,250,000 $1,559,250 $247,500 $189,000 $254,250 10% $500,000
DC14-RS00011 9 3.1 Western Road Platts Lane to Oxford Street2 to 4 through lanes, including widening rail
underpassTS1489 2018 950 $4,600 $4,370,000 $4,370,000 360 $16,500 $5,940,000 200 $1,200 $240,000 $10,550,000 $437,000 $1,648,050 $1,098,700 $13,733,750 $1,225,500 $1,225,500 $1,634,000 $4,085,000 $6,900,000
Complex Railroad Detour - land and impacts
$900,000 $23,818,750 18% $4,290,870 82% $19,527,880 $13,532,821 $2,148,067 $1,640,342 $2,206,65010% $2,381,875
DC14-RS00013Colonel Talbot
InterchangeHighway 401 Interchange 2018 $0 $0 $0 $0 $0 $0 $0 $0 $5,000,000 $5,000,000 50% $2,500,000 50% $2,500,000 $1,732,500 $275,000 $210,000 $282,500 10% $500,000
DC14-RS00009 19 4.1Veterans Memorial
ParkwayHuron Street to Clarke Road New 2 through lanes TS1621 2019 1850 $2,800 $5,180,000 $5,180,000 0 $0 $0 $0 $5,180,000 $518,000 $854,700 $569,800 $7,122,500 $1,500,000 $1,500,000 $2,000,000 $5,000,000 $12,122,500 7% $904,650 93% $11,217,850 $7,773,970 $1,233,964 $942,299 $1,267,617 10% $1,212,250
DC14-RS00075Intersection-
Highbury/HamiltonIntersection 2019 $2,315,000 10% $231,500 90% $2,083,500 $1,443,866 $229,185 $175,014 $235,436 10% $231,500
DC14-RS00014 36 Wharncliffe RoadHorton Street to
Commissioners RoadOptimization 2019 2200 $2,100 $4,620,000 $4,620,000 $0 $0 $4,620,000 $231,000 $727,650 $485,100 $6,063,750 $0 $500,000
Deep sewer work with abandoned culverts
$6,563,750 33% $2,153,800 67% $4,409,950 $3,056,095 $485,095 $370,436 $498,324 10% $656,375DC14-RS00015 11b 3.4 Hyde Park Road Oxford Intersection Intersection TS1477-1 2019 $1,600,000 $1,800,000 $0 $0 $1,800,000 $0 $250,000 $20,000 $2,070,000 $160,000 $160,000 $2,230,000 8% $178,400 92% $2,051,600 $1,421,759 $225,676 $172,334 $231,831 20% $446,000
DC14-RS00018 21 4.4 Wharncliffe RoadBecher Street to Springbank
Drive2 to 4 through lanes TS1355 2019 300 $3,400 $1,020,000 $1,020,000 360 $16,500 $5,940,000 $0 $6,960,000 $102,000 $1,059,300 $706,200 $8,827,500 $200,000 $200,000 $1,200,000 $1,600,000 $6,900,000 Complex Railroad Detour $900,000 $16,427,500 40% $6,566,700 60% $9,860,800 $6,833,534 $1,084,688 $828,307 $1,114,270 20% $3,285,500
DC14-RS00020 Pond Mills Road Hwy 401 Bridge Hwy 401 Bridge Expansion 2019 $0 $0 $0 $0 $0 $0 $0 $0 $1,500,000 $1,500,000 0% $0 100% $1,500,000 $1,039,500 $165,000 $126,000 $169,500 50% $750,000
DC14-RS00016 12 (1b) 3.6(i) Sunningdale RoadStage 1 - Phase 2 -
Richmond/Sunningdale Intersection
2 to 4 through lanes TS1496 2020 300 $4,600 $1,380,000 $1,380,000 0 $0 $0 $0 $1,380,000 $138,000 $227,700 $151,800 $1,897,500 $0 $0 $0 $0 $1,400,000Oil Pipeline. ($1.4M pipeline
relocation)$3,297,500 4% $146,700 96% $3,150,800 $2,183,504 $346,588 $264,667 $356,040
40% $1,319,000
DC14-RS00017 12 (2c) 3.6(iii) Sunningdale RoadStage 2 - Phase 3 - Richmond
to Wonderland2 to 4 through lanes TS1496 2020 2350 $4,374 $10,278,261 $10,278,261 500 $4,000 $3,700,000 $0 $13,978,261 $1,027,826 $2,250,913 $1,500,609 $18,757,609 $0 $0 $0 $0 $18,757,609 6% $1,149,150 94% $17,608,459 $12,202,662 $1,936,930 $1,479,111 $1,989,756 40% $7,503,043
DC14-RS00023 34a Wonderland RoadPhase 1 - Riverside to
Springbank4 to 6 through lanes 2020 1500 $2,800 $4,200,000 $4,200,000 2200 $5,200 $11,440,000 $0 $15,640,000 $210,000 $2,377,500 $1,585,000 $19,812,500 $0 $900,000 Complex bridge construction $20,712,500 7% $1,468,500 93% $19,244,000 $13,336,092 $2,116,840 $1,616,496 $2,174,572 20% $4,142,500
DC14-RS00019 41 4.2 Adelaide Street NorthGrenfell Drive to Sunningdale
Road2 to 4 through lanes 2021 1000 $3,200 $3,200,000 $440,000 $3,640,000 100 $4,000 $400,000 $0 $4,040,000 $364,000 $660,600 $440,400 $5,505,000 $50,000 $50,000 $50,000 $150,000 $5,655,000 9% $489,000 91% $5,166,000 $3,580,038 $568,260 $433,944 $583,758 50% $2,827,500
DC14-RS00025 26 3.5 Clarke RoadVMP Extension to Fanshawe
Park Road 2 to 4 through lanes TS1476 2021 1375 $3,100 $4,262,500 $4,262,500 2900 $5,200 $15,080,000 $0 $19,342,500 $426,250 $2,965,313 $1,976,875 $24,710,938 $0 $0 $0 $0 $24,710,938 3% $672,375 97% $24,038,563 $16,658,724 $2,644,242 $2,019,239 $2,716,358 30% $7,413,281
DC14-RS00033 12 (2b) 3.6(iv) Sunningdale RoadStage 2 - Phase 2 - Bluebell to
Richmond2 to 4 through lanes TS1496 2022 1150 $4,600 $5,290,000 $5,290,000 0 $0 $0 $0 $5,290,000 $529,000 $872,850 $581,900 $7,273,750 $0 $0 $0 $0 $7,273,750 8% $562,350 92% $6,711,400 $4,651,000 $738,254 $563,758 $758,388 40% $2,909,500
DC14-RS00022 22a 4.5(i)Bradley Avenue
ExtensionPhase 1 - Jalna to Wharncliffe 4 through lanes TS1523 2022 1400 $4,200 $5,880,000 $5,880,000 0 $0 $0 100 $1,200 $120,000 $6,000,000 $588,000 $988,200 $658,800 $8,235,000 $756,000 $756,000 $1,008,000 $2,520,000 $10,755,000 0% $0 100% $10,755,000 $7,453,215 $1,183,050 $903,420 $1,215,315 20% $2,151,000
DC14-RS00026 34b Wonderland RoadPhase 2 - Springbank to
Commissioners4 to 6 through lanes 2022 1100 $2,800 $3,080,000 $3,080,000 $0 200 $1,200 $240,000 $3,320,000 $154,000 $521,100 $347,400 $4,342,500 $0 $0 $4,342,500 25% $1,076,900 75% $3,265,600 $2,263,061 $359,216 $274,310 $369,013 20% $868,500
DC14-RS00030 29b 5.4 Southdale Road WestPhase 2 - Farnham to Pine
Valley2 to 4 through lanes with
centre turn laneTS1629 2022 600 $3,600 $2,160,000 $2,160,000 0 $0 $0 $0 $2,160,000 $216,000 $356,400 $237,600 $2,970,000 $54,000 $54,000 $72,000 $180,000 $3,150,000 9% $293,400 91% $2,856,600 $1,979,624 $314,226 $239,954 $322,796 20% $630,000
DC14-RS00028 15a 3.12(i) Wonderland Road Phase 1 - Riverside to Oxford 4 to 6 through lanes TS1348 2023 1000 $2,800 $2,800,000 $2,800,000 800 $7,900 $6,320,000 $0 $9,120,000 $140,000 $1,389,000 $926,000 $11,575,000 $612,000 $612,000 $816,000 $2,040,000 $6,900,000 Complex railroad detour $900,000 $19,615,000 45% $8,752,360 55% $10,862,640 $7,527,810 $1,194,890 $912,462 $1,227,478 20% $3,923,000
DC14-RS00027 10a 3.3(i) Bradley AvenuePhase 1 - Dearness to Pond
Mills2 to 4 through lanes TS1479 2024 2500 $3,200 $8,000,000 $8,000,000 0 $0 $0 1975 $1,200 $2,370,000 $10,370,000 $800,000 $1,675,500 $1,117,000 $13,962,500 $550,000 $550,000 $50,000 $1,150,000 $150,000 Hydro Tower $15,262,500 8% $1,222,500 92% $14,040,000 $9,729,720 $1,544,400 $1,179,360 $1,586,520 20% $3,052,500
DC14-RS00032 35a Wonderland Road Phase 1 - Exeter to Hwy 402 2 to 4 through lanes 2024 2000 $3,100 $6,200,000 $6,200,000 750 $5,200 $3,900,000 $0 $10,100,000 $620,000 $1,608,000 $1,072,000 $13,400,000 $0 $13,400,000 7% $978,000 93% $12,422,000 $8,608,446 $1,366,420 $1,043,448 $1,403,686 40% $5,360,000
DC14-RS00024 15b 3.12(ii) Wonderland Road Phase 2 - Oxford to Sarnia 4 to 6 through lanes TS1348 2025 1600 $2,800 $4,480,000 $4,480,000 460 $5,200 $2,392,000 $0 $6,872,000 $224,000 $1,064,400 $709,600 $8,870,000 $365,000 $365,000 $220,000 $950,000 $2,500,000Railway flagging.
Constructability. Approach fill material.
$12,320,000 13% $1,566,400 87% $10,753,600 $7,452,245 $1,182,896 $903,302 $1,215,15720% $2,464,000
DC14-RS00021 12 (2a) 3.6(iv) Sunningdale RoadStage 2 - Phase 1 - Adelaide to
Bluebell2 to 4 through lanes TS1496 2025 1100 $4,600 $5,060,000 $5,060,000 0 $0 $0 $0 $5,060,000 $506,000 $834,900 $556,600 $6,957,500 $0 $0 $0 $0 $4,000,000
Oil Pipeline relocation ($2M). Profile correction
($2M)$10,957,500 5% $537,900 95% $10,419,600 $7,220,783 $1,146,156 $875,246 $1,177,415
40% $4,383,000
DC14-RS00035 7 2.6 Huron Street Adelaide Street to Vesta Road 2 to 4 through lanes TS1478 2025 1800 $3,200 $5,760,000 $5,760,000 0 $0 $0 525 $1,200 $630,000 $6,390,000 $576,000 $1,044,900 $696,600 $8,707,500 $1,404,000 $1,404,000 $1,872,000 $4,680,000 $1,000,000Retaining wall in front of St.
Peter's$14,387,500 6% $880,200 94% $13,507,300 $9,360,559 $1,485,803 $1,134,613 $1,526,325 30% $4,316,250
DC14-RS00037 27 Huron Street Highbury to Clarke Road 2 to 4 through lanes 2026 2400 $3,200 $7,680,000 $7,680,000 $0 2000 $1,200 $2,400,000 $10,080,000 $768,000 $1,627,200 $1,084,800 $13,560,000 $800,000 $700,000 $100,000 $1,600,000 $15,160,000 8% $1,173,600 92% $13,986,400 $9,692,575 $1,538,504 $1,174,858 $1,580,463 30% $4,548,000
DC14-RS00038 29a 5.4 Southdale Road WestPhase 1 - Colonel Talbot to
Farnham2 to 4 through lanes with
centre turn laneTS1629 2026 2200 $3,600 $7,920,000 $1,360,000 $9,280,000 0 $0 $0 250 $1,200 $300,000 $9,580,000 $928,000 $1,576,200 $1,050,800 $13,135,000 $219,000 $219,000 $292,000 $730,000 $13,865,000 8% $1,075,800 92% $12,789,200 $8,862,916 $1,406,812 $1,074,293 $1,445,180 30% $4,159,500
DC14-RS00034 20 4.3 Wonderland Road NorthSunningdale Road to Fanshawe
Park Road2 to 4 through lanes TS1354 2027 1300 $4,600 $5,980,000 $5,980,000 0 $0 $0 200 $1,200 $240,000 $6,220,000 $598,000 $1,022,700 $681,800 $8,522,500 $400,000 $400,000 $500,000 $1,300,000 $9,822,500 6% $635,700 94% $9,186,800 $6,366,452 $1,010,548 $771,691 $1,038,108 50% $4,911,250
DC14-RS00039 16b 3.13(b) Sarnia RoadPhase 2 - Hyde Park to
Oakcrossing Gate2 to 4 through lanes TS1349 2027 1350 $2,300 $3,105,000 $3,105,000 0 $0 $0 $0 $3,105,000 $50,000 $250,000 $360,000 $3,765,000 $0 $0 $0 $0 $3,765,000 18% $660,150 82% $3,104,850 $2,151,661 $341,534 $260,807 $350,848 40% $1,506,000
DC14-RS00040 17a 3.14(i)Boler Road / Sanatorium
RoadPhase 1 - Oxford to Riverside 2 to 4 through lanes TS1350 2027 900 $4,600 $4,140,000 $4,140,000 0 $0 $0 130 $1,200 $156,000 $4,296,000 $414,000 $706,500 $471,000 $5,887,500 $250,000 $250,000 $500,000 $1,000,000 $6,887,500 6% $440,100 94% $6,447,400 $4,468,048 $709,214 $541,582 $728,556 30% $2,066,250
DC14-RS00042 37 Adelaide StreetFanshawe Park Road to
Hamilton RoadOptimization 2027 6300 $2,100 $13,230,000 $13,230,000 $0 $0 $13,230,000 $661,500 $2,083,725 $1,389,150 $17,364,375 $0 $17,364,375 36% $6,167,700 64% $11,196,675 $7,759,296 $1,231,634 $940,521 $1,265,224 30% $5,209,313
DC14-RS00043 3 1.8Veterans Memorial
ParkwayOxford Street to Huron Street 2 to 4 through lanes TS1491 2028 1800 $3,200 $5,760,000 $5,760,000 0 $0 $0 $0 $5,760,000 $576,000 $950,400 $633,600 $7,920,000 $0 $0 $0 $0 $7,920,000 11% $880,200 89% $7,039,800 $4,878,581 $774,378 $591,343 $795,497 40% $3,168,000
DC14-RS00044 18 3.16Commissioners Road
EastHighbury Ave to Jackson Rd 2 to 4 through lanes TS1352 2028 1500 $3,200 $4,800,000 $4,800,000 0 $0 $0 $0 $4,800,000 $480,000 $792,000 $528,000 $6,600,000 $0 $0 $0 $0 $6,600,000 11% $733,500 89% $5,866,500 $4,065,485 $645,315 $492,786 $662,915 40% $2,640,000
DC14-RS00045 35b Wonderland Road Phase 2 - Hwy 402 to Hwy 401 2 to 4 through lanes 2028 2900 $3,400 $9,860,000 $9,860,000 $0 $0 $9,860,000 $986,000 $1,626,900 $1,084,600 $13,557,500 $0 $13,557,500 10% $1,418,100 90% $12,139,400 $8,412,604 $1,335,334 $1,019,710 $1,371,752 50% $6,778,750
DC14-RS00036 13a 3.8(i) Oxford Street WestPhase 1 - Sanitorium to
Commissioners2 to 4 through lanes TS1472 2029 1650 $3,400 $5,610,000 $5,610,000 750 $4,000 $3,000,000 $0 $8,610,000 $561,000 $1,375,650 $917,100 $11,463,750 $1,000,000 $320,000 $600,000 $1,920,000 $1,000,000
Poor soil conditions at bridge location
$14,383,750 6% $806,850 94% $13,576,900 $9,408,792 $1,493,459 $1,140,460 $1,534,190 40% $5,753,500
DC14-RS00048 24a 5.6 Hamilton RoadOld Victoria to Veterans
Memorial Parkway2 to 4 through lanes with
centre turn laneTS2172 2029 925 $4,900 $4,532,500 $4,532,500 $0 $0 $4,532,500 $453,250 $747,863 $498,575 $6,232,188 $0 $0 $0 $0 $6,232,188 7% $452,325 93% $5,779,863 $4,005,445 $635,785 $485,508 $653,124 45% $2,804,484
DC14-RS00049 25 Hamilton Road Highbury to River Run Terrace 2 to 4 through lanes 2029 2300 $4,600 $10,580,000 $10,580,000 250 $5,200 $1,300,000 $0 $11,880,000 $1,058,000 $1,940,700 $1,293,800 $16,172,500 $350,000 $350,000 $500,000 $1,200,000 $1,000,000Retaining walls and lawsuit with respect to old bridge
and condo's$18,372,500 6% $1,124,700 94% $17,247,800 $11,952,725 $1,897,258 $1,448,815 $1,949,001
45% $8,267,625
DC14-RS00051 38 Hamilton RoadAdelaide Street to Highbury
AvenueOptimization 2029 2800 $2,100 $5,880,000 $5,880,000 $0 $0 $5,880,000 $294,000 $926,100 $617,400 $7,717,500 $0 $1,000,000 Access issues $8,717,500 31% $2,741,200 69% $5,976,300 $4,141,576 $657,393 $502,009 $675,322 45% $3,922,875
DC14-RS00029 17b 3.14(ii)Boler Road / Sanatorium
RoadPhase 2- Riverside to
Commissioners2 to 4 through lanes TS1350 2030 550 $4,600 $2,530,000 $2,530,000 1270 $5,200 $6,604,000 $0 $9,134,000 $253,000 $1,408,050 $938,700 $11,733,750 $100,000 $200,000 $100,000 $400,000 $12,133,750 2% $268,950 98% $11,864,800 $8,222,306 $1,305,128 $996,643 $1,340,722 20% $2,426,750
DC14-RS00031 10b 3.3(ii) Bradley AvenuePhase 2 - Pond Mills to
Jackson2 to 4 through lanes TS1479 2030 2300 $3,200 $7,360,000 $7,360,000 630 $5,200 $3,276,000 $0 $10,636,000 $736,000 $1,705,800 $1,137,200 $14,215,000 $210,000 $80,000 $210,000 $500,000 $4,000,000
Retaining walls ($1M), Poor soils ($3M)
$18,715,000 6% $1,124,700 94% $17,590,300 $12,190,078 $1,934,933 $1,477,585 $1,987,704 40% $7,486,000
DC14-RS00055 31Commissioners Road
WestCranbrook Road to Springbank
Drive4 through lanes with centre
turn lane2031 1100 $4,600 $5,060,000 $5,060,000 $0 $0 $5,060,000 $506,000 $834,900 $556,600 $6,957,500 $0 $700,000 Fill for pit $7,657,500 0% $0 100% $7,657,500 $5,306,648 $842,325 $643,230 $865,298 45% $3,445,875
DC14-RS00056 Adelaide Street CPR Overpass Overpass 2031 $0 $0 $0 $0 $0 $0 $0 $0 $25,000,000 $3,750,000 $21,250,000 67% $14,301,250 33% $6,948,750 $4,815,484 $764,363 $583,695 $785,209 50% $10,625,000
DC14-RS00047 22c 4.5(iii)Bradley Avenue
ExtensionPhase 3 - Wonderland to
Bostwick2 through lanes TS1523 2032 975 $3,200 $3,120,000 $3,120,000 0 $0 $0 $0 $3,120,000 $312,000 $514,800 $343,200 $4,290,000 $540,000 $540,000 $720,000 $1,800,000 $6,090,000 0% $0 100% $6,090,000 $4,220,370 $669,900 $511,560 $688,170 45% $2,740,500
DC14-RS00052 13b 3.8(ii) Oxford Street WestPhase 2 - Commissioners to
Westdel Bourne2 to 4 through lanes TS1472 2032 1000 $3,400 $3,400,000 $3,400,000 0 $0 $0 $0 $3,400,000 $340,000 $561,000 $374,000 $4,675,000 $0 $0 $0 $0 $4,675,000 10% $489,000 90% $4,186,000 $2,900,898 $460,460 $351,624 $473,018 50% $2,337,500
DC14-RS00058 23 5.3Fanshawe Park Road
EastClarke to Highbury 2 to 4 through lanes TS1628 2032 2500 $4,600 $11,500,000 $11,500,000 0 $0 $0 $0 $11,500,000 $1,150,000 $1,897,500 $1,265,000 $15,812,500 $0 $0 $0 $0 $500,000 Cemetary vs property taking $16,312,500 7% $1,222,500 93% $15,090,000 $10,457,370 $1,659,900 $1,267,560 $1,705,170 45% $7,340,625
DC14-RS00059 30Commissioners Road
WestWonderland Road to Cranbrook
Road2 to 4 through lanes with
centre turn lane2032 1000 $3,600 $3,600,000 $3,600,000 $0 250 $1,200 $300,000 $3,900,000 $360,000 $639,000 $426,000 $5,325,000 $145,000 $425,000 $375,000 $945,000 $6,270,000 8% $489,000 92% $5,781,000 $4,006,233 $635,910 $485,604 $653,253 45% $2,821,500
DC14-RS00053 14a 3.10(i) Fanshawe Park RoadPhase 1 - Adelaide to
Richmond4 to 6 through lanes TS1346 2033 2400 $2,800 $6,720,000 $6,720,000 $6,720,000 $672,000 $1,108,800 $739,200 $9,240,000 $9,240,000 25% $2,349,600 75% $6,890,400 $4,775,047 $757,944 $578,794 $778,615 45% $4,158,000
DC14-RS00061 43Veterans Memorial
ParkwayBradley Avenue Interchange 2033 $14,608,696 $14,608,696 1000 $4,000 $4,000,000 $0 $18,608,696 $1,460,870 $3,010,435 $2,006,957 $25,086,956 $0 $25,086,956 0% $0 100% $25,086,956 $17,385,261 $2,759,565 $2,107,304 $2,834,826 80% $20,069,565
Total $648,395,190 13% $86,652,300 87% $561,742,890 $389,287,823 $61,791,718 $47,186,403 $63,476,947 $199,457,624
(1) Takes into account roadway portions already widened at key intersections and widening with minor reconstruction relative to existing, or full reconstruction. See Figure 4.(2) As per Table 1. Typical roadway cross-section includes number of lanes added with/without turning lanes; sidewalks both sides (urban only); bikepath both sides in roadway (urban only); streetlighting (urban only); traffic signals at key intersections (500m spacing); 50/100 mm depth top/base asphalt and 150/600 mm Granular A/B road structure; curb and gutter; R.O.W. drainage only; Structures, utilities, noise walls and land requirements separate. (3) Bridges and/or large diameter culverts.(4) Back Lot application only. (5) Projected project needs at full capacity after construction. V/C = 1 triggers project. When project is built, additional lanes will be near LOS C-D.(6) Utility relocation based on 10% of Roadway Construction Cost except for 4-5 lane and 4-6 lane widenings(7) Engineering Costs 15% based on Total Construction Cost.(8) Contingencies 10% based on Total Construction Cost. Construction contingencies include monies set aside for aesthetics (trees, monuments, benches, banners, planters, light standards, etc.)
(14) Assume intersections have average 8/92 NG/G split(15) Includes noise wall and retaining wall, where required(16) Based on Growth Percentage for Rail Grade Separation. Non-Growth % = Existing cross section / Future Cross Section. Assume Lane = 3.5m, Bike Lane = 1.5m, Sidewalk = 1.5mWestern Rd @ CPR (from 2 lanes to 5 lanes, 2 bike lanes, 2 sidewalks) = 7m / 23.5m = 29.8%Wharncliffe @ CNR (from 3 lanes, 2 bike lanes, 2 sidewalks to 6 lanes, 2 bike lanes and 2 sidewalks) = 13.5m / 27m = 50%Wonderland @ CNR (from 4 lanes, 2 bike lanes, 2 sidewalks to 8 lanes, 2 bike lanes, 2 sidewalks) = 20m / 34m = 58.8%(17) Railway Crossings are based on Delay Calculation (67.3% Non-Growth / 32.7% Growth)(18) Non-Growth Percentage calculated based on current and widened structure(19) In the DC by-law, Post Period Benefit is deleted from cost eligible for DC rate calculation. Not shown here for clarity.(20) Post Period Benefit is calculated based on total project cost, and does not include deduction for Previous Funding.
DC Project Number
Project Number 2009 DC Ref # Road Name Limits ImprovementRecommend
ed YearProject Length (m)
Roadway Construction Cost (per/m)
(1)
Roadway Construction Cost
Sanitary/ Water Restoration Deduction
Area of New/Widened
Structures (m2)
Structures Cost (per/m2) (1)
Structures Construction Cost
Length of Noise Wall (m)Noise Wall
Construction Cost (per/m)
Noise Wall Construction Cost
Painting Cost (5)Local Road Drainage and Storm Sewer (6)
Total Construction Cost
Utility Relocation (4)
EngineeringEnvironmental Assessment
ContingencyGrand Total
Construction CostRaw Land
Land Acquisition Cost
Complexity Note Total Grants Amount Net Total Non-Growth % Non-Growth $ Growth % Growth $Residential
(69.3%)Industrial (11.0%)
Institutional (8.4%)
Commercial (11.3%)
Deduction (%) Deduction ($)
DC14-RS00101 BRT 1 Wellington RoadBradley Avenue to Horton
Street4 to 6 through lanes 2018 5500 $3,891 $21,400,000 550 $5,200 $2,860,000 500 $1,200 $600,000 $200,000 $17,325,000 $42,385,000 $2,140,000 $7,500,000 $800,000 $4,238,500 $57,063,500 $29,563,000 $29,563,000 $3,167,200
Potential Stormwater issues
$89,793,700 $59,862,467 $29,931,233 6% $1,794,833 94% $28,136,400 $19,498,525 $3,095,004 $2,363,458 $3,179,413 20% $5,986,246.67
DC14-RS00102 BRT 2 Richmond StreetFanshawe Park Road to
Raymond Avenue4 to 6 through lanes 2017 2300 $2,800 $6,440,000 800 $4,000 $3,200,000 $120,000 $7,245,000 $17,005,000 $644,000 $2,500,000 $1,000,000 $1,700,500 $22,849,500 $12,363,000 $12,363,000 $897,000
Impacts due to UWO egress
$36,109,500 $24,073,000 $12,036,500 6% $750,567 94% $11,285,933 $7,821,152 $1,241,453 $948,018 $1,275,310 20% $2,407,300.00
DC14-RS00103 BRT 3 Highbury Avenue Dundas Street to Oxford Street 4 to 6 through lanes 2019 1300 $2,800 $3,640,000 500 $5,200 $4,600,000 $80,000 $8,320,000 $364,000 $1,396,000 $200,000 $832,000 $11,112,000 $6,987,000 $6,987,000 $507,000Railway bridge widening
- CP flagging issues$18,606,000 $12,404,000 $6,202,000 7% $424,233 93% $5,777,767 $4,003,992 $635,554 $485,332 $652,888 12% $744,240.00
DC14-RS00104 BRT 4 Dundas StreetAdelaide Street to Highbury
Avenue4 to 6 through lanes 2019 2500 $2,800 $7,000,000 $80,000 $7,080,000 $700,000 $1,305,000 $300,000 $708,000 $10,093,000 $13,437,000 $13,437,000 $975,000
Removal of on street parking and potential impacts of relocation
$24,505,000 $16,336,667 $8,168,333 10% $815,833 90% $7,352,500 $5,095,283 $808,775 $617,610 $830,833 12% $980,200.00
DC14-RS00105 BRT 5 Oxford StreetHighbury Avenue to Clarke
Road4 to 6 through lanes 2019 2400 $3,675 $8,820,000 $40,000 $8,860,000 $882,000 $1,634,000 $300,000 $886,000 $12,562,000 $12,900,000 $12,900,000 $1,215,120
Potential Stormwater issues
$26,677,120 $17,784,747 $8,892,373 9% $783,200 91% $8,109,173 $5,619,657 $892,009 $681,171 $916,337 12% $1,067,084.80
DC14-RS00106 BRT 6 Oxford Street WestHyde Park Road to Richmond
Street4 to 6 through lanes 2020 6000 $2,800 $16,800,000 375 $1,200 $450,000 $360,000 $18,900,000 $36,510,000 $1,680,000 $5,500,000 $800,000 $3,651,000 $48,141,000 $32,250,000 $32,250,000 $2,505,000
Potential Railway Complications
$82,896,000 $55,264,000 $27,632,000 7% $1,958,000 93% $25,674,000 $17,792,082 $2,824,140 $2,156,616 $2,901,162 12% $3,315,840.00
DC14-RS00107 BRT 7 Richmond StreetRaymond Avenue to York
StreetOptimization 2016 3800 $2,100 $7,980,000 $1,640,000 $9,620,000 $798,000 $1,753,000 $60,000 $962,000 $13,193,000 $0 $1,349,000
Potential impacts at intersections (Angel St.) to be determined by EA
$14,542,000 $9,694,667 $4,847,333 26% $1,240,067 74% $3,607,267 $2,499,836 $396,799 $303,010 $407,621 20% $969,466.67
DC14-RS00108 BRT 8 York StreetRichmond Street to Colborne
StreetOptimization 2017 900 $2,100 $1,890,000 $360,000 $2,250,000 $189,000 $411,000 $60,000 $225,000 $3,135,000 $0 $319,000
Impacts at pedestrian crossings
$3,454,000 $2,302,667 $1,151,333 26% $293,700 74% $857,633 $594,340 $94,340 $72,041 $96,913 12% $138,160.00
DC14-RS00109 BRT 9 Colborne Street York Street to Dundas Street Optimization 2019 300 $2,100 $630,000 $120,000 $750,000 $63,000 $137,000 $60,000 $75,000 $1,085,000 $0 $106,000Impacts at pedestrian
crossings$1,191,000 $794,000 $397,000 25% $97,900 75% $299,100 $207,276 $32,901 $25,124 $33,798 12% $47,640.00
DC14-RS00110 BRT 10 Dundas StreetColborne Street to Adelaide
StreetOptimization 2018 700 $2,100 $1,470,000 $280,000 $1,750,000 $147,000 $319,000 $60,000 $175,000 $2,451,000 $0 $248,000
Impacts at pedestrian crossings
$2,699,000 $1,799,333 $899,667 25% $228,433 75% $671,233 $465,165 $73,836 $56,384 $75,849 12% $107,960.00
DC14-RS00111 BRT 11 Wellington Road Horton Street to York Street Optimization 2020 300 $2,100 $630,000 $120,000 $750,000 $63,000 $137,000 $60,000 $75,000 $1,085,000 $0 $106,000Impacts at pedestrian
crossings$1,191,000 $794,000 $397,000 25% $97,900 75% $299,100 $207,276 $32,901 $25,124 $33,798 20% $79,400.00
Total $301,664,320 $201,109,547 $100,554,773 8% $8,484,667 92% $92,070,107 $63,804,584 $10,127,712 $7,733,889 $10,403,922 $15,843,538Notes:(1) Roadway Construction Costs ($/m) as per Table 1(2) Parts of Wellington are Rural (no sidewalks or curbs ~2km), upgrade to urban 6 lanes is $5800/m, the rest (~3.5km) is urban upgrade to 6 lanes at $2800/m(3) Parts of Oxford East are Rural (no sidewalks or curbs ~0.7km), upgrade to urban 6 lanes is $5800/m, the rest (~1.7km) is urban upgrade to 6 lanes at $2800/m(4) Utilities are 10% of Roadway Construction Cost
(5) Painting costs are for 2 lanes, 4m wide for the length of the segment, at a cost of $50/m2. Painting of Q-Jump Lanes is includedQ-Jump lanes are assumed to be 100m long by 4m wide on both sides of the street, painting costing $50/m2 ($40,000 at each location)(6) Assumed 1200mm diameter pipe at a depth of 2.5m. Pipe Cost = $610/m, Construction Cost = $770/m, and Restoration Cost = $1770/m, Total = $3150/m
TABLE 2CITY OF LONDON
2014 TRANSPORTATION DEVELOPMENT CHARGE BACKGROUND STUDYFUTURE MAJOR TRANSPORTATION ROADWORKS (2014-2033)
(Revised June 2014)
Post Period Benefit
Post Period Benefit
Bus Rapid Transit System
(12) Includes Bridge and Retaining Walls(13) Estimated costs are from completed EAs, provided by City of London Transportation Capital Budget.
2 Lane = $489,000/km3 Lane = $734,000/km 4 Lane = $979,000/km
(11) Includes $2.6M for Medway Creek Bridge and $1.1M for watermain at the bridge.
Non-Growth Growth
(9) Utility relocation costs reduced to 5% of Roadway Construction Cost for 4-5 lane & 4-6 lane widenings(10) Fill component included in roadway cost.
( )
(14)
(9)
(9)
(9)
(9)
(14)
(16)
(16)
(16)
(18)
(18)
(17)
(9)
(5)(5)
(5)
(5)
(5)
(5)
(5)
(5)
(5)
(5)
(5)
(5)
(5)
(5)
(5)
(5)
(5)
(5)
(5)
(11)(10)
(12)
(9)
(9)
(13)
(13)(13)
(13)
(13)
(13)
(13)
(15)
(15)
(15)
(18)
(2)
(3)
(18)
(10)
(19)
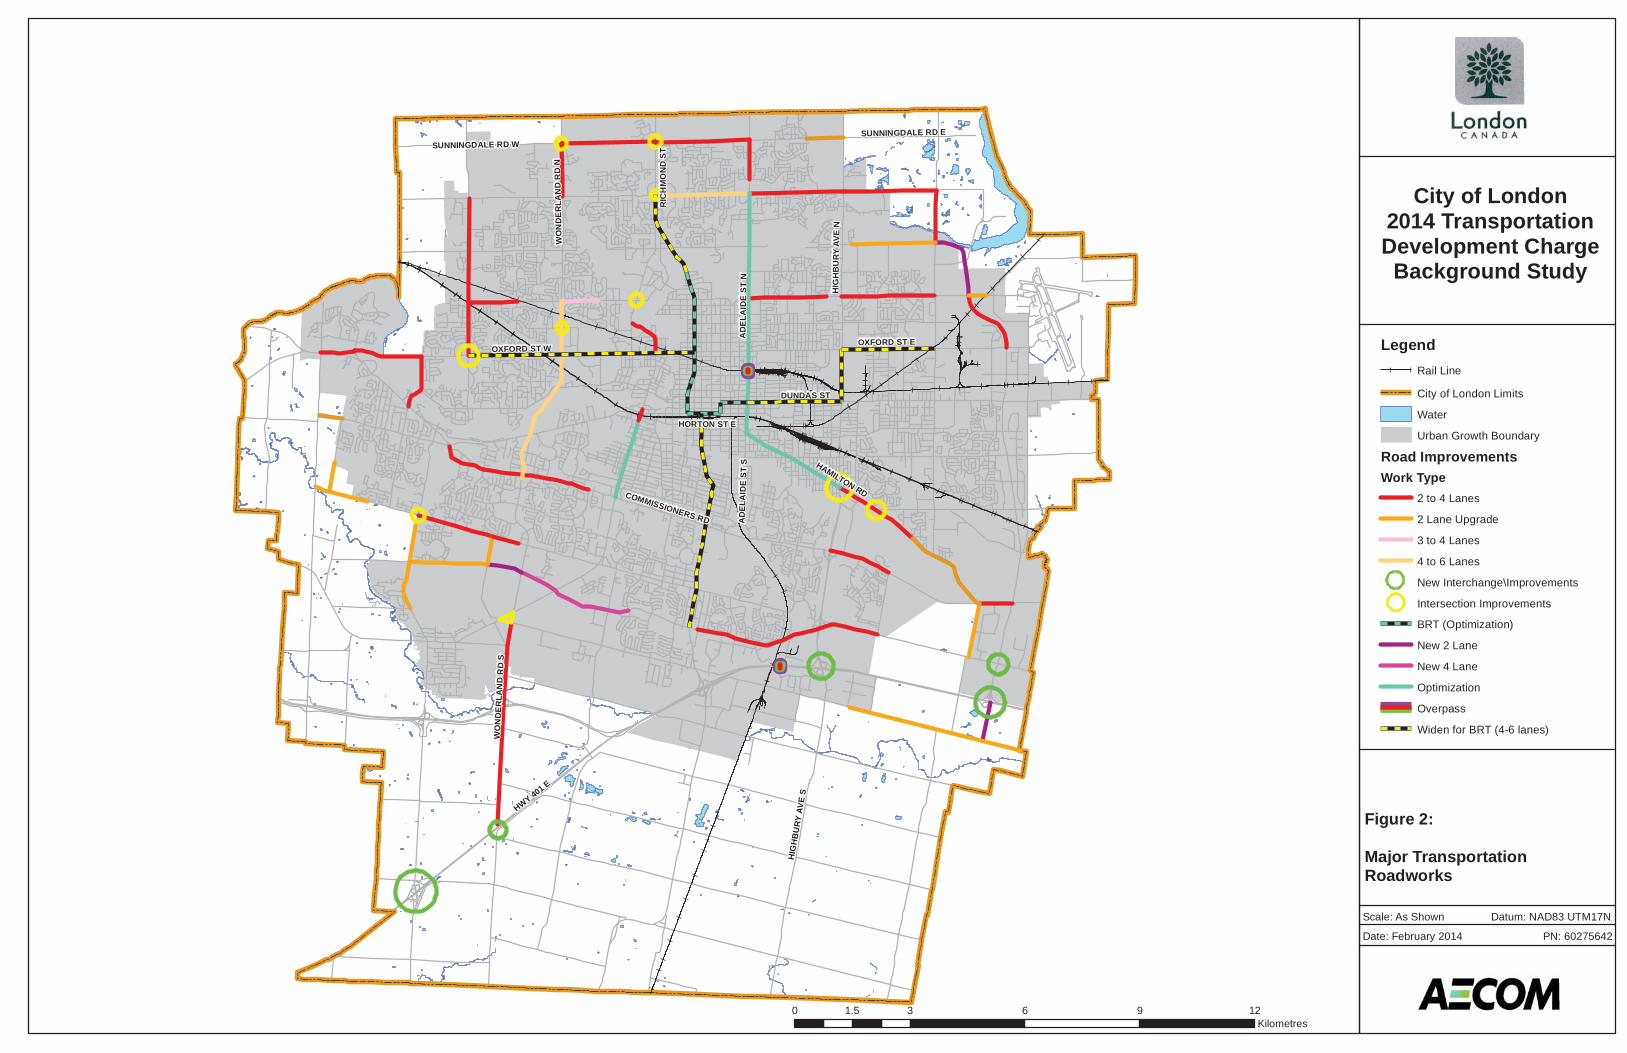
HWY 401 E
DUNDAS ST
OXFORD ST E
RIC
HM
ON
D S
T
AD
EL
AID
E S
T N
HAMILTON RD
OXFORD ST W
HIG
HB
UR
Y A
VE
N
COMMISSIONERS RD
SUNNINGDALE RD E
WO
ND
ER
LA
ND
RD
S
WO
ND
ER
LA
ND
RD
N
HIG
HB
UR
Y A
VE
S
SUNNINGDALE RD W
HORTON ST E
AD
EL
AID
E S
T S
Figure 2:
Major TransportationRoadworks
Scale: As Shown Datum: NAD83 UTM17N
Date: February 2014 PN: 60275642
0 3 6 9 121.5Kilometres
City of London2014 TransportationDevelopment Charge
Background Study
Legend
Rail Line
City of London Limits
Water
Urban Growth Boundary
Road Improvements
Work Type
2 to 4 Lanes
2 Lane Upgrade
3 to 4 Lanes
4 to 6 Lanes
BRT (Optimization)
New 2 Lane
New 4 Lane
Optimization
Overpass
Widen for BRT (4-6 lanes)
Intersection Improvements
New Interchange\Improvements
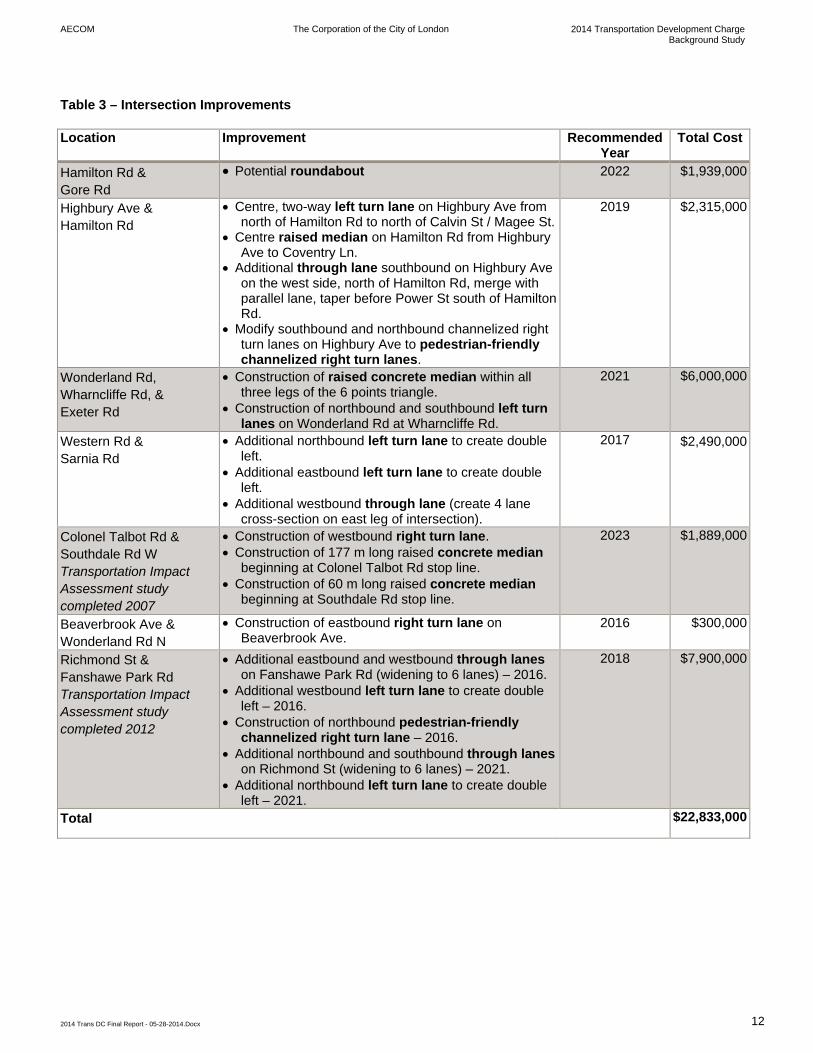
AECOM The Corporation of the City of London 2014 Transportation Development Charge Background Study
2014 Trans DC Final Report - 05-28-2014.Docx 12
Table 3 – Intersection Improvements
Location Improvement Recommended Year
Total Cost
Hamilton Rd & Gore Rd
Potential roundabout 2022 $1,939,000
Highbury Ave & Hamilton Rd
Centre, two-way left turn lane on Highbury Ave from north of Hamilton Rd to north of Calvin St / Magee St.
Centre raised median on Hamilton Rd from Highbury Ave to Coventry Ln.
Additional through lane southbound on Highbury Ave on the west side, north of Hamilton Rd, merge with parallel lane, taper before Power St south of Hamilton Rd.
Modify southbound and northbound channelized right turn lanes on Highbury Ave to pedestrian-friendly channelized right turn lanes.
2019 $2,315,000
Wonderland Rd, Wharncliffe Rd, & Exeter Rd
Construction of raised concrete median within all three legs of the 6 points triangle.
Construction of northbound and southbound left turn lanes on Wonderland Rd at Wharncliffe Rd.
2021 $6,000,000
Western Rd & Sarnia Rd
Additional northbound left turn lane to create double left.
Additional eastbound left turn lane to create double left.
Additional westbound through lane (create 4 lane cross-section on east leg of intersection).
2017 $2,490,000
Colonel Talbot Rd & Southdale Rd W Transportation Impact Assessment study completed 2007
Construction of westbound right turn lane. Construction of 177 m long raised concrete median
beginning at Colonel Talbot Rd stop line. Construction of 60 m long raised concrete median
beginning at Southdale Rd stop line.
2023 $1,889,000
Beaverbrook Ave & Wonderland Rd N
Construction of eastbound right turn lane on Beaverbrook Ave.
2016 $300,000
Richmond St & Fanshawe Park Rd Transportation Impact Assessment study completed 2012
Additional eastbound and westbound through lanes on Fanshawe Park Rd (widening to 6 lanes) – 2016.
Additional westbound left turn lane to create double left – 2016.
Construction of northbound pedestrian-friendly channelized right turn lane – 2016.
Additional northbound and southbound through lanes on Richmond St (widening to 6 lanes) – 2021.
Additional northbound left turn lane to create double left – 2021.
2018 $7,900,000
Total $22,833,000

AECOM The Corporation of the City of London 2014 Transportation Development Charge Background Study
2014 Trans DC Final Report - 05-28-2014.Docx 13
2.2 Two Lane Arterial Upgrades
Table 4 identifies the two lane arterial roadway upgrades necessitated by growth over the next 20 years. Each work is identified by growth area complete with street from/to and segment length information with timing consistent with the City’s GMIS. Each work is shown on Figure 2.
The total cost for the two lane arterial upgrades is $97.6 Million as provided in Table 4, with a net Growth cost of $86.2 Million and a net Non-Growth cost of $11.4 Million.
2.3 Minor Roadworks
The Minor Roadworks required to service growth over the next 20 years were primarily identified from current ongoing development applications and anticipated emergent applications inside the City’s GMIS boundary. All of the Minor Roadworks to be completed are included in Appendix C.
Development in the City creates growth related pressures on the infrastructure not only in the specific area being built, but also in areas within close proximity. Minor Roadworks help alleviate the growth related pressures on the infrastructure. Needs are generated from growth that requires the building or realigning of the following items:
2.3.1 Traffic Signals
The locations of anticipated traffic signals are included in the table in Appendix C, other traffic signals may be considered by the City, as warranted. However, if a developer wishes to place traffic signals that are not listed in the table and are not supported by City of London Transportation Staff, these may be rejected and not built, or built at the developer’s sole cost. It is assumed that the installation of traffic signals include some civil works, that may include zone painting, sidewalk cuts, sidewalk, tactile pedestrian surfaces and audible assisted crossing devices, where warranted. The costs of these installations will vary and the City will draw the full cost of each individual project as it is tendered. For estimation purposes for the DC we have determined that an average cost for a traffic signals and some related civil work is $154,688.
2.3.2 Channelization
These works are required to allow for dedicated left or right turn lanes, protect signal bases at intersections, provide refuge for vehicular turning movements or provide positive guidance and refuge for pedestrians and can act to preclude turns across high conflict areas near intersections. Typically they are composed of an asphalt widening with taper and storage, signage, concrete curbs, zone painting, raised islands and range in width from one to four metres. Pricing of channelization works was determined using average costs for typical widening, curb and gutter, sidewalk and zone painting. Representative channelization requirements are shown in Figure 3.
2.3.3 Roundabouts
As an alternative to traffic signals, roundabouts are included in a number of locations, where appropriate. Roundabouts offer many advantages, such as:
Increased safety levels, due to: o Yield-at-entry operation, o Fewer conflict points (standard four-way intersections have 32 conflict points versus 8 in a
roundabout), o Central and splitter islands reduce the number of conflict points, o Lower absolute speeds, allowing more time for drivers to react while reducing crash severity, o Pedestrians only have to cross one direction at a time,
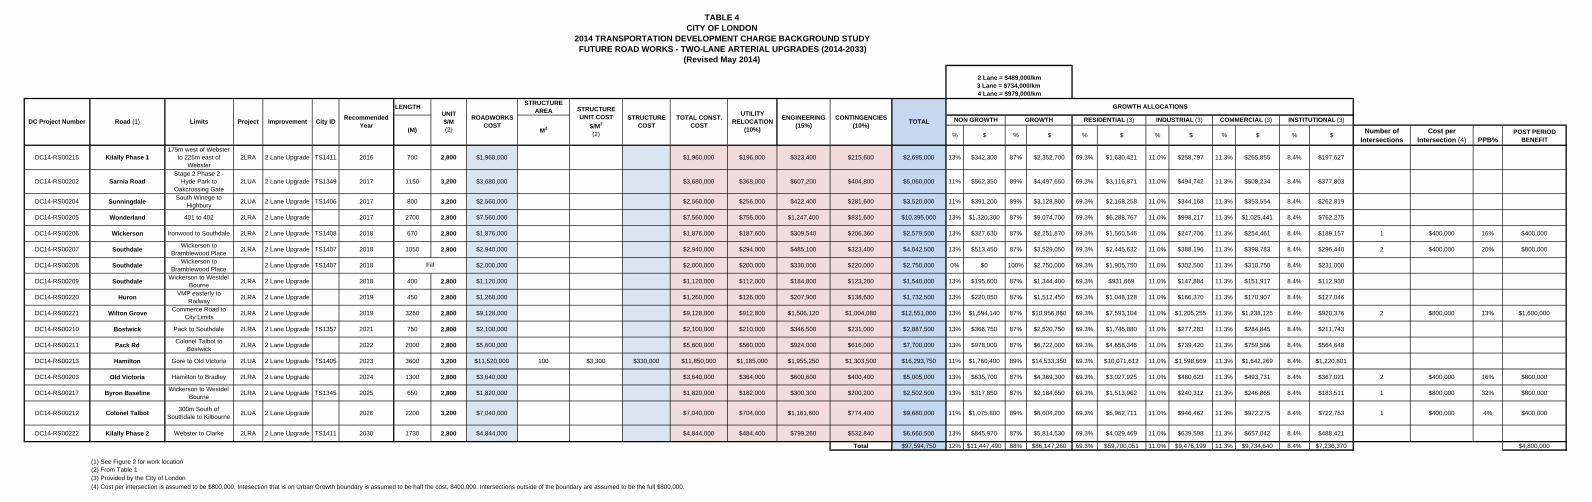
LENGTHSTRUCTURE
AREA
% $ % $ % $ % $ % $ % $Number of
IntersectionsCost per
Intersection (4) PPB%POST PERIOD
BENEFIT
DC14-RS00215 Kilally Phase 1175m west of Webster
to 225m east of Webster
2LRA 2 Lane Upgrade TS1411 2016 700 2,800 $1,960,000 $1,960,000 $196,000 $323,400 $215,600 $2,695,000 13% $342,300 87% $2,352,700 69.3% $1,630,421 11.0% $258,797 11.3% $265,855 8.4% $197,627
DC14-RS00202 Sarnia RoadStage 2 Phase 2 -
Hyde Park to Oakcrossing Gate
2LUA 2 Lane Upgrade TS1349 2017 1150 3,200 $3,680,000 $3,680,000 $368,000 $607,200 $404,800 $5,060,000 11% $562,350 89% $4,497,650 69.3% $3,116,871 11.0% $494,742 11.3% $508,234 8.4% $377,803
DC14-RS00204 SunningdaleSouth Winege to
Highbury2LUA 2 Lane Upgrade TS1406 2017 800 3,200 $2,560,000 $2,560,000 $256,000 $422,400 $281,600 $3,520,000 11% $391,200 89% $3,128,800 69.3% $2,168,258 11.0% $344,168 11.3% $353,554 8.4% $262,819
DC14-RS00205 Wonderland 401 to 402 2LRA 2 Lane Upgrade 2017 2700 2,800 $7,560,000 $7,560,000 $756,000 $1,247,400 $831,600 $10,395,000 13% $1,320,300 87% $9,074,700 69.3% $6,288,767 11.0% $998,217 11.3% $1,025,441 8.4% $762,275
DC14-RS00206 Wickerson Ironwood to Southdale 2LRA 2 Lane Upgrade TS1408 2018 670 2,800 $1,876,000 $1,876,000 $187,600 $309,540 $206,360 $2,579,500 13% $327,630 87% $2,251,870 69.3% $1,560,546 11.0% $247,706 11.3% $254,461 8.4% $189,157 1 $400,000 16% $400,000
DC14-RS00207 SouthdaleWickerson to
Bramblewood Place2LRA 2 Lane Upgrade TS1407 2018 1050 2,800 $2,940,000 $2,940,000 $294,000 $485,100 $323,400 $4,042,500 13% $513,450 87% $3,529,050 69.3% $2,445,632 11.0% $388,196 11.3% $398,783 8.4% $296,440 2 $400,000 20% $800,000
DC14-RS00208 SouthdaleWickerson to
Bramblewood Place2 Lane Upgrade TS1407 2018 $2,000,000 $2,000,000 $200,000 $330,000 $220,000 $2,750,000 0% $0 100% $2,750,000 69.3% $1,905,750 11.0% $302,500 11.3% $310,750 8.4% $231,000
DC14-RS00209 SouthdaleWickerson to Westdel
Bourne2LRA 2 Lane Upgrade 2018 400 2,800 $1,120,000 $1,120,000 $112,000 $184,800 $123,200 $1,540,000 13% $195,600 87% $1,344,400 69.3% $931,669 11.0% $147,884 11.3% $151,917 8.4% $112,930
DC14-RS00220 HuronVMP easterly to
Railway2LRA 2 Lane Upgrade 2019 450 2,800 $1,260,000 $1,260,000 $126,000 $207,900 $138,600 $1,732,500 13% $220,050 87% $1,512,450 69.3% $1,048,128 11.0% $166,370 11.3% $170,907 8.4% $127,046
DC14-RS00221 Wilton GroveCommerce Road to
City Limits2LRA 2 Lane Upgrade 2019 3260 2,800 $9,128,000 $9,128,000 $912,800 $1,506,120 $1,004,080 $12,551,000 13% $1,594,140 87% $10,956,860 69.3% $7,593,104 11.0% $1,205,255 11.3% $1,238,125 8.4% $920,376 2 $800,000 13% $1,600,000
DC14-RS00210 Bostwick Pack to Southdale 2LRA 2 Lane Upgrade TS1357 2021 750 2,800 $2,100,000 $2,100,000 $210,000 $346,500 $231,000 $2,887,500 13% $366,750 87% $2,520,750 69.3% $1,746,880 11.0% $277,283 11.3% $284,845 8.4% $211,743
DC14-RS00211 Pack RdColonel Talbot to
Bostwick2LRA 2 Lane Upgrade 2022 2000 2,800 $5,600,000 $5,600,000 $560,000 $924,000 $616,000 $7,700,000 13% $978,000 87% $6,722,000 69.3% $4,658,346 11.0% $739,420 11.3% $759,586 8.4% $564,648
DC14-RS00213 Hamilton Gore to Old Victoria 2LUA 2 Lane Upgrade TS1405 2023 3600 3,200 $11,520,000 100 $3,300 $330,000 $11,850,000 $1,185,000 $1,955,250 $1,303,500 $16,293,750 11% $1,760,400 89% $14,533,350 69.3% $10,071,612 11.0% $1,598,669 11.3% $1,642,269 8.4% $1,220,801
DC14-RS00203 Old Victoria Hamilton to Bradley 2LRA 2 Lane Upgrade 2024 1300 2,800 $3,640,000 $3,640,000 $364,000 $600,600 $400,400 $5,005,000 13% $635,700 87% $4,369,300 69.3% $3,027,925 11.0% $480,623 11.3% $493,731 8.4% $367,021 2 $400,000 16% $800,000
DC14-RS00217 Byron BaselineWickerson to Westdel
Bourne2LRA 2 Lane Upgrade TS1345 2025 650 2,800 $1,820,000 $1,820,000 $182,000 $300,300 $200,200 $2,502,500 13% $317,850 87% $2,184,650 69.3% $1,513,962 11.0% $240,312 11.3% $246,865 8.4% $183,511 1 $800,000 32% $800,000
DC14-RS00212 Colonel Talbot300m South of
Southdale to Kilbourne2LUA 2 Lane Upgrade 2026 2200 3,200 $7,040,000 $7,040,000 $704,000 $1,161,600 $774,400 $9,680,000 11% $1,075,800 89% $8,604,200 69.3% $5,962,711 11.0% $946,462 11.3% $972,275 8.4% $722,753 1 $400,000 4% $400,000
DC14-RS00222 Kilally Phase 2 Webster to Clarke 2LRA 2 Lane Upgrade TS1411 2030 1730 2,800 $4,844,000 $4,844,000 $484,400 $799,260 $532,840 $6,660,500 13% $845,970 87% $5,814,530 69.3% $4,029,469 11.0% $639,598 11.3% $657,042 8.4% $488,421
Total $97,594,750 12% $11,447,490 88% $86,147,260 69.3% $59,700,051 11.0% $9,476,199 11.3% $9,734,640 8.4% $7,236,370 $4,800,000
(4) Cost per intersection is assumed to be $800,000. Intesection that is on Urban Growth boundary is assumed to be half the cost, $400,000. Intersections outside of the boundary are assumed to be the full $800,000.
DC Project Number INSTITUTIONAL (3)GROWTH RESIDENTIAL (3) INDUSTRIAL (3) COMMERCIAL (3)UNIT $/M (2)
UTILITY RELOCATION
(10%)Project
M2
TOTAL CONST. COST
ENGINEERING (15%)
(M)
STRUCTURE COST
(2) From Table 1(1) See Figure 2 for work location
Fill
(3) Provided by the City of London
Limits
2 Lane = $489,000/km3 Lane = $734,000/km 4 Lane = $979,000/km
NON GROWTHRoad (1)
GROWTH ALLOCATIONS
TABLE 4CITY OF LONDON
2014 TRANSPORTATION DEVELOPMENT CHARGE BACKGROUND STUDYFUTURE ROAD WORKS - TWO-LANE ARTERIAL UPGRADES (2014-2033)
(Revised May 2014)
City IDImprovementCONTINGENCIES
(10%)TOTAL
Recommended Year
ROADWORKS COST
STRUCTURE UNIT COST
$/M2
(2)
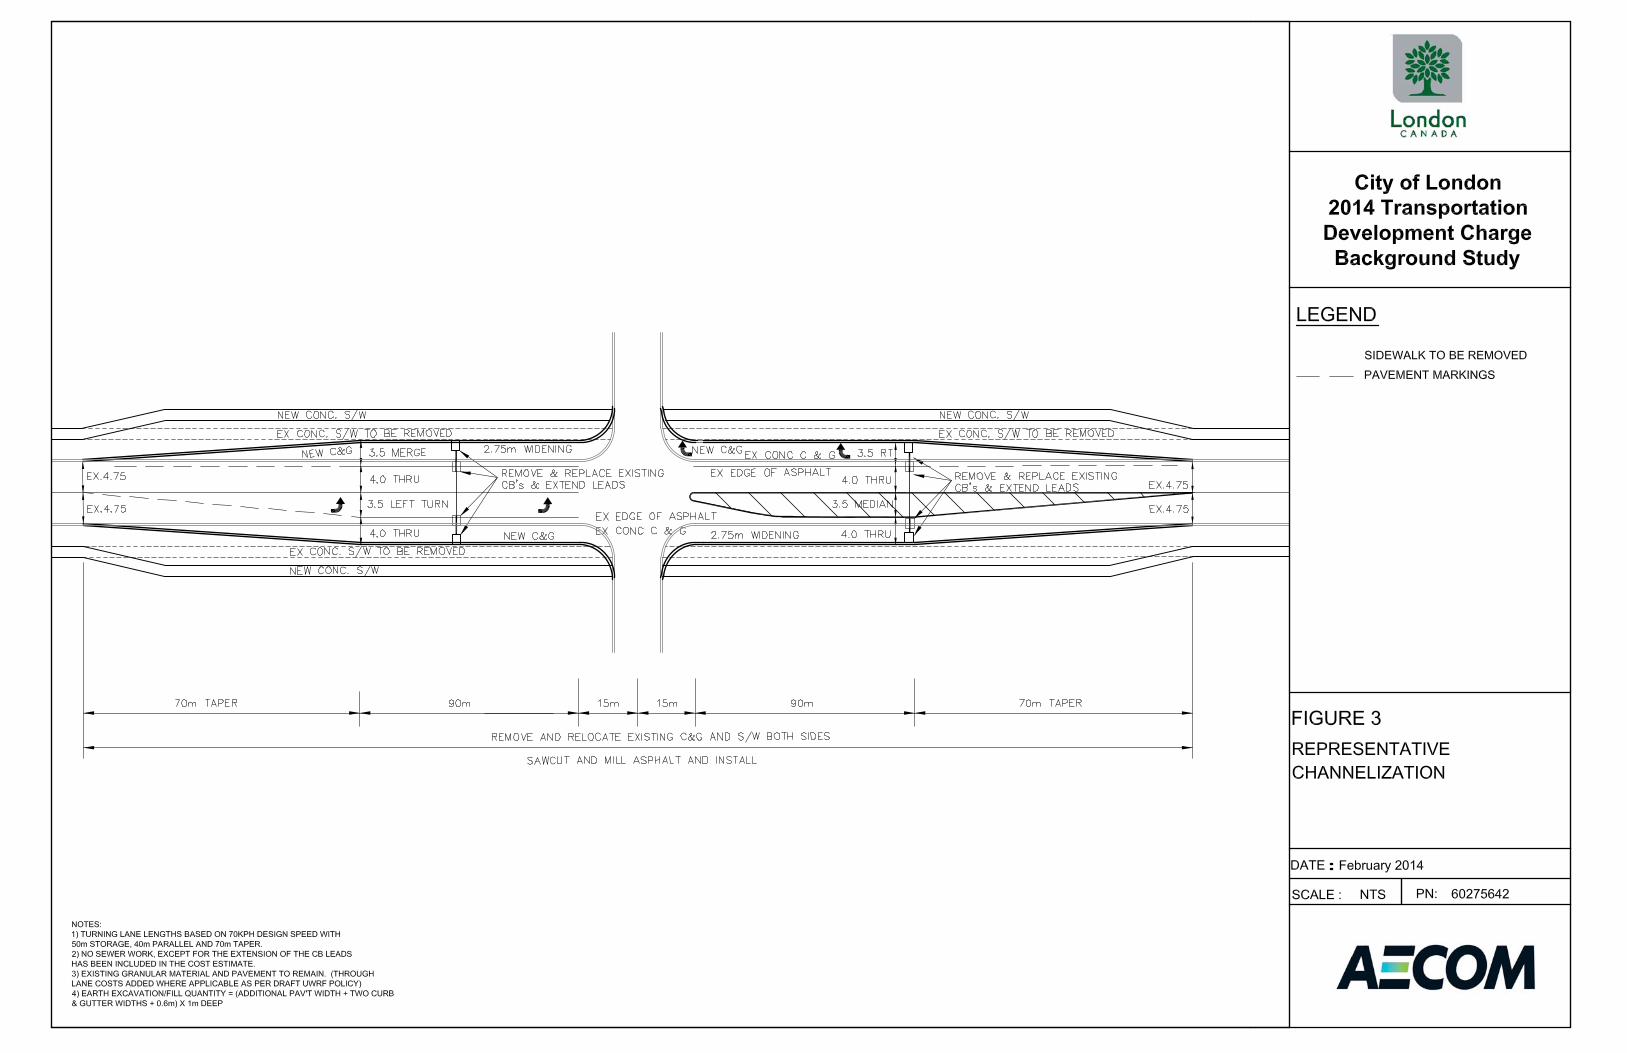
AECOM The Corporation of the City of London 2014 Transportation Development Charge Background Study
2014 Trans DC Final Report - 05-28-2014.Docx 14
o Vehicles travel in only one direction, virtually eliminating the possibility of right angle or head-on collisions.
The elimination of the cost of re-work for the installation of left and right turn lanes in the future. Reduced potential of property impacts resulting from lost business claims as traffic from all directions can
enter businesses at all four corners of the intersection. Improved aesthetics for surrounding developing areas.
However, the typical cost is slightly higher for property when compared to a 42 metre wide intersection. Roundabouts are estimated to cost approximately $800,000 for single arterial (two lane road cross-sections), and approximately $1.4 Million for double roundabouts (four lane road cross-sections).
2.3.4 Sidewalk
Growth related infrastructure placed in green field areas of the City often need to be strategically connected to existing networks. Development may occur in a non-continuous manner requiring the construction of links between new and existing infrastructure in front of non-developing property. Sidewalks are required to connect to other sidewalks or pathways. This item is estimated to cost approximately $75 per liner metre.
2.3.5 Street Lights
The advancement of development before road improvements is common in many municipalities. Typically, this generates new street connections with traffic control devices placed on existing road right of ways. This creation of decision points requires street lighting for the user to identify the new connection and execute the desired turning movement. The addition of street lights is also triggered by the addition of sidewalks as driven by growth in pedestrian traffic. Street lights typically cost approximately $100 per linear metre.
2.4 Programs
2.4.1 Urban Intersections (Traffic Signals and Street Lights)
Significant need for intersection improvements can arise out of growth within an area and the generation of trips being funnelled into existing networks. In a green field situation, new development usually places little loading on adjacent road networks, vehicles egressing development can easily merge into gaps in traffic. However, as development pressure increases, the increase in the number of vehicles entering and leaving a new development can lead to queuing and excessive cut through traffic of adjacent built up areas. The new traffic volume stress intersections somewhat removed from the development (non-contiguous). In an infill situation, points of access to a major arterial will be stressed by development that is globally occurring in the general neighbourhood. The City has a program to install the necessary intersection improvements, including traffic signals and street lights, and usually installs two per year in areas brought about by growth in an area but are not directly adjacent to the development. This program value is approximately $404,000 per year.
2.4.2 Rural Intersections
Growth on peripheral edges of the City leads to urban traffic using rural roads. Significant traffic is typically noticed along the first concession adjacent to the UGB. Upgrades along the road and to intersections are warranted through a combination of AADT and accident counts. Currently within the City, this phenomenon
AECOM The Corporation of the City of London 2014 Transportation Development Charge Background Study
2014 Trans DC Final Report - 05-28-2014.Docx 15
can be noticed on Bradley Avenue east of Jackson Road, Dingman Drive and sections of Wickerson Road and Sunningdale Road east of Highbury Avenue.
The City has a program to install the necessary intersection improvements, and usually installs one per year in areas brought about by growth in an area but are not directly adjacent to the development. This program value is approximately $100,000 per year.
2.4.3 Active Transportation
The most cost effective way to reduce costs associated with the Active Transportation program is to reduce Single Occupancy Vehicles on the road. In the London 2030 TMP, the City identified active transportation as a key to offering choice to the travelling public. The program seeks to achieve the following goals:
Increase the proportion of trips accomplished by biking and walking Increase safety and mobility for non-motorized users Enhance public health
The program includes works such as on street bicycle lanes and the program value is based upon an estimate to accomplish the projects set out in the Bicycle Master Plan and London 2030 TMP over a 20-year timeframe, and is approximately $782,850 per year with a Non-Growth of 49.7%. The DC eligible amount is $7,572,000 over the next 20 years.
2.4.4 Advance Purchase of Land
The advanced purchase of land required for road projects is a sound financial undertaking as it can eliminate elevated cost of speculation and legal expenses associated with hearing of necessity and expropriation. Significant land needs have been identified by detailed preliminary design studies for intersections along the Veterans Memorial Parkway. A value of $5.2 Million is estimated to be required in the next 20 years with $840,000 previously funded.
2.4.5 Road Class Oversizing/ City Share
Occasionally, in a growth area there may be a need for an individual developer to increase the classification of a road servicing their individual plan from secondary to primary. This usually is a requirement that is driven by a routing of a large road through an area or global need due to growth surrounding the plan. Two instances have previously existed in the City in which money was saved by the City using this oversizing program instead of building a service road. This program value is approximately $100,000 per year but it accrues until it is used. The DC eligible amount is $2 million over the next 20 years.
3. Rapid Transit System Costs and Alternatives
Council have endorsed the implementation of the RT system and accepted the Bus Rapid Transit (BRT) business case that sets the cost of roadworks and hard infrastructure to be $301.7 Million and anticipates a 66% share of funding through senior governments. The Benefit to Existing (Non-Growth) for the roadworks was developed utilizing the rehabilitation method used for other road projects. This estimates an 8% split with a proposed 92% being DC eligible. A Post Period Benefit (PPB) was calculated based on a ratio of the future capacity and the usage in the last

AECOM The Corporation of the City of London 2014 Transportation Development Charge Background Study
2014 Trans DC Final Report - 05-28-2014.Docx 16
year of this DC study. Varying predicted usage of the two corridors lead to a 20% PPB on the North-South corridor and a 12% PPB on the East-West corridor. The estimated total charge to CSRF would be the remaining 33% share not covered by the anticipated funding from senior governments, for a total of $100.6 Million. The TMP placed significant focus on the RT system, nodal growth and infill and intensification. Alternatively, network improvements to roadworks could be made on parallel arterials. These short term improvements would require other future similar road improvements on other roads. Whereas the RT system lays the ground work for a system that can be readily expanded and optimized to meet future needs in a more economical and environmentally responsible manner. The implementation of the RT system is cost-effective for the DC because it leverages senior government funding and expands road capacity more effectively. Alternatively, if the RT system is not implemented, these and potentially other road widenings would be required at 100% Growth funding.
4. The Southwest London Area Plan
Significant planning work has been undertaken in the Southwest London Area Plan (SWAP) since the last DC Study that has generated needs for arterial roads to connect this portion of the City to the Highway 401 corridor and the rest of the built network. Significant development associated with the needs that may be identified by the enterprise zone were not modelled and await the OMB challenge of the secondary plan at the OMB. Should SWAP and the enterprise zone continue through the planning process to construction, significant additional infrastructure may be required and be CSRF eligible.
5. Highway 401 Interchanges
A number of Highway 401 Interchange improvements have been included in the program. These improvements provide the City with a cost-effective opportunity, as the Province is funding over three quarters of the project costs to cover the global growth need. The City’s share in principle estimates the growth share of London and the benefit to existing for London’s population. It is envisioned that this senior government investment will open up new lands for multiple growth uses along one of Canada’s most vibrant transportation corridors.
6. Discussion for Expansion of the Urban Growth Boundary
The extension of works to service the development of land outside the UGB that may be extended have not been accrued in this DC Background Study. Should the UGB be amended through the planning process and more growth be facilitated to construction, then significant additional infrastructure may be required and be CSRF eligible.
7. Development Charge Implications
The following sections outline the methodology used to determine BTE (Growth/Non-Growth) allocation, Post Period Benefit and final costs to be used to calculate development charge rates associated with future transportation needs driven by growth over a 20 year period from 2014 to 2033 consistent with the GMIS Boundary.
AECOM The Corporation of the City of London 2014 Transportation Development Charge Background Study
2014 Trans DC Final Report - 05-28-2014.Docx 17
7.1 Benefit to Existing (Growth/Non-Growth) Determination
As per the previous DC Background Study and By-law, the BTE (Growth/Non-Growth) determination for Major Roadworks and two lane arterial upgrades was based on the cost to rehabilitate existing roadways. The list of these roadways was based on the London 2030 TMP.
A review was undertaken by the City to determine how other municipalities in Ontario determine BTE (Growth/Non-Growth) allocations for roadway projects. It was generally found that most municipalities took a road rehabilitation or reconstruction cost credit approach to determine BTE (Growth/Non-Growth) allocation. Some larger municipalities took a transportation modeling approach.
As a result of this, it was determined that BTE (Growth/Non-Growth) allocation would be based on previous DC policy as reiterated for completeness below:
1) For road widenings including arterial, two lane arterial upgrades and RT, required for increased traffic growth, BTE (Growth/Non-Growth) components were determined as follows: The 20 year rehabilitation costs for roadways in question shall be estimated and become the Non-
Growth share for the DC calculation purposes. These rehabilitation credits were determined by calculating the cost of alternative roadway rehabilitation/replacement scenarios over the service life of the asphalt pavement and underlying granular road base (60 year timeframe assumed). The alternative that had the highest cost was pro-rated into a present value. In calculating the 20 year rehabilitation costs provided in Table 2 (2 lane = $489,000/km; 3 lane = $734,000/km; 4 lane = $979,000/km), roadway rehabilitations (milling and asphalt resurfacing), were considered to have a service life of 13.3 years. Full roadway reconstruction was considered to be required at 30 year intervals.
100% credit to the Non-Growth portion was provided for full rehabilitation assuming no additional life of pavement due to recent restorations, or extended service life due to premium mix designs or low equivalent single axle loads.
2) For new infrastructure that is a network need identified in the London 2030 TMP, these are a 100% Growth need.
3) For the replacement of interchanges, the ratio share of existing foot print / proposed foot print on the structure is the Non-Growth share (including gore areas for ramps on the structure).
4) For new grade separations required for railway crossings where a bridge does not current exist, the ratio share of % delay attributed to Growth is taken as the Growth share.
5) For the reconstruction of existing rail grade separations the ratio share of existing foot print / proposed foot print of the structure is the Non-Growth share.
Summarizing this approach for all roadworks, the Non-Growth component was calculated to range on a project basis from 0% to 67% as shown in Table 2.
Considering all of the Major Roadworks identified in Table 2 to confirm rehabilitation and widening/reconstruction needs for 2, 4 and 6 lane roadways, resulted in a global BTE (Growth/Non-Growth) percentage of 87% Growth and 13% Non-Growth.
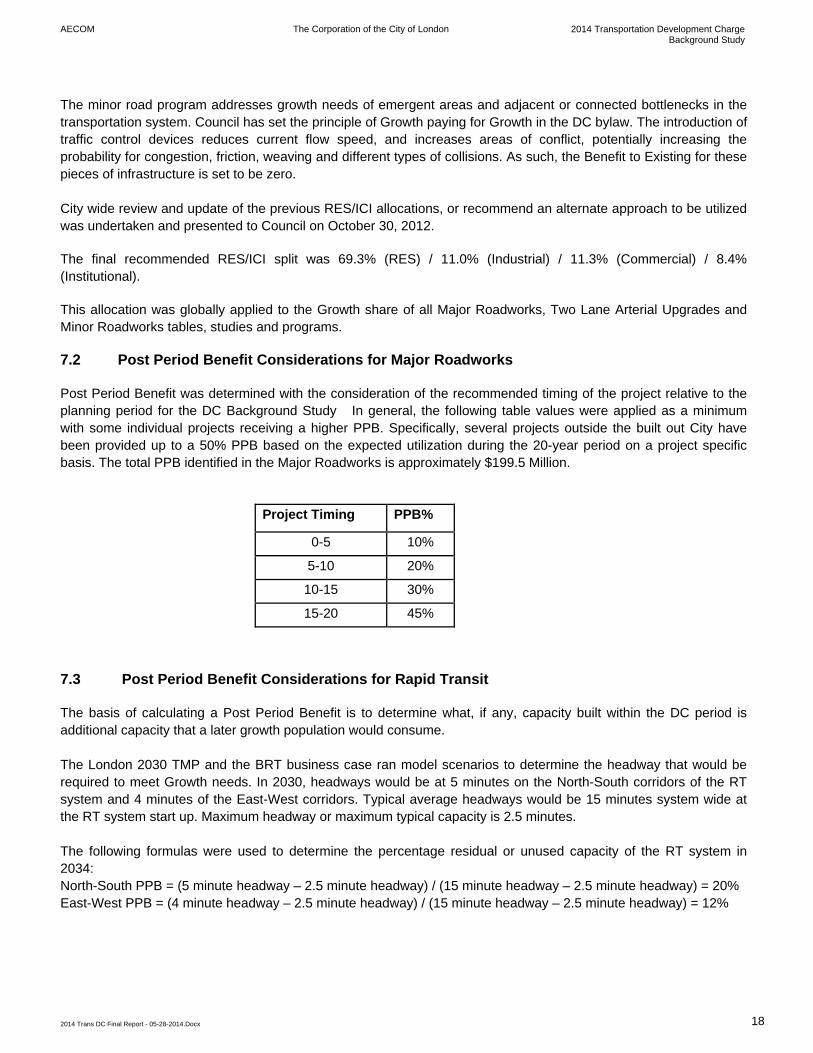
AECOM The Corporation of the City of London 2014 Transportation Development Charge Background Study
2014 Trans DC Final Report - 05-28-2014.Docx 18
The minor road program addresses growth needs of emergent areas and adjacent or connected bottlenecks in the transportation system. Council has set the principle of Growth paying for Growth in the DC bylaw. The introduction of traffic control devices reduces current flow speed, and increases areas of conflict, potentially increasing the probability for congestion, friction, weaving and different types of collisions. As such, the Benefit to Existing for these pieces of infrastructure is set to be zero. City wide review and update of the previous RES/ICI allocations, or recommend an alternate approach to be utilized was undertaken and presented to Council on October 30, 2012.
The final recommended RES/ICI split was 69.3% (RES) / 11.0% (Industrial) / 11.3% (Commercial) / 8.4% (Institutional).
This allocation was globally applied to the Growth share of all Major Roadworks, Two Lane Arterial Upgrades and Minor Roadworks tables, studies and programs.
7.2 Post Period Benefit Considerations for Major Roadworks
Post Period Benefit was determined with the consideration of the recommended timing of the project relative to the planning period for the DC Background Study In general, the following table values were applied as a minimum with some individual projects receiving a higher PPB. Specifically, several projects outside the built out City have been provided up to a 50% PPB based on the expected utilization during the 20-year period on a project specific basis. The total PPB identified in the Major Roadworks is approximately $199.5 Million.
Project Timing PPB%
0-5 10%
5-10 20%
10-15 30%
15-20 45%
7.3 Post Period Benefit Considerations for Rapid Transit
The basis of calculating a Post Period Benefit is to determine what, if any, capacity built within the DC period is additional capacity that a later growth population would consume. The London 2030 TMP and the BRT business case ran model scenarios to determine the headway that would be required to meet Growth needs. In 2030, headways would be at 5 minutes on the North-South corridors of the RT system and 4 minutes of the East-West corridors. Typical average headways would be 15 minutes system wide at the RT system start up. Maximum headway or maximum typical capacity is 2.5 minutes. The following formulas were used to determine the percentage residual or unused capacity of the RT system in 2034: North-South PPB = (5 minute headway – 2.5 minute headway) / (15 minute headway – 2.5 minute headway) = 20% East-West PPB = (4 minute headway – 2.5 minute headway) / (15 minute headway – 2.5 minute headway) = 12%
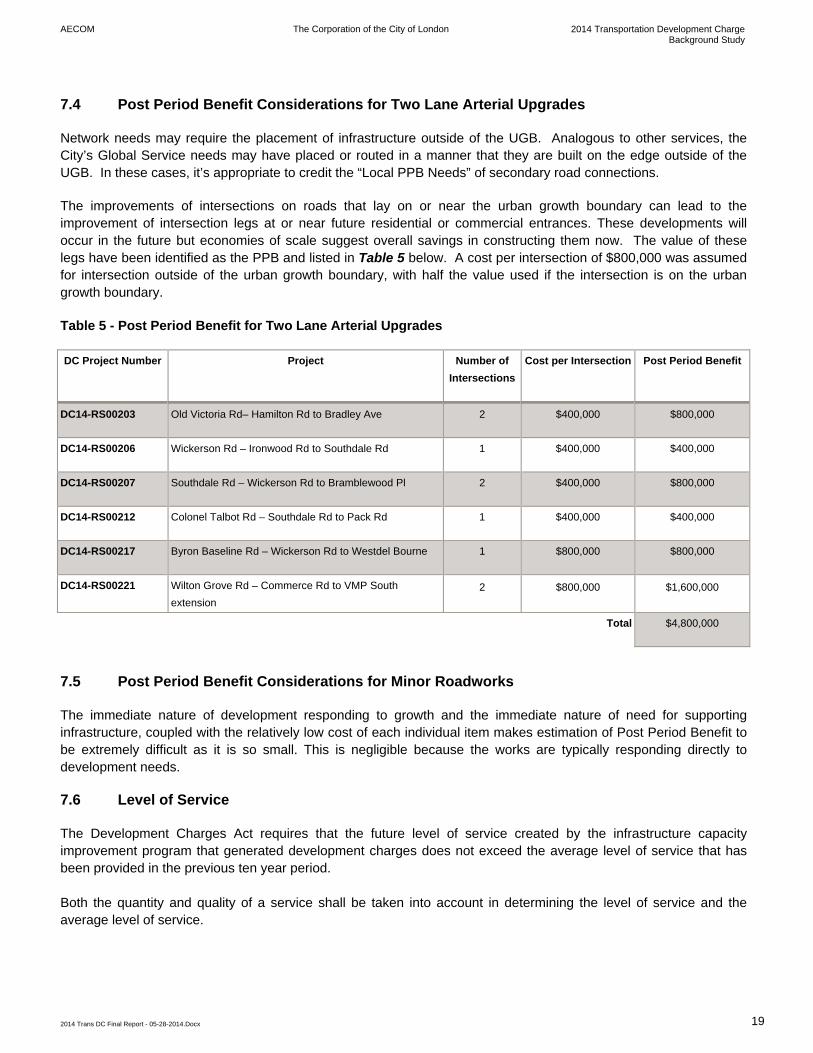
AECOM The Corporation of the City of London 2014 Transportation Development Charge Background Study
2014 Trans DC Final Report - 05-28-2014.Docx 19
7.4 Post Period Benefit Considerations for Two Lane Arterial Upgrades
Network needs may require the placement of infrastructure outside of the UGB. Analogous to other services, the City’s Global Service needs may have placed or routed in a manner that they are built on the edge outside of the UGB. In these cases, it’s appropriate to credit the “Local PPB Needs” of secondary road connections.
The improvements of intersections on roads that lay on or near the urban growth boundary can lead to the improvement of intersection legs at or near future residential or commercial entrances. These developments will occur in the future but economies of scale suggest overall savings in constructing them now. The value of these legs have been identified as the PPB and listed in Table 5 below. A cost per intersection of $800,000 was assumed for intersection outside of the urban growth boundary, with half the value used if the intersection is on the urban growth boundary.
Table 5 - Post Period Benefit for Two Lane Arterial Upgrades
DC Project Number Project Number of
Intersections
Cost per Intersection Post Period Benefit
DC14-RS00203 Old Victoria Rd– Hamilton Rd to Bradley Ave 2 $400,000 $800,000
DC14-RS00206 Wickerson Rd – Ironwood Rd to Southdale Rd 1 $400,000 $400,000
DC14-RS00207 Southdale Rd – Wickerson Rd to Bramblewood Pl 2 $400,000 $800,000
DC14-RS00212 Colonel Talbot Rd – Southdale Rd to Pack Rd 1 $400,000 $400,000
DC14-RS00217 Byron Baseline Rd – Wickerson Rd to Westdel Bourne 1 $800,000 $800,000
DC14-RS00221 Wilton Grove Rd – Commerce Rd to VMP South
extension
2 $800,000 $1,600,000
Total $4,800,000
7.5 Post Period Benefit Considerations for Minor Roadworks
The immediate nature of development responding to growth and the immediate nature of need for supporting infrastructure, coupled with the relatively low cost of each individual item makes estimation of Post Period Benefit to be extremely difficult as it is so small. This is negligible because the works are typically responding directly to development needs.
7.6 Level of Service
The Development Charges Act requires that the future level of service created by the infrastructure capacity improvement program that generated development charges does not exceed the average level of service that has been provided in the previous ten year period. Both the quantity and quality of a service shall be taken into account in determining the level of service and the average level of service.

AECOM The Corporation of the City of London 2014 Transportation Development Charge Background Study
2014 Trans DC Final Report - 05-28-2014.Docx 20
In determining the quantity of a service, the lane kilometer per capita method is typically used. The average lane kilometers per 1000 population is determined over the past 10 years (2004-2013), and compared to the predicted lane kilometer per 1000 population for the last year of the current study (2033). The future level of service shall not exceed the average level of service from the past 10 years.
Year Lane km on Arterial Roads Population1 Lane km per Capita
2004 1214.6 345,451 3.52 2005 1242.8 348,906 3.56 2006 1247.7 352,3952 3.54 2007 1247.7 355,6753 3.51 2008 1247.7 358,889 3.48 2009 1247.7 362,1313 3.45 2010 1252.5 364,139 3.44 2011 1253.4 366,1512 3.42 2012 1256.3 369,813 3.40 2013 1264.0 373,511 3.38
Average = 3.47 Note:
1. Population calculated assuming 1% growth per year (where data not available). 2. From StatsCan Census. 3. From 2013 Transportation Master Plan.
In 2033, the anticipated lane kilometers of arterial roads will be 1421.4 km with a population of 442,569, resulting in a Lane km per capita of 3.21, which is lower than the average Lane km per capita of the past 10 years of 3.47. In determining the quality of a service, the replacement cost of municipal capital works, exclusive of any allowance for depreciation, shall be the amount used.
Year Replacement Cost of Arterial Road Assets1 Population Ratio
2004 $552,637,848 345,451 1599.76 2005 $565,468,961 348,906 1620.69 2006 $567,698,481 352,395 1610.97 2007 $567,698,481 355,675 1596.12 2008 $567,698,481 358,889 1581.82 2009 $567,698,481 362,131 1567.66 2010 $569,882,500 364,139 1565.01 2011 $570,305,654 366,151 1557.57 2012 $571,625,165 369,813 1545.72 2013 $575,125,056 373,511 1539.78
Average = 1578.51 Note:
1. Assuming Replacement Value of $455,004 per lane kilometer.
In 2033, the anticipated replacement value of arterial roads will be $646,763,161 with a population of 442,569, resulting in a ratio of 1461.38, which is lower than the average of the past 10 years of 1578.51.

AECOM The Corporation of the City of London 2014 Transportation Development Charge Background Study
2014 Trans DC Final Report - 05-28-2014.Docx 21
7.7 Operating Cost
The Development Charge Background Study is required under the Development Charge Act, 1997, s.10(c) to contain an examination of the long term capital and operating cost impacts for capital infrastructure for which a development charge is calculated. The roadworks program provides the addition of 157.4 lane kilometres of arterial roads by 2033. The annual cost of maintenance and snow clearing for the additional roads is estimated to be $3,000 per lane kilometer, for a total annual cost of approximately $472,200.
8. Conclusions and Recommendations
The following conclusions have been reached and recommendations made as a result of our work in completing the Transportation Development Charge Background Study.
8.1 Conclusions
The key conclusions reached through work completion are as follows:
The size of the transportation program is a function of the growth levels in the City since completion of the 2009 Background Study and the needs to reinforce expensive spines of the network; the City not keeping pace with the required arterial capacity improvements, and the additional projects added based on population growth forecasts.
The Rapid Transit projects reduce DC cost by expanding road capacity more efficiently and leveraging senior government funding.
All roadway unit cost items except noise wall were observed to increase since the last study was completed. This observation is consistent with province and industry-wide experiences supported by Stats Canada Indicators.
The application of a rehabilitation based approach for the calculation of Major Roadworks project for the BTE (Growth/Non-Growth) percentage, has resulted in similar Growth allocations as the last DC Study.
There is alignment between the Major Roadworks and two lane arterial upgrade projects listed in this study, with the GMIS and the City budget project listing will be adjusted to match the DC Background Study.
Cost containment strategies in the form of Post Period Benefit considerations, project phasing and staging have been implemented to reduce costs and develop a reasonable program.
The incorporation of phasing strategies that considered the relationship and timing of Major and Minor works on a given corridor, reduced the number of Minor Roadworks projects than would have otherwise been considered.
Staging of Major Roadwork projects has been implemented to reflect the likely progression of how a particular project will be constructed, based on existing and forecast needs within a corridor. Staging of works will also assist with the strategic investment of both Growth and Non-Growth dollars over time.
8.2 Recommendations
Based on the above conclusions, the following recommendations are made:
The Growth costs identified in the study form the basis for the DC rate determination.
The City should consider a series of internal and external educational sessions to present the new cost sharing principles for local services.

AECOM The Corporation of the City of London 2014 Transportation Development Charge Background Study
2014 Trans DC Final Report - 05-28-2014.Docx 22
The 2014 budget and forecast should be based on the results of this study with project budgets to be refined as more information becomes available through completion of environmental assessments, preliminary and detailed design, and inflation tracking.
The DC By-law will need to be revised to reflect the cost sharing principles used to develop project costs provided in this study.
The City should keep appraised of the progression of new Development Charge related policies in other municipalities that set precedent in legislation.
Appendix A
Local Servicing Policy

CITY OF LONDON 2014 LOCAL SERVICE POLICIES
GENERAL
G-1. Claimability Any item listed as claimable, subsidizable, or eligible for funding from a development charge reserve fund must also be provided for in the approved DC rates. To the extent that specific cost sharable works and projects cannot be identified as to location or timing, there should be a contingency provided for in the estimates that is incorporated into the rates.
It is important that the City continue to monitor between DC Background Studies, the accuracy of the estimates and assumptions used to establish the rates. To the extent that substantial variations are identified, Council should be advised and will need to consider whether to increase or decrease the rates in accordance with the monitoring observations.
G-2. DC Fund reimbursements for Exempted Development The City currently exempts Industrial development, and certain specified forms of Institutional development from the payment of development charges. These exemptions support economic development and not-for-profit development initiatives.
With respect to any non-statutory exemptions the City approves in its DC policy, the City will pay for these exemptions through non-DC supported contributions to the respective DC reserve funds. This meets the legislative requirement that exemptions or reductions to charges otherwise payable not be recovered from other, non-exempt forms of development (DCA s.5(6)3.)
G-3. Non-Growth Works that Benefit the Existing Population Where minor works funded in part from the CSRF are subject to this policy and also include a non-growth component in the DC Background Study, funding of that portion of the works must wait until the City has approved sufficient funds in its Council approved capital budgets, or Council makes provision for a Reserve Fund designated for use in funding the non-growth share of DC funded works, to pay for that non-growth portion of the works. The non-growth portion of the funding shall be identified in the City’s Capital Works Budget and approved by Council.
G-4. Use of Contingencies Works listed as eligible in the Development Charges Background Study, or with the approval of the City Engineer, in consultation with the Director, Development Finance, drawn from a contingency and/or an alternative to a work listed in the Background Study may be funded from the CSRF. The claimability of such a work would be subject to inclusion in the development agreement (for works less than $50,000 subject to approved funding in the Capital Budget) or subject to execution of a Municipal Servicing and Financing agreement prior to commencement of the work. The works funded from the CSRF under this paragraph would be subject to rules similar to those described for minor CSRF eligible works contained in this section with respect to eligibility, tender and claim completeness and submission. G-5. Exceptions The Development Charge By-law allows for exceptions to projects listed in the DC Background Study for works listed as eligible in the Development Charges Background Study, or with the approval of the City Engineer, in consultation with the Director, Development Finance, drawn from a contingency and/or substituted for a work listed in the Background Study may be claimable.
Development Finance March 28, 2014 City of London

ROADS
R-1. Major Roadworks (CSRF - Roads Services) Major Transportation road works typically consist of large-scale arterial road widening projects or two lane road upgrades triggered by increased traffic volumes associated with growth across the City. All Major Transportation Roadworks are constructed by the City and the growth related cost is eligible for a claim from the CSRF - Roads Services. The costs of the following items are incorporated into road projects and are required as a result of growth:
• Structures to be widened or replaced • Noise barrier wall where required • Land acquisition (raw land cost, appraisals, surveying, legal, etc.) but only where lands
cannot be acquired through dedications under the Planning Act on a timely basis. R-2. Minor Roadworks (CSRF - Roads Services) Minor Road Works that would be constructed as part of the major road project are eligible to be claimed from the CSRF - Roads Services. These works include: new traffic signals, channelization, sidewalks, and streetlights. In some cases, these works are done in advance of the road capacity expansion project as a means of addressing a network wide benefit to growth, without completing the entire road expansion. R-3. Arterial Road Extensions (CSRF - Roads Services) When a development precedes the construction of a new arterial road that is either adjacent to or runs through the developable lands, the Developer is responsible for the construction of a primary collector road along the ultimate road right-of-way. A partial claim for this work may be made as per the primary road oversizing provisions for Minor Works - CSRF.
R-4. Minor Road Works - Road Oversizing (CSRF – Minor Roadworks)
Where a new arterial or primary collector road is to be constructed in whole or in part through or adjacent to a development, the Developer is responsible for the cost of constructing a secondary collector road as defined in the City of London’s Design Specifications & Requirements Manual. If the required road is wider or at a higher standard, the Developer is responsible for the cost of a standard road, including sidewalks, street lights, etc., and is eligible for a claim to the CSRF – Minor Roadworks for the difference in cost between a standard road and the road actually constructed. The construction responsibilities shall be defined by the conditions of an agreement between the City and the Developer. If the Developer wishes to construct the road at an enhanced standard beyond that acceptable to the City Engineer, then the Developer shall pay for the additional costs of enhancement with no eligibility for a claim from any fund. R-5. Channelization (CSRF – Minor Roadworks) Channelization on a primary or arterial road into a new public street is eligible for a claim from the CSRF – Minor Roadworks. The following subsections list the various additional components of the channelization which are considered claimable:
R-5.1. Tree Plantings
When replacement trees are planted as part of external roadworks to compensate for removed trees, other than those removed to facilitate an access, the cost of the removal and replacement is claimable. All other tree plantings are not claimable.
City of London March 28, 2014 Development Finance
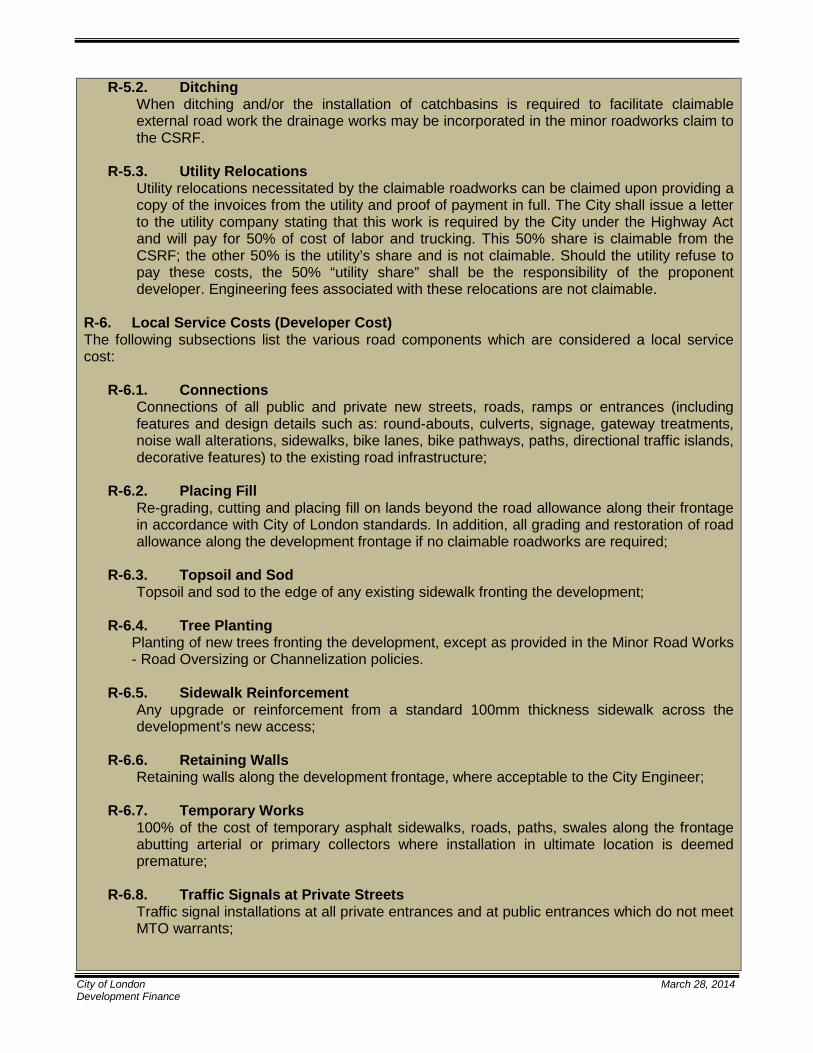
R-5.2. Ditching When ditching and/or the installation of catchbasins is required to facilitate claimable external road work the drainage works may be incorporated in the minor roadworks claim to the CSRF.
R-5.3. Utility Relocations Utility relocations necessitated by the claimable roadworks can be claimed upon providing a copy of the invoices from the utility and proof of payment in full. The City shall issue a letter to the utility company stating that this work is required by the City under the Highway Act and will pay for 50% of cost of labor and trucking. This 50% share is claimable from the CSRF; the other 50% is the utility’s share and is not claimable. Should the utility refuse to pay these costs, the 50% “utility share” shall be the responsibility of the proponent developer. Engineering fees associated with these relocations are not claimable.
R-6. Local Service Costs (Developer Cost) The following subsections list the various road components which are considered a local service cost:
R-6.1. Connections Connections of all public and private new streets, roads, ramps or entrances (including features and design details such as: round-abouts, culverts, signage, gateway treatments, noise wall alterations, sidewalks, bike lanes, bike pathways, paths, directional traffic islands, decorative features) to the existing road infrastructure;
R-6.2. Placing Fill
Re-grading, cutting and placing fill on lands beyond the road allowance along their frontage in accordance with City of London standards. In addition, all grading and restoration of road allowance along the development frontage if no claimable roadworks are required;
R-6.3. Topsoil and Sod
Topsoil and sod to the edge of any existing sidewalk fronting the development; R-6.4. Tree Planting
Planting of new trees fronting the development, except as provided in the Minor Road Works - Road Oversizing or Channelization policies.
R-6.5. Sidewalk Reinforcement
Any upgrade or reinforcement from a standard 100mm thickness sidewalk across the development’s new access;
R-6.6. Retaining Walls
Retaining walls along the development frontage, where acceptable to the City Engineer; R-6.7. Temporary Works
100% of the cost of temporary asphalt sidewalks, roads, paths, swales along the frontage abutting arterial or primary collectors where installation in ultimate location is deemed premature;
R-6.8. Traffic Signals at Private Streets
Traffic signal installations at all private entrances and at public entrances which do not meet MTO warrants;
City of London March 28, 2014 Development Finance

R-6.9. Other Works Any other services, removals, relocations, etc., required including but not limited to, utility relocation, sidewalk alterations, and curb cuts;
R-6.10. Restoration and Damage
Restoration of any utility cuts, and or damage created by construction activities and /or construction traffic in and out of the development. including but not limited to daily removal of mud tracking, daily dust suppression, milling and paving of deteriorated asphalt caused by construction traffic, grading of gravel shoulders to remove rutting caused by construction traffic;
R-6.11. Noise Attenuation Measures
All noise berms, window streets, fences and privately maintained noise walls; R-6.12. Grading and BMPs
Grading elements such as: swales, ditches, best management practices, (BMPs) and any other feature to address over land flow routes needs created by the development’s grading;
R-6.13. Paths and Walkways
Pedestrian paths, walkways, bridges, tunnels, including the related lighting and signage (Note: Parkways are constructed by the City and are specifically provided in the Development Charges Background Study);
R-6.14. Utility Upgrades
The costs related to the upgrading of any utility plant, or the relocation of the same, unless necessitated by the roadwork;
R-6.15. Relocation and Replacement Costs
The relocation and/or replacement costs of any encroachment on the City’s road allowance or easement including but not limited to hedges, sprinklers systems and fences;
R-6.16. Street Lighting
Street lighting at intersections with existing roads where required by the development agreement.
City of London March 28, 2014 Development Finance
Appendix B
Strategic Priorities & Policy Report
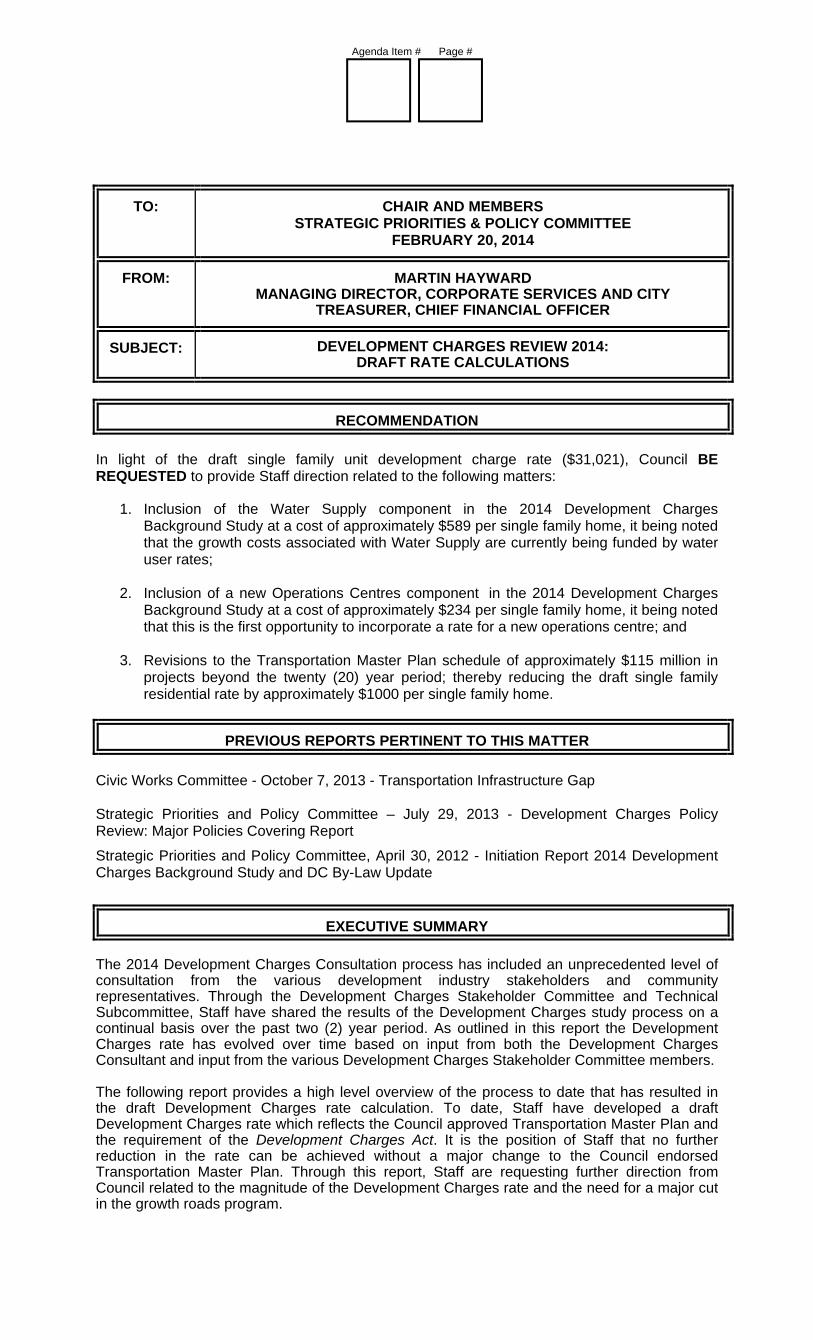
Agenda Item # Page #
TO: CHAIR AND MEMBERS STRATEGIC PRIORITIES & POLICY COMMITTEE
FEBRUARY 20, 2014
FROM: MARTIN HAYWARD MANAGING DIRECTOR, CORPORATE SERVICES AND CITY
TREASURER, CHIEF FINANCIAL OFFICER
SUBJECT: DEVELOPMENT CHARGES REVIEW 2014: DRAFT RATE CALCULATIONS
RECOMMENDATION
In light of the draft single family unit development charge rate ($31,021), Council BE REQUESTED to provide Staff direction related to the following matters:
1. Inclusion of the Water Supply component in the 2014 Development Charges Background Study at a cost of approximately $589 per single family home, it being noted that the growth costs associated with Water Supply are currently being funded by water user rates;
2. Inclusion of a new Operations Centres component in the 2014 Development Charges Background Study at a cost of approximately $234 per single family home, it being noted that this is the first opportunity to incorporate a rate for a new operations centre; and
3. Revisions to the Transportation Master Plan schedule of approximately $115 million in projects beyond the twenty (20) year period; thereby reducing the draft single family residential rate by approximately $1000 per single family home.
PREVIOUS REPORTS PERTINENT TO THIS MATTER
Civic Works Committee - October 7, 2013 - Transportation Infrastructure Gap Strategic Priorities and Policy Committee – July 29, 2013 - Development Charges Policy Review: Major Policies Covering Report
Strategic Priorities and Policy Committee, April 30, 2012 - Initiation Report 2014 Development Charges Background Study and DC By-Law Update
EXECUTIVE SUMMARY
The 2014 Development Charges Consultation process has included an unprecedented level of consultation from the various development industry stakeholders and community representatives. Through the Development Charges Stakeholder Committee and Technical Subcommittee, Staff have shared the results of the Development Charges study process on a continual basis over the past two (2) year period. As outlined in this report the Development Charges rate has evolved over time based on input from both the Development Charges Consultant and input from the various Development Charges Stakeholder Committee members. The following report provides a high level overview of the process to date that has resulted in the draft Development Charges rate calculation. To date, Staff have developed a draft Development Charges rate which reflects the Council approved Transportation Master Plan and the requirement of the Development Charges Act. It is the position of Staff that no further reduction in the rate can be achieved without a major change to the Council endorsed Transportation Master Plan. Through this report, Staff are requesting further direction from Council related to the magnitude of the Development Charges rate and the need for a major cut in the growth roads program.

Agenda Item # Page #
Staff are also requesting direction on two other service components – Water Supply and Operations Centre rate.
BACKGROUND
London’s 2014 Development Charges Consultation Process: The Most Comprehensive Process in Ontario? The 2014 Development Charges Consultation Process has included an unprecedented level of consultation with development industry stakeholders and community representatives appointed to the External Stakeholder Committee. A brief summary of the process to date is outlined below:
Sixteen (16) Development Charges Stakeholder Committee Meetings (average duration 2 hours) including, at most meetings, 4 Managing Directors.
Seven (7) Meditation/Facilitation meetings related to major changes in Development Charge (DC) policies.
Eight (8) Development Charges Stakeholder Committee - Technical Sub-committee meetings (average duration 2 hours) including engineering staff including Directors and Division Managers.
Nine (9) Reports to the Strategic Priorities and Policy Committee to date on Development Charges By-law and Background Studies matters, and
Many other offline meetings to promote understanding and to receive opinions.
Staff have worked closely with the various stakeholders and ensured that they have been heard and their comments reflected in the preparation of the Background Study while making certain that the requirements of the Development Charges Act are satisfied. The consultation process will continue until the point that the final DC By-law is passed by Council. During the December 2013 and February 2014 Development Charges Stakeholder committee meetings draft Development Charges were presented to the various stakeholders and these calculations were provided for comment. The following section will provide a discussion of the calculation process to date and discuss the proposed strategy for moving forward.
DISCUSSION
Draft Rate Calculations Municipalities in Ontario use legislation that allows them to recover growth related costs through Development Charges. The DC legislation in Ontario requires that municipal Development Charge By-laws be reviewed every five (5) years at a minimum. The City must also address possible changes to its growth financing policy, to ensure our policies on sharing of growth costs are prudent. Over the last two (2) years City Staff and the City’s appointed master servicing studies consultants (AECOM and Delcan) have developed a comprehensive twenty (20) year servicing strategy for growth in London based on the Council approved growth forecast. This servicing strategy includes a mixture of green-field and infill/intensification related growth servicing projects. Projects that serve community growth and industrial areas have been identified. The costs related to the various servicing projects were then consolidated and provided for the basis of the draft Development Charges calculations. Additionally, growth infrastructure needs for Fire, Police, Transit, Libraries and Parks & Recreation have been prepared by City and local board staff for inclusion in the DC rate. Consideration for Additional DC Rate Components Council provided staff direction in April 2012 to consider including various additional components in the 2014 Development Charges Rate to address future growth costs that at present lack DC recovery. Having undertaken research of the rate components of various other municipalities in Ontario, two rates (Water Supply and Operations Centres) appear to be relatively common in the DC rates of other municipalities. Staff have obtained growth-related capital needs, applied adjustments and determined net

Agenda Item # Page #
eligible costs.1 The draft calculated rates are as follows:
Water Supply: $589 per single family home. Operations Centres: $234 per single family home.
Draft Calculation Since November of 2013, City Staff have been collecting the relevant information in order to calculate the 2014 Development Charges rates. As part of the Development Community engagement process, draft rate values have been provided to the Development Charges Stakeholder Committee for comment. The figure below outlines that various iterations of the draft calculation. For simplicity the single family residential rate has been used for comparative purposes.
A variety of factors have impacted the reduction of the DC rate since the “Preliminary Rate” calculation prepared in November. These factors included:
Including an assumption that Provincial and Federal funding for Bus Rapid Transit works will be received.
1 For Operations Centres, 10 year historic service standard information has been prepared to comply with the requirements of the Development Charges Act.
Figure 1: Development Charges Draft Single Family Rate Comparison.

Agenda Item # Page #
Feedback from the London Development Institute regarding the following issues:
o A substantially higher benefit to existing cost (tax supported cost) for several project which rectify long-term transportation constriction points;
o A change from the 2009 methodology for calculating the post period benefits for major roads projects.
o Consideration of post period benefit for Bus Rapid Transit road works;
o Change to the benefit to existing methodology for two lane arterial roadways.
o Increase in Wastewater Treatment Plant benefit to existing cost (sewer rate supported cost) and post period benefit, and
o Deferral of several Stormwater Management Facilities.
o Providing for a 7-year collection for all remaining Urban Works Reserve Fund liabilities.
It should be noted that it is the position of City Staff that the suggested changes align with the provisions of the Development Charges Act. The most recent draft rate is summarized in Table 1:
Table 1: Draft Development Charges Calculation (as of February 6, 2014)
Single Family Rate Commercial
(per m2
)
Institutional
(per m2
)
Hard Services $27,853 $359 $148
Soft Services $3,167 $15 $6
Total $31,021 $374 $154
Draft Rate Calculation Analysis A chart and table outlining the relative changes of the proposed Development Charges rate from the current rate has been included as Appendix ‘A’. Take particular note that the table highlights a portion of the rate that covers the collection of the Urban Works Reserve Fund Retirement funding and the move of work currently funded by the Urban Works Reserve Fund to the City Services Reserve Fund.
a) Deferral of 2009 Transportation Program
As shown in the table the Roads component of the rate has increased considerably over previous Development charge rate. This is primarily the result of the deferral of transportation works as part of the 2009 Development Charges OMB settlement and the increased program needs outlined in the Council adopted Transportation Master Plan. These impacts were discussed in a recent report to the October 7, 2013 meeting of the Civic Works Committee titled “Transportation Infrastructure Gap” noting specifically the discussion regarding growth transportation infrastructure.
b) Inflationary Increase in Infrastructure Costs
The current magnitude of the increase in the overall single family rate is 31%. As a key deliverable of the hard services growth studies the inflationary increase in costs from 2009 to 2014 was calculated. This calculation was based on the analysis of tenders from London and the surrounding area. The master planning consultants found that this increase was 22% (4% per year compounded) over the 5 year period. As such, a substantial portion of the increase in the draft Development Charges rate is attributable solely to increasing cost of hard infrastructure construction.
c) Wastewater Treatment Servicing Strategy
The table shows no net change in the sanitary sewerage component of the rate; however, when the substantial inflationary impacts are considered the overall drop in the wastewater rate is approximately 22%. This is primarily due to a revised treatment servicing strategy which intends to maximize the use of capacity at the existing plants and in the existing conveyance system while deferring the need for large scale projects treatment project (Southside Pollution Control Plant).
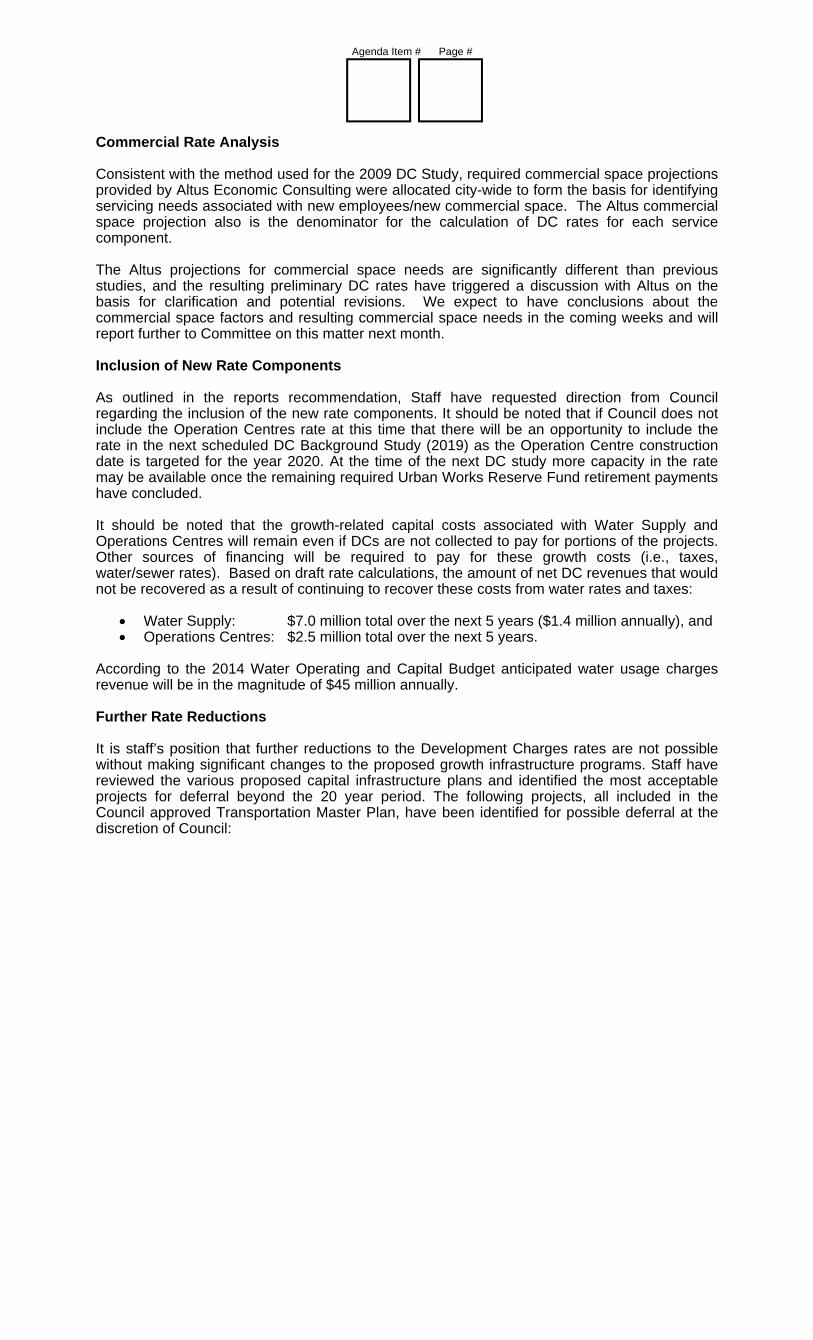
Agenda Item # Page #
Commercial Rate Analysis Consistent with the method used for the 2009 DC Study, required commercial space projections provided by Altus Economic Consulting were allocated city-wide to form the basis for identifying servicing needs associated with new employees/new commercial space. The Altus commercial space projection also is the denominator for the calculation of DC rates for each service component. The Altus projections for commercial space needs are significantly different than previous studies, and the resulting preliminary DC rates have triggered a discussion with Altus on the basis for clarification and potential revisions. We expect to have conclusions about the commercial space factors and resulting commercial space needs in the coming weeks and will report further to Committee on this matter next month. Inclusion of New Rate Components As outlined in the reports recommendation, Staff have requested direction from Council regarding the inclusion of the new rate components. It should be noted that if Council does not include the Operation Centres rate at this time that there will be an opportunity to include the rate in the next scheduled DC Background Study (2019) as the Operation Centre construction date is targeted for the year 2020. At the time of the next DC study more capacity in the rate may be available once the remaining required Urban Works Reserve Fund retirement payments have concluded. It should be noted that the growth-related capital costs associated with Water Supply and Operations Centres will remain even if DCs are not collected to pay for portions of the projects. Other sources of financing will be required to pay for these growth costs (i.e., taxes, water/sewer rates). Based on draft rate calculations, the amount of net DC revenues that would not be recovered as a result of continuing to recover these costs from water rates and taxes:
Water Supply: $7.0 million total over the next 5 years ($1.4 million annually), and Operations Centres: $2.5 million total over the next 5 years.
According to the 2014 Water Operating and Capital Budget anticipated water usage charges revenue will be in the magnitude of $45 million annually. Further Rate Reductions It is staff’s position that further reductions to the Development Charges rates are not possible without making significant changes to the proposed growth infrastructure programs. Staff have reviewed the various proposed capital infrastructure plans and identified the most acceptable projects for deferral beyond the 20 year period. The following projects, all included in the Council approved Transportation Master Plan, have been identified for possible deferral at the discretion of Council:

Agenda Item # Page #
Project Limits Timing Cost($ Millions)
Fanshawe Park Road Adelaide Street to Highbury Avenue, 4-6 lanes 2029 $11.6 M
Fanshawe Park Road Phase 2 - Richmond to Wonderland, 4-6 lanes 2032
$17.2 M
Wonderland Road Phase 3 - Sarnia to Fanshawe, 4-6 lanes 2033 $16.9 M
Wonderland Road Phase 2 - Commissioners to Southdale, 4-6 lanes 2022 $8.1 M
Wonderland Road Phase 3 - Southdale to Exeter, 4-6 lanes 2027 $10.3 M
Highbury Avenue Fanshawe Park Road to Oxford Street, 4-6 lanes 2030 $25.1 M
Byron Baseline Road Commissioners Road West to Colonel Talbot (3 to 4 through lanes with centre turn lane)
2029 $2.9M
Clarke Road VMP Extension to Fanshawe Park Road , 4-6 lanes
2033 $11.2 M
Gainsborough 973 Gainsborough to Aldersbrook (Arterial upgrade) 2023 $5.4M
Hyde Park North of Fanshawe Park Road (Arterial upgrade) 2028
$6.4M
Total Cost $115 M Appendix ‘B’ includes a figure highlighting the proposed projects in the 20 year program and the proposed removals. The overall financial impact of the deferrals is outlined below:
$1052 reduction in the single family home rate; $16 reduction in Commercial rate; and $7 reduction in Institutional rate.
The resulting draft rate calculation is as follows:
$29,969 (1) per single family home rate; $348 (1) per meter square Commercial rate; and $147 (1) per meter square Institutional rate. (1) Note these calculations are draft. The final calculation will be presented to Council at a
public meeting in April 2014. This rate does not include the Water Supply and Public Works Facilities components.
It is the opinion of staff that these deferrals can be made with tolerable impacts on the overall City Transportation network. As such Staff seeks direction on this issue from Council. Comparison with other Municipalities Many municipalities are currently going through Development Charges Review process. Of the municipalities that have updated their rates in the last year the average increase has been on the order of 25%. Appendix ‘C’ Figure C1 and C2 “Development Charges Inter-municipal Comparison” provides information on how Development Charges fees related to the single family rate compare to those of other municipalities. The following are notable:
As shown on the figure several components have been broken out for comparison purposes. For example, the City of London rate includes funding for Major Stormwater Management works within its Development Charges rate; while in many other municipalities this cost is directly borne by the developer. In addition, when comparing the City of London to smaller area municipalities the road component of the City charge has been highlighted separately.
As would be expected to be the case, small municipalities have a very small road
/
"-
DO component of their rate as they have very few road widenings triggered by growth. As the City of London has a more complex transportation network the roads rate is substantially larger. A large roads component of the rate is consistent with other major cities.
• Through this analysis it was determined that the amount of the proposed draft Development Charges rate is consistent with the charges levied by other municipalities.
Next Steps
The following step will follow upon the direction of Council on the recommendations discussed above:
• Finalize the engineering master planning studies and report to the Civic Works Committee.
• Finalize the Development Charges Background Study, develop a new Development Charges Bylaw and present back to the Strategic Priorities and Policy Committee in April.
II CONCLUSION
The Development Charges policy framework discussed above reflects a collaborative effort between multiple stakeholders undertaken over the last two years. It is staff's opinion that the agreed upon Development Charges policy principles are a substantial improvement over London's previous Development Charges framework and aligns London's policies with those of Ontario's other major cities. Staff will continue to work with and consult with the Development Community over the coming months to ensure the DC charge reflects the infrastructure needed to provide for the anticipated growth without compromise to the City's future financial sustainability.
Acknowledgements
The Development Charges draft calculation report was completed with assistance from Environmental and Engineering Services and input form the Development Charges Stakeholder Committee.
PREPARED BY: SUBMITTED BY:
H� p,t}:q �f. ====== --..
SCOTT G. MATHERS PETER CHRISTIAANS, C.A. MANAGER, DEVELOPMENT FINANCE DIRECTOR, DEVELOPMENT FINANCE
CONCURRED BY: RECOMMENDED BY:
v1L��� 8-. P. �"" �i BRAAM, P. ENG. MARTIN HAYWARD AGING DIRECTOR, MANAGING DIRECTOR, CORPORATE
IRONMENTAL & ENGINEERING SERVICES AND CITY SERVICES AND CITY ENGINEER TREASURER, CHIEF FINANCIAL OFFICER
February 10, 2014
cc. John Fleming, Managing Director, Planning and City Planner George Kotsifas, Managing Director, Development & Compliance Services & Chief Building Official Edward Soldo, Director- Roads and Transportation John Lucas, Director- Water and Wastewater
II

Agenda Item # Page #
Alan Dunbar, Manager of Financial Planning Attach/ Appendix ‘A’ Development Charges Rate Analysis:
Table A1 - Development Charges Rate Analysis Figure A1 - Development Charges Rate Analysis –Single Family Residential Rate
Appendix ‘B’ Transportation Master Plan Projects and Proposed Removals Appendix ‘C’ Development Charges Inter-municipal Comparison
Figure C1 - Development Charges Inter-municipal Comparison (Large Cities) Figure C2 - Development Charges Inter-municipal Comparison (Small Local
Municipalities) \\CLFILE1\users-x\pdda\Shared\DABU\Development Finance & Compliance\Development Finance\2014 DC Study\Committee Reports\SP&P Feb20'14\RPT-SPP-2014 DC Draft Rate Update-Feb7'14-Final Draft.docx
Agenda Item # Page #
APPENDIX ‘A’ Development Charges Rate Analysis

Draft 2014 Development C
harges Rates
E&OE
2/6/20
14
CSRF
Form
erly
UWRF
New
Rate
Fire Services
37.25
$
72.91
$
72.91
$
96%
1.71
$
1.38
$
‐19%
1.28
$
0.32
$
‐75%
Police Services
136.58
$
318.08
$
318.08
$
133%
0.12
$
0.43
$
247%
0.09
$
0.10
$
13%
Growth Studies
261.78
$
486.31
$
486.31
$
86%
2.74
$
8.69
$
217%
1.03
$
3.24
$
213%
Library Services
35.18
$
0.00
$
0.00
$
‐100
%‐
$
‐$
‐$
‐$
Parks &
Recreation
1,45
1.68
$
1,98
7.99
$
1,98
7.99
$
37%
‐$
‐‐
$
‐$
Transit Services
243.15
$
302.07
$
302.07
$
24%
4.19
$
4.41
$
5%1.77
$
2.51
$
42%
Roads S
ervices
9,71
0.56
$
14,525
.30
$
371.69
$
14,896
.99
$
50%
79.71
$
235.60
$
196%
52.85
$
102.52
$
94%
Sanitary Sew
erage
3,89
2.52
$
3,90
9.84
$
57.97
$
3,96
7.81
$
0%16
.29
$
20.04
$
23%
13.12
$
7.47
$
‐43%
Water Sup
ply
‐$
‐$
‐$
‐‐
$
‐$
‐$
‐$
Water Distrib
ution
980.89
$
1,21
7.73
$
1,21
7.73
$
24%
4.20
$
8.43
$
101%
2.80
$
2.62
$
‐6%
Major SWM
3,56
1.42
$
4,06
1.35
$
$1,321
.07
5,38
2.42
$
14%
34.22
$
65.12
$
90%
21.10
$
26.56
$
26%
Minor Roadw
orks
1,34
9.06
$
849.07
$
849.07
$
13.16
$
10.02
$
‐24%
7.35
$
2.73
$
‐63%
Minor San. Sew
ers
569.08
$
376.25
$
376.25
$
2.78
$
4.44
$
60%
1.54
$
1.21
$
‐22%
Minor Storm
Sew
ers
439.74
$
319.08
$
319.08
$
4.22
$
3.77
$
‐11%
2.60
$
1.02
$
‐61%
Minor SWM
1,04
7.11
$
843.80
$
843.80
$
11.09
$
11.91
$
7%6.87
$
3.53
$
‐49%
Total UWRF
rate(app
lied with
in Urban
Growth Area)
3,40
5.00
$
‐$
4,13
8.92
$
2,38
8.20
$
22%
31.26
$
30.13
$
18.36
$
8.49
$
Total CSRF rate (app
lied with
in Urban
Growth Area)
20,311
.00
$
26,881
.59
$
28,632
.32
$
143.18
$
344.11
$
94.05
$
145.34
$
TOTA
L RA
TE ‐ CSRF+UWRF
23,716
.00
$
26,881.59
$
4,138.92
$
31,020.52
$
31%
174.44
$
374.24
$
115%
112.41
$
153.83
$
37%
(1) Sub
ject to
Cou
ncil direction on
Water Sup
ply rate, O
peratio
ns Cen
tres ra
te, and
TMP de
ferrals.
City Services TotalUrban Works
Diffe
rence
(%)
Service Co
mpo
nent:
Draft 2
014
Jan 20
14
Single & Semi D
etached (p
er d
welling unit)
Commercial
(per sq. m
. of g
ross floor a
rea)
Institutional
(per sq. m
. of g
ross floor a
rea)
Jan 20
14Draft 2
014
Diffe
rence
(%)
Jan 20
14Draft 2
014
Diffe
rence
(%)
(1)
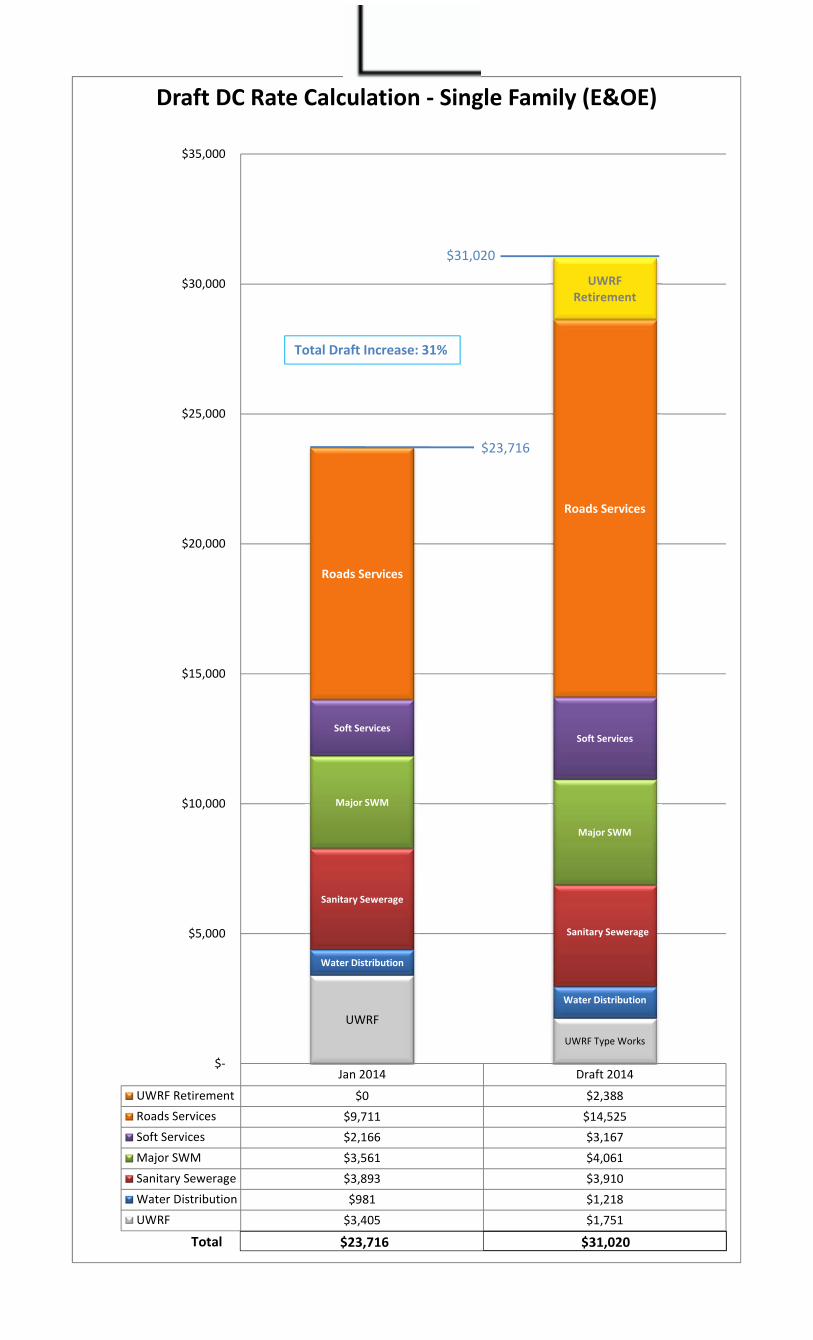
Jan 2014 Draft 2014
UWRF Retirement $0 $2,388Roads Services $9,711 $14,525Soft Services $2,166 $3,167Major SWM $3,561 $4,061Sanitary Sewerage $3,893 $3,910Water Distribution $981 $1,218UWRF $3,405 $1,751
UWRFUWRF Type Works
Water Distribution
Water Distribution
Sanitary Sewerage
Sanitary Sewerage
Major SWM
Major SWM
Soft ServicesSoft Services
Roads Services
Roads Services
UWRFRetirement
$‐
$5,000
$10,000
$15,000
$20,000
$25,000
$30,000
$35,000
Draft DC Rate Calculation ‐ Single Family (E&OE)
$31,020
Total $23,716 $31,020
Total Draft Increase: 31%
$23,716
Agenda Item # Page #
Appendix ‘B’ Transportation Master Plan Projects and
Proposed Removals

K:\T
ran
sp
orta
tio
n\G
IS
P
rojects\G
ro
wth
Infrastru
cture
P
rog
ra
ms\P
ro
gra
m R
evis
ion
\R
epo
rt_
Exis
ting
Pro
gra
mW
ith
Rem
ova
ls.m
xd
GROWTH INFRASTRUCTURE PROJECTS
PROPOSED PROGRAM
300 Dufferin Avenue,
PO Box 5035
London, Ontario
N6A 4L9
General Inquiries: 519-661-4500
www.london.ca
Tham
esRiv
er
North Thames River
SouthTha
mes River
k
k
k k
k
k
k
k
k
k
k
k
k
k k
k
k
k
Hy
de
P
ark
R
d
Oxford St W
Wharn
c
liffeRdS
Wellin
gto
n R
d
Dundas St
Trafalgar St
Cla
rk
e R
d
Cru
mlin
S
drd
Gore Rd
Com
m
issioners Rd E
Hwy 401
Hw
y 4
01
Hwy 402
Old
V
icto
ria R
d
Hig
hb
ury
Ave
S
Wellin
gto
n R
d S
Wh
ite O
ak R
d
Wilton G
rove Rd
Bradley Ave
Southdale Rd W
Wo
nd
erla
nd
R
d S
Dingman Dr
Westm
inster Dr
Scotland Dr
Manning Dr
Glanw
orth Dr
Harry White Dr
Co
lo
ne
l Ta
lb
ot R
d
Springbank Dr
Riverside Dr
Bo
ler R
d
Huron StSarnia Rd
Gainsborough Rd
Wo
nd
erla
nd
Rd
N
Fanshawe Park Rd E
Sunningdale Rd ESunningdale
Rd W
Fanshawe
Park Rd W
Fanshawe
Reservoir
Hig
hb
ury
Av
e S
Ad
ela
id
e S
t N
RichmondSt
Planning, Environmental & Engineering Services - Geomatics, February 07, 2014
Proposed Growth Infrastructure Program
k Intersection/ Interchange Projects
Major Road Projects
Projects Removed From Program0 1 2 3
Kilometres
I1:125,000
Agenda Item # Page #
Appendix ‘C’ Development Charges Inter-municipal
Comparison
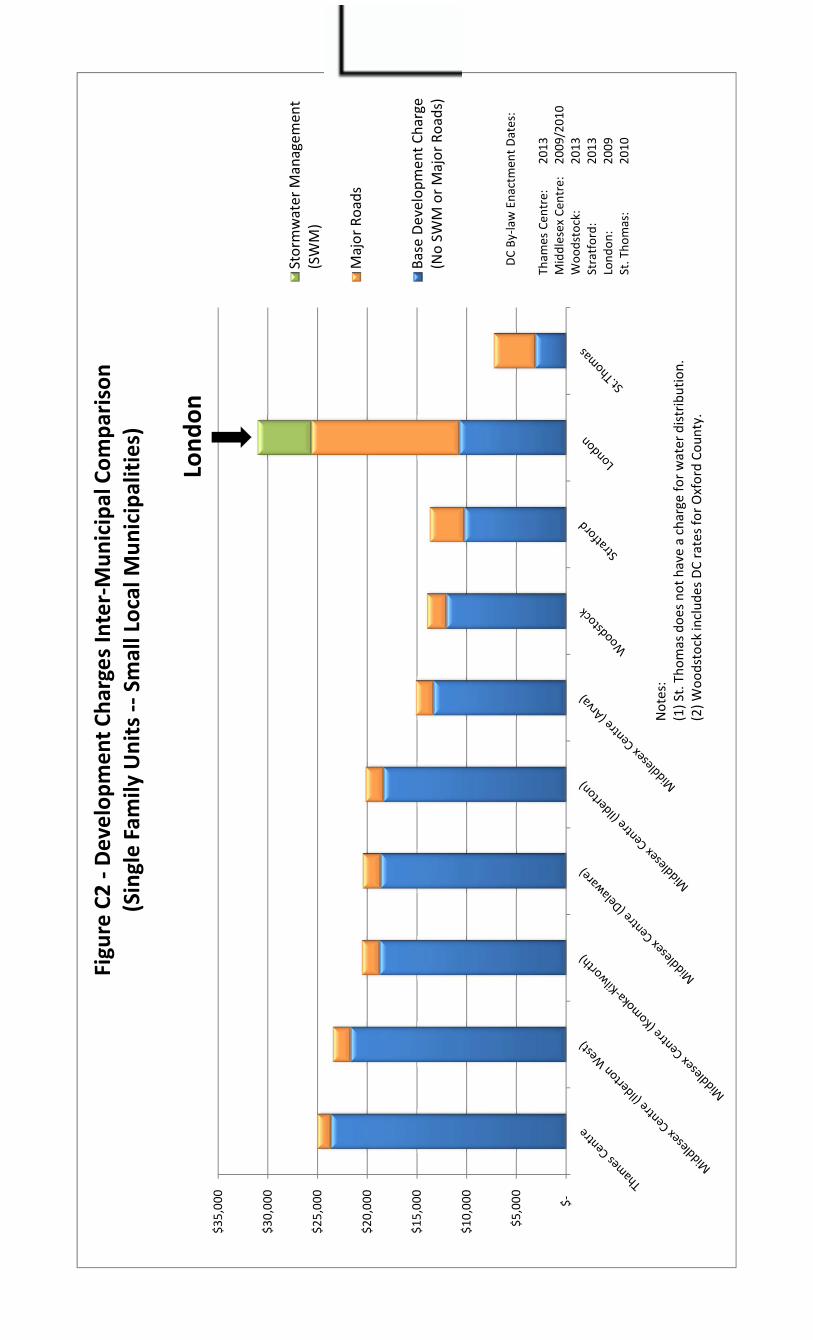
$‐
$5,00
0
$10
,000
$15
,000
$20
,000
$25
,000
$30
,000
$35
,000
Figure C2 ‐Developmen
t Charges Inter‐Municipal Comparison
(Single Fam
ily Units ‐‐Small Local M
unicipalities)
Stormwater M
anagem
ent
(SWM)
Major Roads
Base Develop
men
t Charge
(No SW
M or M
ajor Roads)
Notes:
(1) St. Thom
asdo
es not have a charge fo
r water distrib
ution.
(2) W
oodstock includ
es DC rates for Oxford Co
unty.
London
DC By‐law Enactmen
t Dates:
Tham
es Cen
tre:
2013
Middlesex
Centre:
2009/2010
Woo
dstock:
2013
Stratford:
2013
Lond
on:
2009
St. Tho
mas:
2010
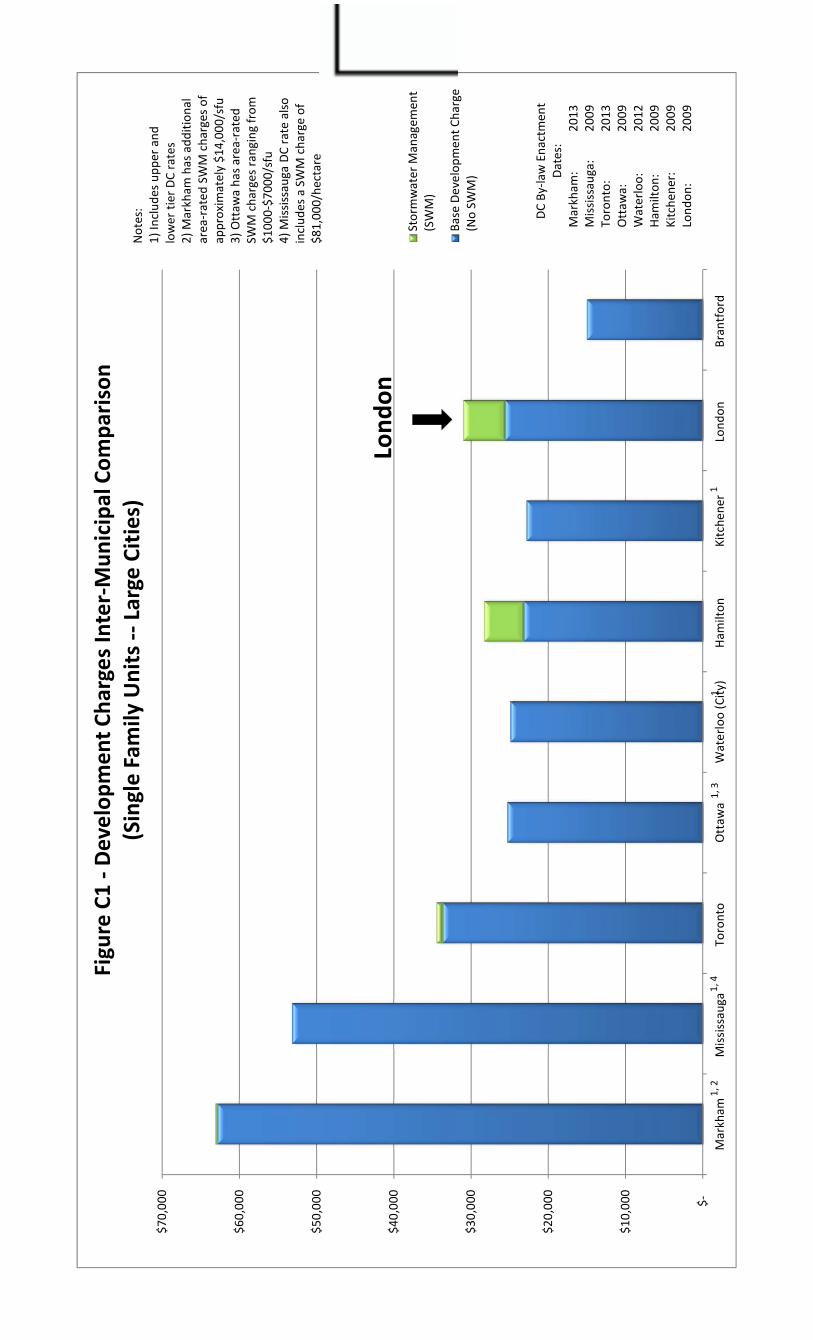
$‐
$10
,000
$20
,000
$30
,000
$40
,000
$50
,000
$60
,000
$70
,000
Markham
Mississauga
Toronto
Ottaw
aWaterloo (City
)Ham
ilton
Kitche
ner
Lond
onBrantford
Figure C1 ‐Developmen
t Charges Inter‐Municipal Comparison
(Single Fam
ily Units ‐‐Large Cities)
Stormwater M
anagem
ent
(SWM)
Base Develop
men
t Cha
rge
(No SW
M)
London
Notes:
1) In
clud
esup
per a
nd
lower tier DC rates
2) M
arkham
has add
ition
al
area‐rated
SWM charges of
approxim
ately $14,000/sfu
3) Ottaw
a has a
rea‐rated
SWM charges ra
nging from
$1000‐$7000/sfu
4) M
ississauga DC rate also
includ
es a SWM charge of
$81,00
0/he
ctare
DC By‐law Enactmen
t Da
tes:
Markham
:2013
Mississauga:
2009
Toronto:
2013
Ottaw
a:20
09Waterloo:
2012
Hamilton
:20
09Kitche
ner:
2009
Lond
on:
2009
1,2
1,4
1,3
11
Appendix C
Minor Roadworks Table
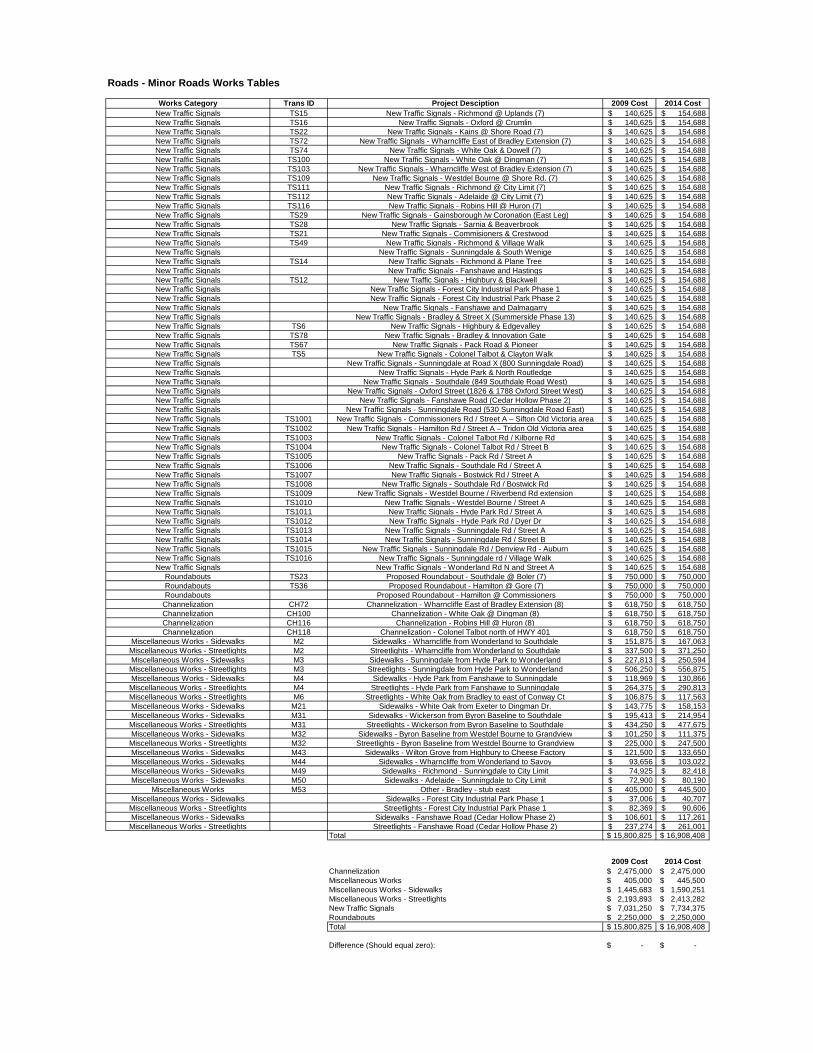
Roads - Minor Roads Works Tables
Works Category Trans ID Project Desciption 2009 Cost 2014 CostNew Traffic Signals TS15 New Traffic Signals - Richmond @ Uplands (7) $ 140,625 $ 154,688 New Traffic Signals TS16 New Traffic Signals - Oxford @ Crumlin $ 140,625 $ 154,688 New Traffic Signals TS22 New Traffic Signals - Kains @ Shore Road (7) $ 140,625 $ 154,688 New Traffic Signals TS72 New Traffic Signals - Wharncliffe East of Bradley Extension (7) $ 140,625 $ 154,688 New Traffic Signals TS74 New Traffic Signals - White Oak & Dowell (7) $ 140,625 $ 154,688 New Traffic Signals TS100 New Traffic Signals - White Oak @ Dingman (7) $ 140,625 $ 154,688 New Traffic Signals TS103 New Traffic Signals - Wharncliffe West of Bradley Extension (7) $ 140,625 $ 154,688 New Traffic Signals TS109 New Traffic Signals - Westdel Bourne @ Shore Rd. (7) $ 140,625 $ 154,688 New Traffic Signals TS111 New Traffic Signals - Richmond @ City Limit (7) $ 140,625 $ 154,688 New Traffic Signals TS112 New Traffic Signals - Adelaide @ City Limit (7) $ 140,625 $ 154,688 New Traffic Signals TS116 New Traffic Signals - Robins Hill @ Huron (7) $ 140,625 $ 154,688 New Traffic Signals TS29 New Traffic Signals - Gainsborough /w Coronation (East Leg) $ 140,625 $ 154,688 New Traffic Signals TS28 New Traffic Signals - Sarnia & Beaverbrook $ 140,625 $ 154,688 New Traffic Signals TS21 New Traffic Signals - Commisioners & Crestwood $ 140,625 $ 154,688 New Traffic Signals TS49 New Traffic Signals - Richmond & Village Walk $ 140,625 $ 154,688 New Traffic Signals New Traffic Signals - Sunningdale & South Wenige $ 140,625 $ 154,688 New Traffic Signals TS14 New Traffic Signals - Richmond & Plane Tree $ 140,625 $ 154,688 New Traffic Signals New Traffic Signals - Fanshawe and Hastings $ 140,625 $ 154,688 New Traffic Signals TS12 New Traffic Signals - Highbury & Blackwell $ 140,625 $ 154,688 New Traffic Signals New Traffic Signals - Forest City Industrial Park Phase 1 $ 140,625 $ 154,688 New Traffic Signals New Traffic Signals - Forest City Industrial Park Phase 2 $ 140,625 $ 154,688 New Traffic Signals New Traffic Signals - Fanshawe and Dalmagarry $ 140,625 $ 154,688 New Traffic Signals New Traffic Signals - Bradley & Street X (Summerside Phase 13) $ 140,625 $ 154,688 New Traffic Signals TS6 New Traffic Signals - Highbury & Edgevalley $ 140,625 $ 154,688 New Traffic Signals TS78 New Traffic Signals - Bradley & Innovation Gate $ 140,625 $ 154,688 New Traffic Signals TS67 New Traffic Signals - Pack Road & Pioneer $ 140,625 $ 154,688 New Traffic Signals TS5 New Traffic Signals - Colonel Talbot & Clayton Walk $ 140,625 $ 154,688 New Traffic Signals New Traffic Signals - Sunningdale at Road X (800 Sunningdale Road) $ 140,625 $ 154,688 New Traffic Signals New Traffic Signals - Hyde Park & North Routledge $ 140,625 $ 154,688 New Traffic Signals New Traffic Signals - Southdale (849 Southdale Road West) $ 140,625 $ 154,688 New Traffic Signals New Traffic Signals - Oxford Street (1826 & 1788 Oxford Street West) $ 140,625 $ 154,688 New Traffic Signals New Traffic Signals - Fanshawe Road (Cedar Hollow Phase 2) $ 140,625 $ 154,688 New Traffic Signals New Traffic Signals - Sunningdale Road (530 Sunningdale Road East) $ 140,625 $ 154,688 New Traffic Signals TS1001 New Traffic Signals - Commissioners Rd / Street A – Sifton Old Victoria area $ 140,625 $ 154,688 New Traffic Signals TS1002 New Traffic Signals - Hamilton Rd / Street A – Tridon Old Victoria area $ 140,625 $ 154,688 New Traffic Signals TS1003 New Traffic Signals - Colonel Talbot Rd / Kilborne Rd $ 140,625 $ 154,688 New Traffic Signals TS1004 New Traffic Signals - Colonel Talbot Rd / Street B $ 140,625 $ 154,688 New Traffic Signals TS1005 New Traffic Signals - Pack Rd / Street A $ 140,625 $ 154,688 New Traffic Signals TS1006 New Traffic Signals - Southdale Rd / Street A $ 140,625 $ 154,688 New Traffic Signals TS1007 New Traffic Signals - Bostwick Rd / Street A $ 140,625 $ 154,688 New Traffic Signals TS1008 New Traffic Signals - Southdale Rd / Bostwick Rd $ 140,625 $ 154,688 New Traffic Signals TS1009 New Traffic Signals - Westdel Bourne / Riverbend Rd extension $ 140,625 $ 154,688 New Traffic Signals TS1010 New Traffic Signals - Westdel Bourne / Street A $ 140,625 $ 154,688 New Traffic Signals TS1011 New Traffic Signals - Hyde Park Rd / Street A $ 140,625 $ 154,688 New Traffic Signals TS1012 New Traffic Signals - Hyde Park Rd / Dyer Dr $ 140,625 $ 154,688 New Traffic Signals TS1013 New Traffic Signals - Sunningdale Rd / Street A $ 140,625 $ 154,688 New Traffic Signals TS1014 New Traffic Signals - Sunningdale Rd / Street B $ 140,625 $ 154,688 New Traffic Signals TS1015 New Traffic Signals - Sunningdale Rd / Denview Rd - Auburn $ 140,625 $ 154,688 New Traffic Signals TS1016 New Traffic Signals - Sunningdale rd / Village Walk $ 140,625 $ 154,688 New Traffic Signals New Traffic Signals - Wonderland Rd N and Street A $ 140,625 $ 154,688
Roundabouts TS23 Proposed Roundabout - Southdale @ Boler (7) $ 750,000 $ 750,000 Roundabouts TS36 Proposed Roundabout - Hamilton @ Gore (7) $ 750,000 $ 750,000 Roundabouts Proposed Roundabout - Hamilton @ Commissioners $ 750,000 $ 750,000
Channelization CH72 Channelization - Wharncliffe East of Bradley Extension (8) $ 618,750 $ 618,750 Channelization CH100 Channelization - White Oak @ Dingman (8) $ 618,750 $ 618,750 Channelization CH116 Channelization - Robins Hill @ Huron (8) $ 618,750 $ 618,750 Channelization CH118 Channelization - Colonel Talbot north of HWY 401 $ 618,750 $ 618,750
Miscellaneous Works - Sidewalks M2 Sidewalks - Wharncliffe from Wonderland to Southdale $ 151,875 $ 167,063 Miscellaneous Works - Streetlights M2 Streetlights - Wharncliffe from Wonderland to Southdale $ 337,500 $ 371,250 Miscellaneous Works - Sidewalks M3 Sidewalks - Sunningdale from Hyde Park to Wonderland $ 227,813 $ 250,594 Miscellaneous Works - Streetlights M3 Streetlights - Sunningdale from Hyde Park to Wonderland $ 506,250 $ 556,875 Miscellaneous Works - Sidewalks M4 Sidewalks - Hyde Park from Fanshawe to Sunningdale $ 118,969 $ 130,866 Miscellaneous Works - Streetlights M4 Streetlights - Hyde Park from Fanshawe to Sunningdale $ 264,375 $ 290,813 Miscellaneous Works - Streetlights M6 Streetlights - White Oak from Bradley to east of Conway Ct $ 106,875 $ 117,563 Miscellaneous Works - Sidewalks M21 Sidewalks - White Oak from Exeter to Dingman Dr. $ 143,775 $ 158,153 Miscellaneous Works - Sidewalks M31 Sidewalks - Wickerson from Byron Baseline to Southdale $ 195,413 $ 214,954 Miscellaneous Works - Streetlights M31 Streetlights - Wickerson from Byron Baseline to Southdale $ 434,250 $ 477,675 Miscellaneous Works - Sidewalks M32 Sidewalks - Byron Baseline from Westdel Bourne to Grandview $ 101,250 $ 111,375 Miscellaneous Works - Streetlights M32 Streetlights - Byron Baseline from Westdel Bourne to Grandview $ 225,000 $ 247,500 Miscellaneous Works - Sidewalks M43 Sidewalks - Wilton Grove from Highbury to Cheese Factory $ 121,500 $ 133,650 Miscellaneous Works - Sidewalks M44 Sidewalks - Wharncliffe from Wonderland to Savoy $ 93,656 $ 103,022 Miscellaneous Works - Sidewalks M49 Sidewalks - Richmond - Sunningdale to City Limit $ 74,925 $ 82,418 Miscellaneous Works - Sidewalks M50 Sidewalks - Adelaide - Sunningdale to City Limit $ 72,900 $ 80,190
Miscellaneous Works M53 Other - Bradley - stub east $ 405,000 $ 445,500 Miscellaneous Works - Sidewalks Sidewalks - Forest City Industrial Park Phase 1 $ 37,006 $ 40,707 Miscellaneous Works - Streetlights Streetlights - Forest City Industrial Park Phase 1 $ 82,369 $ 90,606 Miscellaneous Works - Sidewalks Sidewalks - Fanshawe Road (Cedar Hollow Phase 2) $ 106,601 $ 117,261 Miscellaneous Works - Streetlights Streetlights - Fanshawe Road (Cedar Hollow Phase 2) $ 237,274 $ 261,001
Total 15,800,825$ 16,908,408$
2009 Cost 2014 CostChannelization 2,475,000$ 2,475,000$ Miscellaneous Works 405,000$ 445,500$ Miscellaneous Works - Sidewalks 1,445,683$ 1,590,251$ Miscellaneous Works - Streetlights 2,193,893$ 2,413,282$ New Traffic Signals 7,031,250$ 7,734,375$ Roundabouts 2,250,000$ 2,250,000$ Total 15,800,825$ 16,908,408$
Difference (Should equal zero): -$ -$