transportation in the washington, dc area
TRANSCRIPT

Prepared by:
May 2016
Transportation in the Washington, DC Area Spring 2016 Washington MarkeTrak®

2191 Defense Highway Suite 401 Crofton, MD 21114 • 410-721-0500 • www.WBAresearch.com 1
Key Findings
Public Transportation pages 5-10
• Three-fourths (75%) of all Washington, DC area residents have either used public transportation in the past month (47%) or are likely to consider
doing so in the future (28%). pages 5-7
• Satisfaction with the region’s transportation system shows room for improvement. Only 29% of area residents are satisfied (rated 8-10 on a 0-10
scale), while 52% gave more neutral ratings of 4-7. page 8
• Support for increased government funding of public transportation is high—78% of Washington, DC area residents say they would be very or
somewhat likely to support an increase. Support is most pronounced among District of Columbia residents (58% very likely to support vs.
28%-38% of suburban residents). And, while it might not be surprising that transit users are more likely than non-users to be very likely to
support increased public transportation funding (50% vs. 24%), even the majority of non-users (72%) would at least be somewhat likely to
support an increase. page 9
• Maintaining existing roads and bridges (82% rated 8-10), as well as reducing traffic congestion by improving public transportation (73% rated 8-
10), are rated as the most important types of projects in which the region could invest. page 10
App-Based Transportation pages 12-19
• Among residents of the Washington, DC region, familiarity with app-based transportation companies (otherwise known as transportation network
companies, or TNCs) Uber and Lyft is driven primarily by the 18-34 year old age segment (88% familiar with Uber, 69% familiar with Lyft). page 12
• About one in five area residents have used an app-based transportation company to get to or from Metrobus, Metrorail or other public transit
(18%) or to Reagan National, Dulles or BWI Marshall Airports (20%). page 14
• District of Columbia residents are significantly more likely than their suburban counterparts to have taken any trips using an app-based
transportation company in the past month (57% vs. 23%-24%). They also average more trips per month than suburban riders (7.7 DC vs.
4.0-4.5 MD/VA/WV). page 15
• Taxi is most often the back up when app-based transportation is not available (44%). One-fifth, however, drive themselves (22%) or turn to public
transportation (21%). Page 18
• More than one-half (53%) of those who have used Uber or Lyft say they have encountered Surge/Prime Time pricing and chose to accept the
higher fare and take the trip anyway, while 12% opted out of the higher fare. page 19

2191 Defense Highway Suite 401 Crofton, MD 21114 • 410-721-0500 • www.WBAresearch.com 2
Key Findings
Airports pages 21-28
• Seven in ten area residents (70%) have taken a trip from Reagan National (48%), Dulles (42%) or BWI Marshall (31%) in the past 12 months.
Airport preference varies widely by specific area of residence and is driven primarily by location. pages 21-24
• Air travelers residing in the District of Columbia are most likely to consider Reagan National for a future flight (84% very likely); however, more
than four in ten are very likely to consider Dulles (46%) and/or BWI Marshall (42%). Suburban Maryland air travelers are most likely to consider
BWI Marshall (63% very likely). Northern Virginia/West Virginia suburban residents are equally likely to consider Dulles (54% very likely) and/or
Reagan National (53% very likely) in the future. pages 25-27
• Across the region, 50% of area residents say that the opening of the first phase of the Silver Line of Metro impacted their airport preference. The
greatest impact was among residents of the District of Columbia itself (65% impacted). page 28

2191 Defense Highway Suite 401 Crofton, MD 21114 • 410-721-0500 • www.WBAresearch.com 3
Washington MarkeTrak®
MarkeTrak® is a quarterly omnibus public opinion survey conducted by WBA Research.
The survey combines general interest questions with those of specific WBA clients who share the cost of the study to obtain
answers to critical questions quickly and inexpensively.
This Washington MarkeTrak® study was conducted in the Washington, DC metropolitan area through a random telephone
survey of 200 adult heads of household and 201 online respondents.
WBA Research is a full-service
market research firm located in
Crofton, MD. The company was
founded in 1987 with a focus on
providing high quality custom
research and responsive client
service. WBA conducts
qualitative (focus groups, in-depth
interviews, etc.) and quantitative
(mail, telephone, online, etc.)
research studies for a wide array
of clients.
Map by Bureau of Labor Statistics - Monthly Labor Review December 2006, Public Domain
Public Transportation
4

2191 Defense Highway Suite 401 Crofton, MD 21114 • 410-721-0500 • www.WBAresearch.com 5
Q: Which of the following public transportation services have you used in
the past month?
Base= Total Sample (n=401)
Multiple Responses Accepted, Top Mentions
47%42%
18%
3% 3% 3% 2% 1% 1% 1%
Any Metrorail Metrobus VRE PRTC MD MTA MARC DASH DCCirculator
Ride-OnBus
Close to one-half of the Washington, DC area residents surveyed have used any of the region’s public transportation services in the past month,
most often citing Metrorail.

2191 Defense Highway Suite 401 Crofton, MD 21114 • 410-721-0500 • www.WBAresearch.com 6
Q: How likely are you to consider using public transportation in the future?
Base= Those who have not used public transportation in the past month (n=212)
More than one-half of those who have not used public transportation in the past month (55%) say they are likely to consider doing so in the future.
This proportion is almost twice as high among 18-34 year olds as compared to those age 55 and older.
13%
17%
19%
17%
29%
35%
54%
38%
57%
47%
27%
45%
55+
35-54
18-34
Total
Very likely Somewhat likely Not very/at all likely Don't know/Refused

2191 Defense Highway Suite 401 Crofton, MD 21114 • 410-721-0500 • www.WBAresearch.com 7
Q: Which of the following public transportation services have you used in the past month?
Q: How likely are you to consider using public transportation in the future?
Base= Total Sample (n=401)
Among all Washington, DC area residents, three-fourths (75%) have either used public transportation in the past month (47%) or are likely to
consider using it in the future (28%).
Used in past month47%
Have not used but likely in
future28%
Have not used and not likely in
future24%
Don't know1%
2191 Defense Highway Suite 401 Crofton, MD 21114 • 410-721-0500 • www.WBAresearch.com 8
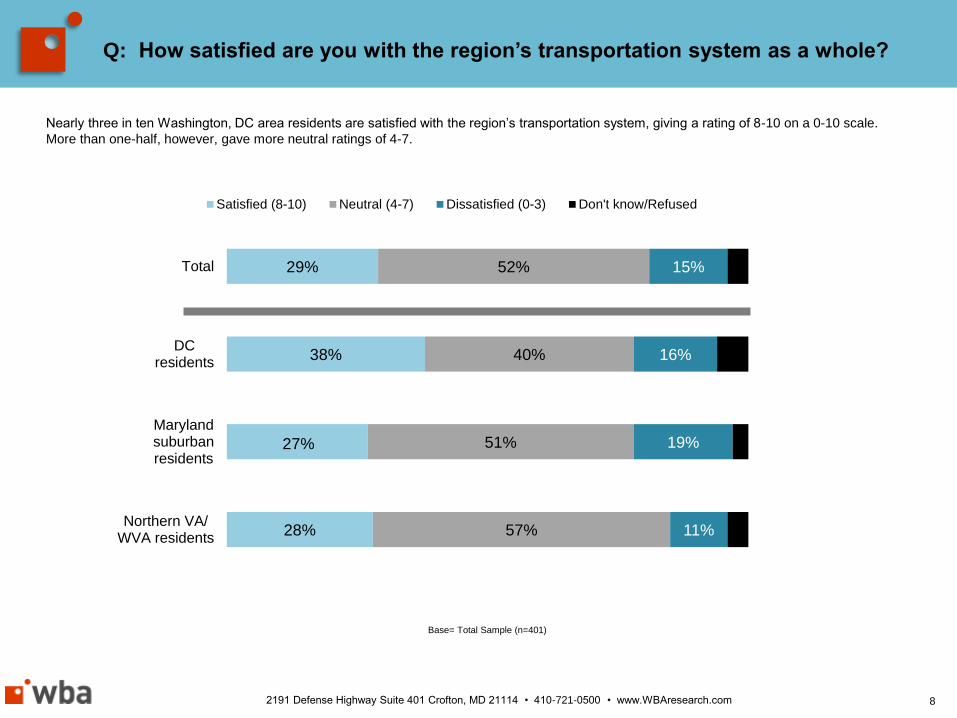
Q: How satisfied are you with the region’s transportation system as a whole?
Base= Total Sample (n=401)
Nearly three in ten Washington, DC area residents are satisfied with the region’s transportation system, giving a rating of 8-10 on a 0-10 scale.
More than one-half, however, gave more neutral ratings of 4-7.
28%
27%
38%
29%
57%
51%
40%
52%
11%
19%
16%
15%
Northern VA/WVA residents
Marylandsuburbanresidents
DCresidents
Total
Satisfied (8-10) Neutral (4-7) Dissatisfied (0-3) Don't know/Refused
2191 Defense Highway Suite 401 Crofton, MD 21114 • 410-721-0500 • www.WBAresearch.com 9
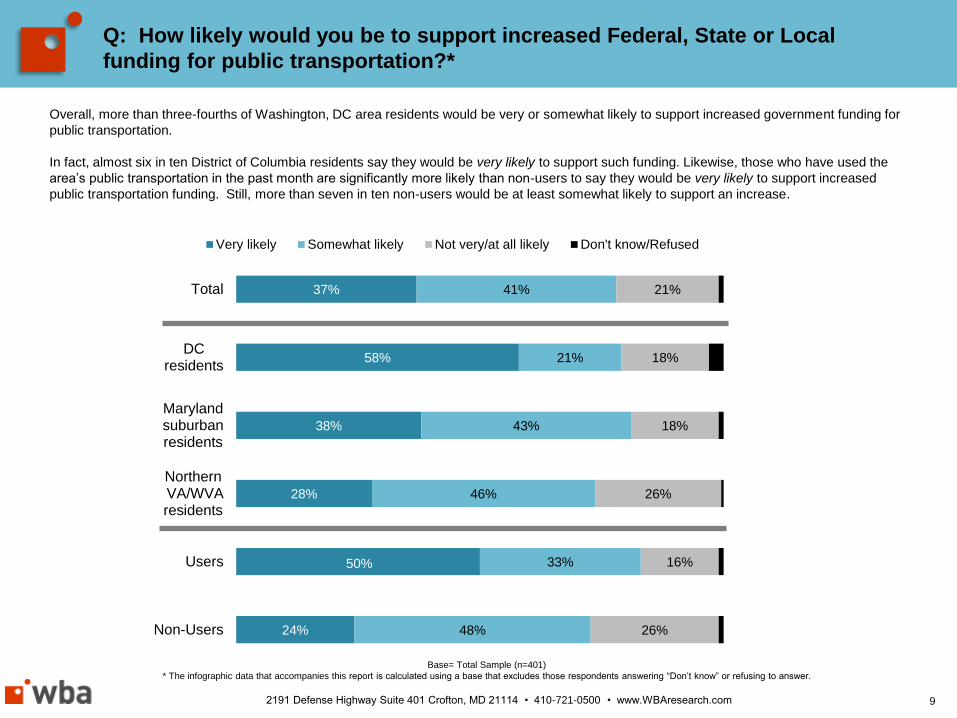
Q: How likely would you be to support increased Federal, State or Local
funding for public transportation?*
Base= Total Sample (n=401)
* The infographic data that accompanies this report is calculated using a base that excludes those respondents answering “Don’t know” or refusing to answer.
Overall, more than three-fourths of Washington, DC area residents would be very or somewhat likely to support increased government funding for
public transportation.
In fact, almost six in ten District of Columbia residents say they would be very likely to support such funding. Likewise, those who have used the
area’s public transportation in the past month are significantly more likely than non-users to say they would be very likely to support increased
public transportation funding. Still, more than seven in ten non-users would be at least somewhat likely to support an increase.
24%
50%
28%
38%
58%
37%
48%
33%
46%
43%
21%
41%
26%
16%
26%
18%
18%
21%
Non-Users
Users
Northern VA/WVAresidents
Marylandsuburbanresidents
DCresidents
Total
Very likely Somewhat likely Not very/at all likely Don't know/Refused

2191 Defense Highway Suite 401 Crofton, MD 21114 • 410-721-0500 • www.WBAresearch.com 10
Q: Please rate the importance of different types of projects that the region
could invest in.
Base= Total Sample (n=401)
Maintaining existing roads and bridges, as well as reducing traffic congestion by improving public transportation, are rated as the most important
types of projects that the region could invest in.
39%
55%
58%
73%
82%
48%
36%
36%
22%
16%
11%
8%
5%
3%
1%
Improving the region's airports
Reducing traffic congestion bybuilding new highways and adding
new highway lanes
Providing more transportationchoices by investing in better
public transportation
Reducing traffic congestion byimproving public transportation
infrastructure
Maintaining roads, bridges andother infrastructure that already
exist
Important (8-10) Neutral (4-7) Not important (0-3) Don't know/Refused

App-Based Transportation
11

2191 Defense Highway Suite 401 Crofton, MD 21114 • 410-721-0500 • www.WBAresearch.com 12
12%
32%
43%19%
37%
38%
40%
22%
15%29%
8%3%
Age
1% 7%12%
27%
37%32%
41%
39%
56%
31%
17%
Age
VeryFamiliar
SomewhatFamiliar
Know theName Only
NeverHeard Of
Don't Know
18-34
Q: How familiar are you with the app-based transportation company____?
Base= Total Sample (n=401)
Residents of the Washington, DC region report much greater familiarity with Uber as compared to Lyft. For both companies, familiarity is driven
primarily by the 18-34 year old age segment.
35-54 55+ 18-34 35-54 55+
2191 Defense Highway Suite 401 Crofton, MD 21114 • 410-721-0500 • www.WBAresearch.com 13
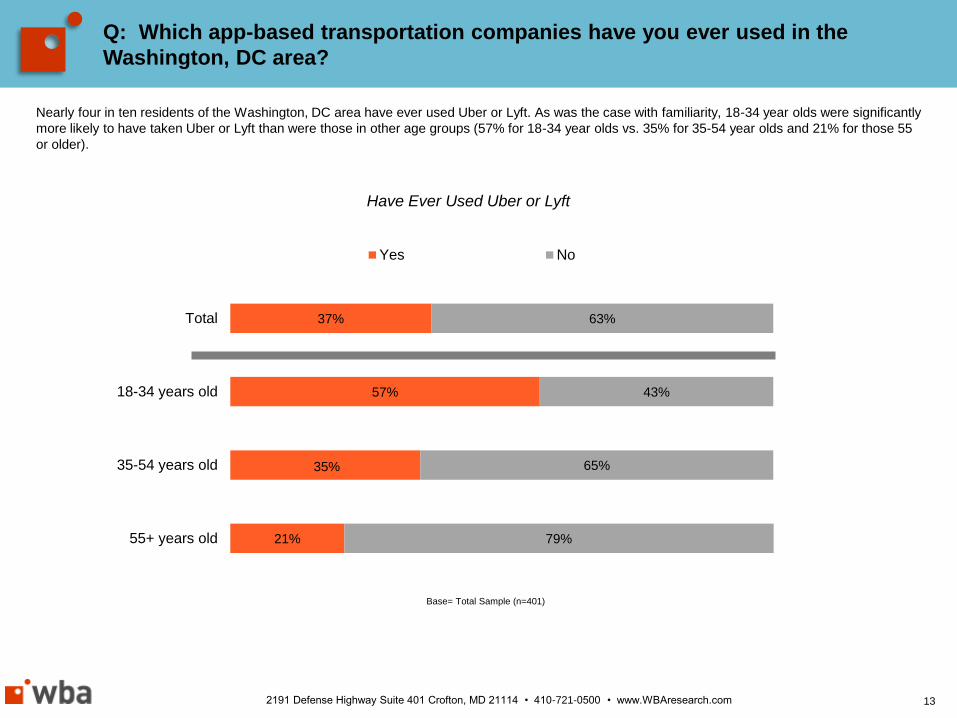
Q: Which app-based transportation companies have you ever used in the
Washington, DC area?
Nearly four in ten residents of the Washington, DC area have ever used Uber or Lyft. As was the case with familiarity, 18-34 year olds were significantly
more likely to have taken Uber or Lyft than were those in other age groups (57% for 18-34 year olds vs. 35% for 35-54 year olds and 21% for those 55
or older).
Base= Total Sample (n=401)
Have Ever Used Uber or Lyft
21%
35%
57%
37%
79%
65%
43%
63%
55+ years old
35-54 years old
18-34 years old
Total
Yes No

2191 Defense Highway Suite 401 Crofton, MD 21114 • 410-721-0500 • www.WBAresearch.com 14
Q: Which app-based transportation companies have you ever used?
Base= Total Sample (n=401)
53%
30%
17%
24%
6%2%
18-34 35-54 55+
0%
20%
40%
60%
80%
Uber Lyft
43%
25%
14%
26%
3% 3%
18-34 35-54 55+
0%
20%
40%
60%
80%
Uber Lyft
…to travel in the DC area?…to travel outside the DC area?
Regardless of whether their travel is inside or outside the Washington, DC area, younger residents are fueling the rise of app-based transportation.

2191 Defense Highway Suite 401 Crofton, MD 21114 • 410-721-0500 • www.WBAresearch.com
32%
15%
8%
34%
19%
7%
24%
14%
6%
18-34 35-54 55+
15
Q: Have you ever used an app-based transportation company to get to or
from…?
14%
20%
18%
Total
Base= Total Sample (n=401)
Across the region, about one in five residents have used an app-based transportation company to get to or from Metrobus, Metrorail or other public
transit or to Reagan National, Dulles or BWI Marshall Airports. Only slightly fewer have used a company like Uber or Lyft to get to a different airport.
Once again, the younger the resident, the more likely they are to have used app-based transportation for these reasons.
Metrobus or rail or
other public transit
National, Dulles or BWI Airports
A different airport

2191 Defense Highway Suite 401 Crofton, MD 21114 • 410-721-0500 • www.WBAresearch.com 16
77%
76%
43%
71%
18%
16%
27%
19%
3%
3%
14%
5%
2%
5%
16%
5%
Marylandsuburbanresidents
NorthernVA/WVAresidents
DC residents
Total
None 1-5 trips 6-10 trips 11+ trips
Q: On average, about how many times a month do you use an app-based
transportation company?
Average 7.7 trips
Average 4.5 trips
Average 4.0 trips
Residents of the District of Columbia are significantly more likely than their suburban counterparts to have taken any trips using an app-based
transportation company in the past month (57% vs. 23%-24%).
DC residents who have taken trips also average almost eight one-way trips per month, compared to between four and five among the area’s suburban
riders.
Base= Total Sample (n=401)
Average based among those who have used an app-based transportation company (n=116)
Average 5.2 trips
2191 Defense Highway Suite 401 Crofton, MD 21114 • 410-721-0500 • www.WBAresearch.com 17
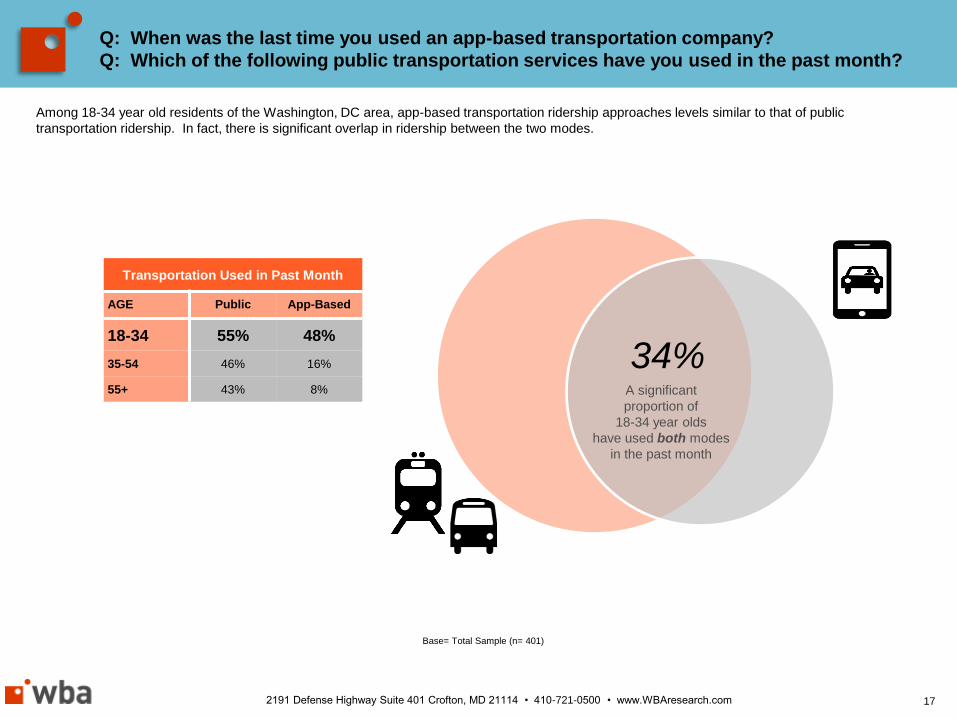
Q: When was the last time you used an app-based transportation company?
Q: Which of the following public transportation services have you used in the past month?
Base= Total Sample (n= 401)
Among 18-34 year old residents of the Washington, DC area, app-based transportation ridership approaches levels similar to that of public
transportation ridership. In fact, there is significant overlap in ridership between the two modes.
Transportation Used in Past Month
AGE Public App-Based
18-34 55% 48%
35-54 46% 16%
55+ 43% 8%
34%A significant
proportion of
18-34 year olds
have used both modes
in the past month

2191 Defense Highway Suite 401 Crofton, MD 21114 • 410-721-0500 • www.WBAresearch.com 18
Q: What was the purpose of the last trip you took using app-based
transportation?
Base= Those who have used app-based transportation in the past three months (n=81)
Work/School22%
Personal business/Medical
9%
Airport8%
Don't recall3%
Leisure (57%)
• Go to a bar/restaurant (28%)
• Shopping/Recreation/Sightseeing (25%)
• Go to a sporting event (4%)
Those who have used app-based transportation in the past three months most often said their last such trip was for leisure purposes (57%), while
almost one-fourth took their last trip to or from work, school, or for some other business related purpose.

2191 Defense Highway Suite 401 Crofton, MD 21114 • 410-721-0500 • www.WBAresearch.com 19
Base= Those who have used app-based transportation in the past three months (n=81)
Taken a taxi44%
Driven yourself22%
Used public transportation
21%
Gotten a ride from someone else
4%
Walked4%
Used a bicycle1%
Not made the trip
5%
Those who have used app-based transportation in the past three months most often said they would have taken a taxi if an app-based transportation
company had not been available for their last trip.
Q: If an app-based transportation company were not available, how would
you have made that trip?

2191 Defense Highway Suite 401 Crofton, MD 21114 • 410-721-0500 • www.WBAresearch.com 20
Yes,encountered Surge/Prime
Time pricing and accepted higher fare
53%
Yes, encountered but chose not to pay
12%Have not encountered
30%
Don't know/ Refused
5%
More than one-half of those who have used Uber or Lyft say they have encountered Surge or Prime Time pricing and chose to take the trip anyway,
accepting the higher fare.
Q: Have you encountered Surge/Prime Time pricing?
Q: Did you use Uber/Lyft despite Surge/Prime Time pricing?*
Used a taxi instead (5%)
Used a different app-based service (4%)
Used public transportation instead (2%)
Called a friend (1%)
Delayed trip (1%)
Base= Those who have used Uber or Lyft (n=81)
* The infographic data that accompanies this report is calculated using a base that includes only those who have encountered Surge/Prime Time pricing.
Yes,
encountered
Surge/Prime
Time pricing
66%

Airports
20
2191 Defense Highway Suite 401 Crofton, MD 21114 • 410-721-0500 • www.WBAresearch.com
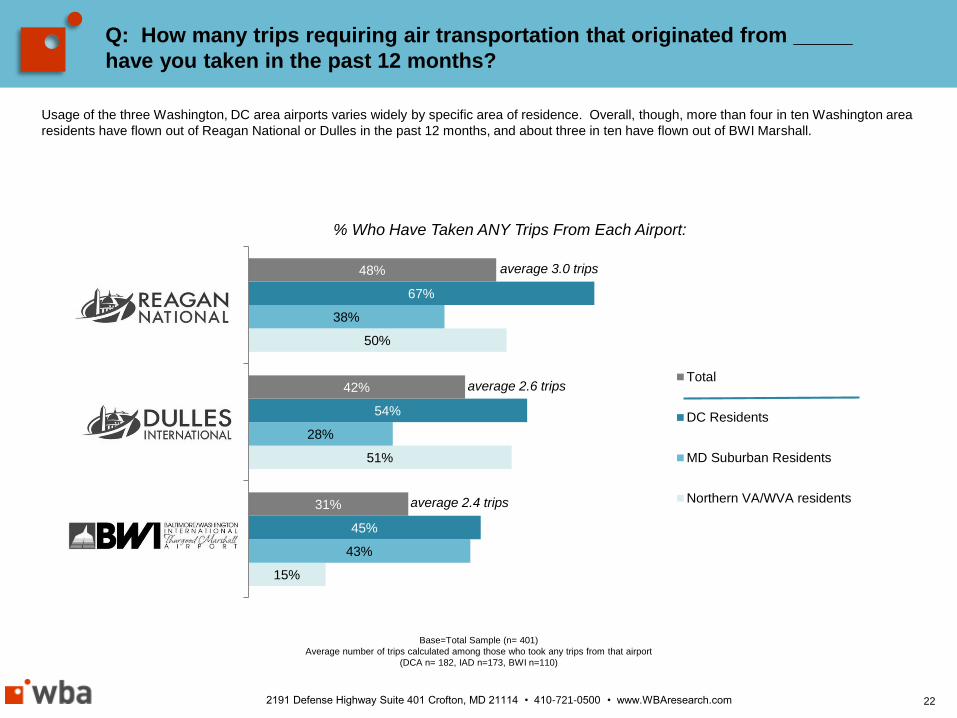
15%
51%
50%
43%
28%
38%
45%
54%
67%
31%
42%
48%
BWI
Dulles
National
% Who Have Taken ANY Trips From Each Airport:
Total
DC Residents
MD Suburban Residents
Northern VA/WVA residents
Base=Total Sample (n= 401)
Average number of trips calculated among those who took any trips from that airport
(DCA n= 182, IAD n=173, BWI n=110)
average 3.0 trips
average 2.6 trips
average 2.4 trips
Q: How many trips requiring air transportation that originated from _____
have you taken in the past 12 months?
22
Usage of the three Washington, DC area airports varies widely by specific area of residence. Overall, though, more than four in ten Washington area
residents have flown out of Reagan National or Dulles in the past 12 months, and about three in ten have flown out of BWI Marshall.

2191 Defense Highway Suite 401 Crofton, MD 21114 • 410-721-0500 • www.WBAresearch.com
Total
DC
Residents
MD
Suburban
Residents
Northern
VA/WVA
Residents
Took any trips from BWI,
National or Dulles70% 81% 65% 70%
Net: Used only one airport 29% 21% 29% 32%
BWI only 7% 1% 17% <1%
National only 10% 11% 6% 13%
Dulles only 12% 9% 6% 19%
Used multiple airports 40% 60% 35% 38%
Used all three airports 11% 25% 10% 8%
Took no trips 30% 19% 35% 30%
Base = Total Sample (n= 401)
23
Q: How many trips requiring air transportation that originated from _____
have you taken in the past 12 months?
While four in ten residents used more than one airport in the past 12 months, about three in ten used just one airport during this time.

2191 Defense Highway Suite 401 Crofton, MD 21114 • 410-721-0500 • www.WBAresearch.com
BWI21%
Dulles25%National
39%
Do Not Fly6%
Depends on Destination
7%
Q: Regardless of the airline, given a choice of taking a flight out of either
Dulles, National or BWI, which of these three airports would you prefer?
6%
49%
1%
7%12%
43%
75%
24%
39%
DC Residents MD SuburbanResidents
Northern VA/WVAresidents
BWI Dulles National
Total By Area of Residence
24
Airport preference from among the three Washington, DC area airports varies widely by specific area of residence. Overall, though, almost
four in ten Washington, DC area residents prefer Reagan National, and two in ten prefer Dulles or BWI Marshall.
Preferred Airport*
Base= Total Sample (n=401)
* The chart corresponding to this question from the infographic that accompanies this report is calculated using a
base that excludes those respondents who do not fly and those answering “Don’t know” or refusing to answer.

2191 Defense Highway Suite 401 Crofton, MD 21114 • 410-721-0500 • www.WBAresearch.com
BWI21%
Dulles25%National
39%
Do Not Fly6%
Depends on Destination
7%
Multiple Responses Accepted, Top Mentions
Why BWI is Preferred (n=80)
53% - Location
16% - Easy road access
13% - Familiar to me/Used to it
12% - Good parking facilities (Not specific)
8% - Less expensive airfare
7% - Less traffic
5% - Prefer specific airline/more airline choices
5% - Convenient (Not specific)
5% - Convenient bus, rail or taxi service
Why Dulles is Preferred (n=101)
58% - Location
13% - Easy road access
6% - Good parking facilities (Not specific)
5% - Familiar to me/Used to it
Why National is Preferred (n=155)
71% - Location
22% - Convenient bus, rail or taxi service
13% - Easy road access
7% - Convenient (Not specific)
6% - Less expensive airfare
5% - Smaller airport
Q: Why do you prefer to fly from _____?
25
After the primary influence of location, preference for each airport is driven by varying factors.
2191 Defense Highway Suite 401 Crofton, MD 21114 • 410-721-0500 • www.WBAresearch.com
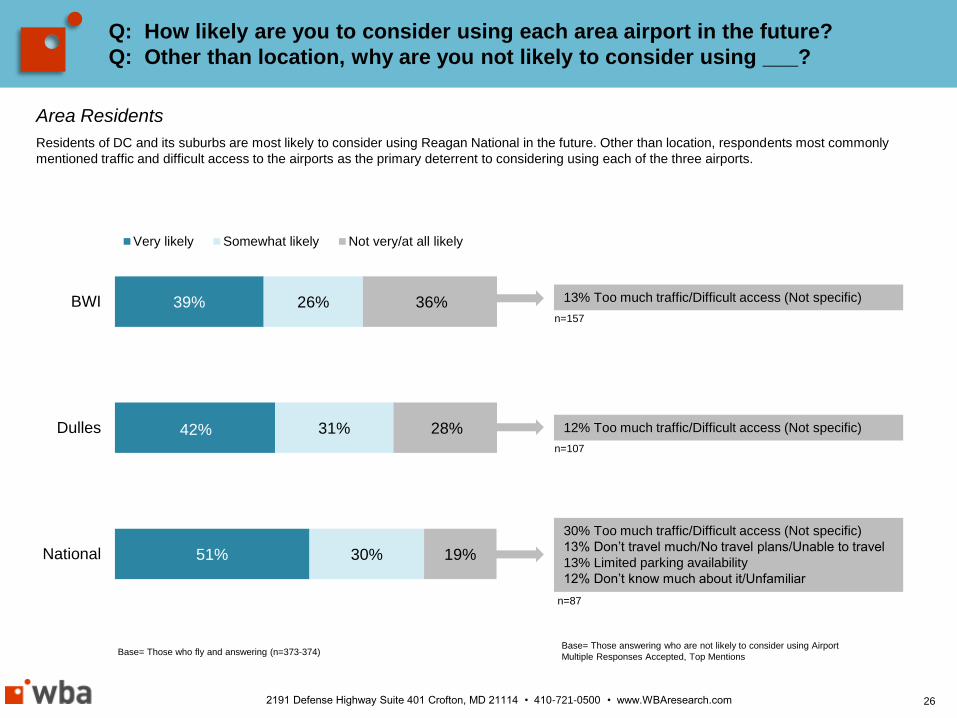
51%
42%
39%
30%
31%
26%
19%
28%
36%
National
Dulles
BWI
Very likely Somewhat likely Not very/at all likely
Base= Those who fly and answering (n=373-374)
n=107
n=87
Base= Those answering who are not likely to consider using Airport
Multiple Responses Accepted, Top Mentions
Q: How likely are you to consider using each area airport in the future?
Q: Other than location, why are you not likely to consider using ___?
26
13% Too much traffic/Difficult access (Not specific)
n=157
12% Too much traffic/Difficult access (Not specific)
30% Too much traffic/Difficult access (Not specific)
13% Don’t travel much/No travel plans/Unable to travel
13% Limited parking availability
12% Don’t know much about it/Unfamiliar
Area Residents
Residents of DC and its suburbs are most likely to consider using Reagan National in the future. Other than location, respondents most commonly
mentioned traffic and difficult access to the airports as the primary deterrent to considering using each of the three airports.

2191 Defense Highway Suite 401 Crofton, MD 21114 • 410-721-0500 • www.WBAresearch.com
84%
46%
42%
12%
23%
17%
4%
30%
40%
National
Dulles
BWI
Very likely Somewhat likely Not very/at all likely
Base= DC residents who fly and answering (n=57-58)
n=22*
n=5*
Base= Those answering who are not likely to consider using Airport
Multiple Responses Accepted, Top Mentions
*Caution: Small Base
Q: How likely are you to consider using each area airport in the future?
Q: Other than location, why are you not likely to consider using ___?
27
12% Inconvenient (Not specific)
n=28*
16% Too much traffic/Difficult access (Not specific)
11% Cost of flights
82% Don’t travel much/No travel plans/Unable to travel
18% Don’t like it/Heard bad things about it (Not specific)
Washington, DC Residents
Residents of the District of Columbia are most likely to consider using Reagan National in the future. Even when controlling for location, those not likely
to use BWI Marshall most often explained that it is inconvenient, while those not likely to use Dulles attribute it most often to traffic and/or the cost of
flights.

2191 Defense Highway Suite 401 Crofton, MD 21114 • 410-721-0500 • www.WBAresearch.com
37%
26%
63%
34%
37%
23%
29%
36%
14%
National
Dulles
BWI
Very likely Somewhat likely Not very/at all likely
13% Too much traffic/Difficult access (Not specific)
12% Don’t know much about it/Unfamiliar
12% Don’t travel much/No travel plans/Unable to travel
11% Experience with delayed flights
11% Too much traffic/Difficult access (Not specific)
34% Too much traffic/Difficult access (Not specific)
17% Limited parking availability
14% Don’t know much about it/Unfamiliar
10% Cost of flights
Base= Maryland Suburban residents who fly and answering (n=144-145)
Maryland Suburban Residents
Residents of the Maryland suburbs of Washington, DC are most likely to consider using BWI Marshall in the future.
Other than location, traffic and difficult access to the airports is the number one deterrent to considering using any of the three airports.
n=54
n=21*
n=46
Base= Those answering who are not likely to consider using Airport
Multiple Responses Accepted, Top Mentions
*Caution: Small Base
Q: How likely are you to consider using each area airport in the future?
Q: Other than location, why are you not likely to consider using ___?
28

2191 Defense Highway Suite 401 Crofton, MD 21114 • 410-721-0500 • www.WBAresearch.com
53%
54%
13%
33%
27%
31%
15%
18%
56%
National
Dulles
BWI
Very likely Somewhat likely Not very/at all likely
15% Too much traffic/Difficult access (Not specific)
27% Too much traffic/Difficult access (Not specific)
22% Don’t travel much/No travel plans/Unable to travel
17% Too congested/crowded
Base= Virginia residents who fly and answering (n=170-172)
n=31*
n=108
n=36*
Base= Those answering who are not likely to consider using Airport
Multiple Responses Accepted, Top Mentions
*Caution: Small Base
Q: How likely are you to consider using each area airport in the future?
Q: Other than location, why are you not likely to consider using ___?
29
19% Don’t travel much/No travel plans/Unable to travel
19% Cost of flights
12% Too much traffic/Difficult to access (Not specific)
Northern Virginia/West Virginia Residents
Residents of the Northern Virginia/West Virginia suburbs of Washington, DC are equally likely to consider using Reagan National and/or Dulles in the
future. Traffic and difficult access to the airport is the primary deterrent to likelihood of using BWI Marshall in the future.

2191 Defense Highway Suite 401 Crofton, MD 21114 • 410-721-0500 • www.WBAresearch.com
15%
17%
29%
18%
28%
35%
37%
32%
53%
42%
28%
44%
4%
5%
6%
5%
NorthernVA/WVAresidents
Marylandsuburbanresidents
DC residents
Total
Major Impact Minor Impact No Impact Don't know/Refused
Base= Those who used any airport (n=271)
Q: What impact has the opening of the first phase of the Silver Line of
Metro had on which airport you prefer?
30
Across the region, one-half of area residents say that the opening of the first phase of the Silver Line of Metro impacted their airport preference. The
greatest impact was among residents of the District of Columbia itself (65% impacted).

Appendix
29

2191 Defense Highway Suite 401 Crofton, MD 21114 • 410-721-0500 • www.WBAresearch.com
Steve Markenson
President
WBA Research
410-721-0500
Contact information
32
Renee Henley
Senior Vice President
WBA Research
410-721-0500
2191 Defense Highway Suite 401 Crofton, MD 21114 • 410-721-0500 • www.WBAresearch.com
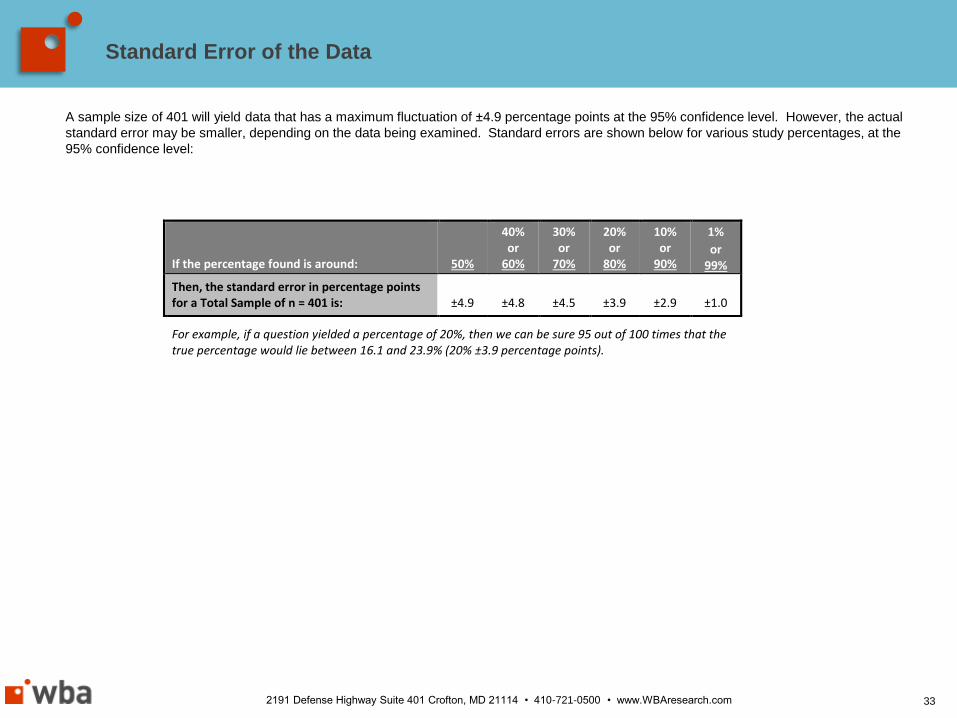
Standard Error of the Data
33
A sample size of 401 will yield data that has a maximum fluctuation of ±4.9 percentage points at the 95% confidence level. However, the actual
standard error may be smaller, depending on the data being examined. Standard errors are shown below for various study percentages, at the
95% confidence level:
If the percentage found is around:
50%
40% or
60%
30% or
70%
20% or
80%
10% or
90%
1%
or 99%
Then, the standard error in percentage points for a Total Sample of n = 401 is: ±4.9 ±4.8 ±4.5 ±3.9 ±2.9 ±1.0
For example, if a question yielded a percentage of 20%, then we can be sure 95 out of 100 times that the true percentage would lie between 16.1 and 23.9% (20% ±3.9 percentage points).