transportation research division - maine
TRANSCRIPT
. . . . . .. . . .
. . . . . . . . . .
Transportation Research Division
Technical Report 15-06
Experimental Evaluation and Design of Unfilled and Concrete-Filled FRP Composite Piles
Task 1 - Mechanical Properties of FRP Piles
Final Report – Task 1, October 2015
16 State House Station Augusta, Maine 04333

Technical Report Documentation Page 1. Report No. 2. 3. Recipient’s Accession No.
ME 15-06
4. Title and Subtitle 5. Report Date
Experimental Evaluation and Design of Unfilled and Concrete-Filled FRP Composite Piles Task 1 - Mechanical Properties of FRP Piles
October 2014
6.
7. Author(s) 8. Performing Organization Report No.
Dale Lawrence Roberto Lopez-Anido Thomas Sandford Keenan Goslin Xenia Rofes
AEWC Report Number 15‐9-1199
9. Performing Organization Name and Address 10. Project/Task/Work Unit No.
University of Maine – Advanced Structures and Composites Center
11. Contract © or Grant (G) No.
Contract # 20130731*535
12. Sponsoring Organization Name and Address 13. Type of Report and Period Covered
Maine Department of Transportation
14. Sponsoring Agency Code
15. Supplementary Notes
16. Abstract (Limit 200 words)
The overall goal of this project is the experimental evaluation and design of unfilled and concrete-filled FRP composite piles for load-bearing in bridges. This report covers Task 1, Mechanical Properties of FRP Piles. Mechanical and geotechnical properties of fiber reinforced polymer (FRP) piles driven at the Richmond-Dresden Bridge Site (Maine DOT PIN 12674) in August 2013 were determined using coupon level tests. These properties will be used to evaluate the behavior of FRP piles in load bearing applications.
17. Document Analysis/Descriptors 18. Availability Statement
Bridge piles, fiber reinforced polymer composites, mechanical properties
19. Security Class (this report) 20. Security Class (this page) 21. No. of Pages 22. Price
85
Technical Report
Mechanical Properties of FRP Piles
by
Dale Lawrence, Roberto Lopez-‐Anido1, Thomas Sandford,
Keenan Goslin and Xenia Rofes
Project: Experimental Evaluation and Design of Unfilled and Concrete-‐Filled FRP Composite Piles
Prepared for: Dale Peabody P.E.
Director of Transportation Research Maine Dept. of Transportation
16 State House Station Augusta, Maine 04333
October 9th, 2014
UMaine’s Advanced Structures and Composites Center Project Number 15-‐9-‐1199
1 Department of Civil and Environmental Engineering, University of Maine [email protected] Phone: (207) 581-‐2119
1
Report # 15-9-1199 MDOT
UMaine Advanced Structures and Composites Center Telephone: 207-581-2123 35 Flagstaff Rd FAX: 207-581-2074 University of Maine [email protected] www.composites.umaine.edu Orono, ME 04469
Table of Contents
1. EXECUTIVE SUMMARY ...................................................................................................................... 3
2. REFERENCES ..................................................................................................................................... 4
3. INTRODUCTION ................................................................................................................................ 5
4. MATERIALS AND SAMPLE DESCRIPTION ............................................................................................ 5
5. DATA ANALYSIS ................................................................................................................................ 6
6. TENSION ........................................................................................................................................... 6
7. COMPRESSION ................................................................................................................................. 8
8. SHEAR ............................................................................................................................................ 10
9. GLASS TRANSITION TEMPERATURE ................................................................................................. 12
10. SOIL-‐FRP FRICTION ....................................................................................................................... 15 10.1. GRAIN SIZE ANALYSIS ......................................................................................................................... 15 10.2. SPECIFIC GRAVITY .............................................................................................................................. 17 10.3. MAXIMUM AND MINIMUM DENSITY .................................................................................................... 17 10.4. ATTERBERG LIMITS ............................................................................................................................ 19 10.5. DIRECT SHEAR (SOIL-‐SOIL) .................................................................................................................. 20 10.6. INTERFACE FRICTION (SOIL-‐FRP) .......................................................................................................... 21
11. DISCUSSION .................................................................................................................................. 22
12. CONCLUSIONS .............................................................................................................................. 23
APPENDIX A: TENSION RESULTS ......................................................................................................... 26
APPENDIX B: COMPRESSION RESULTS ................................................................................................ 33
APPENDIX C: SHEAR RESULTS ............................................................................................................. 40
APPENDIX D: GLASS TRANSITION TEMPERATURE RESULTS ................................................................. 45
APPENDIX E: DIRECT SHEAR RESULTS ................................................................................................. 50
APPENDIX F: INTERFACE FRICTION RESULTS ....................................................................................... 68
2

Report # 15-9-1199 MDOT
UMaine Advanced Structures and Composites Center Telephone: 207-581-2123 35 Flagstaff Rd FAX: 207-581-2074 University of Maine [email protected] www.composites.umaine.edu Orono, ME 04469
1. Executive Summary
Representative fiber reinforced polymer (FRP) plates were tested at the coupon level to determine mechanical and geotechnical properties of FRP piles driven at the Richmond-‐Dresden bridge site in August 2013. Samples were tested in tension, compression, and shear. The resulting properties are presented in Table 1.
Table 1: Summary of Average Mechanical Properties of FRP Plates
Test Orientation of Properties
Ultimate Strength (ksi)
Ultimate Strain
(Microstrain)
Modulus (ksi)
Poisson’s Ratio
Longitudinal Tension X 76.9 2.56E+04 3.26E+03 0.31 (νxy)
Hoop Tension Y 25.3 2.27E+04 1.98E+03 ─
Longitudinal Compression X 72.0 -‐2.17E+04 3.67E+03 ─
Hoop Compression Y 34.7 -‐1.65E+04 2.14E+03 ─
In-‐Plane Shear XY 22.3 2.88E+04 8.49E+02 ─
The glass transition temperature was also determined using dynamic mechanical analysis. The resulting properties are presented in Table 2.
Table 2: Summary of Glass Transition Temperatures
Indicator of Glass Transition Temperature
Glass Transition Temperature (°C)
Onset Point of Storage Modulus 81.0 Peak of Loss Modulus 94.8 Peak of Tan Delta 116.6
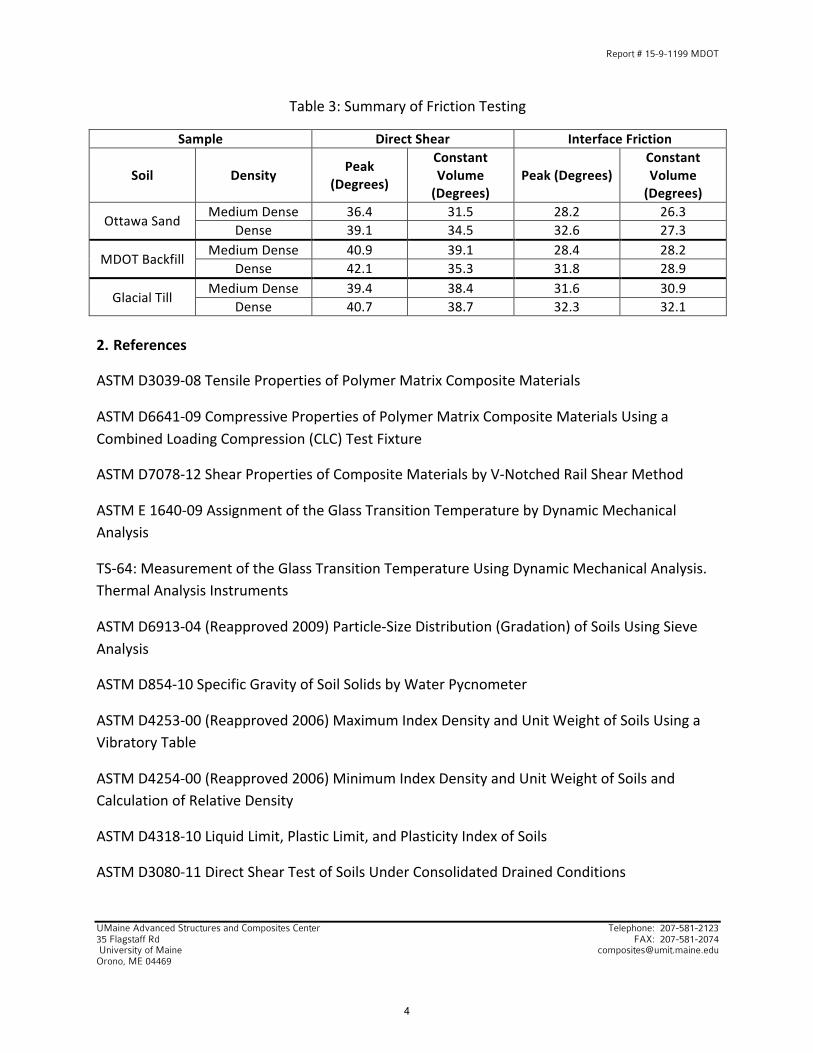
Testing was conducted to determine the interface friction angle between the FRP plates and 3 soils. The resulting properties are presented in Table 3.
3
Report # 15-9-1199 MDOT
UMaine Advanced Structures and Composites Center Telephone: 207-581-2123 35 Flagstaff Rd FAX: 207-581-2074 University of Maine [email protected] www.composites.umaine.edu Orono, ME 04469
Table 3: Summary of Friction Testing
Sample Direct Shear Interface Friction
Soil Density Peak (Degrees)
Constant Volume (Degrees)
Peak (Degrees) Constant Volume (Degrees)
Ottawa Sand Medium Dense 36.4 31.5 28.2 26.3
Dense 39.1 34.5 32.6 27.3
MDOT Backfill Medium Dense 40.9 39.1 28.4 28.2
Dense 42.1 35.3 31.8 28.9
Glacial Till Medium Dense 39.4 38.4 31.6 30.9
Dense 40.7 38.7 32.3 32.1
2. References
ASTM D3039-‐08 Tensile Properties of Polymer Matrix Composite Materials
ASTM D6641-‐09 Compressive Properties of Polymer Matrix Composite Materials Using a Combined Loading Compression (CLC) Test Fixture
ASTM D7078-‐12 Shear Properties of Composite Materials by V-‐Notched Rail Shear Method
ASTM E 1640-‐09 Assignment of the Glass Transition Temperature by Dynamic Mechanical Analysis
TS-‐64: Measurement of the Glass Transition Temperature Using Dynamic Mechanical Analysis. Thermal Analysis Instruments
ASTM D6913-‐04 (Reapproved 2009) Particle-‐Size Distribution (Gradation) of Soils Using Sieve Analysis
ASTM D854-‐10 Specific Gravity of Soil Solids by Water Pycnometer
ASTM D4253-‐00 (Reapproved 2006) Maximum Index Density and Unit Weight of Soils Using a Vibratory Table
ASTM D4254-‐00 (Reapproved 2006) Minimum Index Density and Unit Weight of Soils and Calculation of Relative Density
ASTM D4318-‐10 Liquid Limit, Plastic Limit, and Plasticity Index of Soils
ASTM D3080-‐11 Direct Shear Test of Soils Under Consolidated Drained Conditions
4

Report # 15-9-1199 MDOT
UMaine Advanced Structures and Composites Center Telephone: 207-581-2123 35 Flagstaff Rd FAX: 207-581-2074 University of Maine [email protected] www.composites.umaine.edu Orono, ME 04469
3. Introduction
Mechanical and geotechnical properties of fiber reinforced polymer (FRP) piles driven at the Richmond-‐Dresden Bridge Site (Maine DOT PIN 12674) in August 2013 were determined using coupon level tests. These properties will be used to evaluate the behavior of FRP piles in load bearing applications. The following tests were conducted to determine material properties:
• Tension (ASTM D3039) • Compression (ASTM D6641) • Shear (ASTM D7078) • Glass Transition Temperature (ASTM E1640) • Interface Friction (Modified ASTM D3080)
4. Materials and Sample Description
Coupons for material testing were cut from FRP plates provided by Harbor Technologies, LLC. All plates were manufactured using two layers of stitched E-‐glass fabric with reinforcing fibers in the 0, 90, and +/-‐ 45 degree orientation and a polyester resin. Both layers of reinforcement have the zero degree fibers facing the gel coat, which creates an un-‐symmetric but balanced laminate. Upon delivery to the Advanced Structures and Composites Center, the consolidated plates were warped. This is likely a result of thermal stresses during the curing process and the un-‐symmetric stacking sequence of the lamina.
All coupons were cut using a Flow Mach4 4020b abrasive cutting machine to the dimensions specified in their corresponding ASTM standard. After cutting, all coupons were conditioned at 73 degrees Fahrenheit and 50% relative humidity for a minimum of 3 days prior to testing. Testing was conducted using an Instron 8801 test frame and Instron Dynacell +/-‐ 100 kN load cell. ARAMIS digital image correlation software was used to measure strains during all coupon tests requiring strain measurement.
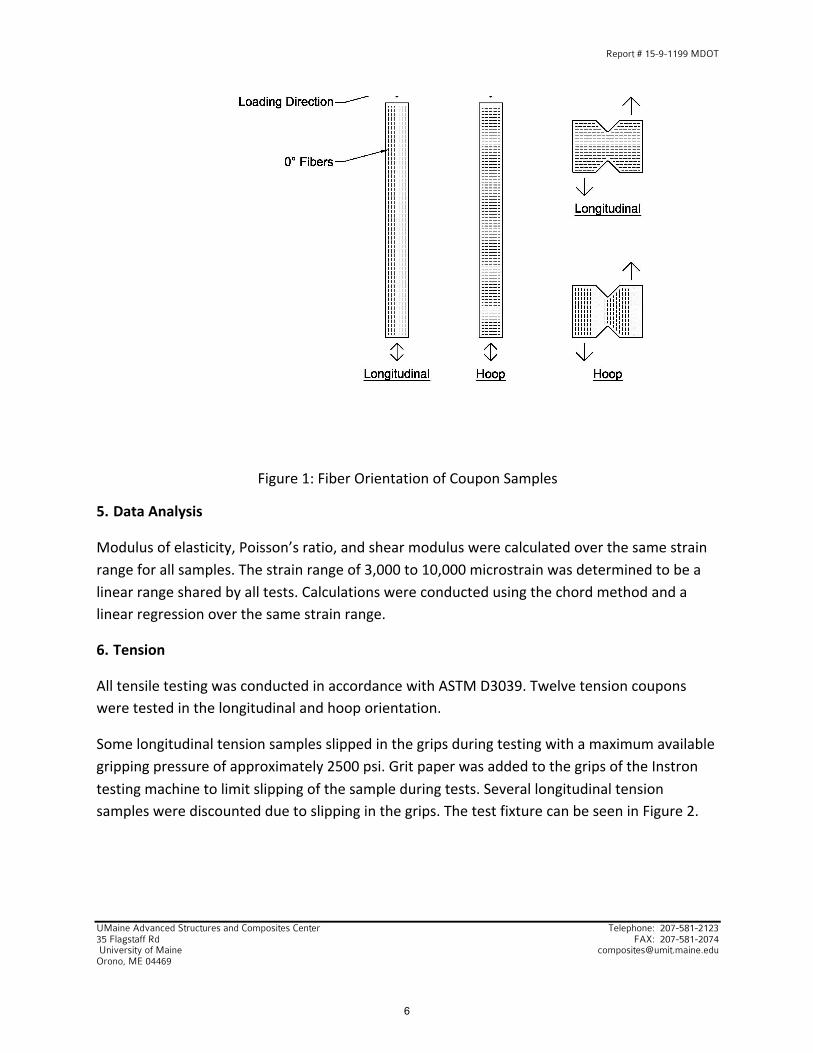
Tension, compression, and shear coupons were all tested in the longitudinal and hoop direction. The terms longitudinal and hoop refer to the orientation of the 0 degree fibers and also coincides with the longitudinal and hoop direction of the full scale FRP piles. This is presented graphically in Figure 1.
The longitudinal direction corresponds to the x-‐axis and the hoop direction corresponds to the y-‐axis.
5
Report # 15-9-1199 MDOT
UMaine Advanced Structures and Composites Center Telephone: 207-581-2123 35 Flagstaff Rd FAX: 207-581-2074 University of Maine [email protected] www.composites.umaine.edu Orono, ME 04469
Figure 1: Fiber Orientation of Coupon Samples
5. Data Analysis
Modulus of elasticity, Poisson’s ratio, and shear modulus were calculated over the same strain range for all samples. The strain range of 3,000 to 10,000 microstrain was determined to be a linear range shared by all tests. Calculations were conducted using the chord method and a linear regression over the same strain range.
6. Tension
All tensile testing was conducted in accordance with ASTM D3039. Twelve tension coupons were tested in the longitudinal and hoop orientation.
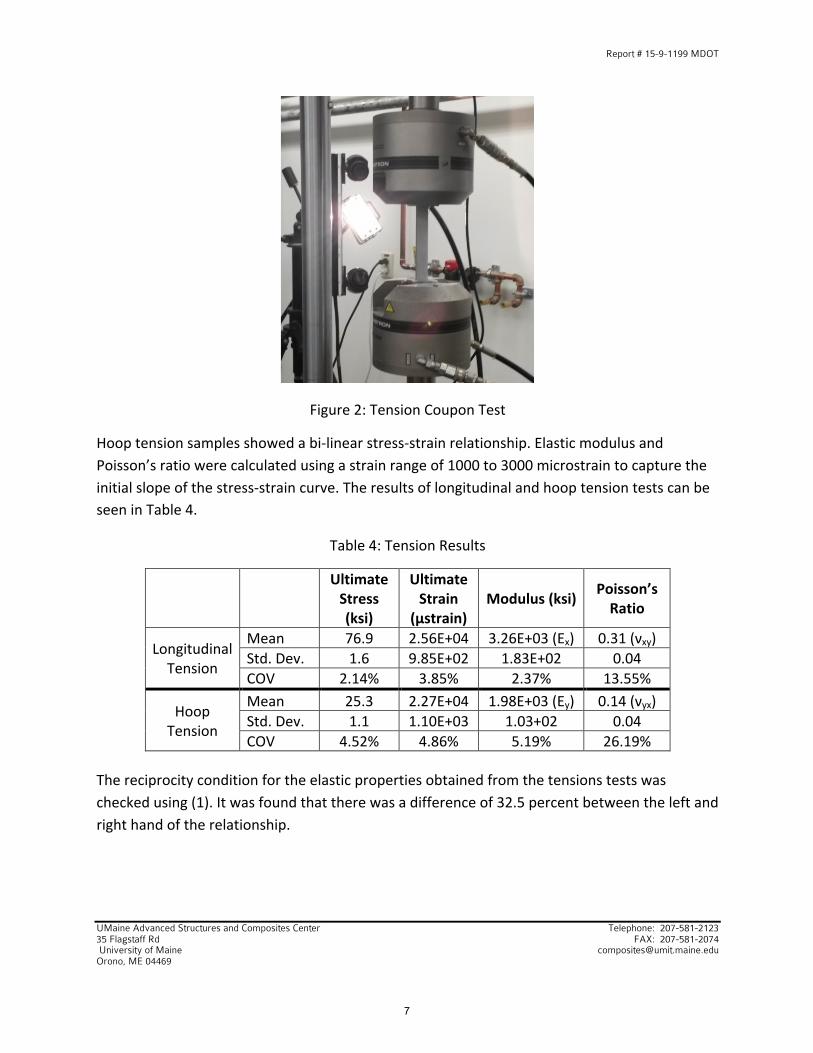
Some longitudinal tension samples slipped in the grips during testing with a maximum available gripping pressure of approximately 2500 psi. Grit paper was added to the grips of the Instron testing machine to limit slipping of the sample during tests. Several longitudinal tension samples were discounted due to slipping in the grips. The test fixture can be seen in Figure 2.
6
Report # 15-9-1199 MDOT
UMaine Advanced Structures and Composites Center Telephone: 207-581-2123 35 Flagstaff Rd FAX: 207-581-2074 University of Maine [email protected] www.composites.umaine.edu Orono, ME 04469
Figure 2: Tension Coupon Test
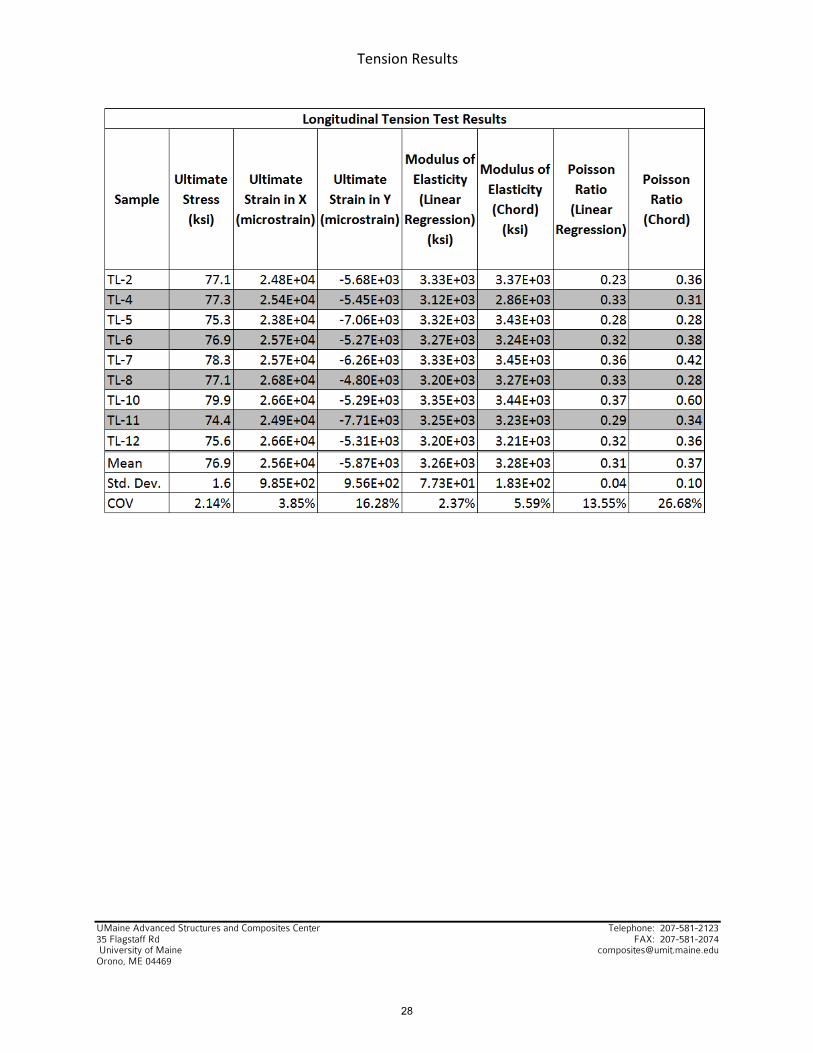
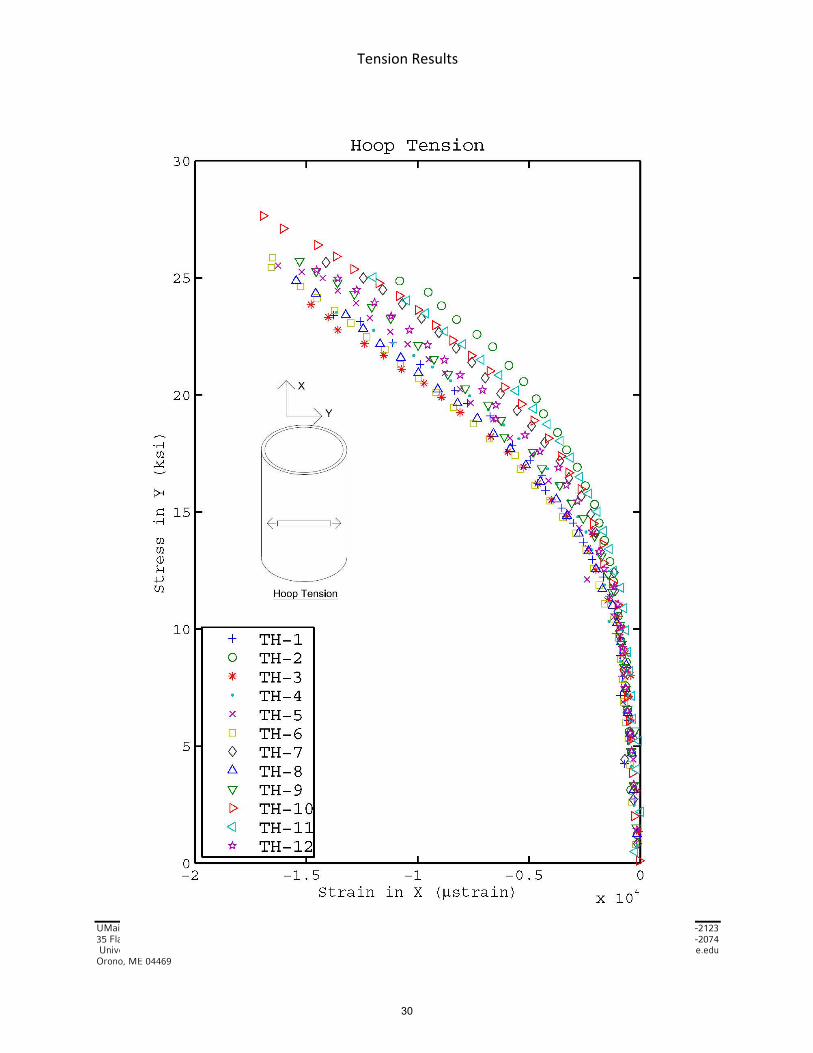
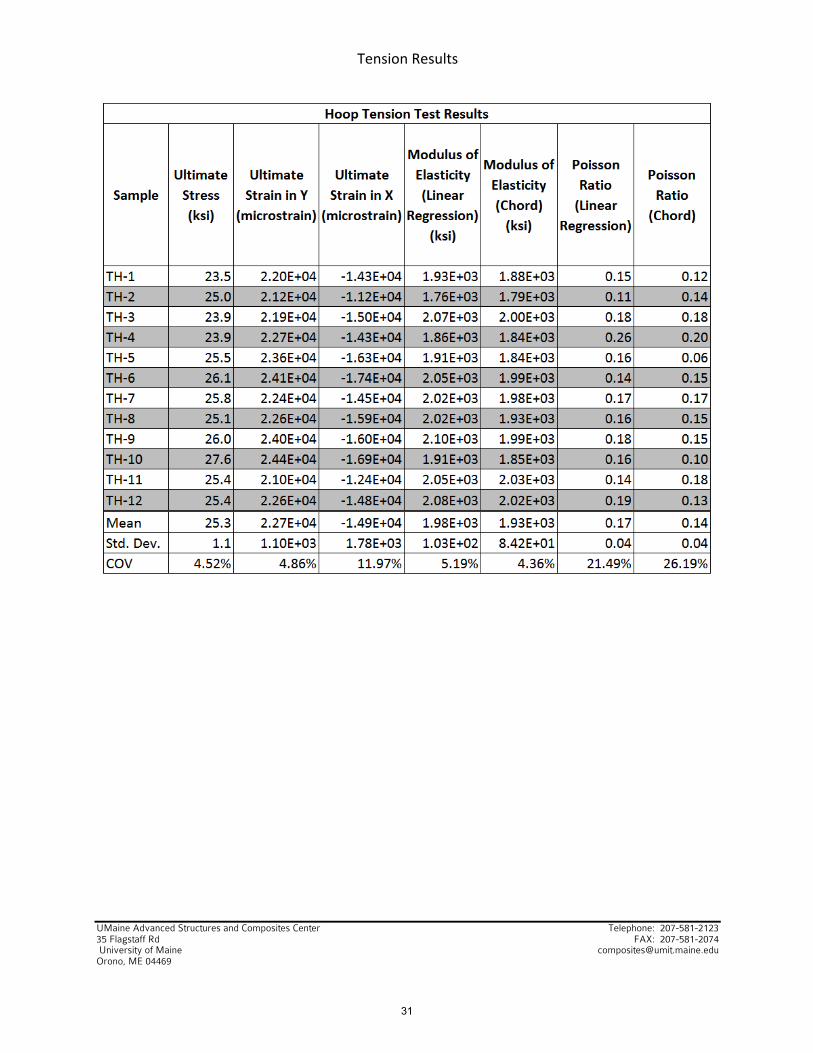
Hoop tension samples showed a bi-‐linear stress-‐strain relationship. Elastic modulus and Poisson’s ratio were calculated using a strain range of 1000 to 3000 microstrain to capture the initial slope of the stress-‐strain curve. The results of longitudinal and hoop tension tests can be seen in Table 4.
Table 4: Tension Results
Ultimate Stress (ksi)
Ultimate Strain
(µstrain) Modulus (ksi) Poisson’s
Ratio
Longitudinal Tension
Mean 76.9 2.56E+04 3.26E+03 (Ex) 0.31 (νxy) Std. Dev. 1.6 9.85E+02 1.83E+02 0.04 COV 2.14% 3.85% 2.37% 13.55%
Hoop Tension
Mean 25.3 2.27E+04 1.98E+03 (Ey) 0.14 (νyx) Std. Dev. 1.1 1.10E+03 1.03+02 0.04 COV 4.52% 4.86% 5.19% 26.19%
The reciprocity condition for the elastic properties obtained from the tensions tests was checked using (1). It was found that there was a difference of 32.5 percent between the left and right hand of the relationship.
7
Report # 15-9-1199 MDOT
UMaine Advanced Structures and Composites Center Telephone: 207-581-2123 35 Flagstaff Rd FAX: 207-581-2074 University of Maine [email protected] www.composites.umaine.edu Orono, ME 04469
xy yx
x yE Eν ν
= (1)
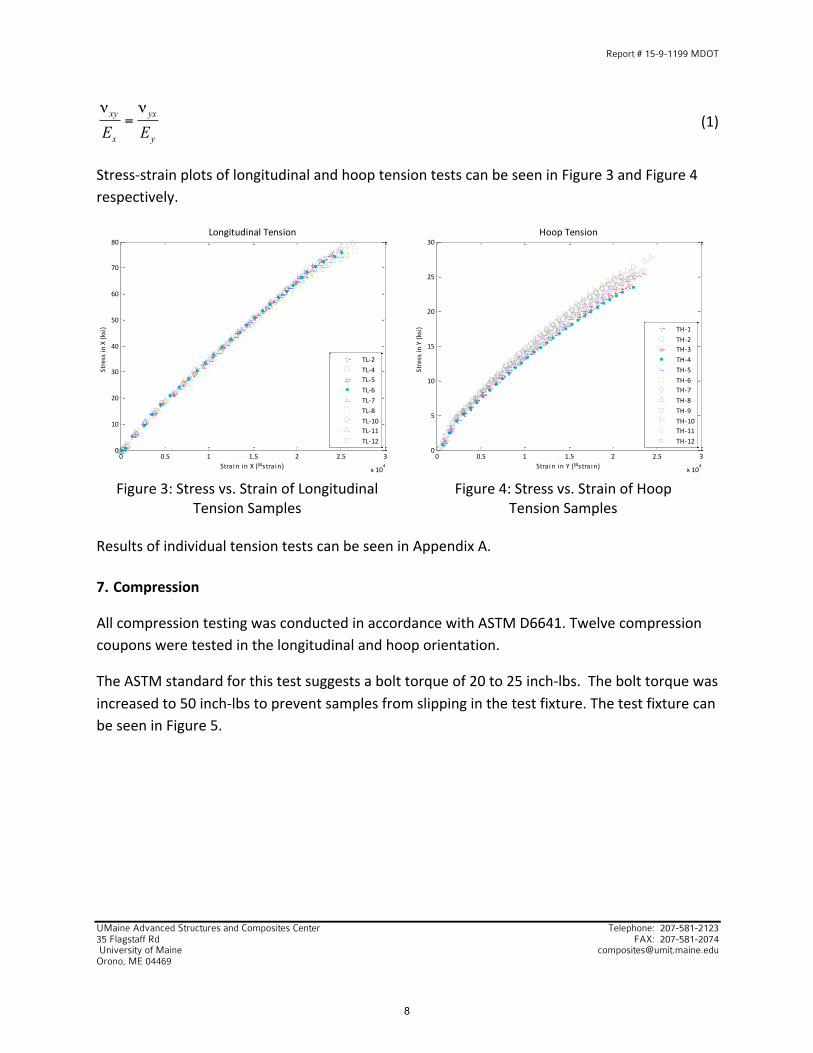
Stress-‐strain plots of longitudinal and hoop tension tests can be seen in Figure 3 and Figure 4 respectively.
Figure 3: Stress vs. Strain of Longitudinal
Tension Samples
Figure 4: Stress vs. Strain of Hoop
Tension Samples
Results of individual tension tests can be seen in Appendix A.
7. Compression
All compression testing was conducted in accordance with ASTM D6641. Twelve compression coupons were tested in the longitudinal and hoop orientation.
The ASTM standard for this test suggests a bolt torque of 20 to 25 inch-‐lbs. The bolt torque was increased to 50 inch-‐lbs to prevent samples from slipping in the test fixture. The test fixture can be seen in Figure 5.
0 0.5 1 1.5 2 2.5 3
x 104
0
10
20
30
40
50
60
70
80
Stra in in X (µstra in)
Stress in X (ksi)
Longitudinal Tension
TL-‐2TL-‐4TL-‐5TL-‐6TL-‐7TL-‐8TL-‐10TL-‐11TL-‐12
0 0.5 1 1.5 2 2.5 3
x 104
0
5
10
15
20
25
30
Stra in in Y (µstra in)
Stress in Y (ksi)
Hoop Tension
TH-‐1TH-‐2TH-‐3TH-‐4TH-‐5TH-‐6TH-‐7TH-‐8TH-‐9TH-‐10TH-‐11TH-‐12
8

Report # 15-9-1199 MDOT
UMaine Advanced Structures and Composites Center Telephone: 207-581-2123 35 Flagstaff Rd FAX: 207-581-2074 University of Maine [email protected] www.composites.umaine.edu Orono, ME 04469
Figure 5: Compression Coupon Test
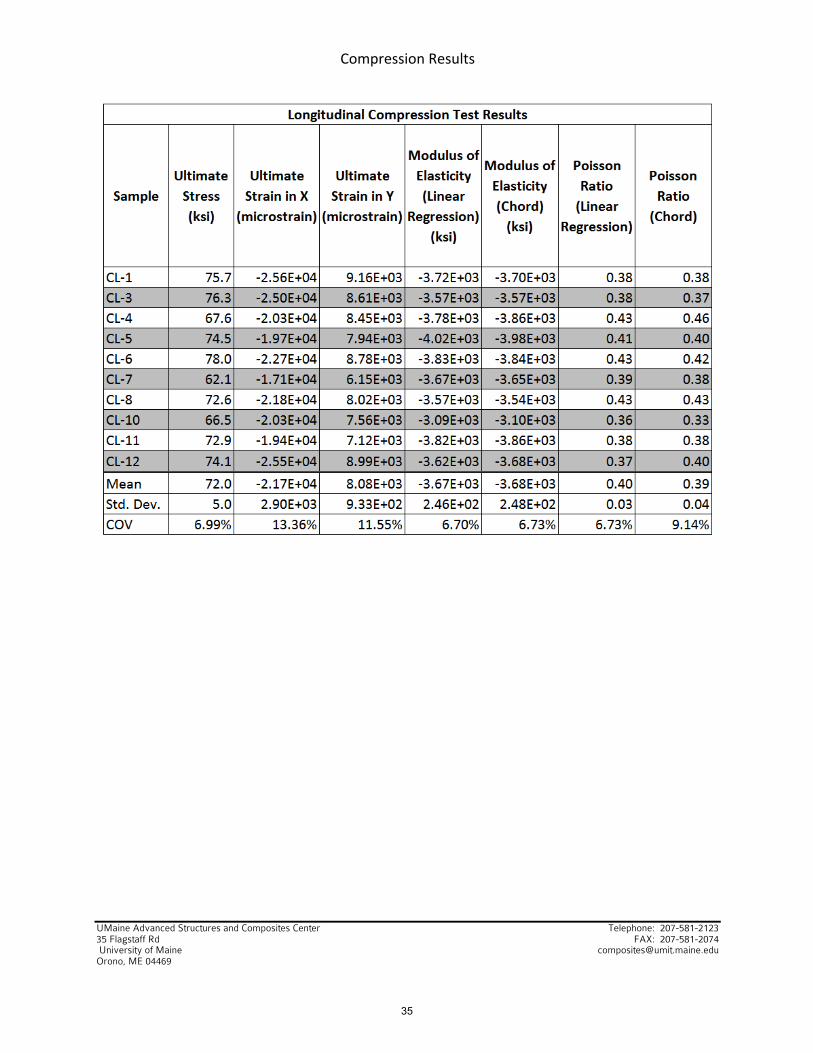
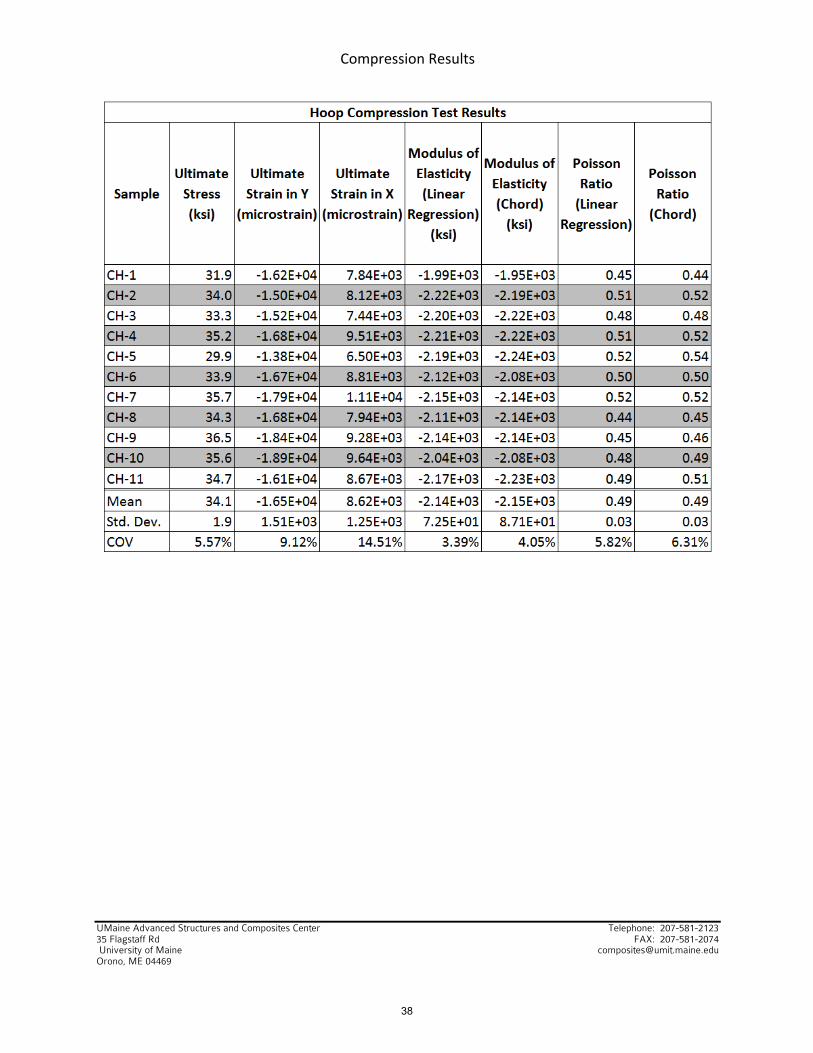
The results of longitudinal and hoop compression tests can be seen in Table 5.
Table 5: Compression Results
Ultimate Stress (ksi)
Ultimate Strain
(µstrain) Modulus (ksi)
Longitudinal Compression
Mean 72.0 -‐2.17E+04 3.67E+03 (Ex) Std. Dev. 5.0 2.90E+03 2.46E+02 COV 6.99% 13.36% 6.70%
Hoop Compression
Mean 34.7 -‐1.65E+04 2.14E+03 (Ey) Std. Dev. 1.9 1.51E+03 7.25E+01 COV 5.57% 9.12% 3.39%
Elastic properties Ex, Ey, and νxy are adopted from the tension tests.
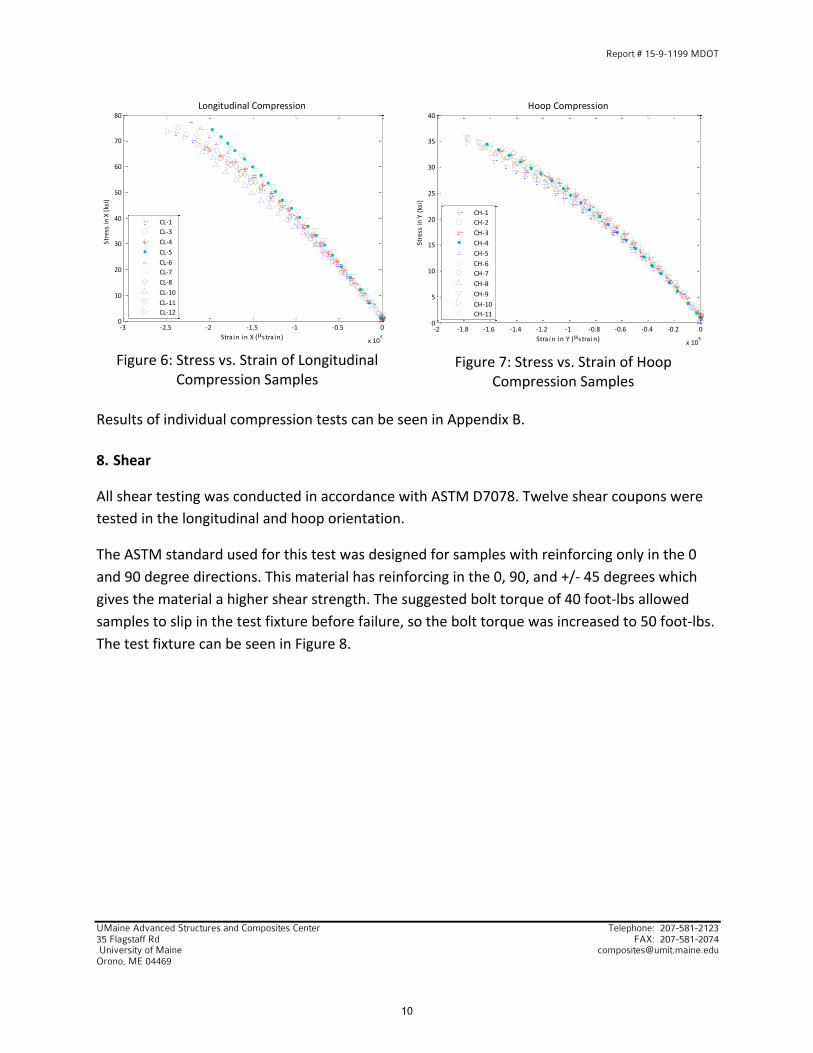
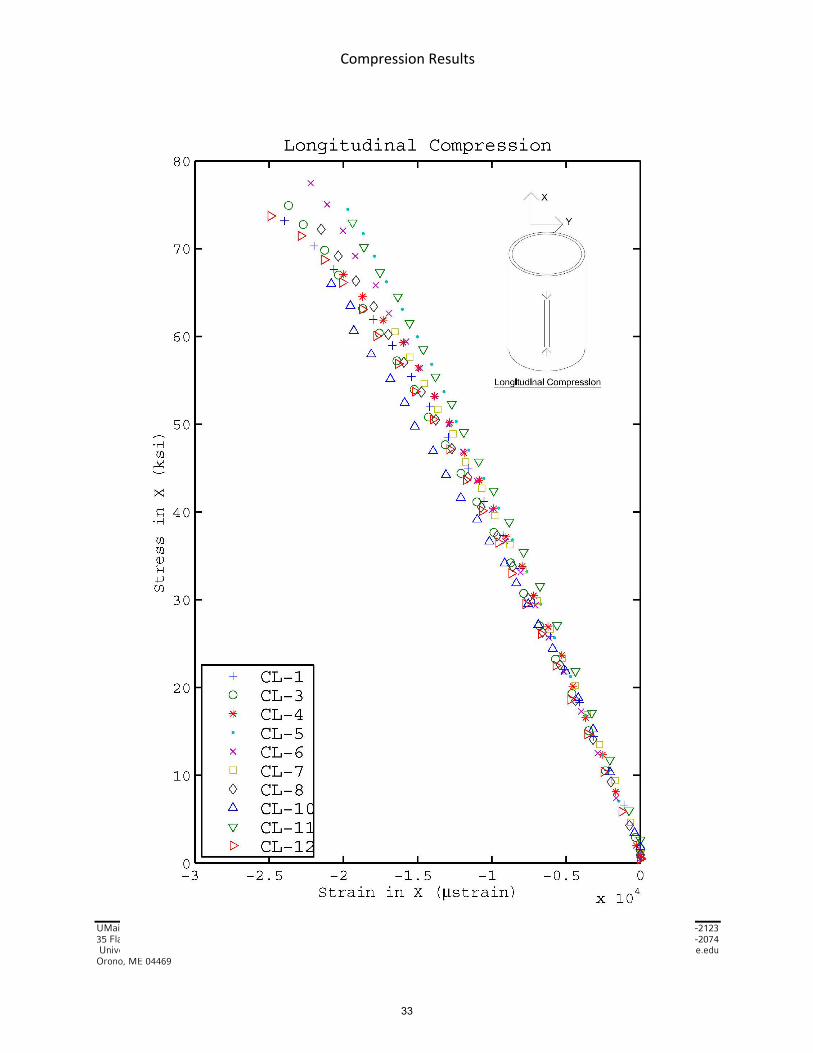
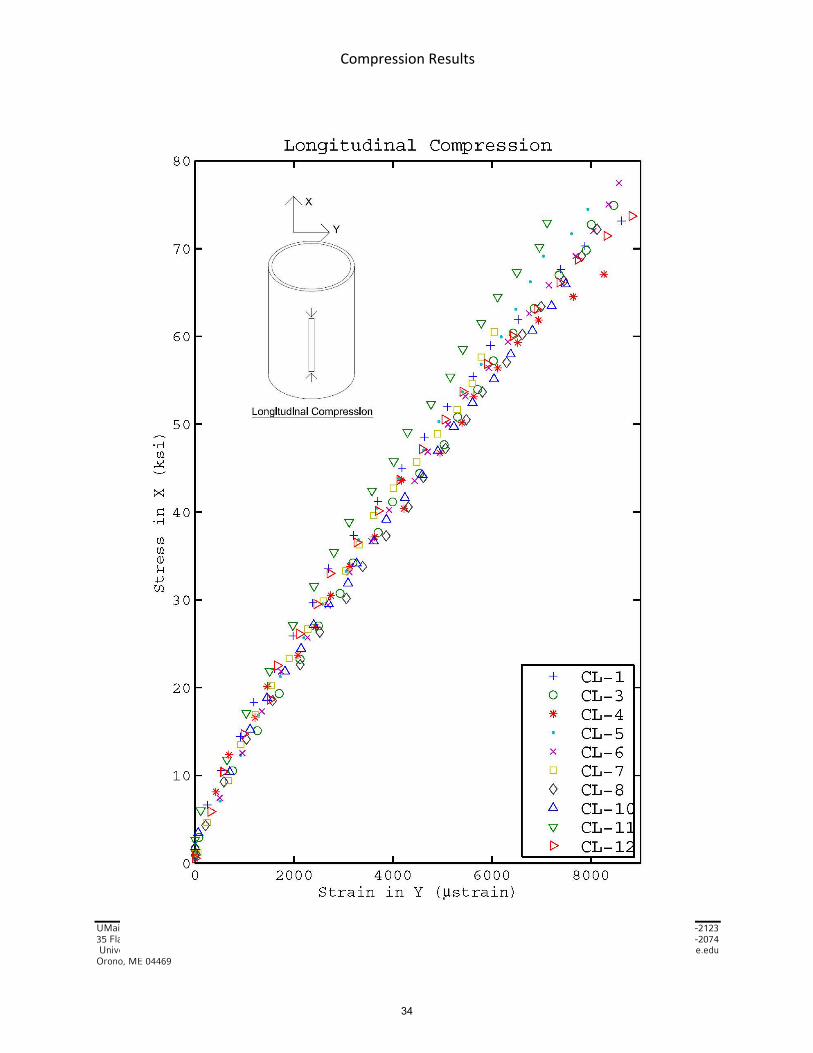
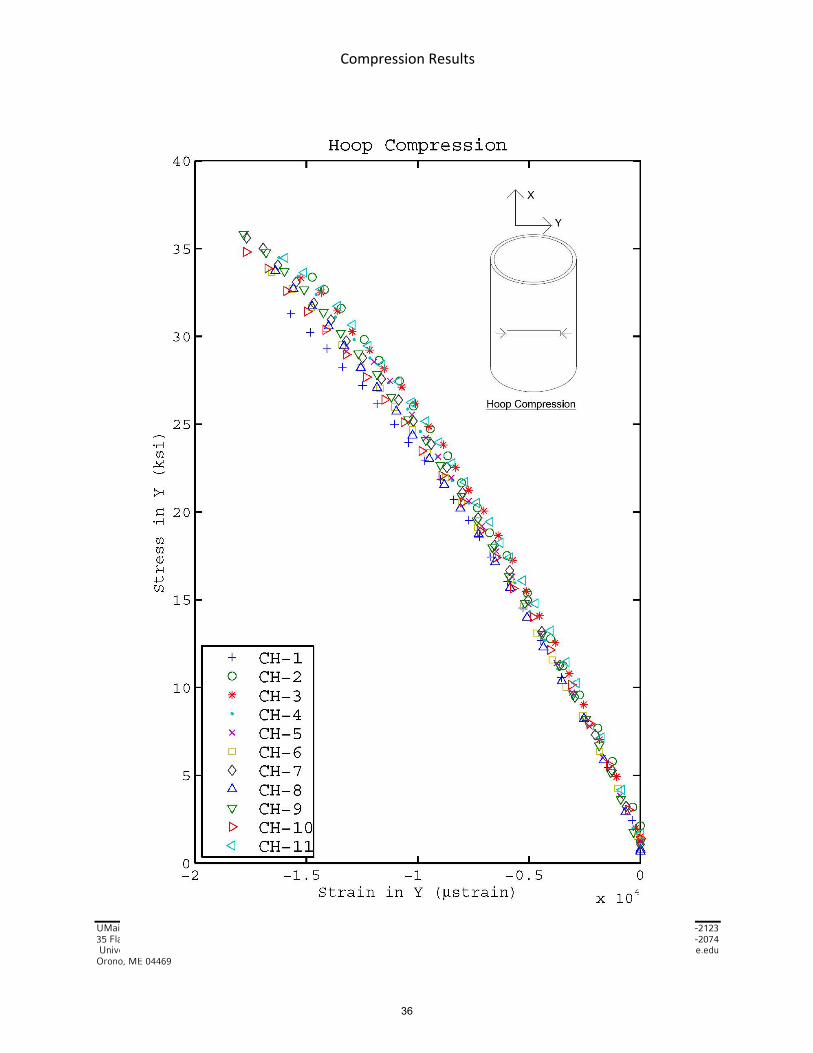
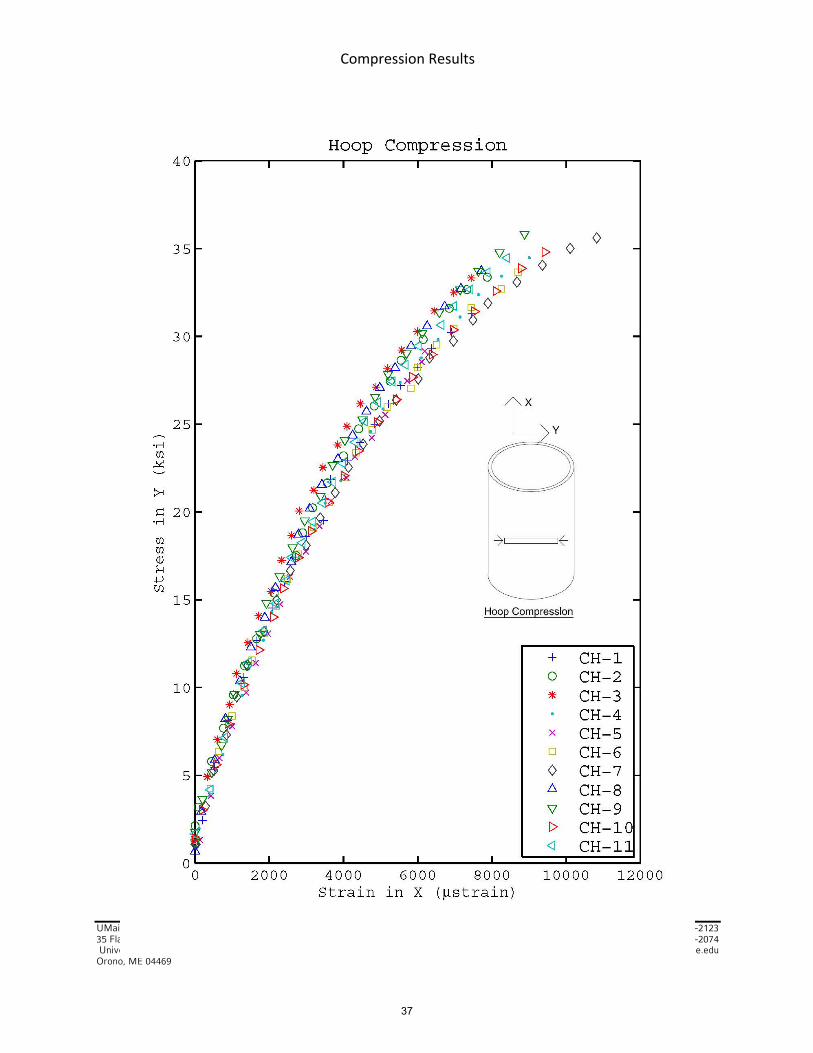
Stress-‐strain plots of longitudinal and hoop compression tests can be seen in Figure 6 and Figure 7 respectively.
9
Report # 15-9-1199 MDOT
UMaine Advanced Structures and Composites Center Telephone: 207-581-2123 35 Flagstaff Rd FAX: 207-581-2074 University of Maine [email protected] www.composites.umaine.edu Orono, ME 04469
Figure 6: Stress vs. Strain of Longitudinal
Compression Samples
Figure 7: Stress vs. Strain of Hoop
Compression Samples
Results of individual compression tests can be seen in Appendix B.
8. Shear
All shear testing was conducted in accordance with ASTM D7078. Twelve shear coupons were tested in the longitudinal and hoop orientation.
The ASTM standard used for this test was designed for samples with reinforcing only in the 0 and 90 degree directions. This material has reinforcing in the 0, 90, and +/-‐ 45 degrees which gives the material a higher shear strength. The suggested bolt torque of 40 foot-‐lbs allowed samples to slip in the test fixture before failure, so the bolt torque was increased to 50 foot-‐lbs. The test fixture can be seen in Figure 8.
-‐3 -‐2.5 -‐2 -‐1.5 -‐1 -‐0.5 0
x 104
0
10
20
30
40
50
60
70
80
Stra in in X (µstra in)
Stress in X (ksi)
Longitudinal Compression
CL-‐1CL-‐3CL-‐4CL-‐5CL-‐6CL-‐7CL-‐8CL-‐10CL-‐11CL-‐12
-‐2 -‐1.8 -‐1.6 -‐1.4 -‐1.2 -‐1 -‐0.8 -‐0.6 -‐0.4 -‐0.2 0
x 104
0
5
10
15
20
25
30
35
40
Stra in in Y (µstra in)
Stress in Y (ksi)
Hoop Compression
CH-‐1CH-‐2CH-‐3CH-‐4CH-‐5CH-‐6CH-‐7CH-‐8CH-‐9CH-‐10CH-‐11
10

Report # 15-9-1199 MDOT
UMaine Advanced Structures and Composites Center Telephone: 207-581-2123 35 Flagstaff Rd FAX: 207-581-2074 University of Maine [email protected] www.composites.umaine.edu Orono, ME 04469
Figure 8: Shear Coupon Test
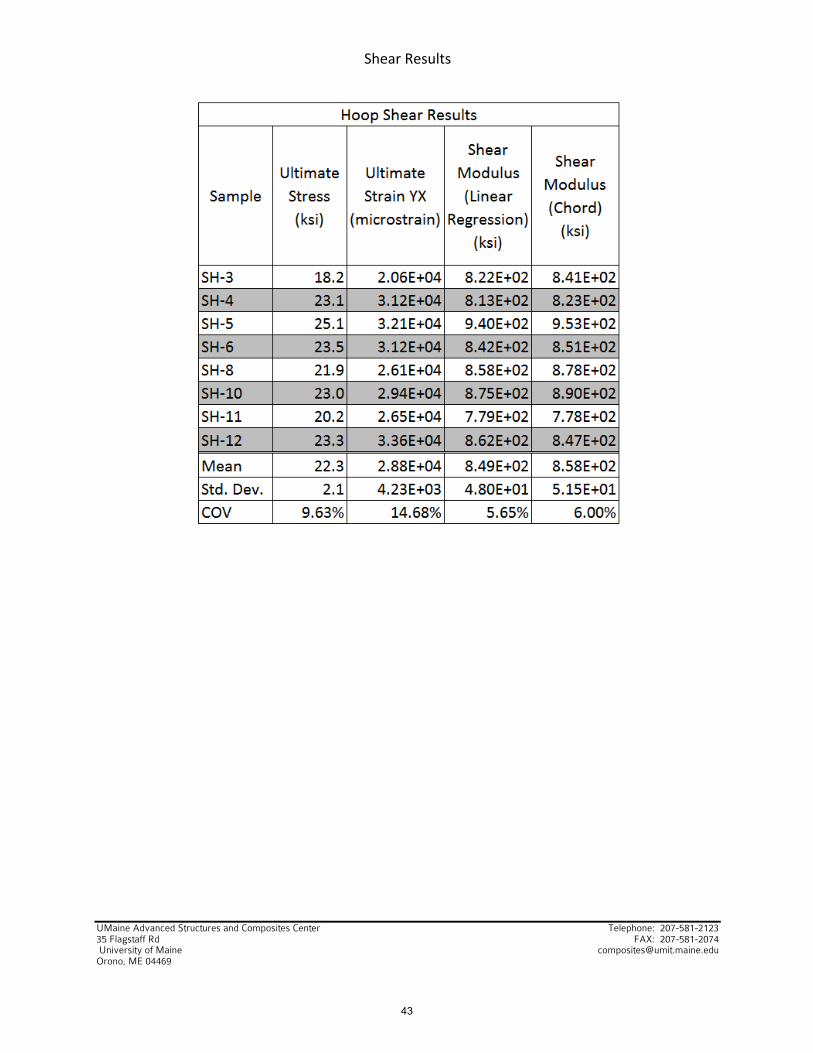
The results of longitudinal and hoop shear tests can be seen in Table 6.
Table 6: Shear Results
Ultimate Stress (ksi)
Ultimate Strain
(µstrain) Modulus (ksi)
Longitudinal Loading
Mean 24.3 3.63E+04 8.94E+02 (Gxy) Std. Dev. 1.4 3.86E+03 2.28E+01 COV 5.57% 10.63% 2.55%
Hoop Loading
Mean 22.3 2.88E+04 8.49E+02 (Gyx) Std. Dev. 2.1 4.23E+03 4.80E+01 COV 9.63% 14.68% 5.65%
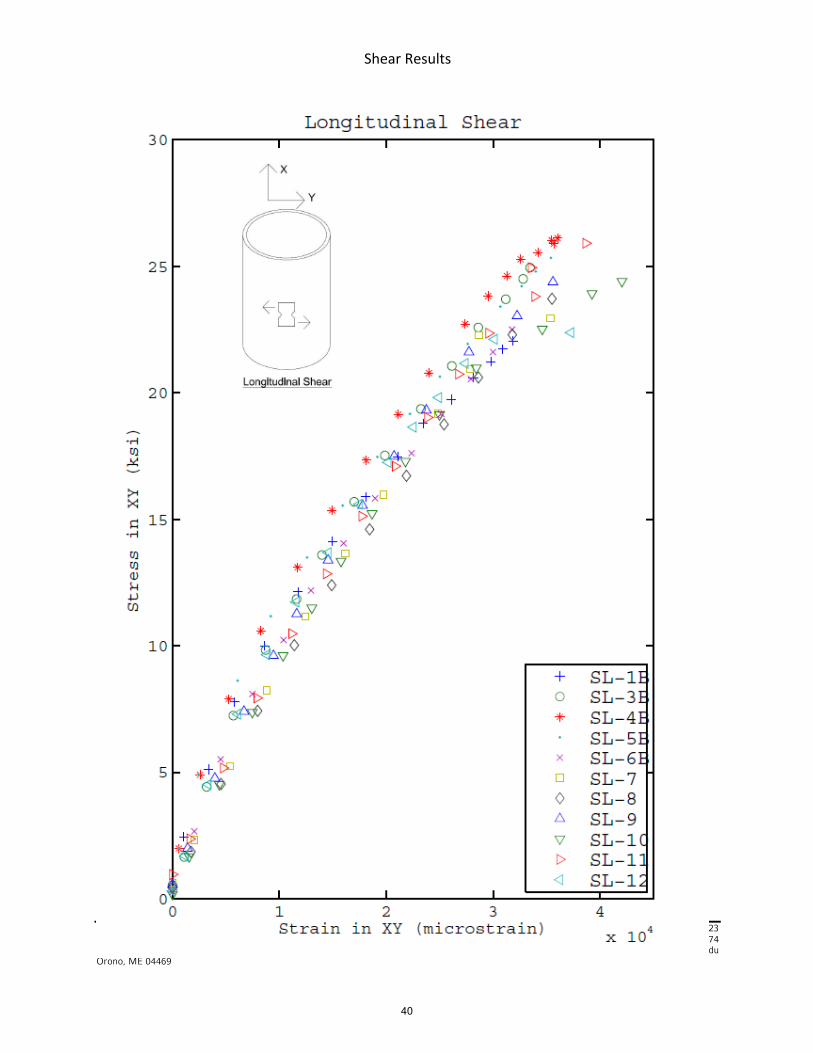
Stress-‐strain plots of longitudinal and hoop shear tests can be seen in Figure 9 and Figure 10 respectively.
11

Report # 15-9-1199 MDOT
UMaine Advanced Structures and Composites Center Telephone: 207-581-2123 35 Flagstaff Rd FAX: 207-581-2074 University of Maine [email protected] www.composites.umaine.edu Orono, ME 04469
Figure 9: Stress vs. Strain of Longitudinal
Shear Samples
Figure 10: Stress vs. Strain of Hoop Shear
Samples
Results of individual shear tests can be seen in Appendix C.
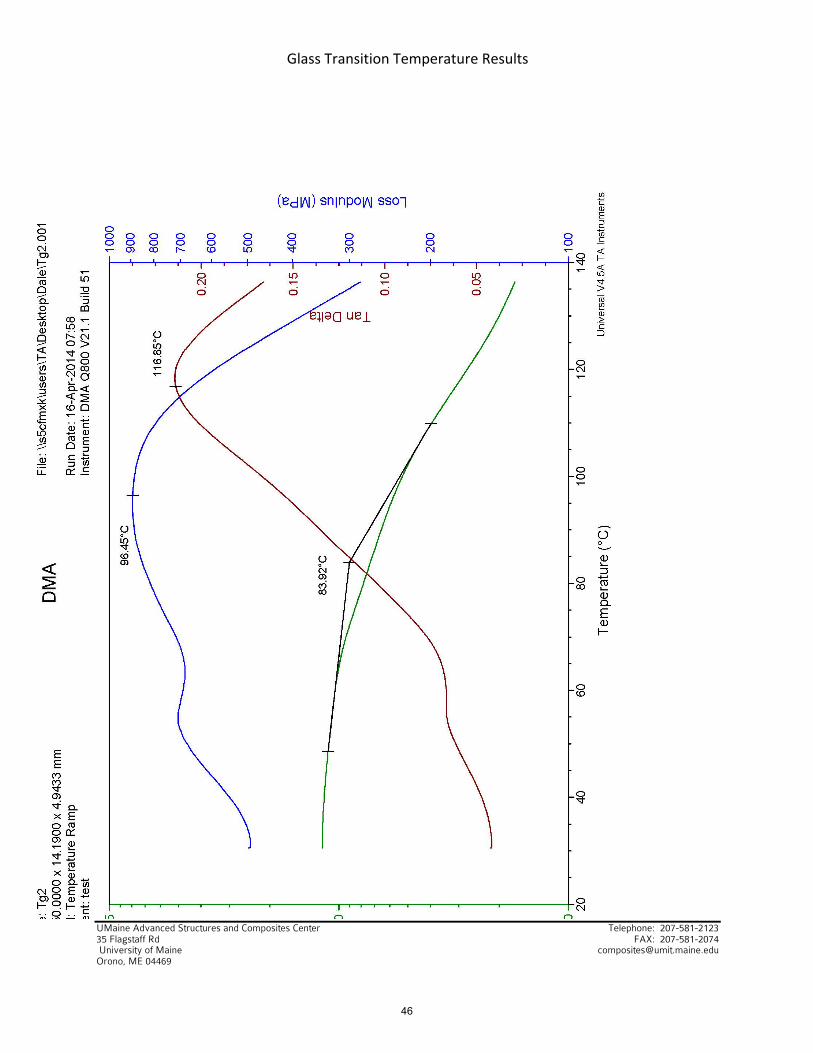
9. Glass Transition Temperature
Glass transition testing was conducted in accordance with ASTM E1640. A Thermal Analysis Instruments DMA Q800 dynamic mechanical analyzer was used to test samples. The 3 point bend test configuration was used to accommodate the thickness and modulus of the samples. The test set up can be seen in Figure 11.
Figure 11: Glass Transition Test
0 0.5 1 1.5 2 2.5 3 3.5 4 4.5
x 104
0
5
10
15
20
25
30
Stra in in XY (microstra in)
Stress in XY (ksi)
Longitudinal Shear
SL-‐1BSL-‐3BSL-‐4BSL-‐5BSL-‐6BSL-‐7SL-‐8SL-‐9SL-‐10SL-‐11SL-‐12
0 0.5 1 1.5 2 2.5 3 3.5
x 104
0
5
10
15
20
25
30
Stra in in YX (microstra in)
Stress in YX (ksi)
Hoop Shear
SH-‐3SH-‐4SH-‐5SH-‐6SH-‐8SH-‐10SH-‐11SH-‐12
12

Report # 15-9-1199 MDOT
UMaine Advanced Structures and Composites Center Telephone: 207-581-2123 35 Flagstaff Rd FAX: 207-581-2074 University of Maine [email protected] www.composites.umaine.edu Orono, ME 04469
Tests were run with a pre-‐load of 2 Newtons, frequency of 1 Hertz, temperature ramp of 3 degrees Centigrade per minute, and amplitude of 10 micrometers. Testing was conducted from 30 to 140 degrees Centigrade.
Dynamic mechanical analysis determines glass transition temperature using 3 properties. Thermal Analysis Instruments describes the 3 different glass transition temperatures as:
• Onset of the change in slope of storage modulus: “Occurs at the lowest temperature and relates to mechanical failure”
• Peak of the loss modulus: “Occurs at the middle temperature and is more closely related to the physical property changes attributed to the glass transition in plastics. It reflects molecular processes and agrees with the idea of Tg as the temperature at the onset of segmental motion”
• Tan Delta Peak: “Occurs at the highest temperature and is used historically in literature. It is a good measure of the ‘leather like’ midpoint between the glassy and rubbery states of a polymer. The height and shape of the tan delta peak change systematically with amorphous content”
For the purpose of this research, the onset of the change in slope of storage modulus will be used as the glass transition temperature in accordance with ASTM E1640.
13

Report # 15-9-1199 MDOT
UMaine Advanced Structures and Composites Center Telephone: 207-581-2123 35 Flagstaff Rd FAX: 207-581-2074 University of Maine [email protected] www.composites.umaine.edu Orono, ME 04469
A summary of the glass transition temperatures for each sample can be seen below in Table 7.
Table 7: Glass Transition Temperature Results
Sample
Onset Point of Storage Modulus
(°C)
Peak of Loss
Modulus (°C)
Peak of Tan Delta (°C)
Tg-‐1 80.6 93.2 118.2 Tg-‐2 83.9 96.5 116.9 Tg-‐3 78.6 94.7 114.8
Average 81.0 94.8 116.6
Results of individual glass transition temperature tests can be seen in Appendix D.
14

Report # 15-9-1199 MDOT
UMaine Advanced Structures and Composites Center Telephone: 207-581-2123 35 Flagstaff Rd FAX: 207-581-2074 University of Maine [email protected] www.composites.umaine.edu Orono, ME 04469
10. Soil-‐FRP Friction
Three soils were chosen for soil-‐FRP friction testing. These soils are: Ottawa sand, a backfill meeting Maine Department of Transportation (MaineDOT) specifications for Type B Aggregate, and a glacial till obtained from an excavation at the corner or Long Road and Rangeley Road in Orono, ME. All grains above the number 8 sieve were removed prior to all index and shear testing to meet the requirements of ASTM D3080 for the minimum sample height to maximum grain size ratio in direct shear tests.
Figure 12: Ottawa Sand
Figure 13: MDOT Backfill
Figure 14: Glacial Till
Prior to soil-‐FRP friction testing, a series of index tests were conducted to define each soil’s properties.
10.1. Grain Size Analysis
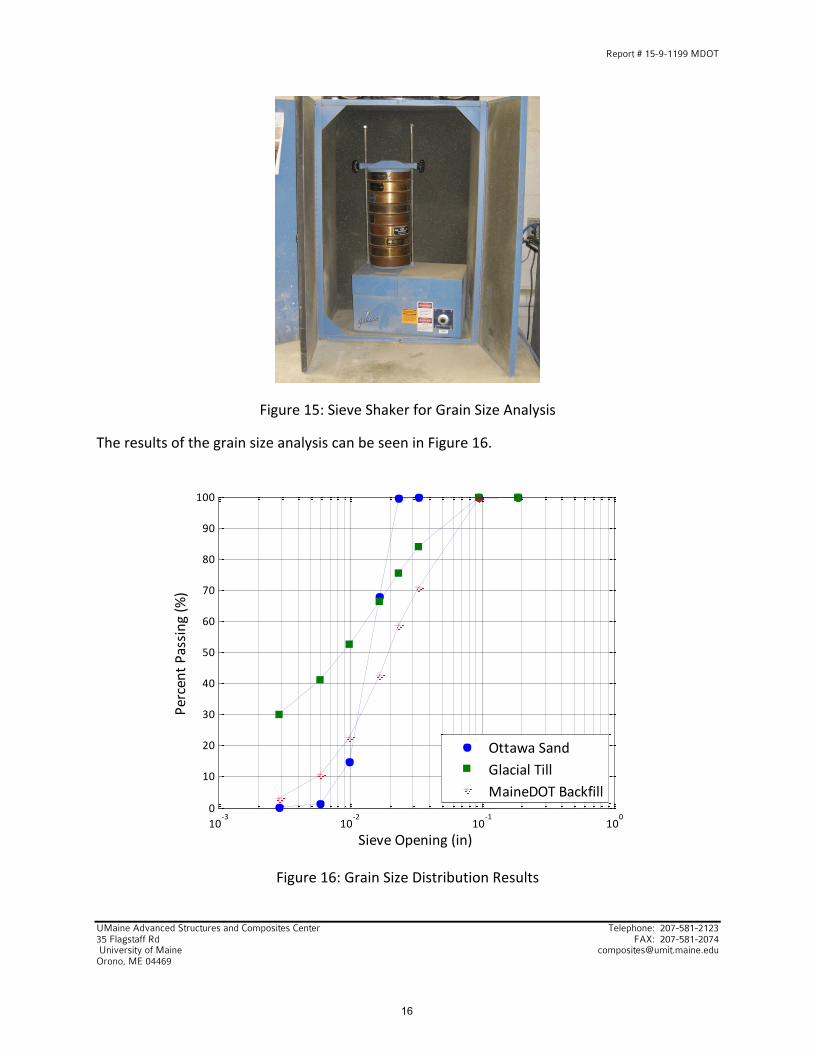
Grain size analysis was performed on all soils in accordance with ASTM D6913. All soil tests were conducted on oven dry samples, and a wet sieve analysis was also conducted on the glacial till due to its high fines content. The sieve and shaker can be seen in Figure 15.
15
Report # 15-9-1199 MDOT
UMaine Advanced Structures and Composites Center Telephone: 207-581-2123 35 Flagstaff Rd FAX: 207-581-2074 University of Maine [email protected] www.composites.umaine.edu Orono, ME 04469
Figure 15: Sieve Shaker for Grain Size Analysis
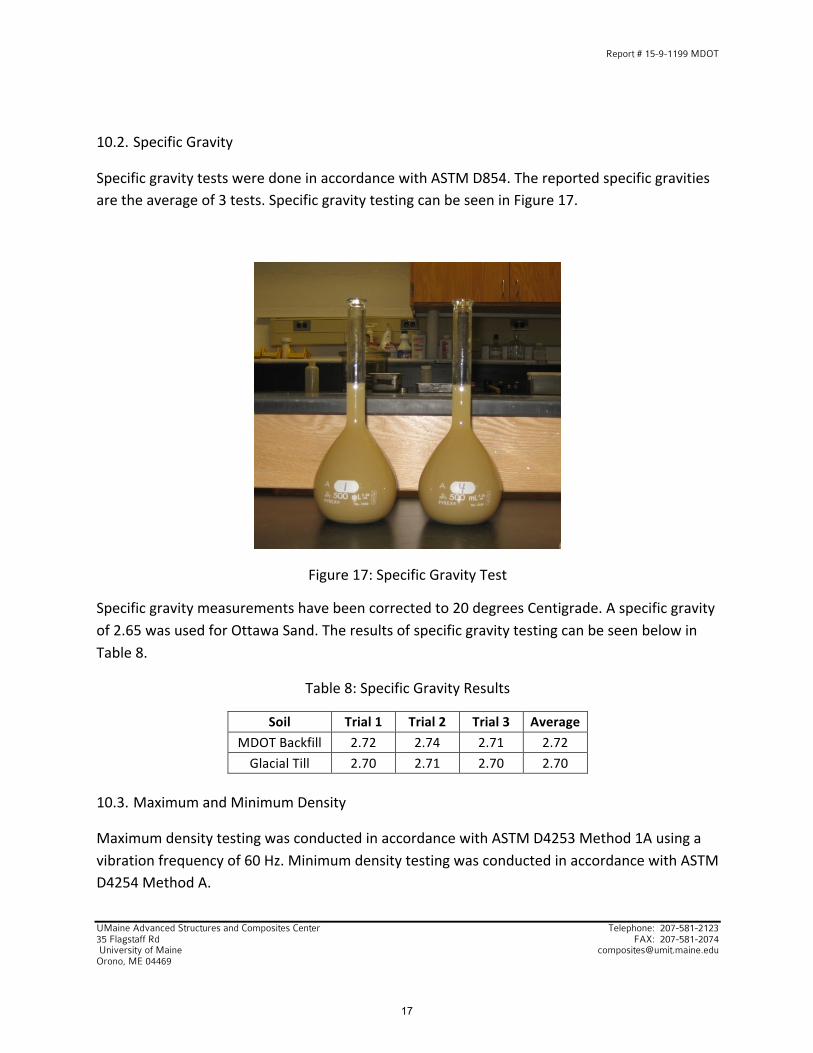
The results of the grain size analysis can be seen in Figure 16.
Figure 16: Grain Size Distribution Results
10-‐3
10-‐2
10-‐1
100
0
10
20
30
40
50
60
70
80
90
100
Percent P
assing (%
)
Sieve Opening (in)
Ottawa SandGlacial TillMaineDOT Backfill
16
Report # 15-9-1199 MDOT
UMaine Advanced Structures and Composites Center Telephone: 207-581-2123 35 Flagstaff Rd FAX: 207-581-2074 University of Maine [email protected] www.composites.umaine.edu Orono, ME 04469
10.2. Specific Gravity
Specific gravity tests were done in accordance with ASTM D854. The reported specific gravities are the average of 3 tests. Specific gravity testing can be seen in Figure 17.
Figure 17: Specific Gravity Test
Specific gravity measurements have been corrected to 20 degrees Centigrade. A specific gravity of 2.65 was used for Ottawa Sand. The results of specific gravity testing can be seen below in Table 8.
Table 8: Specific Gravity Results
Soil Trial 1 Trial 2 Trial 3 Average MDOT Backfill 2.72 2.74 2.71 2.72 Glacial Till 2.70 2.71 2.70 2.70
10.3. Maximum and Minimum Density
Maximum density testing was conducted in accordance with ASTM D4253 Method 1A using a vibration frequency of 60 Hz. Minimum density testing was conducted in accordance with ASTM D4254 Method A.
17
Report # 15-9-1199 MDOT
UMaine Advanced Structures and Composites Center Telephone: 207-581-2123 35 Flagstaff Rd FAX: 207-581-2074 University of Maine [email protected] www.composites.umaine.edu Orono, ME 04469
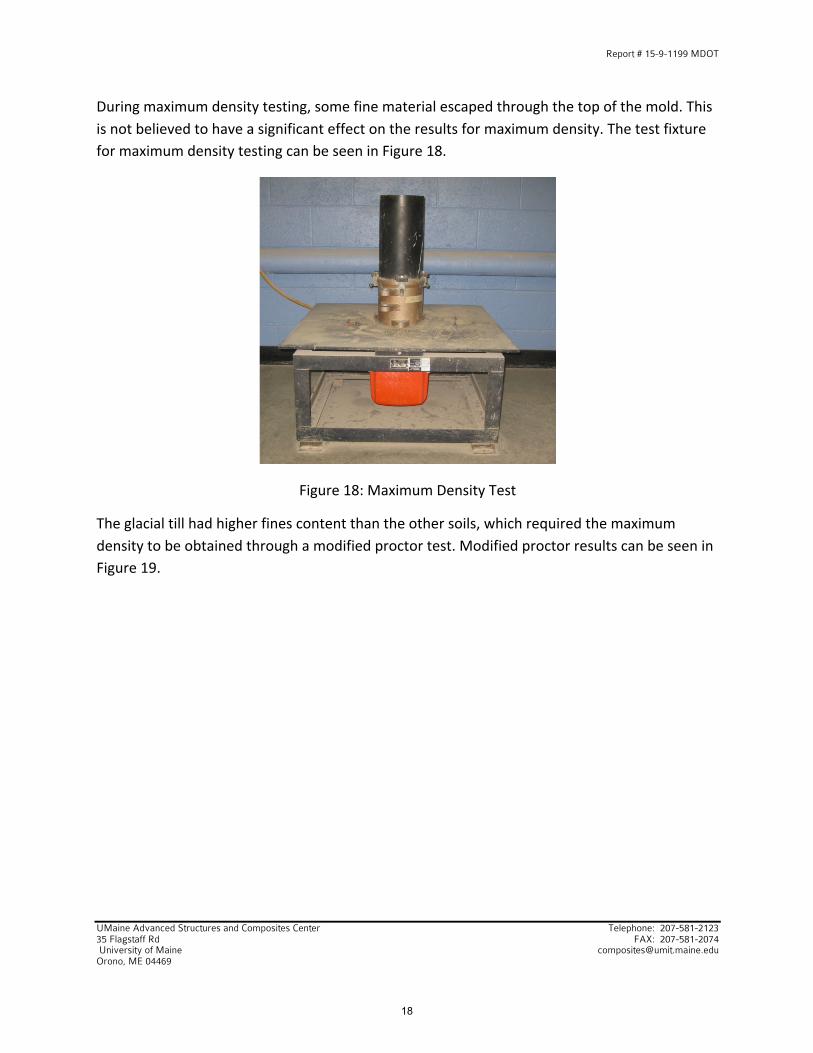
During maximum density testing, some fine material escaped through the top of the mold. This is not believed to have a significant effect on the results for maximum density. The test fixture for maximum density testing can be seen in Figure 18.
Figure 18: Maximum Density Test
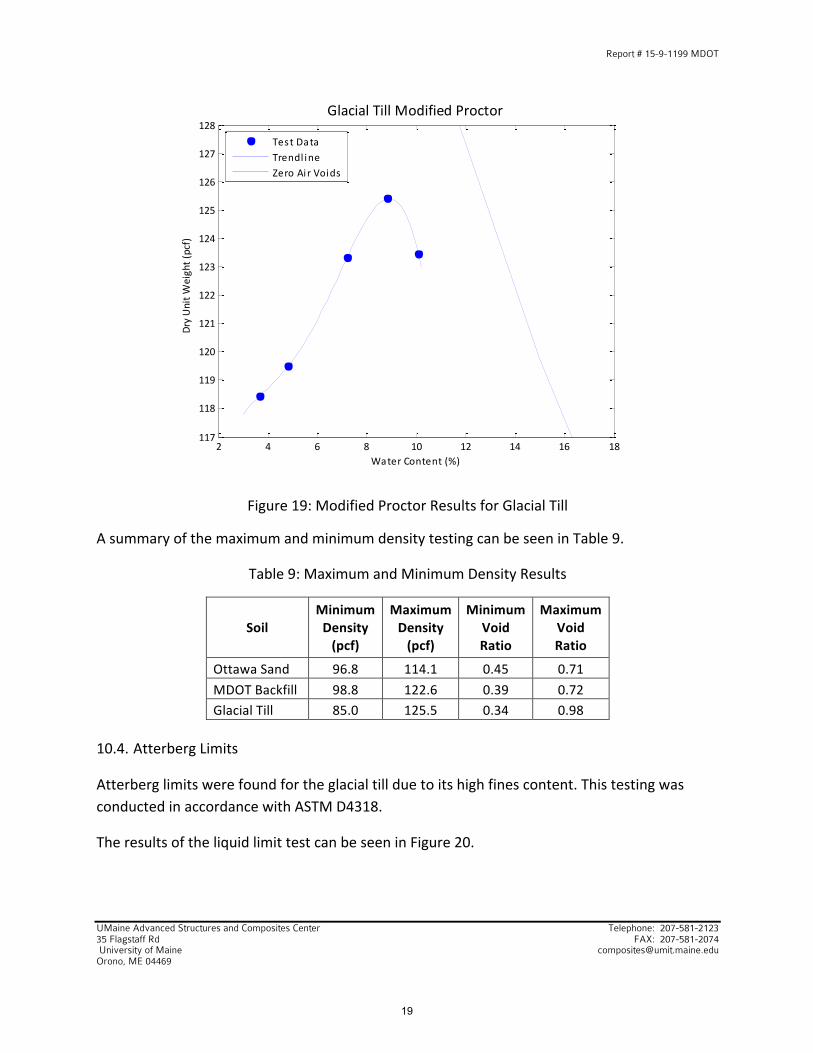
The glacial till had higher fines content than the other soils, which required the maximum density to be obtained through a modified proctor test. Modified proctor results can be seen in Figure 19.
18
Report # 15-9-1199 MDOT
UMaine Advanced Structures and Composites Center Telephone: 207-581-2123 35 Flagstaff Rd FAX: 207-581-2074 University of Maine [email protected] www.composites.umaine.edu Orono, ME 04469
Figure 19: Modified Proctor Results for Glacial Till
A summary of the maximum and minimum density testing can be seen in Table 9.
Table 9: Maximum and Minimum Density Results
Soil Minimum Density (pcf)
Maximum Density (pcf)
Minimum Void Ratio
Maximum Void Ratio
Ottawa Sand 96.8 114.1 0.45 0.71 MDOT Backfill 98.8 122.6 0.39 0.72 Glacial Till 85.0 125.5 0.34 0.98
10.4. Atterberg Limits
Atterberg limits were found for the glacial till due to its high fines content. This testing was conducted in accordance with ASTM D4318.
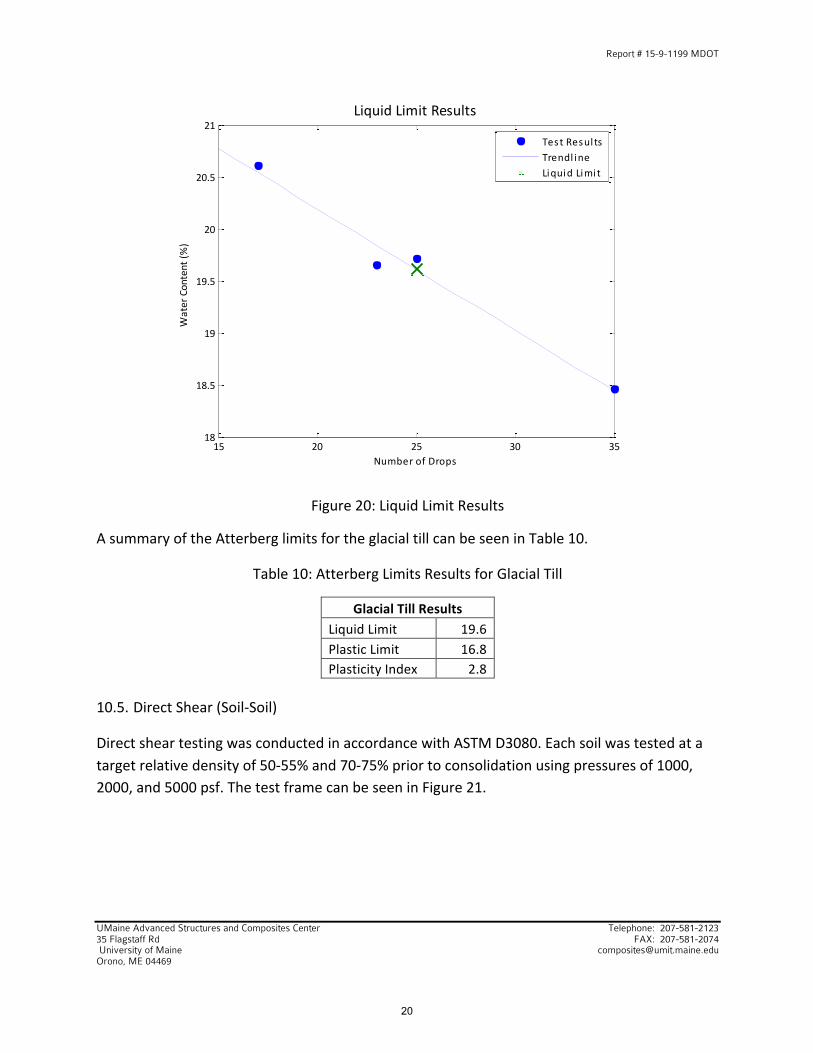
The results of the liquid limit test can be seen in Figure 20.
2 4 6 8 10 12 14 16 18117
118
119
120
121
122
123
124
125
126
127
128Glacial Till Modified Proctor
Water Content (%)
Dry Unit W
eight (pcf)
Test DataTrendl ineZero Air Voids
19
Report # 15-9-1199 MDOT
UMaine Advanced Structures and Composites Center Telephone: 207-581-2123 35 Flagstaff Rd FAX: 207-581-2074 University of Maine [email protected] www.composites.umaine.edu Orono, ME 04469
Figure 20: Liquid Limit Results
A summary of the Atterberg limits for the glacial till can be seen in Table 10.
Table 10: Atterberg Limits Results for Glacial Till
Glacial Till Results Liquid Limit 19.6 Plastic Limit 16.8 Plasticity Index 2.8
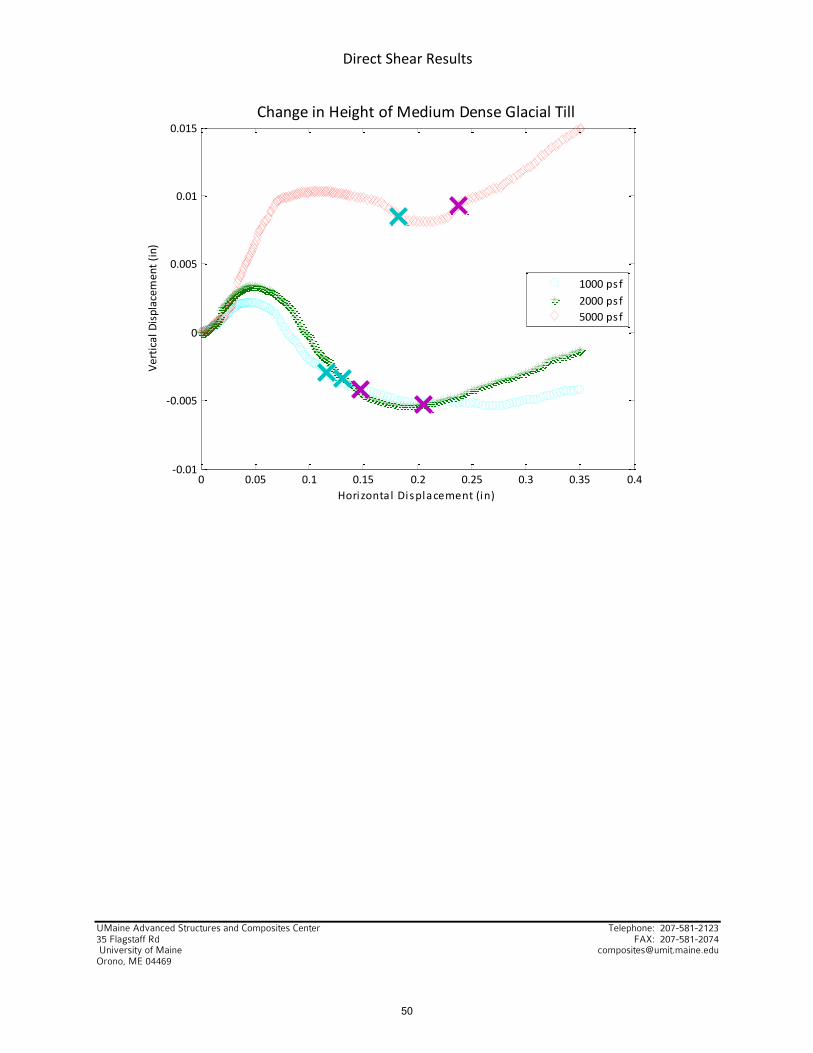
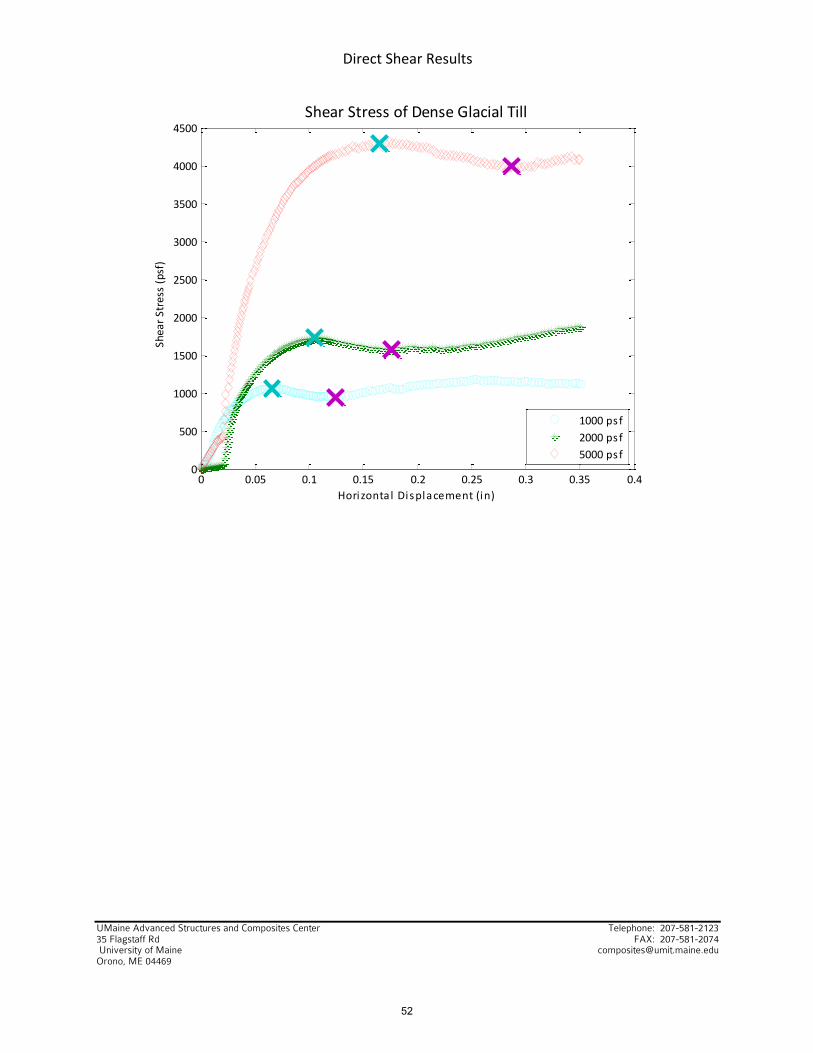
10.5. Direct Shear (Soil-‐Soil)
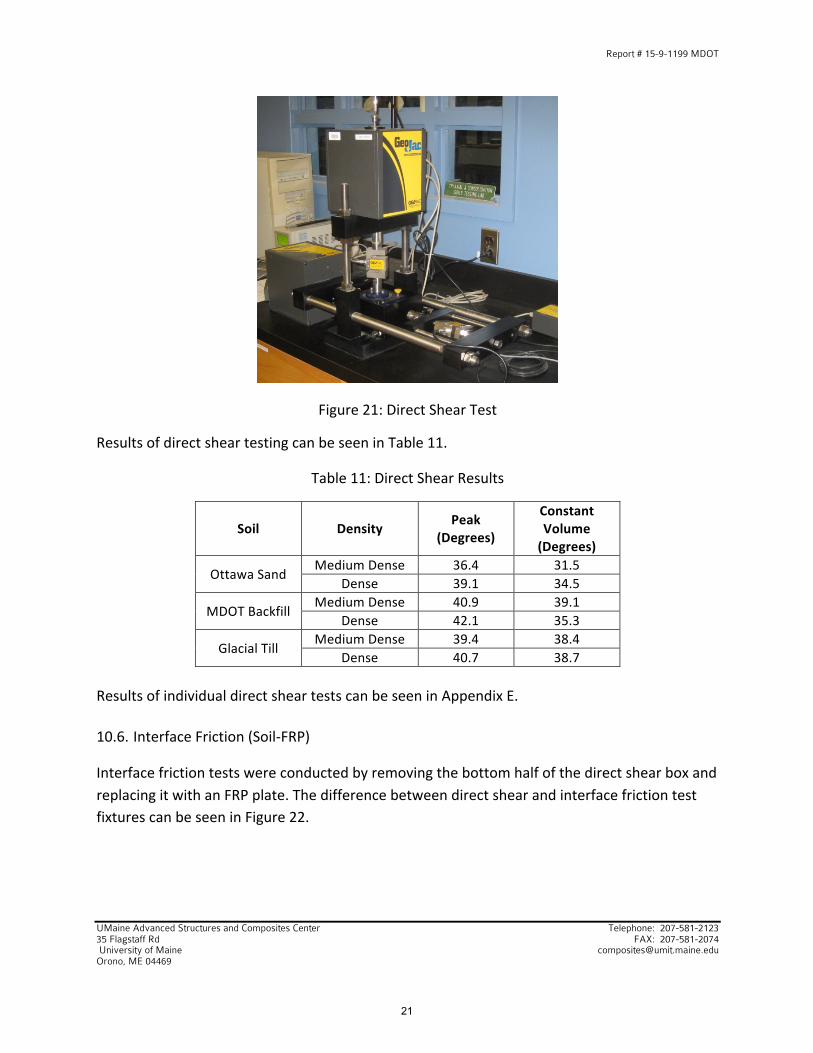
Direct shear testing was conducted in accordance with ASTM D3080. Each soil was tested at a target relative density of 50-‐55% and 70-‐75% prior to consolidation using pressures of 1000, 2000, and 5000 psf. The test frame can be seen in Figure 21.
15 20 25 30 3518
18.5
19
19.5
20
20.5
21
Number of Drops
Water Content (%
)
Liquid Limit Results
Test ResultsTrendl ineLiquid Limit
20
Report # 15-9-1199 MDOT
UMaine Advanced Structures and Composites Center Telephone: 207-581-2123 35 Flagstaff Rd FAX: 207-581-2074 University of Maine [email protected] www.composites.umaine.edu Orono, ME 04469
Figure 21: Direct Shear Test
Results of direct shear testing can be seen in Table 11.
Table 11: Direct Shear Results
Soil Density Peak (Degrees)
Constant Volume (Degrees)
Ottawa Sand Medium Dense 36.4 31.5
Dense 39.1 34.5
MDOT Backfill Medium Dense 40.9 39.1
Dense 42.1 35.3
Glacial Till Medium Dense 39.4 38.4
Dense 40.7 38.7
Results of individual direct shear tests can be seen in Appendix E.
10.6. Interface Friction (Soil-‐FRP)
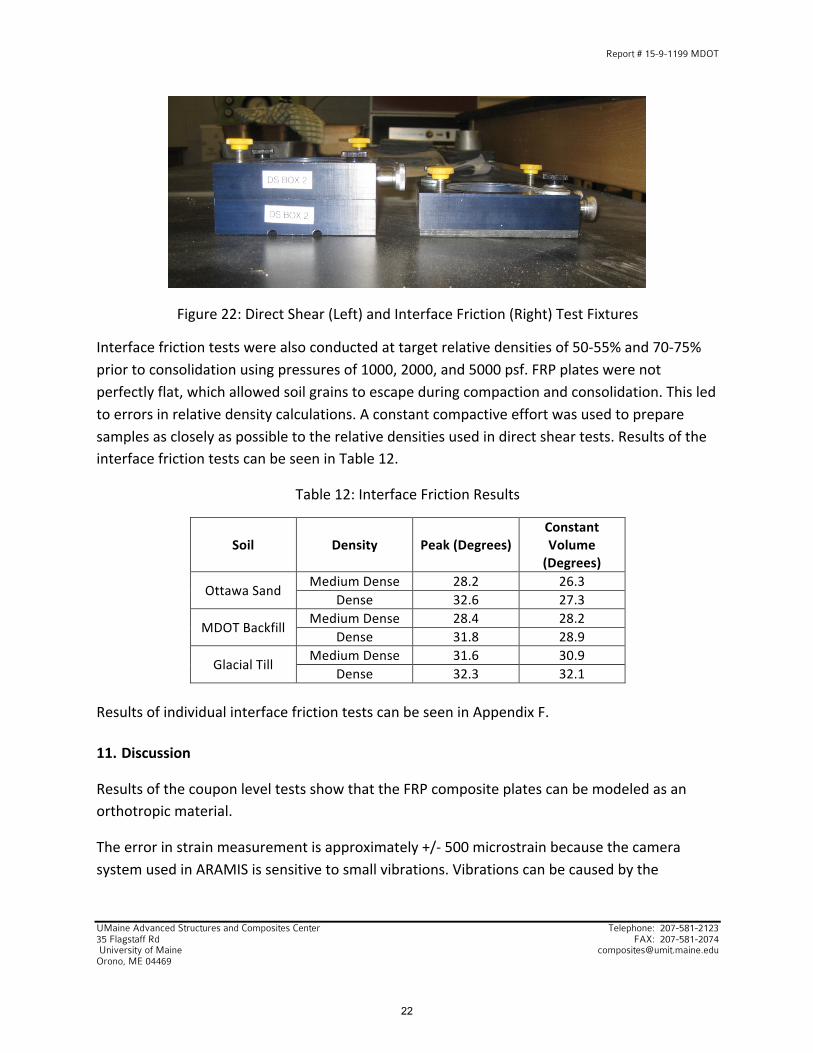
Interface friction tests were conducted by removing the bottom half of the direct shear box and replacing it with an FRP plate. The difference between direct shear and interface friction test fixtures can be seen in Figure 22.
21
Report # 15-9-1199 MDOT
UMaine Advanced Structures and Composites Center Telephone: 207-581-2123 35 Flagstaff Rd FAX: 207-581-2074 University of Maine [email protected] www.composites.umaine.edu Orono, ME 04469
Figure 22: Direct Shear (Left) and Interface Friction (Right) Test Fixtures
Interface friction tests were also conducted at target relative densities of 50-‐55% and 70-‐75% prior to consolidation using pressures of 1000, 2000, and 5000 psf. FRP plates were not perfectly flat, which allowed soil grains to escape during compaction and consolidation. This led to errors in relative density calculations. A constant compactive effort was used to prepare samples as closely as possible to the relative densities used in direct shear tests. Results of the interface friction tests can be seen in Table 12.
Table 12: Interface Friction Results
Soil Density Peak (Degrees) Constant Volume (Degrees)
Ottawa Sand Medium Dense 28.2 26.3
Dense 32.6 27.3
MDOT Backfill Medium Dense 28.4 28.2
Dense 31.8 28.9
Glacial Till Medium Dense 31.6 30.9
Dense 32.3 32.1
Results of individual interface friction tests can be seen in Appendix F.
11. Discussion
Results of the coupon level tests show that the FRP composite plates can be modeled as an orthotropic material.
The error in strain measurement is approximately +/-‐ 500 microstrain because the camera system used in ARAMIS is sensitive to small vibrations. Vibrations can be caused by the
22

Report # 15-9-1199 MDOT
UMaine Advanced Structures and Composites Center Telephone: 207-581-2123 35 Flagstaff Rd FAX: 207-581-2074 University of Maine [email protected] www.composites.umaine.edu Orono, ME 04469
hydraulic system used in the laboratory, temperature and humidity control systems, and nearby activity in the laboratory. This error is relatively small when measuring strains in the direction of loading, but it will be larger when measuring strains perpendicular to the direction of loading because the ultimate strain is smaller. This can lead to error in calculating Poisson’s ratio. Poisson’s ratio calculations using longitudinal tension coupons are considered the most representative because the area for strain measurement is the largest. This allows some of the error in the measurement to be averaged out. Poisson’s ratio (νxy) was found to be 0.31 with a coefficient of variation of 13.6%.
12. Conclusions
A summary of coupon level mechanical properties can be seen in Table 13.
Table 13: Average Mechanical Properties of FRP Plates
Test Orientation of Properties
Ultimate Strength (ksi)
Ultimate Strain
(Microstrain)
Modulus (ksi)
Poisson’s Ratio
Longitudinal Tension X 76.9 2.56E+04 3.26E+03 0.31 (νxy)
Hoop Tension Y 25.3 2.27E+04 1.98E+03 ─
Longitudinal Compression X 72.0 -‐2.17E+04 3.67E+03 ─
Hoop Compression Y 34.7 -‐1.65E+04 2.14E+03 ─
In-‐Plane Shear XY 22.3 2.88E+04 8.49E+02 ─
Stress-‐strain relationships of representative tension and compression samples are presented in Figure 23.
23

Report # 15-9-1199 MDOT
UMaine Advanced Structures and Composites Center Telephone: 207-581-2123 35 Flagstaff Rd FAX: 207-581-2074 University of Maine [email protected] www.composites.umaine.edu Orono, ME 04469
Figure 23: Representative Tension and Compression Samples
A summary of soil friction test results can be seen in Table 14.
Table 14: Summary of Soil Friction Testing
Sample Direct Shear Interface Friction
Soil Density Peak (Degrees)
Constant Volume (Degrees)
Peak (Degrees) Constant Volume (Degrees)
Ottawa Sand Medium Dense 36.4 31.5 28.2 26.3
Dense 39.1 34.5 32.6 27.3
MDOT Backfill Medium Dense 40.9 39.1 28.4 28.2
Dense 42.1 35.3 31.8 28.9
Glacial Till Medium Dense 39.4 38.4 31.6 30.9
Dense 40.7 38.7 32.3 32.1
-‐3 -‐2 -‐1 0 1 2 3
x 104
-‐80
-‐60
-‐40
-‐20
0
20
40
60
80Representative Tension and Compression Coupons
Stra in (microstra in)
Stress (ksi)
Longi tudinal Tens ionHoop Tens ionLongitudinal Compress ionHoop Compress ion
24

Appendix A: Tension Results
25

Tension Results
UMaine Advanced Structures and Composites Center Telephone: 207-581-2123 35 Flagstaff Rd FAX: 207-581-2074 University of Maine [email protected] www.composites.umaine.edu Orono, ME 04469
26

Tension Results
UMaine Advanced Structures and Composites Center Telephone: 207-581-2123 35 Flagstaff Rd FAX: 207-581-2074 University of Maine [email protected] www.composites.umaine.edu Orono, ME 04469
27
Tension Results
UMaine Advanced Structures and Composites Center Telephone: 207-581-2123 35 Flagstaff Rd FAX: 207-581-2074 University of Maine [email protected] www.composites.umaine.edu Orono, ME 04469
28

Tension Results
UMaine Advanced Structures and Composites Center Telephone: 207-581-2123 35 Flagstaff Rd FAX: 207-581-2074 University of Maine [email protected] www.composites.umaine.edu Orono, ME 04469
29
Tension Results
UMaine Advanced Structures and Composites Center Telephone: 207-581-2123 35 Flagstaff Rd FAX: 207-581-2074 University of Maine [email protected] www.composites.umaine.edu Orono, ME 04469
30
Tension Results
UMaine Advanced Structures and Composites Center Telephone: 207-581-2123 35 Flagstaff Rd FAX: 207-581-2074 University of Maine [email protected] www.composites.umaine.edu Orono, ME 04469
31

Appendix B: Compression Results
32
Compression Results
UMaine Advanced Structures and Composites Center Telephone: 207-581-2123 35 Flagstaff Rd FAX: 207-581-2074 University of Maine [email protected] www.composites.umaine.edu Orono, ME 04469
33
Compression Results
UMaine Advanced Structures and Composites Center Telephone: 207-581-2123 35 Flagstaff Rd FAX: 207-581-2074 University of Maine [email protected] www.composites.umaine.edu Orono, ME 04469
34
Compression Results
UMaine Advanced Structures and Composites Center Telephone: 207-581-2123 35 Flagstaff Rd FAX: 207-581-2074 University of Maine [email protected] www.composites.umaine.edu Orono, ME 04469
35
Compression Results
UMaine Advanced Structures and Composites Center Telephone: 207-581-2123 35 Flagstaff Rd FAX: 207-581-2074 University of Maine [email protected] www.composites.umaine.edu Orono, ME 04469
36
Compression Results
UMaine Advanced Structures and Composites Center Telephone: 207-581-2123 35 Flagstaff Rd FAX: 207-581-2074 University of Maine [email protected] www.composites.umaine.edu Orono, ME 04469
37
Compression Results
UMaine Advanced Structures and Composites Center Telephone: 207-581-2123 35 Flagstaff Rd FAX: 207-581-2074 University of Maine [email protected] www.composites.umaine.edu Orono, ME 04469
38

Appendix C: Shear Results
39
Shear Results
UMaine Advanced Structures and Composites Center Telephone: 207-581-2123 35 Flagstaff Rd FAX: 207-581-2074 University of Maine [email protected] www.composites.umaine.edu Orono, ME 04469
40

Shear Results
UMaine Advanced Structures and Composites Center Telephone: 207-581-2123 35 Flagstaff Rd FAX: 207-581-2074 University of Maine [email protected] www.composites.umaine.edu Orono, ME 04469
41

Shear Results
UMaine Advanced Structures and Composites Center Telephone: 207-581-2123 35 Flagstaff Rd FAX: 207-581-2074 University of Maine [email protected] www.composites.umaine.edu Orono, ME 04469
42
Shear Results
UMaine Advanced Structures and Composites Center Telephone: 207-581-2123 35 Flagstaff Rd FAX: 207-581-2074 University of Maine [email protected] www.composites.umaine.edu Orono, ME 04469
43
Appendix D: Glass Transition Temperature Results
44

Glass Transition Temperature Results
UMaine Advanced Structures and Composites Center Telephone: 207-581-2123 35 Flagstaff Rd FAX: 207-581-2074 University of Maine [email protected] www.composites.umaine.edu Orono, ME 04469
45
Glass Transition Temperature Results
UMaine Advanced Structures and Composites Center Telephone: 207-581-2123 35 Flagstaff Rd FAX: 207-581-2074 University of Maine [email protected] www.composites.umaine.edu Orono, ME 04469
46

Glass Transition Temperature Results
UMaine Advanced Structures and Composites Center Telephone: 207-581-2123 35 Flagstaff Rd FAX: 207-581-2074 University of Maine [email protected] www.composites.umaine.edu Orono, ME 04469
47
Glass Transition Temperature Results
UMaine Advanced Structures and Composites Center Telephone: 207-581-2123 35 Flagstaff Rd FAX: 207-581-2074 University of Maine [email protected] www.composites.umaine.edu Orono, ME 04469
48
Appendix E: Direct Shear Results
49
Direct Shear Results
UMaine Advanced Structures and Composites Center Telephone: 207-581-2123 35 Flagstaff Rd FAX: 207-581-2074 University of Maine [email protected] www.composites.umaine.edu Orono, ME 04469
0 0.05 0.1 0.15 0.2 0.25 0.3 0.35 0.4-‐0.01
-‐0.005
0
0.005
0.01
0.015Change in Height of Medium Dense Glacial Till
Horizontal Displacement (in)
Vertical Displacem
ent (in)
1000 psf2000 psf5000 psf
50

Direct Shear Results
UMaine Advanced Structures and Composites Center Telephone: 207-581-2123 35 Flagstaff Rd FAX: 207-581-2074 University of Maine [email protected] www.composites.umaine.edu Orono, ME 04469
0 1000 2000 3000 4000 5000 60000
500
1000
1500
2000
2500
3000
3500
4000
4500
5000Friction Angle of Medium Dense Glacial Till
Normal Stress (ps f)
Shear S
tress (psf)
PeakPeak Trendl ineConstant VolumeConstant Volume Trendl ine
51
Direct Shear Results
UMaine Advanced Structures and Composites Center Telephone: 207-581-2123 35 Flagstaff Rd FAX: 207-581-2074 University of Maine [email protected] www.composites.umaine.edu Orono, ME 04469
0 0.05 0.1 0.15 0.2 0.25 0.3 0.35 0.40
500
1000
1500
2000
2500
3000
3500
4000
4500Shear Stress of Dense Glacial Till
Horizontal Displacement (in)
Shear S
tress (psf)
1000 psf2000 psf5000 psf
52

Direct Shear Results
UMaine Advanced Structures and Composites Center Telephone: 207-581-2123 35 Flagstaff Rd FAX: 207-581-2074 University of Maine [email protected] www.composites.umaine.edu Orono, ME 04469
0 0.05 0.1 0.15 0.2 0.25 0.3 0.35 0.4-‐0.025
-‐0.02
-‐0.015
-‐0.01
-‐0.005
0
0.005Change in Height of Dense Glacial Till
Horizontal Displacement (in)
Vertical Displacem
ent (in)
1000 psf2000 psf5000 psf
53

Direct Shear Results
UMaine Advanced Structures and Composites Center Telephone: 207-581-2123 35 Flagstaff Rd FAX: 207-581-2074 University of Maine [email protected] www.composites.umaine.edu Orono, ME 04469
0 1000 2000 3000 4000 5000 60000
500
1000
1500
2000
2500
3000
3500
4000
4500
5000Friction Angle of Dense Glacial Till
Normal Stress (ps f)
Shear S
tress (psf)
PeakPeak Trendl ineConstant VolumeConstant Volume Trendl ine
54

Direct Shear Results
UMaine Advanced Structures and Composites Center Telephone: 207-581-2123 35 Flagstaff Rd FAX: 207-581-2074 University of Maine [email protected] www.composites.umaine.edu Orono, ME 04469
0 0.05 0.1 0.15 0.2 0.25 0.3 0.35 0.40
500
1000
1500
2000
2500
3000
3500
4000
4500Shear Stress of Medium Dense MDOT Backfill
Horizontal Displacement (in)
Shear S
tress (psf)
1000 psf2000 psf5000 psf
55

Direct Shear Results
UMaine Advanced Structures and Composites Center Telephone: 207-581-2123 35 Flagstaff Rd FAX: 207-581-2074 University of Maine [email protected] www.composites.umaine.edu Orono, ME 04469
0 0.05 0.1 0.15 0.2 0.25 0.3 0.35 0.4-‐0.025
-‐0.02
-‐0.015
-‐0.01
-‐0.005
0
0.005Change in Height of Medium Dense MDOT Backfill
Horizontal Displacement (in)
Vertical Displacem
ent (in)
1000 psf2000 psf5000 psf
56
Direct Shear Results
UMaine Advanced Structures and Composites Center Telephone: 207-581-2123 35 Flagstaff Rd FAX: 207-581-2074 University of Maine [email protected] www.composites.umaine.edu Orono, ME 04469
0 1000 2000 3000 4000 5000 60000
500
1000
1500
2000
2500
3000
3500
4000
4500
5000Friction Angle of Medium Dense MDOT Backfill
Normal Stress (ps f)
Shear S
tress (psf)
PeakPeak Trendl ineConstant VolumeConstant Volume Trendl ine
57
Direct Shear Results
UMaine Advanced Structures and Composites Center Telephone: 207-581-2123 35 Flagstaff Rd FAX: 207-581-2074 University of Maine [email protected] www.composites.umaine.edu Orono, ME 04469
0 0.05 0.1 0.15 0.2 0.25 0.3 0.35 0.40
500
1000
1500
2000
2500
3000
3500
4000
4500
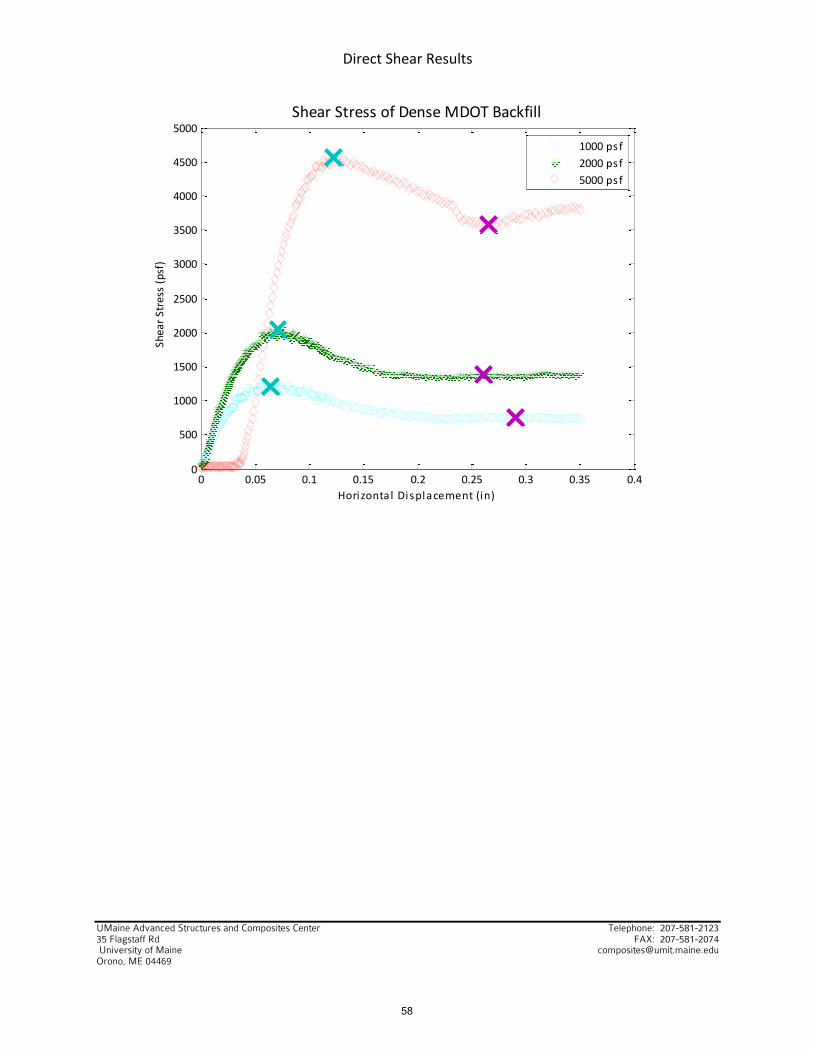
5000Shear Stress of Dense MDOT Backfill
Horizontal Displacement (in)
Shear S
tress (psf)
1000 psf2000 psf5000 psf
58
Direct Shear Results
UMaine Advanced Structures and Composites Center Telephone: 207-581-2123 35 Flagstaff Rd FAX: 207-581-2074 University of Maine [email protected] www.composites.umaine.edu Orono, ME 04469
0 0.05 0.1 0.15 0.2 0.25 0.3 0.35 0.4-‐0.035
-‐0.03
-‐0.025
-‐0.02
-‐0.015
-‐0.01
-‐0.005
0
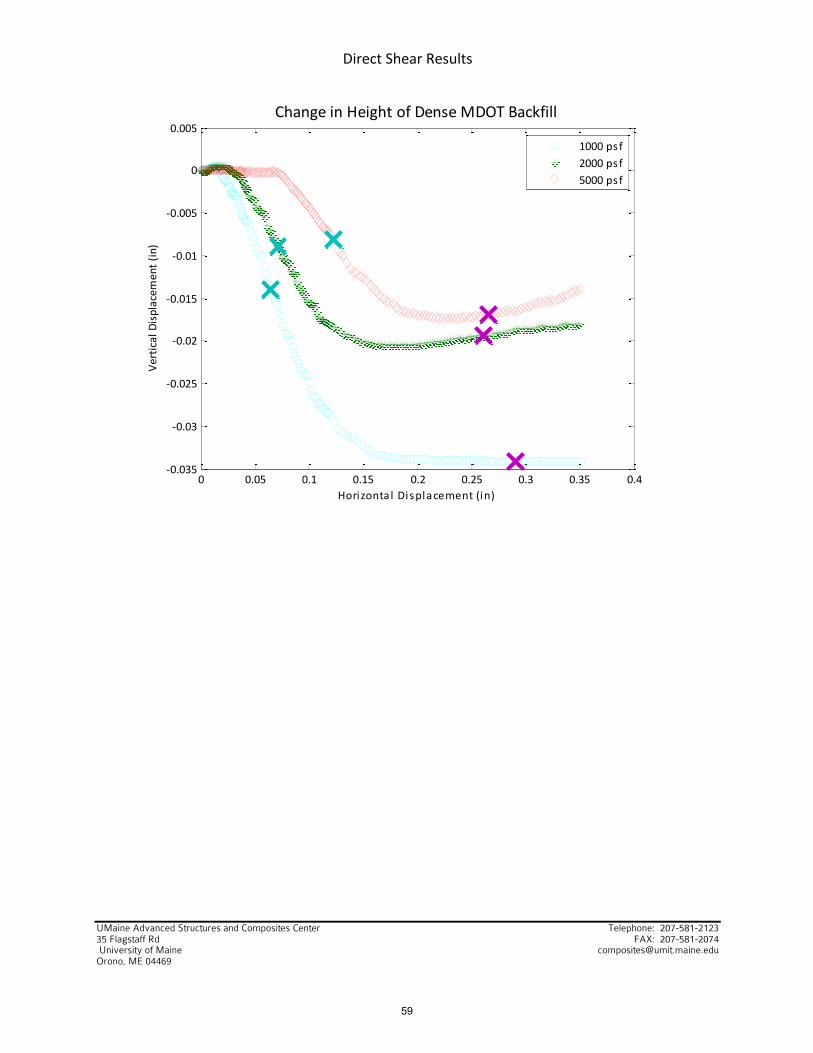
0.005Change in Height of Dense MDOT Backfill
Horizontal Displacement (in)
Vertical Displacem
ent (in)
1000 psf2000 psf5000 psf
59

Direct Shear Results
UMaine Advanced Structures and Composites Center Telephone: 207-581-2123 35 Flagstaff Rd FAX: 207-581-2074 University of Maine [email protected] www.composites.umaine.edu Orono, ME 04469
0 1000 2000 3000 4000 5000 60000
500
1000
1500
2000
2500
3000
3500
4000
4500
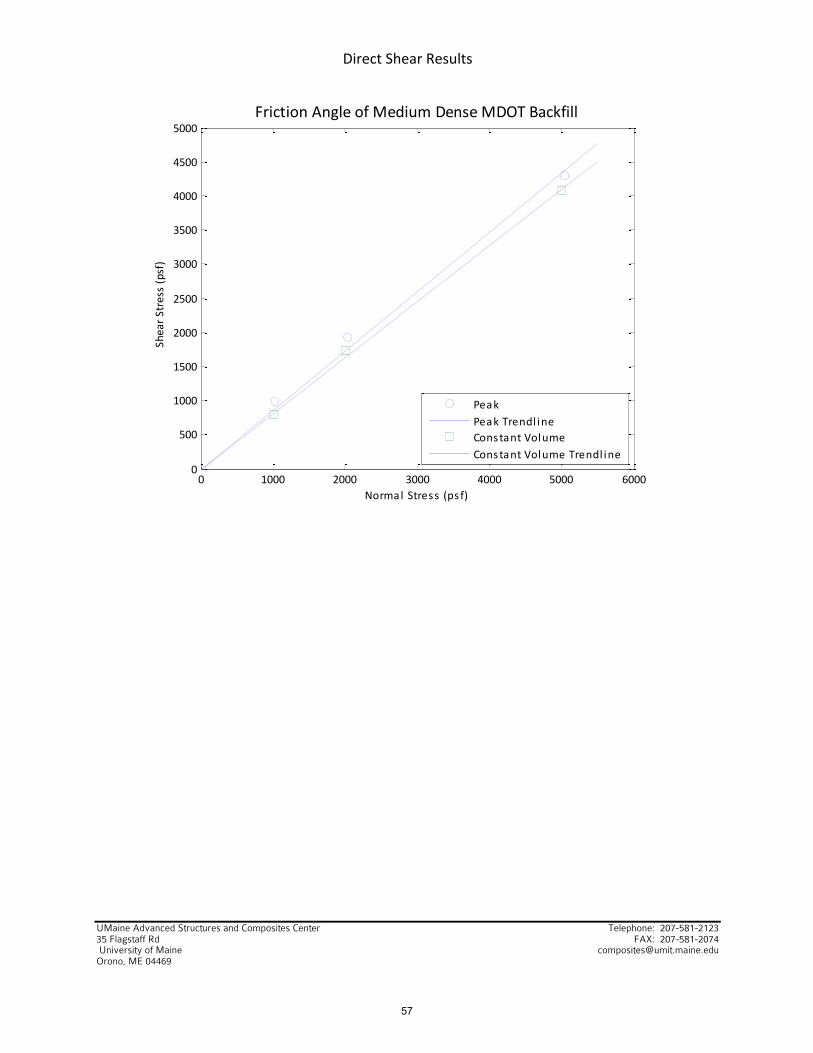
5000Friction Angle of Dense MDOT Backfill
Normal Stress (ps f)
Shear S
tress (psf)
PeakPeak Trendl ineConstant VolumeConstant Volume Trendl ine
60
Direct Shear Results
UMaine Advanced Structures and Composites Center Telephone: 207-581-2123 35 Flagstaff Rd FAX: 207-581-2074 University of Maine [email protected] www.composites.umaine.edu Orono, ME 04469
0 0.05 0.1 0.15 0.2 0.25 0.3 0.35 0.40
500
1000
1500
2000
2500
3000
3500
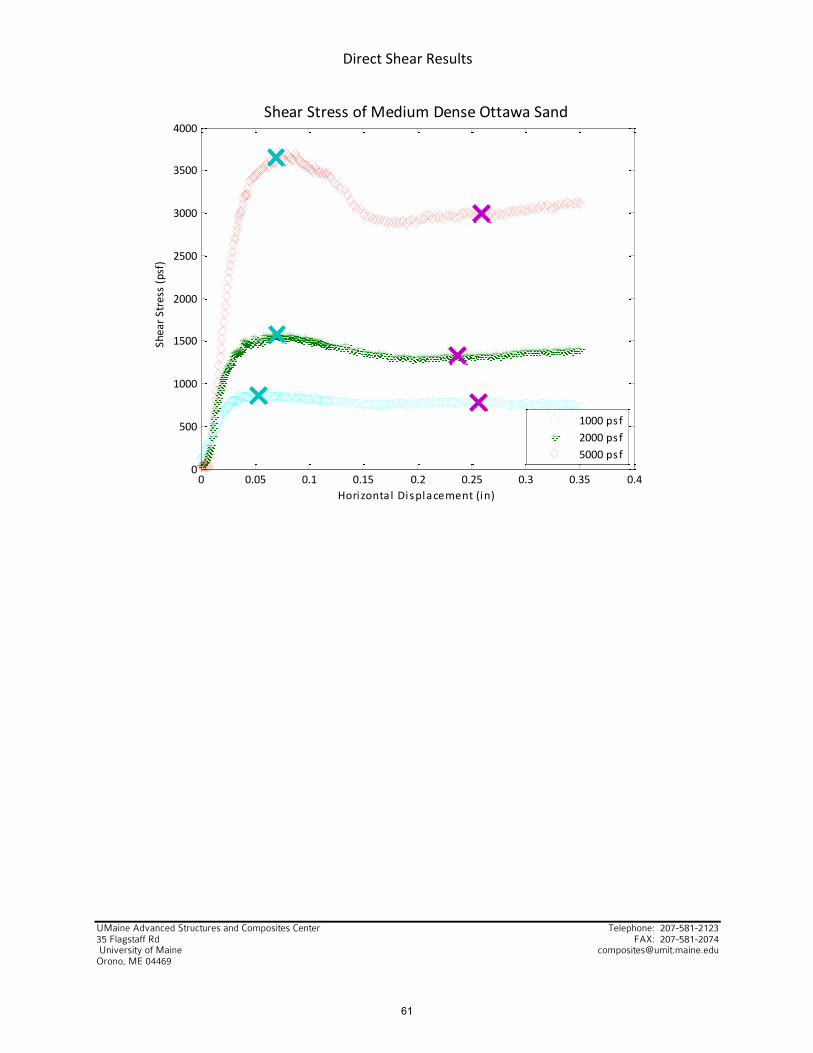
4000Shear Stress of Medium Dense Ottawa Sand
Horizontal Displacement (in)
Shear S
tress (psf)
1000 psf2000 psf5000 psf
61
Direct Shear Results
UMaine Advanced Structures and Composites Center Telephone: 207-581-2123 35 Flagstaff Rd FAX: 207-581-2074 University of Maine [email protected] www.composites.umaine.edu Orono, ME 04469
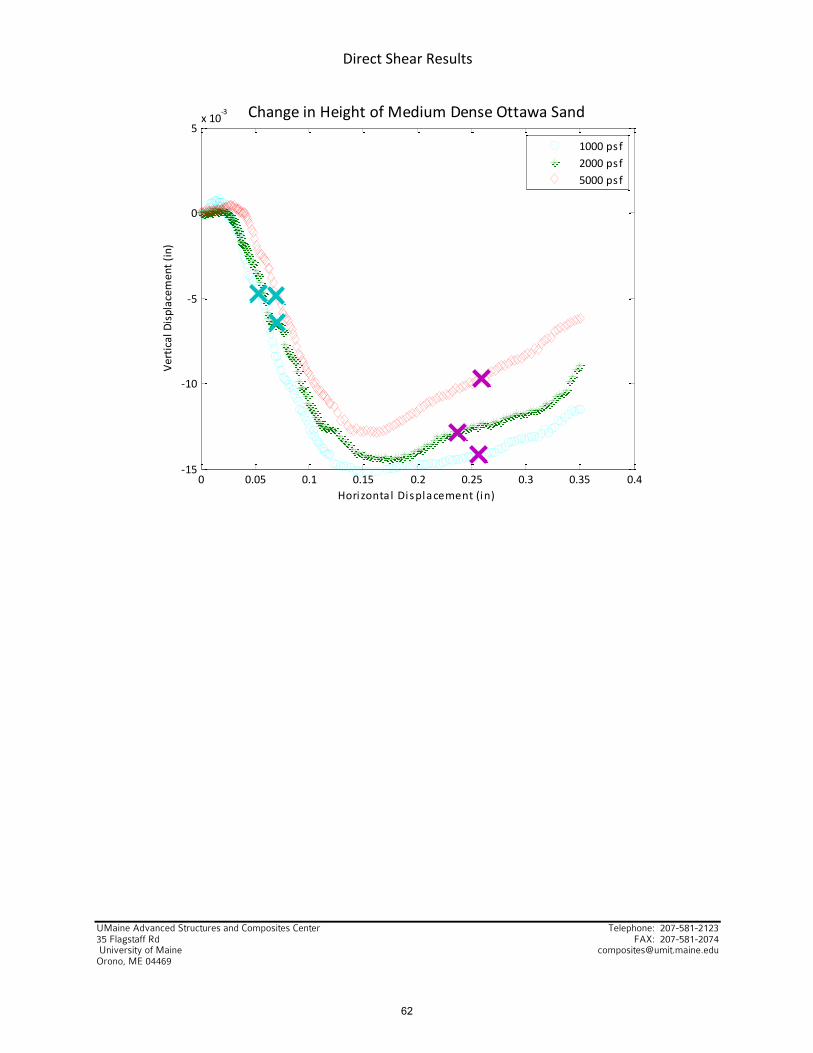
0 0.05 0.1 0.15 0.2 0.25 0.3 0.35 0.4-‐15
-‐10
-‐5
0
5x 10
-‐3 Change in Height of Medium Dense Ottawa Sand
Horizontal Displacement (in)
Vertical Displacem
ent (in)
1000 psf2000 psf5000 psf
62

Direct Shear Results
UMaine Advanced Structures and Composites Center Telephone: 207-581-2123 35 Flagstaff Rd FAX: 207-581-2074 University of Maine [email protected] www.composites.umaine.edu Orono, ME 04469
0 1000 2000 3000 4000 5000 60000
500
1000
1500
2000
2500
3000
3500
4000
4500Friction Angle of Medium Dense Ottawa Sand
Normal Stress (ps f)
Shear S
tress (psf)
PeakPeak Trendl ineConstant VolumeConstant Volume Trendl ine
63
Direct Shear Results
UMaine Advanced Structures and Composites Center Telephone: 207-581-2123 35 Flagstaff Rd FAX: 207-581-2074 University of Maine [email protected] www.composites.umaine.edu Orono, ME 04469
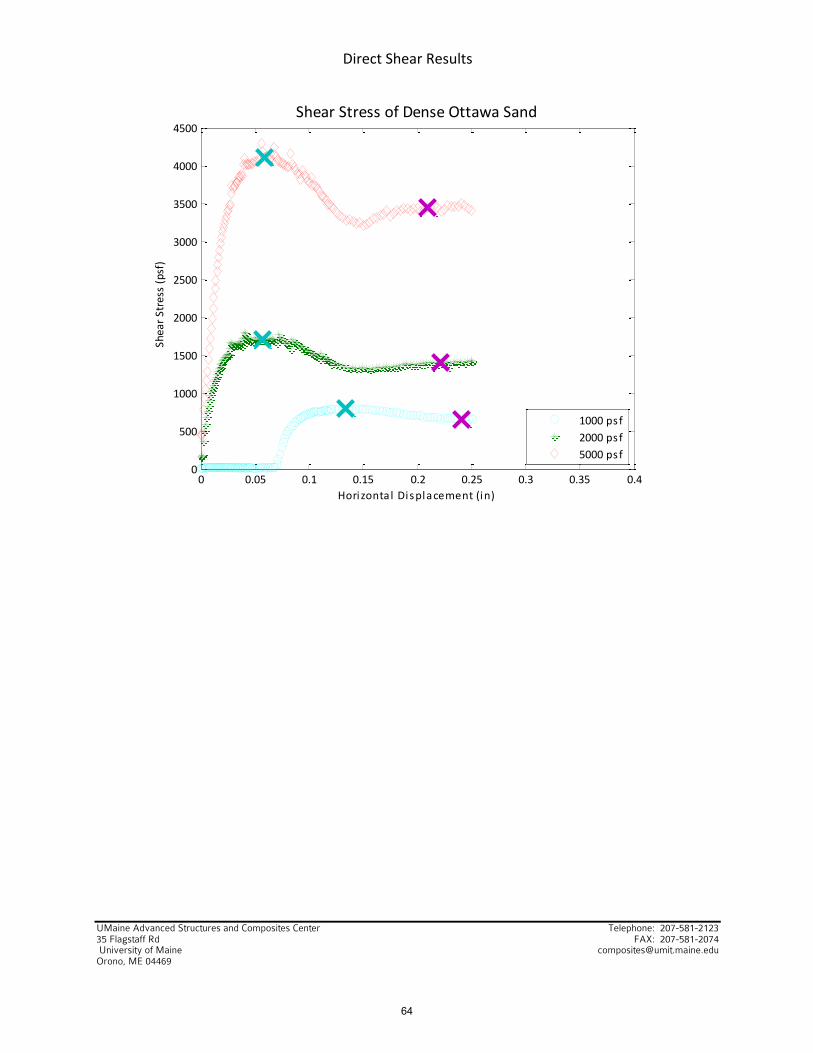
0 0.05 0.1 0.15 0.2 0.25 0.3 0.35 0.40
500
1000
1500
2000
2500
3000
3500
4000
4500Shear Stress of Dense Ottawa Sand
Horizontal Displacement (in)
Shear S
tress (psf)
1000 psf2000 psf5000 psf
64
Direct Shear Results
UMaine Advanced Structures and Composites Center Telephone: 207-581-2123 35 Flagstaff Rd FAX: 207-581-2074 University of Maine [email protected] www.composites.umaine.edu Orono, ME 04469
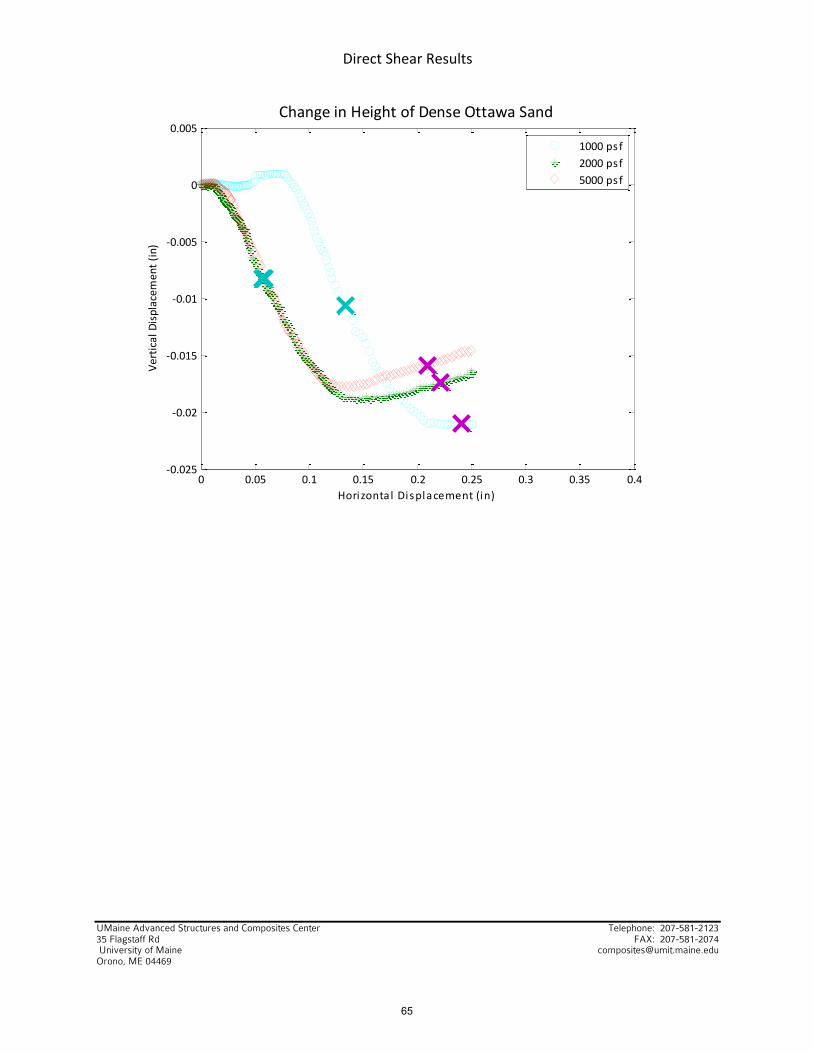
0 0.05 0.1 0.15 0.2 0.25 0.3 0.35 0.4-‐0.025
-‐0.02
-‐0.015
-‐0.01
-‐0.005
0
0.005Change in Height of Dense Ottawa Sand
Horizontal Displacement (in)
Vertical Displacem
ent (in)
1000 psf2000 psf5000 psf
65

Direct Shear Results
UMaine Advanced Structures and Composites Center Telephone: 207-581-2123 35 Flagstaff Rd FAX: 207-581-2074 University of Maine [email protected] www.composites.umaine.edu Orono, ME 04469
0 1000 2000 3000 4000 5000 60000
500
1000
1500
2000
2500
3000
3500
4000
4500Friction Angle of Dense Ottawa Sand
Normal Stress (ps f)
Shear S
tress (psf)
PeakPeak Trendl ineConstant VolumeConstant Volume Trendl ine
66

Appendix F: Interface Friction Results
67
Interface Friction Results
UMaine Advanced Structures and Composites Center Telephone: 207-581-2123 35 Flagstaff Rd FAX: 207-581-2074 University of Maine [email protected] www.composites.umaine.edu Orono, ME 04469
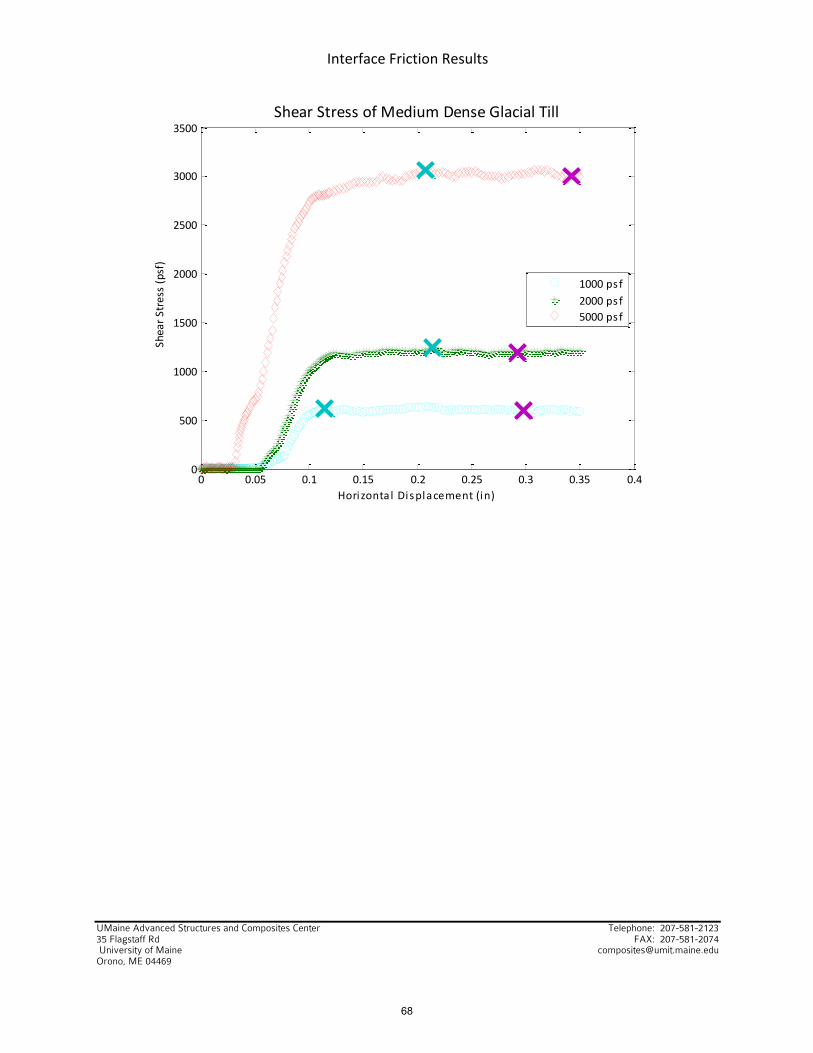
0 0.05 0.1 0.15 0.2 0.25 0.3 0.35 0.40
500
1000
1500
2000
2500
3000
3500Shear Stress of Medium Dense Glacial Till
Horizontal Displacement (in)
Shear S
tress (psf)
1000 psf2000 psf5000 psf
68
Interface Friction Results
UMaine Advanced Structures and Composites Center Telephone: 207-581-2123 35 Flagstaff Rd FAX: 207-581-2074 University of Maine [email protected] www.composites.umaine.edu Orono, ME 04469
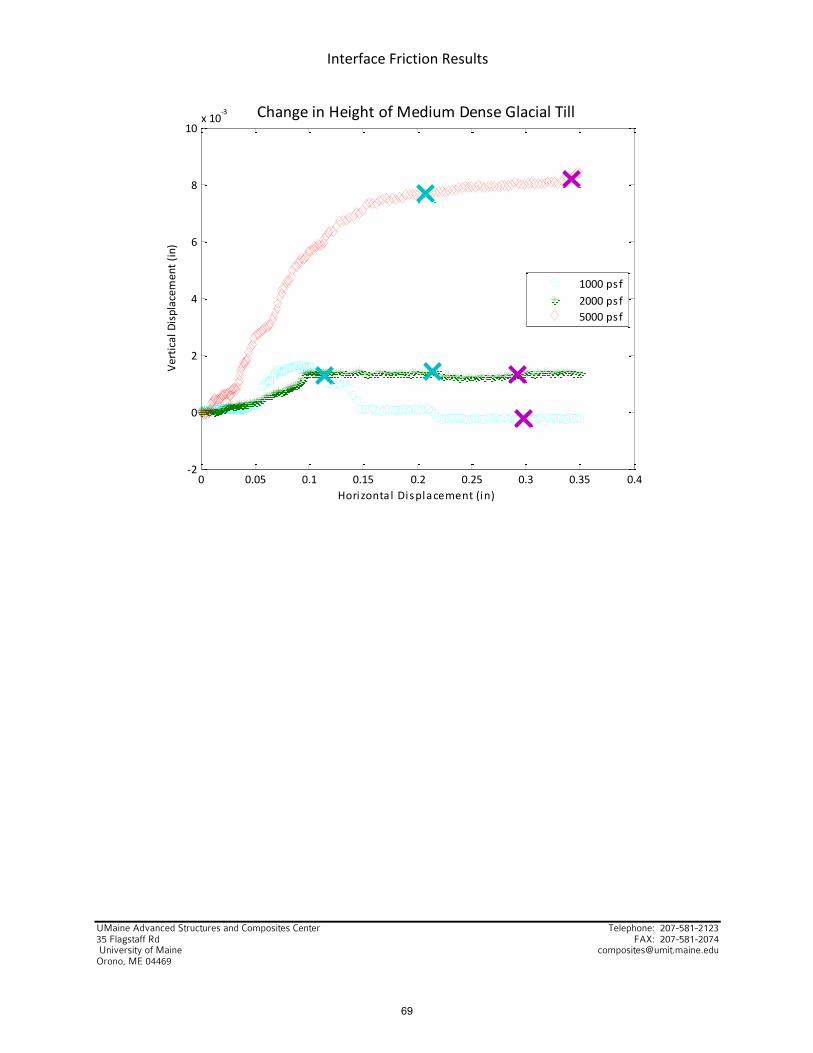
0 0.05 0.1 0.15 0.2 0.25 0.3 0.35 0.4-‐2
0
2
4
6
8
10x 10
-‐3 Change in Height of Medium Dense Glacial Till
Horizontal Displacement (in)
Vertical Displacem
ent (in)
1000 psf2000 psf5000 psf
69
Interface Friction Results
UMaine Advanced Structures and Composites Center Telephone: 207-581-2123 35 Flagstaff Rd FAX: 207-581-2074 University of Maine [email protected] www.composites.umaine.edu Orono, ME 04469
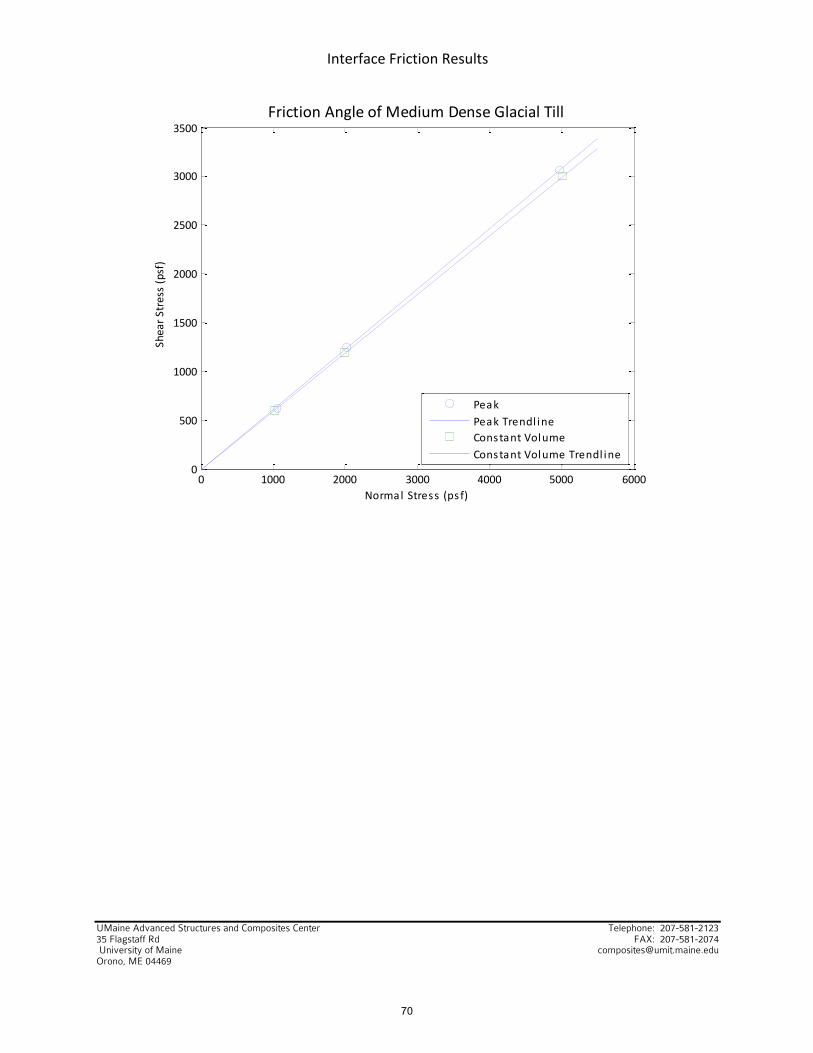
0 1000 2000 3000 4000 5000 60000
500
1000
1500
2000
2500
3000
3500Friction Angle of Medium Dense Glacial Till
Normal Stress (ps f)
Shear S
tress (psf)
PeakPeak Trendl ineConstant VolumeConstant Volume Trendl ine
70
Interface Friction Results
UMaine Advanced Structures and Composites Center Telephone: 207-581-2123 35 Flagstaff Rd FAX: 207-581-2074 University of Maine [email protected] www.composites.umaine.edu Orono, ME 04469
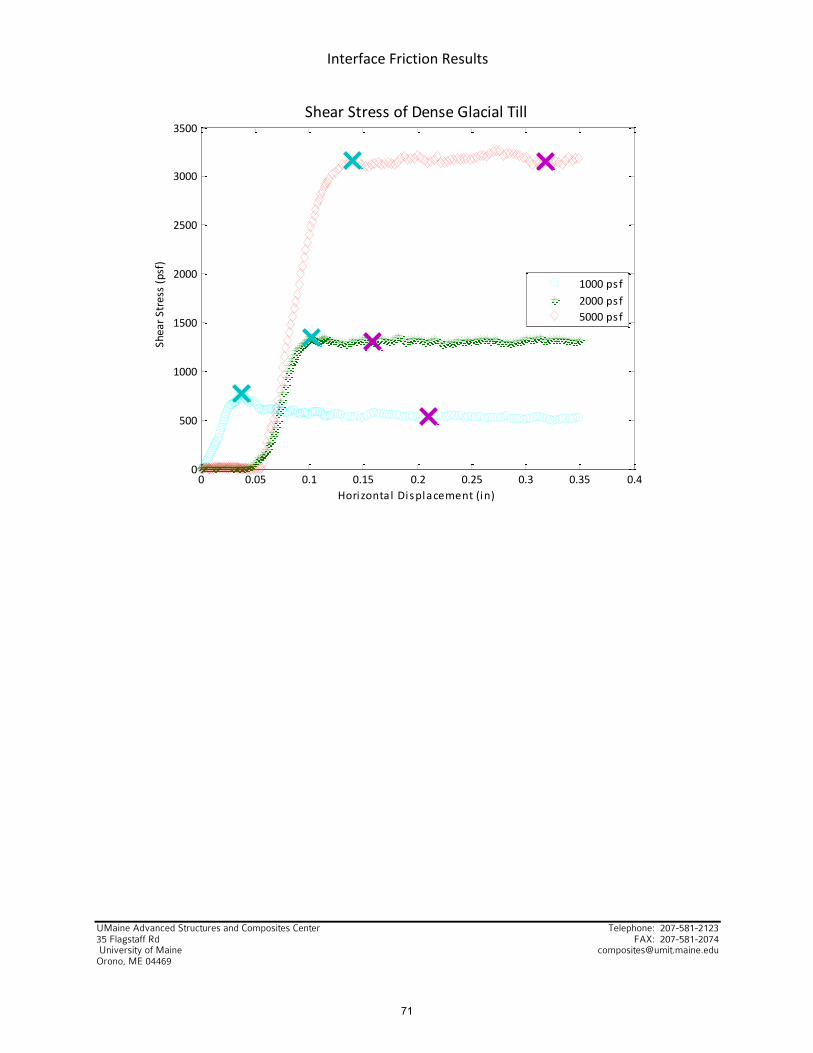
0 0.05 0.1 0.15 0.2 0.25 0.3 0.35 0.40
500
1000
1500
2000
2500
3000
3500Shear Stress of Dense Glacial Till
Horizontal Displacement (in)
Shear S
tress (psf)
1000 psf2000 psf5000 psf
71
Interface Friction Results
UMaine Advanced Structures and Composites Center Telephone: 207-581-2123 35 Flagstaff Rd FAX: 207-581-2074 University of Maine [email protected] www.composites.umaine.edu Orono, ME 04469
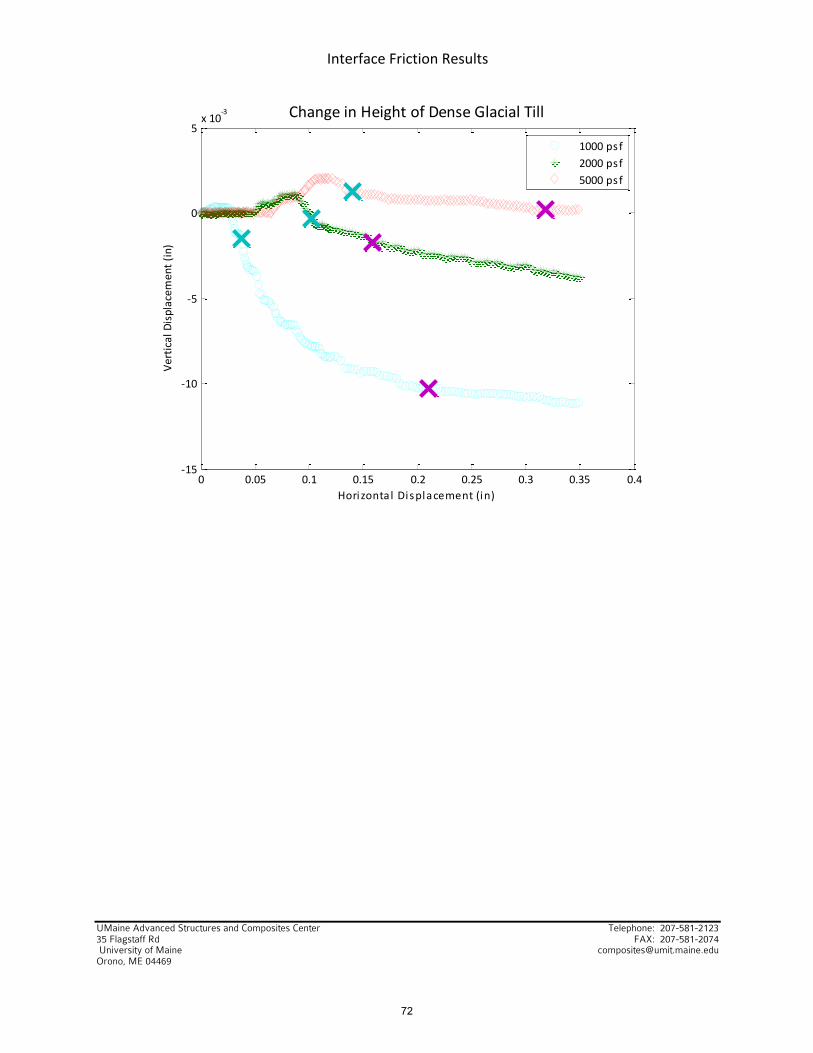
0 0.05 0.1 0.15 0.2 0.25 0.3 0.35 0.4-‐15
-‐10
-‐5
0
5x 10
-‐3 Change in Height of Dense Glacial Till
Horizontal Displacement (in)
Vertical Displacem
ent (in)
1000 psf2000 psf5000 psf
72

Interface Friction Results
UMaine Advanced Structures and Composites Center Telephone: 207-581-2123 35 Flagstaff Rd FAX: 207-581-2074 University of Maine [email protected] www.composites.umaine.edu Orono, ME 04469
0 1000 2000 3000 4000 5000 60000
500
1000
1500
2000
2500
3000
3500Friction Angle of Dense Glacial Till
Normal Stress (ps f)
Shear S
tress (psf)
PeakPeak Trendl ineConstant VolumeConstant Volume Trendl ine
73
Interface Friction Results
UMaine Advanced Structures and Composites Center Telephone: 207-581-2123 35 Flagstaff Rd FAX: 207-581-2074 University of Maine [email protected] www.composites.umaine.edu Orono, ME 04469
0 0.05 0.1 0.15 0.2 0.25 0.3 0.35 0.40
500
1000
1500
2000
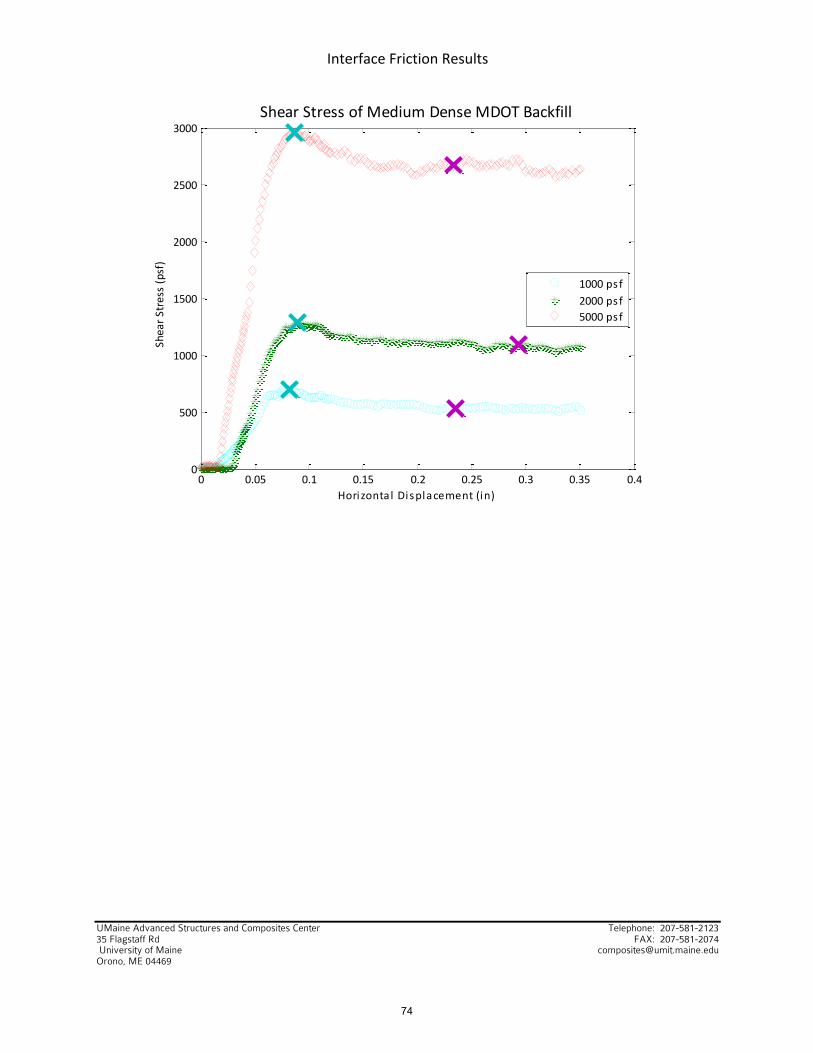
2500
3000Shear Stress of Medium Dense MDOT Backfill
Horizontal Displacement (in)
Shear S
tress (psf)
1000 psf2000 psf5000 psf
74
Interface Friction Results
UMaine Advanced Structures and Composites Center Telephone: 207-581-2123 35 Flagstaff Rd FAX: 207-581-2074 University of Maine [email protected] www.composites.umaine.edu Orono, ME 04469
0 0.05 0.1 0.15 0.2 0.25 0.3 0.35 0.4-‐6
-‐5
-‐4
-‐3
-‐2
-‐1
0
1
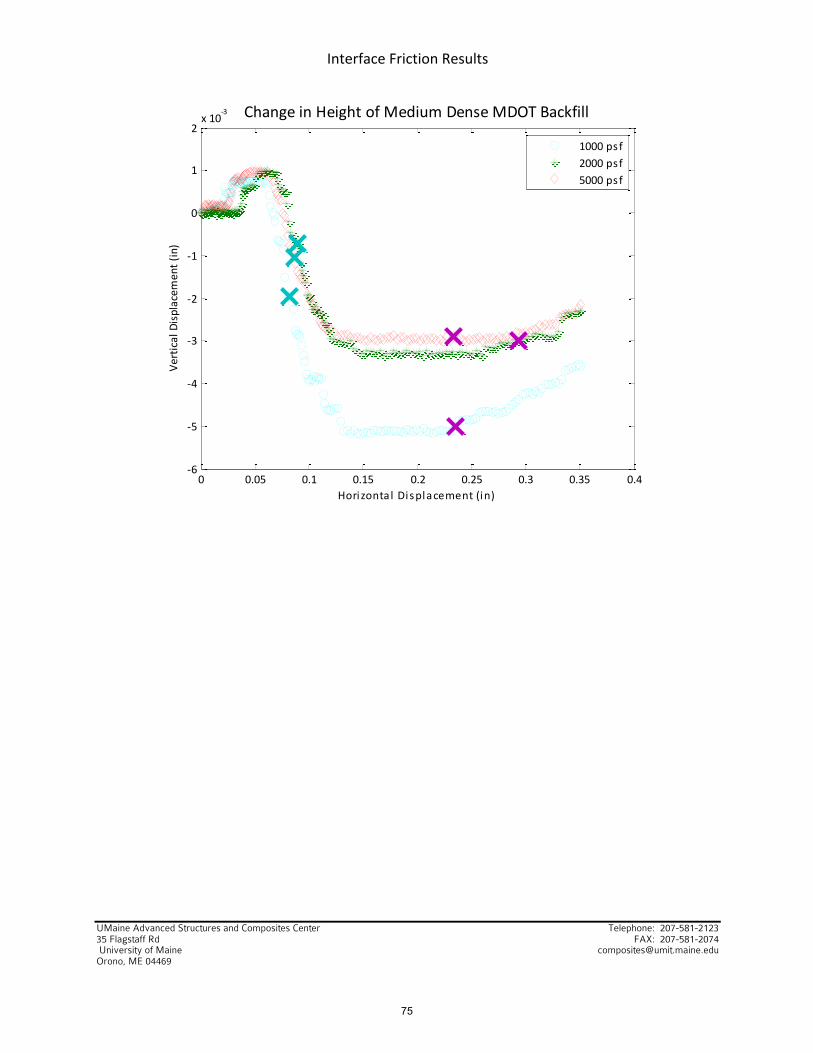
2x 10
-‐3 Change in Height of Medium Dense MDOT Backfill
Horizontal Displacement (in)
Vertical Displacem
ent (in)
1000 psf2000 psf5000 psf
75

Interface Friction Results
UMaine Advanced Structures and Composites Center Telephone: 207-581-2123 35 Flagstaff Rd FAX: 207-581-2074 University of Maine [email protected] www.composites.umaine.edu Orono, ME 04469
0 1000 2000 3000 4000 5000 60000
500
1000
1500
2000
2500
3000
3500Friction Angle of Medium Dense MDOT Backfill
Normal Stress (ps f)
Shear S
tress (psf)
PeakPeak Trendl ineConstant VolumeConstant Volume Trendl ine
76
Interface Friction Results
UMaine Advanced Structures and Composites Center Telephone: 207-581-2123 35 Flagstaff Rd FAX: 207-581-2074 University of Maine [email protected] www.composites.umaine.edu Orono, ME 04469
0 0.05 0.1 0.15 0.2 0.25 0.3 0.35 0.40
500
1000
1500
2000
2500
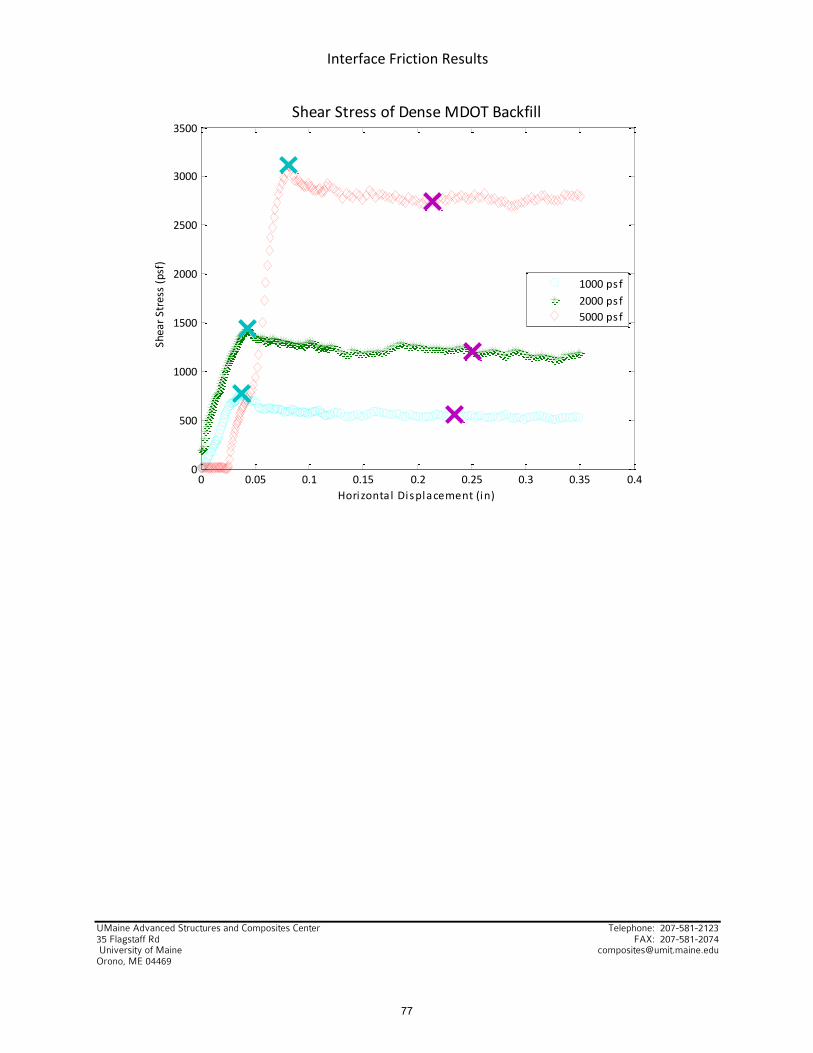
3000
3500Shear Stress of Dense MDOT Backfill
Horizontal Displacement (in)
Shear S
tress (psf)
1000 psf2000 psf5000 psf
77
Interface Friction Results
UMaine Advanced Structures and Composites Center Telephone: 207-581-2123 35 Flagstaff Rd FAX: 207-581-2074 University of Maine [email protected] www.composites.umaine.edu Orono, ME 04469
0 0.05 0.1 0.15 0.2 0.25 0.3 0.35 0.4-‐12
-‐10
-‐8
-‐6
-‐4
-‐2
0
2x 10
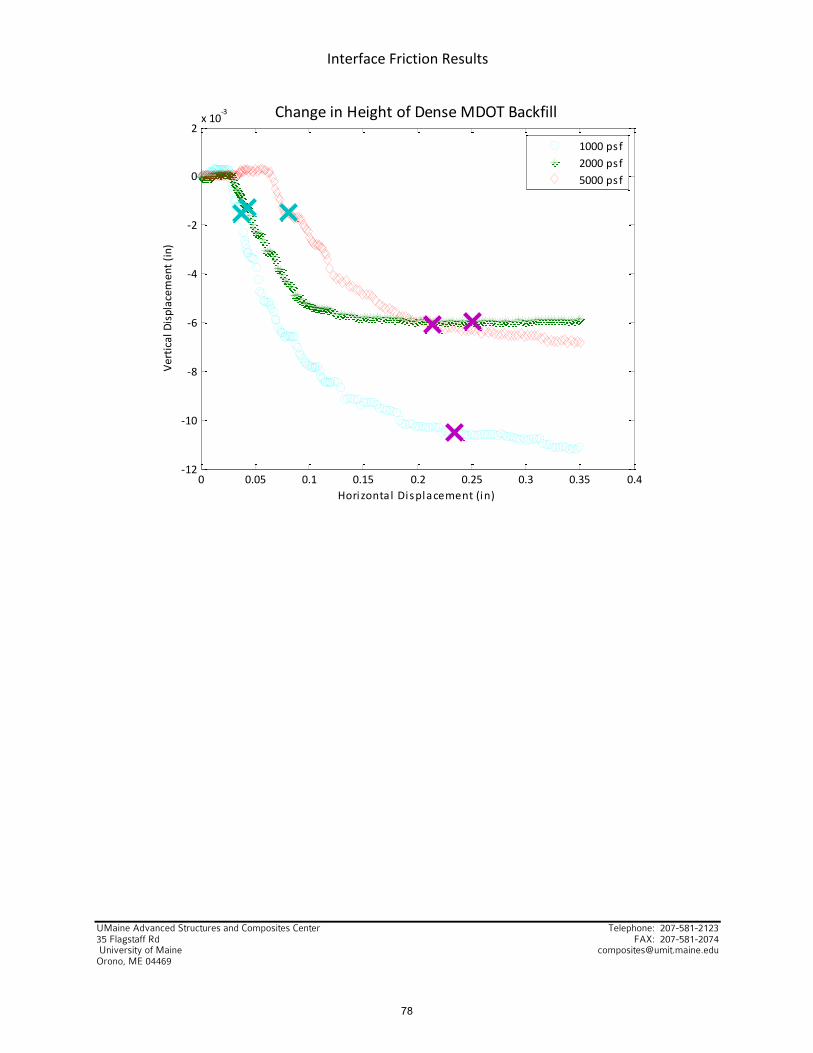
-‐3 Change in Height of Dense MDOT Backfill
Horizontal Displacement (in)
Vertical Displacem
ent (in)
1000 psf2000 psf5000 psf
78

Interface Friction Results
UMaine Advanced Structures and Composites Center Telephone: 207-581-2123 35 Flagstaff Rd FAX: 207-581-2074 University of Maine [email protected] www.composites.umaine.edu Orono, ME 04469
0 1000 2000 3000 4000 5000 60000
500
1000
1500
2000
2500
3000
3500Friction Angle of Dense MDOT Backfill
Normal Stress (ps f)
Shear S
tress (psf)
PeakPeak Trendl ineConstant VolumeConstant Volume Trendl ine
79

Interface Friction Results
UMaine Advanced Structures and Composites Center Telephone: 207-581-2123 35 Flagstaff Rd FAX: 207-581-2074 University of Maine [email protected] www.composites.umaine.edu Orono, ME 04469
0 0.05 0.1 0.15 0.2 0.25 0.3 0.35 0.40
500
1000
1500
2000
2500
3000Shear Stress of Medium Dense Ottawa Sand
Horizontal Displacement (in)
Shear S
tress (psf)
1000 psf2000 psf5000 psf
80

Interface Friction Results
UMaine Advanced Structures and Composites Center Telephone: 207-581-2123 35 Flagstaff Rd FAX: 207-581-2074 University of Maine [email protected] www.composites.umaine.edu Orono, ME 04469
0 0.05 0.1 0.15 0.2 0.25 0.3 0.35 0.4-‐0.01
-‐0.005
0
0.005
0.01
0.015
0.02Change in Height of Medium Dense Ottawa Sand
Horizontal Displacement (in)
Vertical Displacem
ent (in)
1000 psf2000 psf5000 psf
81

Interface Friction Results
UMaine Advanced Structures and Composites Center Telephone: 207-581-2123 35 Flagstaff Rd FAX: 207-581-2074 University of Maine [email protected] www.composites.umaine.edu Orono, ME 04469
0 1000 2000 3000 4000 5000 60000
500
1000
1500
2000
2500
3000Friction Angle of Medium Dense Ottawa Sand
Normal Stress (ps f)
Shear S
tress (psf)
PeakPeak Trendl ineConstant VolumeConstant Volume Trendl ine
82
Interface Friction Results
UMaine Advanced Structures and Composites Center Telephone: 207-581-2123 35 Flagstaff Rd FAX: 207-581-2074 University of Maine [email protected] www.composites.umaine.edu Orono, ME 04469
0 0.05 0.1 0.15 0.2 0.25 0.3 0.35 0.40
500
1000
1500
2000
2500
3000
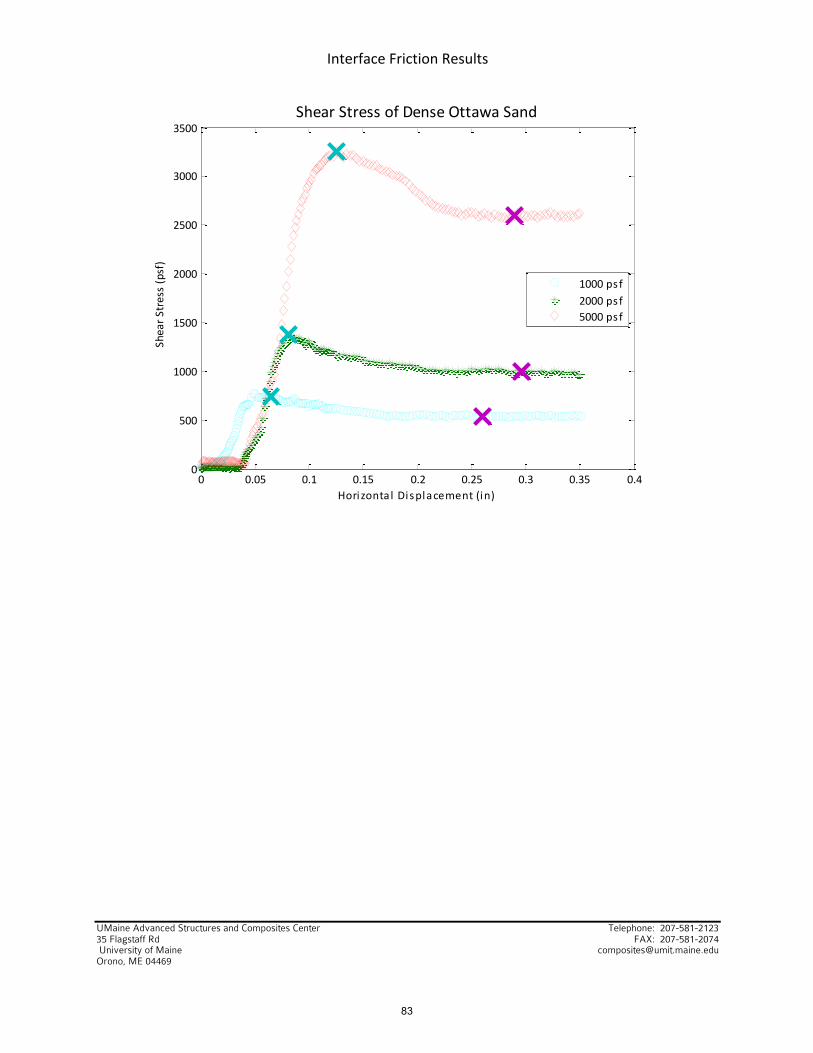
3500Shear Stress of Dense Ottawa Sand
Horizontal Displacement (in)
Shear S
tress (psf)
1000 psf2000 psf5000 psf
83

Interface Friction Results
UMaine Advanced Structures and Composites Center Telephone: 207-581-2123 35 Flagstaff Rd FAX: 207-581-2074 University of Maine [email protected] www.composites.umaine.edu Orono, ME 04469
0 0.05 0.1 0.15 0.2 0.25 0.3 0.35 0.4-‐10
-‐8
-‐6
-‐4
-‐2
0
2x 10
-‐3 Change in Height of Dense Ottawa Sand
Horizontal Displacement (in)
Vertical Displacem
ent (in)
1000 psf2000 psf5000 psf
84
Interface Friction Results
UMaine Advanced Structures and Composites Center Telephone: 207-581-2123 35 Flagstaff Rd FAX: 207-581-2074 University of Maine [email protected] www.composites.umaine.edu Orono, ME 04469
0 1000 2000 3000 4000 5000 60000
500
1000
1500
2000
2500
3000
3500
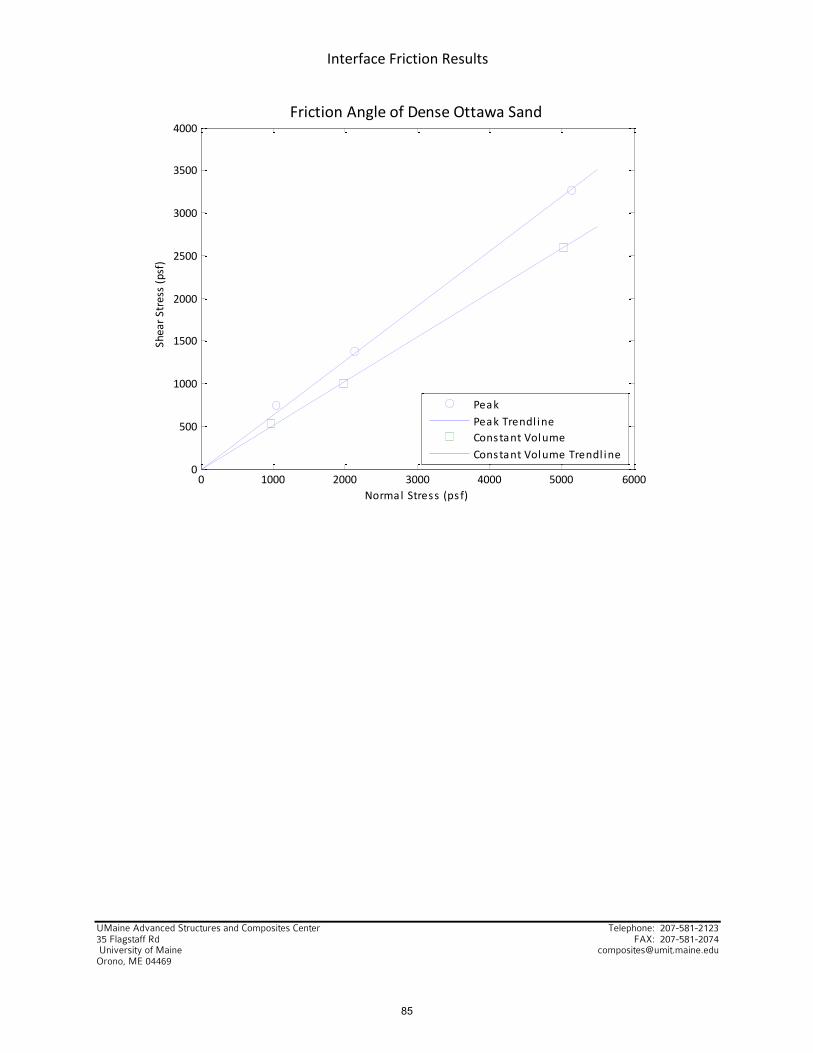
4000Friction Angle of Dense Ottawa Sand
Normal Stress (ps f)
Shear S
tress (psf)
PeakPeak Trendl ineConstant VolumeConstant Volume Trendl ine
85