transverse, vertical, and antero-posterior changes … c) the tad-anchor side of b-rme, showed...
TRANSCRIPT

University of Alberta
Transverse, Vertical, and Antero-posterior changes between
Tooth-borne versus Dresden Bone-borne Rapid Maxillary
Expansion: A Randomized Controlled Clinical Trial
by
Connie P. Ling
A thesis submitted in partial fulfillment of the requirements for the degree of
Master of Science
Medical Sciences - Orthodontics
University of Alberta
© Connie P. Ling, 2016

ii
ABSTRACT
Objectives:
1) To identify accurate and easily repeatable (intra-examiner reliability) 3-D landmarks in
the cranial base, maxilla, and mandible which can be used to quantify treatment
changes after rapid maxillary expansion (RME).
2) To compare the transverse, vertical and antero-posterior, skeletal and dental post-
treatment changes for the Dresden Bone-borne expander, 4-band Tooth-borne
expander, and an untreated control group.
Methods:
Fifty adolescents with maxillary transverse constriction were randomly assigned into
one of three groups according to type of expander: 2-point Dresden-type Bone-borne RME (B-
RME; n = 17, mean age = 14.1 years), 4-band Tooth-borne RME (T-RME; n = 17, mean age =
13.7 years), or the untreated control group (n = 16, mean age = 13.3 years). The Dresden B-
RME had a unique set-up where one side was anchored by a temporary anchorage device
(TAD-side), and the other side was anchored to a shortened implant (implant-side). Cone-
beam computed tomography (CBCT) scans were taken at 0.3-mm voxel size before treatment
(T1), and 6 months later (T2). The CBCT data were coded, and then loaded into 3-D
visualization software (AVIZO 8.1 software) by a blinded examiner for measurement. The
transverse, vertical and sagittal changes of the maxilla was evaluated. Dental changes at the
level of the pulp horn, buccal alveolar bone and root apex were evaluated on upper molars,
upper premolars, upper canines, and lower molars. Repeated measures Multivariate analysis
of variance (rm-MANOVA) and Bonferroni post-hoc tests were performed to identify significant
differences between groups at each landmark and time-point.
Results:
Transverse
a) T-RME group showed symmetrical maxillary premolar and molar expansion.
b) The B-RME appliance configuration showed asymmetrical maxillary molar expansion.

iii
c) The TAD-anchor side of B-RME, showed greater molar crown displacement (mean 1.84
mm) than the Implant-anchor side, with statistical significance of p<.015.
Antero-posterior
d) T-RME group showed anterior displacement of molar apex and premolar crown (mean <
1.5 mm), compared to other groups, with statistical significance (p<.05).
e) No significant antero-posterior changes were found for B-RME group.
Vertical
f) T-RME showed some dental vertical extrusion of premolar and molar crowns (< 1.8 mm
; p<.05), relative to control group.
g) No significant dental vertical changes were found for the B-RME group. Minimal
skeletal superior displacement at infra-orbital foramen (IORB) was noted for B-RME
group (mean < 1.3 mm ; p<.05), relative to control group.
h) Vertical changes were minimal and non-significant between the B-RME and T-RME
groups.
Posterior versus Anterior transverse discrepancy
i) T-RME group showed greater expansion between upper molars than between upper
canines (1.6 mm more per side), with statistical significance (p<.002). No statistical
significant differences were found between inter-molar and inter-premolar expansion.
j) In the B-RME group, both the TAD- and Implant-sides showed greater inter-molar
expansion than inter-canine. This difference was 1.1 mm on the Implant-side, and 1.9
mm on the TAD-side, with statistical significance (p<.001).
k) In the B-RME group, only the TAD-side showed greater inter-molar expansion than
inter-premolar (1.3 mm; p<.001). This was not statistically significant on the Implant-
side.
Dental to Skeletal Ratio
l) The B-RME group showed a smaller ratio of dental to skeletal expansion compared to
T-RME group. The dental to skeletal ratio of expansion in the T-RME group, was
roughly 40:60, with 42% dental expansion, 27% alveolar, 31% sutural. The dental to

iv
skeletal ratio of expansion in the B-RME group was approximately 20:80, with 17%
dental expansion, 40% alveolar, and 43% sutural.
Conclusions:
The decision to use B-RME or T-RME in adolescents depends upon operator preferences
and specific dental and skeletal considerations for the patient. B-RME may be preferred in
patients with missing permanent posterior teeth, or periodontal/endodontically compromised
dentition, or when a lower ratio of dental to skeletal expansion is desired. Based solely on
this study's sample, T-RME may be more effective for patients with similar severity of
transverse maxillary constriction at the molar level and premolar levels. Meanwhile, B-RME
may be more effective for patients with greater constriction at the bilateral maxillary molar
level than the premolar level. In addition, the Dresden B-RME appliance configuration
produced asymmetrical molar expansion. Placement of the TAD-anchor on the side of more
severe maxillary transverse constriction may be helpful in cases with more pronounced
maxillary arch asymmetry.

v
PREFACE
This thesis is an original work by Connie P. Ling.

vi
DEDICATION
This thesis is dedicated to my wonderfully supportive and caring family, husband, my in-laws,
and dear friends who have placed their trust in me.
In particular,
To my dearest mom, dad, and sister, Wendy, Raymond, Bonnie -
I am who I am because of all your tremendous efforts, sacrifices, sense of humor,
nurture, boundless and unconditional love. Thank you for your faith in me, constantly
motivating me to do my best, and allowing me to leave your side while pursuing my dreams. I
hope to be as great a parent and role model when the time comes.
To my beloved husband, Jeffrey Woo -
I am so grateful for your endless love, practical support, encouragement, wit and
wisdom. You have been my vital source of motivation throughout my amazing decade-long
dentistry and orthodontic training journey. You always manage to deliver at times of greatest
need. Your own self-actualizing character resonates deeply in me. I thoroughly enjoyed all
the moments we spent together, and I look forward to creating many more with you in the
future.

vii
ACKNOWLEDGEMENTS
First, I wish to thank my supervisor, Professor Dr. Manuel Lagravere, for his mentorship
and for granting me the opportunity to work on such a fascinating and impactful orthodontic
problem. I want to thank Professor Dr. Paul Major for the invaluable insights and critical
thoughts he presented to me on this piece of research. I wish to thank Professor Jason Carey
for his prompt feedback and agreeing to serve on the examination panel. As well as Professor
Dr. William Wiltshire who flew in from the University of Manitoba to generously take part in
my defense examination as the external examiner. I also wish to thank Professor Dr. Carlos
Flores-Mir for offering me the valuable opportunities to write the book chapter on maxillary
expansion, and to present the works at conferences as a resident.
I want to express my deepest gratitude to Jeffrey Woo, my husband, for his critical
thoughts, technical contributions, and collaboration towards key components of my research
as leveraged from his computer engineering research training. His knowledge and assistance
in the mathematical and engineering aspects of this work was vitally important towards the
reference plane methodology including the programming for the calculations used. Due to the
15,000+ landmarks used in this research (50 patients x 50+ landmarks x 2 time points x 3
repeats), much more of my time and energy would have been consumed if it was not for his
technical assistance in programming. He always helped me as much as he could, both
mentally and in person. He has been here throughout the toughest and best times during my
amazing decade-long dental and orthodontic training pathway.
I will never forget the invaluable inspiration and teachings from my first two
orthodontic mentors: Dr. Clement Chan and Dr. Yanqi Yang, which led me into the profession
of orthodontics. I am also indebted to numerous professors who have strongly encouraged me
to pursue the Masters degree and orthodontic training pathway. I particularly wish to thank
Professor Dr. Esmonde Corbet, Professor Dr. Coleman McGrath, and Professor May Wong for
their support and faith.
My appreciation extends to all my fellow orthodontic colleagues & friends throughout
this journey, including, but not limited to Drs: Humam Saltaji, Long Tieu, Jose-Roberto
Pereira, Mona Afrand, Mostafa Altalibi, Neel Kaipatur, Parvaneh Badri, Ryan Edwards, Saeed
Ghorashi, Zahra Najirad. I also want to mention my good friend and fellow orthodontist, Dr.
Engee Ling, studying at the University College London Eastman Dental Institute. She does not

viii
hesitate to share her knowledge and I often learn much through these interactive intellectual
exchanges.
I deeply appreciated all the support, motivation and companionship from my dear
friends spread across multiple cities around the world during this intense period of training. I
particularly want to mention: Jean Hui, Frank Hui, Chimene Lo, Henry Yu, Eileen Ting, Mandy
Poon, from Edmonton.
Last but not least, I would like to thank all the faculty staff, clinical instructors, and
support staff members at the University of Alberta Edmonton Clinic Health Academy, and
Kaye Edmonton Clinic, for their professional instruction, exceptional clinical guidance, and
companionship on a daily basis.

ix
Table of Contents
ABSTRACT ................................................................................................... ii
List of Tables .............................................................................................. xiii
List of Figures .............................................................................................. xv
Chapter 1 .................................................................................................... 1
1. Introduction ........................................................................................... 2
1.1 Problem Statement .............................................................................. 2
1.2 Research Objectives ............................................................................. 4
1.3 Research Questions .............................................................................. 5
1.4 Null Hypotheses .................................................................................. 5
1.5 Contributions & Outline ........................................................................ 6
1.6 References ........................................................................................ 7
Chapter 2 ................................................................................................... 10
2. Literature Review ................................................................................... 11
2.1 Implications of Maxillary Transverse Constriction ......................................... 11
2.2 Dental and Skeletal Expansion with T-RME ................................................. 12
2.3 New Developments with Bone-borne RME ................................................... 13
2.4 2-D Measurement Techniques ................................................................. 14
2.5 3-D Measurement Techniques ................................................................. 15
2.6 Summary ......................................................................................... 18
2.7 References ....................................................................................... 19
Chapter 3 ................................................................................................... 26
3. Reliability and Accuracy of three-dimensional reference planes and landmarks related to
maxillary expansion ....................................................................................... 27
3.1 Introduction ..................................................................................... 27

x
3.2 Landmark Selection ............................................................................ 27
3.2.1 Selection Criteria .......................................................................... 27
3.2.2 Mid-Sagittal Plane ......................................................................... 28
3.2.3 Palatal Plane ............................................................................... 29
3.2.4 Frontal Plane ............................................................................... 30
3.2.5 Treatment Landmarks .................................................................... 30
3.3 Purpose of study ................................................................................ 31
3.4 Materials & Methods ............................................................................ 31
3.5 Plane construction .............................................................................. 41
3.5.1 Mid-Sagittal plane ......................................................................... 42
3.5.2 Posterior Palatal plane ................................................................... 43
3.5.3 Frontal plane ............................................................................... 44
3.6 Finding orthogonal distances from landmark of interest to the reference plane ..... 45
3.7 Statistical analysis .............................................................................. 45
3.7.1 Accuracy for 3-D landmarks.............................................................. 45
3.7.2 Intra-examiner reliability for 3-D landmarks .......................................... 46
3.7.3 Intra-examiner reliability for reference plane construction ........................ 46
3.8 Results............................................................................................ 46
3.8.1 Intra-examiner reliability of 3-D landmarks ........................................... 47
3.8.2 Accuracy of 3-D landmarks ............................................................... 47
3.8.3 Intra-examiner reliability of 3-D reference plane construction .................... 51
3.9 Discussion ........................................................................................ 54
3.9.1 Overview ................................................................................... 54
3.9.2 Reference landmarks used for Plane construction ................................... 54
3.9.3 Reference plane construction ........................................................... 59

xi
3.9.4 Dental Landmarks for Treatment Evaluation .......................................... 60
3.9.5 Limitations ................................................................................. 61
3.9.6 Summary & Conclusion ................................................................... 62
3.10 References .................................................................................... 64
Chapter 4 ................................................................................................... 68
4. Three-dimensional changes between tooth-borne versus bone-borne (Dresden-type) rapid
maxillary expansion in adolescents: A randomized clinical trial. ................................. 69
4.1 Introduction ..................................................................................... 69
4.2 Materials & Methods ............................................................................ 70
4.2.1 Subjects .................................................................................... 70
4.2.2 RME Design and Activation Protocol .................................................... 71
4.3 Identification of CBCT Landmarks ............................................................ 73
4.3.1 Orthogonal distances between landmarks to planes ................................. 74
4.4 Results............................................................................................ 75
4.4.1 Measurement error ........................................................................ 75
4.4.2 Statistical analysis ........................................................................ 76
4.4.3 Treatment Changes (T2-T1) ............................................................. 79
4.4.4 Between-Group Comparisons (T2-T1) .................................................. 80
4.4.5 Within-Group Comparisons (T2-T1) ..................................................... 81
4.5 Discussion ........................................................................................ 90
4.5.1 Limitations ................................................................................. 94
4.6 Summary & Conclusions ....................................................................... 94
4.7 Future recommendations: ..................................................................... 95
4.8 References ....................................................................................... 97
Chapter 5 ................................................................................................... 99

xii
5. Summary of findings ...............................................................................100
5.1 Introduction ....................................................................................100
5.2 Summary ........................................................................................101
5.3 Limitations: .....................................................................................105
5.3.1 Reliability & Accuracy chapter: ........................................................105
5.3.2 Randomized Controlled Clinical trial chapter: .......................................106
5.4 Remarks .........................................................................................106
5.5 References ......................................................................................108
Appendices ................................................................................................109

xiii
List of Tables
Table 3-1: 3-D Maxilla-mandibular skeletal landmark definitions .................................. 36
Table 3-2: 3-D Cranial base skeletal landmark definitions .......................................... 37
Table 3-3: 3-D Dental Root (PULP, APEX, AVBN) landmark definitions ............................ 39
Table 3-4: Portney and Watkins' ICC recommendation .............................................. 46
Table 3-5: Ease of Identification of the investigated 3-D landmarks .............................. 48
Table 3-6: Accuracy of Cranial Base Landmarks, based on ICC and Mean Identification Errors 49
Table 3-7: Accuracy of Maxillo-mandibular Landmarks, based on ICC and Mean Identification
Errors ........................................................................................................ 50
Table 3-8. Accuracy of Dental Landmarks, based on ICC and Mean Identification Errors. ..... 50
Table 3-9: Mean errors (in mm) of orthogonal distances, from 3 repeated reference plane
constructions for 20 landmarks. ......................................................................... 53
Table 4-1. Subject Demographics ....................................................................... 73
Table 4-2. Subject Demographics within B-RME group ............................................... 73
Table 4-3: Mean errors (in mm) from 3 repeated reference plane constructions for the skeletal
and dental landmarks. .................................................................................... 75
Table 4-4. Baseline (T1) orthogonal distances (in mm) for all groups, from variable landmark
to respective planes (Transverse (T*), Vertical (V*), and Antero-posterior (AP*) dimensions). 78
Table 4-5. Between-Group Comparisons: Transverse treatment changes (T2-T1), based on
orthogonal distances from landmark to Mid-sagittal Plane for all three groups. ................ 83
Table 4-6. Between-Group Comparisons: Vertical treatment changes (T2-T1), based on
orthogonal distances from landmark to Palatal Plane for all three groups. ...................... 85
Table 4-7. Between-Group Comparisons: Antero-posterior treatment changes (T2-T1), based
on orthogonal distances from landmark to Frontal Plane for all three groups. .................. 86
Table 4-8. Within-Group comparisons: Left- to Right-side discrepancy in treatment changes
(T2-T1), based on orthogonal distances to the mid-sagittal 3-D plane, for all three groups. .. 87
xiv
Table 4-9. Within-Group B-RME comparisons: transverse discrepancy in treatment changes
(T2-T1) between TAD- and Implant-side. .............................................................. 88
Table 4-10. Within-Group B-RME comparisons: vertical discrepancy in treatment changes (T2-
T1) between TAD- and Implant-side. ................................................................... 88
Table 4-11. Within-Group comparisons: Posterior- vs. Anterior- transverse discrepancy in
treatment changes (T2-T1), based on orthogonal distances to the mid-sagittal 3-D plane, for
all three groups. ........................................................................................... 89
Table 4-12. Within-Group comparisons: Crown- vs. Root-transverse discrepancy in treatment
changes (T2-T1), based on orthogonal distances to the mid-sagittal 3-D plane, for all three
groups. ...................................................................................................... 89
Table 4-13: : Within-Group comparisons: Upper- vs. Lower- transverse discrepancy in
treatment changes (T2-T1), based on orthogonal distances to the mid-sagittal 3-D plane, for
all three groups. ........................................................................................... 90

xv
List of Figures
Figure 2.1: Illustrates how Euclidean distance measurement can overestimate actual changes
(Image of maxillary first molar teeth adapted from Nelson et al 92). ............................. 16
Figure 3.1: Dry Skull Specimen enclosed by Plexiglass mounted on CBCT machine ............. 32
Figure 3.2: Double-layered Plexiglass box (Left), filled with water in the external layer
(Right). ...................................................................................................... 32
Figure 3.3: Example of a Dry skull with Gutta Percha markers ..................................... 33
Figure 3.4: Dry skull with Gutta Percha markers inside Plexiglass box (Left), CBCT scan
(Right). ...................................................................................................... 33
Figure 3.5: Orientation of the 3 axes: X-axis (Red, Transverse), Y-axis (Green, Anterior-
posterior), Z-axis (Dark Blue, Vertical). ............................................................... 35
Figure 3.6: 3-D Landmarks viewed from axial, coronal, and sagittal planes (Left to Right) using
the 3-D visualization software (AVIZO) ................................................................. 35
Figure 3.7: 3-D Mid-sagittal Reference Plane ......................................................... 42
Figure 3.8: 3-D Posterior Palatal Reference Plane ................................................... 43
Figure 3.9: 3-D Frontal Reference Plane ............................................................... 44
Figure 3.10: Mid-sagittal planes with 0.2 mm imposed errors in X-axis of A) MDFM and
Mid.SPIN (Left Picture), B) MDFM and Mid.NPF (Right picture). .................................... 51
Figure 3.11: Posterior Palatal planes with 0.2 mm imposed error in Z-axis of GPF.L&R and
Mid.NPF ..................................................................................................... 52
Figure 3.12: Frontal planes with 0.2 mm imposed error in Y-axis of IORB.L&R and Mid.NPF .. 52
Figure 4.1. Clinical Photo of the A) Tooth-borne (Left), and B) Bone-borne Expander (Right) 72
Figure 4.2. Bone-borne RME (B-RME) with Mini-Hyrax jackscrew supported by TAD on one
side (TAD-anchor side), and palatal implant (Implant-anchor side) on the other. .............. 72
Figure 4.3: Orientation of the 3 axes: .................................................................. 74

1
Chapter 1

2
1. Introduction
1.1 Problem Statement
Posterior crossbite is one of the most easily recognized clinical signs that result from a
transverse constricted maxilla 1. This is a common condition, with a prevalence of
approximately 7% to 23% in the population under 18 years old 2-7. This narrow maxillary width
relative to the mandible, causes a mismatch between opposing posterior teeth 1,8,9. This can
bring a negative cosmetic and functional impact on patients, including, but not limited to
excess buccal corridor spaces when smiling, crowded anterior teeth, and uneven dental
attrition 1,10.
Posterior crossbites can present in a unilateral or bilateral form 11. When the
transverse mismatch occurs on both sides of the dental arch, it is classified as a bilateral
crossbite. When it is only one side of the dental arch, it is classified as unilateral crossbite.
Posterior crossbites can originate from true (narrow maxilla) or relative (abnormally wide
mandible) sources 12. Relative maxillary constriction exists when the maxillary skeleton is
normal in width, but the mandibular skeleton and/or teeth are too wide. True maxillary
constriction exists when the maxillary skeleton and/or teeth are narrow in width on its own.
This study is interested specifically in the true maxillary constriction cases where the primary
treatment is through maxillary expansion.
In orthodontics, traditionally used methods to determine the skeleto-dental extent of
maxillary transverse constriction included 2-dimensional (2-D) cephalometric radiographs
(postero-anterior and lateral cephalograms), occlusal radiographs, and dental models 13,14.
These diagnostic methods provide only limited skeleto-dental information, and subject to
varying degrees of projection errors and measurement errors.
Cone-beam Computed Tomography (CBCT) 3-dimensional (3-D) imaging offer
significant improvements over older 2-D imaging techniques 15-19. It presented negligible
magnification error with a 1:1 ratio in all three dimensions 20 along with the ability to
generate sub-millimeter voxel-sized high-resolution images; down to the range of 0.4 mm to
0.125 mm in the three axes 21,22. Furthermore, 3-D imaging allows deep visualization of
internal anatomic structures that were previously overlapped in 2-D imaging 23.
3
This study utilized CBCT's advantages to evaluate the various skeleto-dental
components of maxillary transverse constriction as a treatment evaluation method.
Nonetheless, this brought new challenges since there are no specific guidelines about how to
analyze this type of images, or about how to identify stable anatomical landmarks which
could be used in quantifying skeletal and dental maxillary constriction, as well as maxillary
posterior arch symmetry 24,25. Great difficulty has been reported in using 2-D headfilms
(postero-anterior, submentovertex or lateral) to evaluate 3-D facial asymmetry 18,26,27. Many
2-D cephalometic measurements are distorted in the presence of facial asymmetry 28.
Problems such as patient head positioning 29, anatomical overlap 26,27,30, and magnification
errors 19,31,32 often lead to interpretation errors and misdiagnoses 17,18.
In 2-D imaging, transverse changes are commonly measured between two treatment
landmarks (eg. between left and right molars), or from a treatment landmark to a skeletal
midline. On a postero-anterior headfilm, this skeletal midline can be defined by drawing a
line between the Crista galli (CG), Anterior Nasal Spine (ANS) and Menton landmarks.
However, this line cannot be easily reproduced in 3-D due to several reasons. Firstly, the
Menton landmark cannot be easily identified as it is located on an almost flat bony surface in
3D. Secondly, a line now becomes a plane in 3-D. Hence, the line needs to somehow be
extended to the posterior region. This document proposed a measurement method to
circumvent these difficulties and a more in-depth discussion is provided in later sections.
Regarding correction of maxillary constriction, this study focused specifically on
comparing the traditional Tooth-borne Rapid Maxillary Expander (T-RME), with the recently
developed Dresden Bone-borne Rapid Maxillary Expander (B-RME) 33,34. Both of these uses a
hyrax jackscrew, attached to either the teeth (for T-RME) or into the palatal bone (for B-
RME), that is incrementally turned (a.k.a. activated) to expand the maxilla. Due to its dental
attachment, T-RME has been reported to induce greater dental than skeletal expansion (70%
dental vs. 30% skeletal)35 that may cause buccal tipping of the maxillary posterior teeth.
Consequently, B-RME was designed to hopefully reduce this dental side-effect 36,37. It
attempts to achieve this by performing skeletal expansion that involves separating the left
and right maxillary halves at the mid-palatal suture (non-surgically for young adolescents,
surgically for mature adults) 38.
To date, only two B-RME controlled clinical trials have been published, and they
showed different results. Whereas Lin et al 33 found almost two-fold greater skeletal effects

4
using B-RME (57% - 77%) compared to T-RME (25% - 43%), Lagravère et al 34 reported limited
differences between the T-RME and B-RME group. When interpreting these results, it should
be noted there were appliance design differences. In hopes to gain greater insight into this
discrepancy between the studies, the present study re-defined some of the previously
reported landmarks and also introduced new landmarks. The goal of re-defining landmarks
was to improve the precision and accuracy for measurements. New landmarks also allowed us
to measure changes in regions that were not previously covered such as the Greater Palatine
Foramen (GPF) region.
Lastly, the Dresden B-RME was chosen for use in an adolescent population in this
study. This appliance had been used in two previous studies on ten mature adult patients who
underwent surgically-assisted rapid maxillary expansion in the study by Tausche et al 39 and
Hansen et al 37. The Dresden B-RME has a unique design feature where it is anchored by an
osteointegrated implant on one side and a mini-implant-anchor (a.k.a. Temporary Anchorage
Devices, or TAD) on the other. Due to the limited resources available for this study, other
expansion treatments such as Tooth-Tissue-borne and Bone-Tooth-borne expanders will not be
detailed in this document 40.
1.2 Research Objectives
1) To identify accurate and easily repeatable (intra-examiner reliability) 3-D landmarks in
the cranial base, maxilla, and mandible which can be used to quantify treatment changes
after rapid maxillary expansion (RME).
2) To compare the transverse, vertical and antero-posterior, skeletal and dental post-
treatment changes for Dresden B-RME, 4-band T-RME, and an untreated control group.

5
1.3 Research Questions
Acknowledging the issues presented, two main research questions were identified:
1) Which skeletal and dental landmarks are the most accurate and repeatable (intra-
examiner reliability) in CBCT images, and can be used to assess transverse, vertical, and
antero-posterior treatment changes after maxillary expansion?
2) When several dento-skeletal variables are considered simultaneously over time, does age,
gender, or treatment group (B-RME/T-RME/No Treatment) affect the final maxillary
outcome (transverse, vertical, antero-posterior) in a selected sample of patients with
maxillary transverse constriction?
i) Are there are significant differences in the amount of maxillary transverse
expansion on the TAD-anchor side, and shortened-implant-anchor side of the
Dresden B-RME group?
1.4 Null Hypotheses
Ho1: There is no difference in maxillary skeletal or dental treatment effects between T-RME
and B-RME appliances.
Ho2: Treatment with T-RME appliance produces no additional maxillary skeletal or dental
effects in comparison to normal growth changes among maxillary constricted untreated
controls.
Ho3: Treatment with B-RME appliance produces no additional maxillary skeletal or dental
effects in comparison to normal growth changes among maxillary constricted untreated
controls.
Ho4: Treatment with T-RME or B-RME expansion appliances produces no difference in
maxillary changes between the left and right sides.

6
Ho5: Treatment with B-RME appliance produces no difference in maxillary changes between
the left and right sides, in comparison to normal growth changes among untreated controls.
Ho6: Treatment with T-RME appliance produces no difference in maxillary changes between
the left and right sides, in comparison to normal growth changes among untreated controls.
Ho7: B-RME Treatment with the TAD-anchor side or Implant-anchor side produces no
difference in maxillary changes between the left and right sides.
1.5 Contributions & Outline
A literature review was conducted on the skeletal and dental effects of expansion
using conventional T-RME and the new development of B-RME appliances in Chapter 2 of this
document. A review of existing 2-D and 3-D measurement techniques is also presented.
In Chapter 3 of this document, existing landmarks were re-defined, and newly defined
3-D anatomical landmarks (reference and treatment landmarks) were chosen to provide
improved accuracy and reliability in all axes. Utilizing this landmark pool, this study also
proposed a method for mathematically constructing 3-D reference planes for transverse,
vertical, and antero-posterior measurements; its reliability is also shown.
Applying the newly defined reference planes, maxillary skeletal and dental changes
were measured. A comparison is drawn between the Dresden B-RME and the 4-band T-RME at
6 months through CBCT images. Both treatment groups were compared with a group of
untreated subjects as a control to account for natural growth changes. In particular, the
three-dimensional skeletal and dental changes, symmetrical implications and skeletal-to-
dental ratios were analyzed extensively. This is presented in Chapter 4 of this document.
Lastly, discussions on the clinical significance and implications of this research are
summarized in Chapter 5 of this document.

7
1.6 References
1. McNamara JA. Maxillary transverse deficiency. American Journal of Orthodontics and Dentofacial Orthopedics 2000;117:567-570.
2. Kutin G, Hawes RR. Posterior cross-bites in the deciduous and mixed dentitions. American journal of orthodontics 1969;56:491-504.
3. Thilander B, Myrberg N. The prevalence of malocclusion in Swedish schoolchildren. European Journal of Oral Sciences 1973;81:12-20.
4. Heikinheimo K, Salmi K, Myllärniemi S. Long term evaluation of orthodontic diagnoses made at the ages of 7 and 10 years. The European Journal of Orthodontics 1987;9:151-159.
5. Thilander B, Pena L, Infante C, Parada SS, de Mayorga C. Prevalence of malocclusion and orthodontic treatment need in children and adolescents in Bogota, Colombia. An epidemiological study related to different stages of dental development. The European Journal of Orthodontics 2001;23:153-168.
6. Keski-Nisula K, Lehto R, Lusa V, Keski-Nisula L, Varrela J. Occurrence of malocclusion and need of orthodontic treatment in early mixed dentition. American Journal of Orthodontics and Dentofacial Orthopedics 2003;124:631-638.
7. da Silva Filho OG, Santamaria Jr M, Filho LC. Epidemiology of posterior crossbite in the primary dentition. Journal of Clinical Pediatric Dentistry 2007;32:73-78.
8. Bishara SE, Staley RN. Maxillary expansion: clinical implications. American Journal of Orthodontics and Dentofacial Orthopedics 1987;91:3-14.
9. Lagravère MO, Heo G, Major PW, Flores-Mir C. Meta-analysis of immediate changes with rapid maxillary expansion treatment. The Journal of the American Dental Association 2006;137:44-53.
10. Bell RA. A review of maxillary expansion in relation to rate of expansion and patient's age. American journal of orthodontics 1982;81:32-37.
11. Kennedy DB, Osepchook M. Unilateral posterior crossbite with mandibular shift: a review. Journal-Canadian Dental Association 2005;71:569.
12. Haas AJ. Long-term posttreatment evaluation of rapid palatal expansion. Angle Orthod 1980;50:189-217.
13. Lagravere MO, Major PW, Flores-Mir C. Long-term dental arch changes after rapid maxillary expansion treatment: a systematic review. The Angle orthodontist 2005;75:155-161.
14. Lagravere MO, Major PW, Flores-Mir C. Long-term skeletal changes with rapid maxillary expansion: a systematic review. The Angle orthodontist 2005;75:1046-1052.
15. Sievers MM, Larson BE, Gaillard PR, Wey A. Asymmetry assessment using cone beam CT: A Class I and Class II patient comparison. The Angle Orthodontist 2011;82:410-417.
16. Sanders DA, Rigali PH, Neace WP, Uribe F, Nanda R. Skeletal and dental asymmetries in Class II subdivision malocclusions using cone-beam computed tomography. American Journal of Orthodontics and Dentofacial Orthopedics 2010;138:542. e541-542. e520.

8
17. Katsumata A, Fujishita M, Maeda M, Ariji Y, Ariji E, Langlais RP. 3D-CT evaluation of facial asymmetry. Oral Surgery, Oral Medicine, Oral Pathology, Oral Radiology, and Endodontology 2005;99:212-220.
18. Baek S-H, Cho I-S, Chang Y-I, Kim M-J. Skeletodental factors affecting chin point deviation in female patients with class III malocclusion and facial asymmetry: a three-dimensional analysis using computed tomography. Oral Surgery, Oral Medicine, Oral Pathology, Oral Radiology, and Endodontology 2007;104:628-639.
19. Jacobson A, RL J. Radiographic Cephalometry: From Basics to 3-D Imaging, (Book/CD-ROM set), Chapter 23. 2007.
20. Lagravère MO, Carey J, Toogood RW, Major PW. Three-dimensional accuracy of measurements made with software on cone-beam computed tomography images. American Journal of Orthodontics and Dentofacial Orthopedics 2008;134:112-116.
21. Scarfe WC, Farman AG, Sukovic P. Clinical applications of cone-beam computed tomography in dental practice. Journal-Canadian Dental Association 2006;72:75.
22. Yajima A, Otonari-Yamamoto M, Sano T, Hayakawa Y, Otonari T, Tanabe K et al. Cone-beam CT (CB Throne) applied to dentomaxillofacial region. The Bulletin of Tokyo Dental College 2006;47:133-141.
23. Mah JK, Huang JC, Choo H. Practical applications of cone-beam computed tomography in orthodontics. The Journal of the American Dental Association 2010;141:7S-13S.
24. Lagravère MO, Gordon JM, Guedes IH, Flores-Mir C, Carey JP, Heo G et al. Reliability of traditional cephalometric landmarks as seen in three-dimensional analysis in maxillary expansion treatments. The Angle orthodontist 2009;79:1047-1056.
25. de Moraes ME, Hollender LG, Chen CS, Moraes LC, Balducci I. Evaluating craniofacial asymmetry with digital cephalometric images and cone-beam computed tomography. Am J Orthod Dentofacial Orthop 2011;139:e523-531.
26. Lee K-M, Hwang H-S, Cho J-H. Comparison of transverse analysis between posteroanterior cephalogram and cone-beam computed tomography. Angle Orthodontist 2013;84:715-719.
27. Ghafari J, Cater PE, Shofer FS. Effect of film-object distance on posteroanterior cephalometric measurements: suggestions for standardized cephalometric methods. American Journal of Orthodontics and Dentofacial Orthopedics 1995;108:30-37.
28. Gateno J, Xia JJ, Teichgraeber JF. Effect of facial asymmetry on 2-dimensional and 3-dimensional cephalometric measurements. Journal of Oral and Maxillofacial Surgery 2011;69:655-662.
29. Thiesen G, Gribel BF, Freitas MPM. Facial asymmetry: a current review. Dental press journal of orthodontics 2015;20:110-125.
30. Betts N, Vanarsdall R, Barber H, Higgins-Barber K, Fonseca R. Diagnosis and treatment of transverse maxillary deficiency. The International journal of adult orthodontics and orthognathic surgery 1994;10:75-96.
31. Chien P, Parks E, Eraso F, Hartsfield J, Roberts W, Ofner S. Comparison of reliability in anatomical landmark identification using two-dimensional digital cephalometrics and three-dimensional cone beam computed tomography in vivo. Dentomaxillofacial Radiology 2014.

9
32. Oz U, Orhan K, Abe N. Comparison of linear and angular measurements using two-dimensional conventional methods and three-dimensional cone beam CT images reconstructed from a volumetric rendering program in vivo. Dentomaxillofac Radiol 2011;40:492-500.
33. Lin L, Ahn H-W, Kim S-J, Moon S-C, Kim S-H, Nelson G. Tooth-borne vs bone-borne rapid maxillary expanders in late adolescence. The Angle Orthodontist 2014;85:253-262.
34. Lagravère MO, Carey J, Heo G, Toogood RW, Major PW. Transverse, vertical, and anteroposterior changes from bone-anchored maxillary expansion vs traditional rapid maxillary expansion: A randomized clinical trial. American Journal of Orthodontics and Dentofacial Orthopedics 2010;137:304.e301-304.e312.
35. Krebs A. Expansion of the midpalatal suture, studied by means of metallic implants. Acta Odontologica Scandinavica 1959;17:491-501.
36. Wehrbein H, Göllner P. Skeletal Anchorage in Orthodontics – Basics and Clinical Application. Journal of Orofacial Orthopedics / Fortschritte der Kieferorthopädie 2007;68:443-461.
37. Hansen L, Tausche E, Hietschold V, Hotan T, Lagravère M, Harzer W. Skeletally-anchored Rapid Maxillary Expansion using the Dresden Distractor. Journal of Orofacial Orthopedics / Fortschritte der Kieferorthopädie 2007;68:148-158.
38. Baydas B, Yavuz İ, Uslu H, Dagsuyu İM, Ceylan İ. Nonsurgical rapid maxillary expansion effects on craniofacial structures in young adult females: a bone scintigraphy study. The Angle orthodontist 2006;76:759-767.
39. Tausche E, Hansen L, Hietschold V, Lagravère MO, Harzer W. Three-dimensional evaluation of surgically assisted implant bone-borne rapid maxillary expansion: A pilot study. American Journal of Orthodontics and Dentofacial Orthopedics 2007;131:S92-S99.
40. Rakosi T, Graber T. Orthodontic and Dentofacial Orthopedic Treatment, Chapter 7 2009:155-176.

10
Chapter 2
11
2. Literature Review
2.1 Implications of Maxillary Transverse Constriction
To illustrate the impact of maxillary constriction with posterior crossbite on the
general population, an in-depth review showed that the prevalence of approximately 7% to
23% of the population under 18 years old 2-7. This sizable patient population all suffer from
varying degree of functional and cosmetic problems, including, but not limited to excess
buccal corridor spaces when smiling, crowded anterior teeth, and uneven dental attrition 1,10.
Posterior crossbites can present in a unilateral or bilateral form 11. Bilateral posterior
crossbites result from a transverse constricted maxilla on both the left and right sides.
However, the degree of skeletal maxillary constriction on the left and right halves can either
be unequal (asymmetric bilateral crossbite) or equal (symmetric bilateral crossbite), relative
to the mid-sagittal plane 41. Correction of symmetrical bilateral crossbite involves bilateral
expansion of the maxilla. However, asymmetrical bilateral crossbite, should ideally be
corrected through greater expansion on the more severe (collapsed) constricted side, in order
to achieve proper arch widths on both sides as a final outcome 41.
A common feature noted in cases of unilateral posterior crossbite is a functional shift
of the mandible, due to the narrow width of the maxilla and inability of the jaws to obtain
stable maximum intercuspation 11. The prevalence of functional shift have been reported to
range between 65% to 80% in the mixed dentition 2,42-45. The chances of self-correction of
crossbites with functional shift are as low as 0% - 7% during transition from primary to mixed
dentition 11,44, and full correction is increasingly difficult beyond the early mixed dentition
years 44. Treatment is recommended as early as possible in order to minimize the
development of progressive skeletal asymmetry 10,38,46-49 , due to compensatory
temporomandibular joint changes 43,50 and asymmetrical masticatory muscle activity 51,52.
Crossbite patients have also shown smaller bite forces than non-crossbite subjects 52.
Functional unilateral crossbites should be corrected by expanding the maxilla and
eliminating occlusal interferences. True skeletal unilateral posterior crossbites, however,
should ideally receive greater skeletal maxillary expansion on the more severe (collapsed)
cross-bite side in order to avoid overexpansion of the normal side into a buccal crossbite
which lengthens overall treatment time and is more difficult to correct 41,53,54. Unfortunately,

12
asymmetric dental-tipping mechanics involving unilateral cross-elastics or quad-helix
appliance with differential arm lengths, are unsatisfactory in the correction of maxillary
constriction with a skeletal origin 41. Correction of skeletal maxillary constriction through
dental expansion methods have been reported to produce greater relapse 8,10,55.
2.2 Dental and Skeletal Expansion with T-RME
To better understand the justifications for developing B-RME and this study's specific
interest on B-RME, it is prudent to review T-RME's limitations. Over the past century,
correction of maxillary constriction in adolescents have been accomplished through variations
of T-RME appliances. The most traditional type of T-RME involves a hyrax jackscrew secured
by orthodontic bands cementation to bilateral maxillary first molars and premolars, a.k.a. 4-
band T-RME 40. When only bilateral maxillary first molars are banded, it can be called 2-band
T-RME 56. In later discussions (see section 5), the 2-band T-RME is compared to the Dresden B-
RME, since it also has only two points of bone contact.
The intense forces (cumulatively up to 90 N 57) from the jackscrew are applied to
molar and premolar crowns, and passed through the roots into the alveolar bone. Forces in
the initial 3 to 7 days are high enough to temporarily disable dental movements within the
bone (due to hyalinization and undermining resorption on the pressure side) 58,59. The teeth
then acts as bone anchors in the two maxillary halves 55. This time window is the only
opportunity to induce skeletal expansion (up to 30%) of the maxillary jaw in skeletally
immature adolescents 60,55.
Skeletal expansion is believed to produce more stable expansion outcomes (less
relapse) than dental expansion 8. Skeletal expansion can be classified into sutural expansion
versus alveolar bending 33,61. Alveolar bending occurs when the expansion forces caused by
RME separate the two maxillary halves in a fan-shaped pattern, centered on the frontonasal
suture in the frontal plane 33,62,63.
When applied to skeletally mature adults, the separation of densely interdigitated
mid-sagittal and circum-maxillary sutures is nearly impossible 8,64. This results in negative
consequences including, but not limited to: root resorption 65,66, buccal alveolar bone loss
13
67,68, excess buccal dental tipping and bite opening 68, relapse of the crossbite 69, limited
suture separation 70, and buccal alveolar bending 61.
Evidently, one of the primary factors which affects the skeletal to dental expansion
ratio is skeletal maturity 8,71. Based on the classic metallic implant study by Krebs et al in
1958 35, 47% skeletal expansion can be achieved in patients aged 8.5 to 12 years, and only
about 30% skeletal expansion for ages 13 to 19.
These limitations motivated a variety of new maxillary expander designs in hopes of
minimizing dental side effects and increasing the skeletal component of transverse
correction. These efforts gradually evolved into a new class of B-RME expanders.
2.3 New Developments with Bone-borne RME
B-RME attempts to minimize dental structures disturbance and maximize skeletal
expansion by directly inserting either shortened palatal implants or temporary anchorage
devices (TADs) 36,37 into the two halves of the bony maxillary palate.
Prominence of B-RME also increased as patients with multiple missing maxillary teeth,
poor periodontal or coronal status, that were not able to use T-RME treatment, can now
undergo B-RME treatment instead 34,37. Although it should still be noted that B-RME does have
its inherent risk, including possibility of infection, and the need for local anesthesia during
placement 34,39.
This study’s literature review found two B-RME controlled clinical trials with different
results. Whereas Lin et al 33 found almost two-fold greater skeletal effects using B-RME (57% -
77%) compared to T-RME (25% - 43%), Lagravère et al 34 reported both T-RME and B-RME to
show similar skeletal change (a difference of only 3% - 6% between the two groups). When
interpreting these results, it should be noted there were appliance design differences.
The bone anchorage used by Lin et al consisted of four TADs and a split-acrylic resin
plate resting on the palate. Lagravère's design consisted of two onplants on top of two TADs.
Several in vitro studies have found differences in bone-anchor appliance design, especially in
anchorage site and stress distribution, can generate varying patterns of dental and skeletal
displacements 72,73. Nonetheless, a deeper analysis into the internal dental, alveolar and

14
skeletal anatomical structures between both groups is needed to provide more conclusive
answers.
2.4 2-D Measurement Techniques
The literature reviewed in this section was part of the landmark selection process (see
section 4.2). It serves as a reference for the landmarks that was used for dental arch and
skeletal measurements, as part of the research objective.
In the past, orthodontists have used 2-D occlusograms to evaluate maxilla and
mandible arch width changes 64,74. This technique requires examiner to manually trace dental
crown outlines from plaster stone models onto acetate tracing paper, and mapping a
constructed maxillary midline to the mandible. Only limited discussion will be provided for
this technique. Reader should be referred to Ferro et al 75 or Marcotte et al 76 for a more
detailed discussion. Essentially, this technique has traditionally been criticized to be time-
consuming and not very precise 77. It is limited to dental crown observations. Other studies
reported inaccuracies of a few millimeters purely due to abrasion or distortion of plaster
stone models 74,78,79. However, attention should be drawn to the landmarks used for drawing
the mid-sagittal line in this technique. One landmark is the distal aspect of the incisive
papilla, and the other at the fovea centralis of the posterior palate 80. Similar landmarks
within the same region of the anterior and posterior palate were identified and evaluated in
this study.
One such landmark is the Nasopalatine Foramen (NPF) a.k.a. Incisive Foramen.
Anatomy textbooks usually describe the incisive canal as situated at the midline, posterior to
the central incisor teeth 81,2. The nasopalatine nerve and artery passes through this canal and
into the incisive papilla. Its palatal opening is the NPF, which has been shown to be a
relatively stable area 80.
Grayson et al 82 presented multi-plane cephalometry by combining two 2-D x-ray
radiographs (postero-anterior cephalogram and lateral cephalogram) to construct one of the
earliest forms of 3-D representation of the skull for multi-dimensional assessment. However,
this is not a true 3-D reconstruction and was subjected to inherent analysis bias 83. Conceptual
construction of a mid-sagittal line was attempted by combining midlines of both 2-D films,

15
although the “mid-sagittal plane” showed warping, particularly in patients with facial
asymmetry 82.
The skeletal midline was drawn using Crista Galli (CG), mid-point between left and
right lateral orbital rims (LOrb), Anterior Nasal Spine (ANS), and Menton landmarks 19,80,84.
Jugale (J) and Antegonion (AG) are used to measure skeletal maxilla-mandible width.
Perpendicular distances from the midline to the J and AG landmarks are then used to measure
the extent of asymmetry 19,30,85. The ratio of the maxilla width (left J to right J) to mandibular
width (left AG to right AG) is also used to measure the severity of the posterior crossbite.
Projection errors still existed on the respective films, and the 2-D landmarks
identification still demonstrated challenges. The projection error on the postero-anterior
cephalogram was reflected by magnification of distance between left and right Jugale by 2%
compared to actual dimensions, and two-fold magnification (4%) between left and right
Antegonion 27.
In general, great difficulty has been reported in using these 2-D headfilms to evaluate
3-D skeletal and dental changes 18,26,27 due to problems of patient head positioning 29,
anatomical overlap 26,27,30, and magnification errors 19,31,32. Many 2-D cephalometic
measurements are distorted in the presence of facial asymmetry 28.
2.5 3-D Measurement Techniques
Cone-beam computed tomography (CBCT) has become the recommended imaging
technique for 3-D expansion treatment changes, and symmetry assessment 15-18. As mentioned
previously, traditional 2-D landmarks may not always be applicable in the 3-D domain 86. For
example, menton and condylion landmarks are located on a wide radius of the mandible,
making it very difficult to locate precisely in 3-D. Transition to the use of 3-D landmarks
demands extension of landmark definitions into the new dimension 87. As these anatomical
landmarks will form the basis of all orthodontic radiographic measurements, this 3-D
extension demands greater understanding of the accuracy, stability and reliability of each
individual reference landmark.
Regarding the equipment accuracy of CBCT, negligible amounts of projection error and
a 1:1 ratio have been reported in all three dimensions 20 ,88. CBCT also has the ability to

16
generate sub-millimeter voxel-sized high-resolution images; down to the range of 0.4 mm to
0.125 mm in the three axes 21,22.
Since the Cartesian coordinate system used in each CBCT scan is determined at the time
of acquisition 89, changes in dimensions cannot be observed through by merely taking values
of any one axis alone; instead, the formula for Euclidean distances is required in order to
determine transverse, vertical, and sagittal measurements. However, in the past decade,
several studies 15,83 ,89,90 ,91 have expressed the need to establish 3-D reference planes.
To illustrate limits to Euclidean distance measurements, Figure 2.1 shows how the
measured distance can overestimate actual changes in the dimension of interest. Consider the
scenario where the initial transverse distance between the left and right molars (represented
AB) is of interest. Now, assume one of the molars moved vertically without transverse
movement (the molar depicted on the right). Using the same dental landmarks, the new
measured distance would be the greater AC instead. As such, this study investigated into
acquiring a reference plane, similar to mid-sagittal lines constructed in 2-D, and then used
orthogonal distances instead. By using orthogonal distances, the measured changes in Figure
2.1 will now be the difference between DB and EC, which matches closer to the actual
transverse displacements. This argument can be extended to other dimensions. This method
also provides the added benefits of symmetry analysis and helps overcome patient head
positioning problems.
Figure 2.1: Illustrates how Euclidean distance measurement can overestimate actual changes
(Image of maxillary first molar teeth adapted from Nelson et al 92).
17
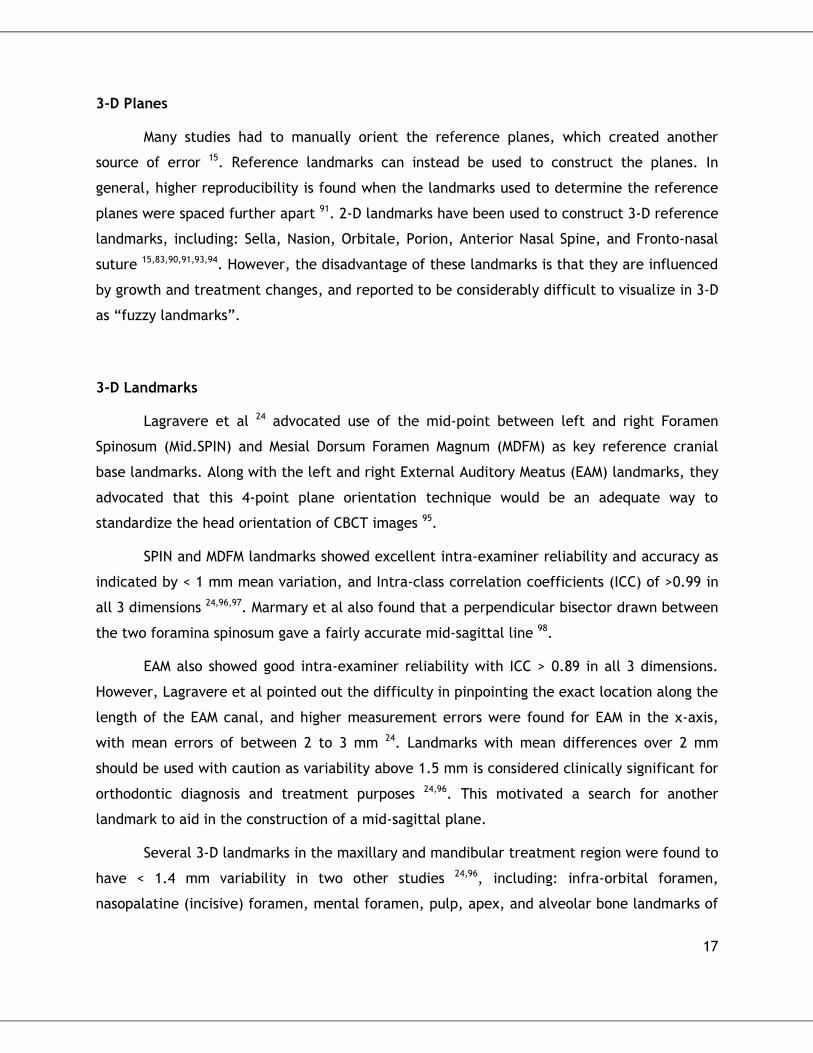
3-D Planes
Many studies had to manually orient the reference planes, which created another
source of error 15. Reference landmarks can instead be used to construct the planes. In
general, higher reproducibility is found when the landmarks used to determine the reference
planes were spaced further apart 91. 2-D landmarks have been used to construct 3-D reference
landmarks, including: Sella, Nasion, Orbitale, Porion, Anterior Nasal Spine, and Fronto-nasal
suture 15,83,90,91,93,94. However, the disadvantage of these landmarks is that they are influenced
by growth and treatment changes, and reported to be considerably difficult to visualize in 3-D
as “fuzzy landmarks”.
3-D Landmarks
Lagravere et al 24 advocated use of the mid-point between left and right Foramen
Spinosum (Mid.SPIN) and Mesial Dorsum Foramen Magnum (MDFM) as key reference cranial
base landmarks. Along with the left and right External Auditory Meatus (EAM) landmarks, they
advocated that this 4-point plane orientation technique would be an adequate way to
standardize the head orientation of CBCT images 95.
SPIN and MDFM landmarks showed excellent intra-examiner reliability and accuracy as
indicated by < 1 mm mean variation, and Intra-class correlation coefficients (ICC) of >0.99 in
all 3 dimensions 24,96,97. Marmary et al also found that a perpendicular bisector drawn between
the two foramina spinosum gave a fairly accurate mid-sagittal line 98.
EAM also showed good intra-examiner reliability with ICC > 0.89 in all 3 dimensions.
However, Lagravere et al pointed out the difficulty in pinpointing the exact location along the
length of the EAM canal, and higher measurement errors were found for EAM in the x-axis,
with mean errors of between 2 to 3 mm 24. Landmarks with mean differences over 2 mm
should be used with caution as variability above 1.5 mm is considered clinically significant for
orthodontic diagnosis and treatment purposes 24,96. This motivated a search for another
landmark to aid in the construction of a mid-sagittal plane.
Several 3-D landmarks in the maxillary and mandibular treatment region were found to
have < 1.4 mm variability in two other studies 24,96, including: infra-orbital foramen,
nasopalatine (incisive) foramen, mental foramen, pulp, apex, and alveolar bone landmarks of

18
the upper and lower first molar and first premolar teeth. These will serve as a benchmark for
new 3-D landmarks.
2.6 Summary
This chapter provides a literature review on the impact of maxillary transverse
constriction to better justify the research motivation. This extended into reviewing
traditional and current expansion treatments. It revealed that although 3-D technology can
provide greater equipment accuracy, the current measurement techniques were still
inadequate. It has been stated repeatedly to be a challenging task due to a series of inherent
difficulties derived from the extra dimension. Recognizing this, many of the findings from
these literatures will be used as a foundation, and as a benchmark for the methods proposed
in the remainder of this study.

19
2.7 References
1. McNamara JA. Maxillary transverse deficiency. American Journal of Orthodontics and Dentofacial Orthopedics 2000;117:567-570.
2. Kutin G, Hawes RR. Posterior cross-bites in the deciduous and mixed dentitions. American journal of orthodontics 1969;56:491-504.
3. Thilander B, Myrberg N. The prevalence of malocclusion in Swedish schoolchildren. European Journal of Oral Sciences 1973;81:12-20.
4. Heikinheimo K, Salmi K, Myllärniemi S. Long term evaluation of orthodontic diagnoses made at the ages of 7 and 10 years. The European Journal of Orthodontics 1987;9:151-159.
5. Thilander B, Pena L, Infante C, Parada SS, de Mayorga C. Prevalence of malocclusion and orthodontic treatment need in children and adolescents in Bogota, Colombia. An epidemiological study related to different stages of dental development. The European Journal of Orthodontics 2001;23:153-168.
6. Keski-Nisula K, Lehto R, Lusa V, Keski-Nisula L, Varrela J. Occurrence of malocclusion and need of orthodontic treatment in early mixed dentition. American Journal of Orthodontics and Dentofacial Orthopedics 2003;124:631-638.
7. da Silva Filho OG, Santamaria Jr M, Filho LC. Epidemiology of posterior crossbite in the primary dentition. Journal of Clinical Pediatric Dentistry 2007;32:73-78.
8. Bishara SE, Staley RN. Maxillary expansion: clinical implications. American Journal of Orthodontics and Dentofacial Orthopedics 1987;91:3-14.
10. Bell RA. A review of maxillary expansion in relation to rate of expansion and patient's age. American journal of orthodontics 1982;81:32-37.
11. Kennedy DB, Osepchook M. Unilateral posterior crossbite with mandibular shift: a review. Journal-Canadian Dental Association 2005;71:569.
15. Sievers MM, Larson BE, Gaillard PR, Wey A. Asymmetry assessment using cone beam CT: A Class I and Class II patient comparison. The Angle Orthodontist 2011;82:410-417.
16. Sanders DA, Rigali PH, Neace WP, Uribe F, Nanda R. Skeletal and dental asymmetries in Class II subdivision malocclusions using cone-beam computed tomography. American Journal of Orthodontics and Dentofacial Orthopedics 2010;138:542. e541-542. e520.
17. Katsumata A, Fujishita M, Maeda M, Ariji Y, Ariji E, Langlais RP. 3D-CT evaluation of facial asymmetry. Oral Surgery, Oral Medicine, Oral Pathology, Oral Radiology, and Endodontology 2005;99:212-220.
18. Baek S-H, Cho I-S, Chang Y-I, Kim M-J. Skeletodental factors affecting chin point deviation in female patients with class III malocclusion and facial asymmetry: a three-dimensional analysis using computed tomography. Oral Surgery, Oral Medicine, Oral Pathology, Oral Radiology, and Endodontology 2007;104:628-639.
19. Jacobson A, RL J. Radiographic Cephalometry: From Basics to 3-D Imaging, (Book/CD-ROM set), Chapter 23. 2007.
20. Lagravère MO, Carey J, Toogood RW, Major PW. Three-dimensional accuracy of measurements made with software on cone-beam computed tomography images. American Journal of Orthodontics and Dentofacial Orthopedics 2008;134:112-116.

20
21. Scarfe WC, Farman AG, Sukovic P. Clinical applications of cone-beam computed tomography in dental practice. Journal-Canadian Dental Association 2006;72:75.
22. Yajima A, Otonari-Yamamoto M, Sano T, Hayakawa Y, Otonari T, Tanabe K et al. Cone-beam CT (CB Throne) applied to dentomaxillofacial region. The Bulletin of Tokyo Dental College 2006;47:133-141.
24. Lagravère MO, Gordon JM, Guedes IH, Flores-Mir C, Carey JP, Heo G et al. Reliability of traditional cephalometric landmarks as seen in three-dimensional analysis in maxillary expansion treatments. The Angle orthodontist 2009;79:1047-1056.
26. Lee K-M, Hwang H-S, Cho J-H. Comparison of transverse analysis between posteroanterior cephalogram and cone-beam computed tomography. Angle Orthodontist 2013;84:715-719.
27. Ghafari J, Cater PE, Shofer FS. Effect of film-object distance on posteroanterior cephalometric measurements: suggestions for standardized cephalometric methods. American Journal of Orthodontics and Dentofacial Orthopedics 1995;108:30-37.
28. Gateno J, Xia JJ, Teichgraeber JF. Effect of facial asymmetry on 2-dimensional and 3-dimensional cephalometric measurements. Journal of Oral and Maxillofacial Surgery 2011;69:655-662.
29. Thiesen G, Gribel BF, Freitas MPM. Facial asymmetry: a current review. Dental press journal of orthodontics 2015;20:110-125.
30. Betts N, Vanarsdall R, Barber H, Higgins-Barber K, Fonseca R. Diagnosis and treatment of transverse maxillary deficiency. The International journal of adult orthodontics and orthognathic surgery 1994;10:75-96.
31. Chien P, Parks E, Eraso F, Hartsfield J, Roberts W, Ofner S. Comparison of reliability in anatomical landmark identification using two-dimensional digital cephalometrics and three-dimensional cone beam computed tomography in vivo. Dentomaxillofacial Radiology 2014.
32. Oz U, Orhan K, Abe N. Comparison of linear and angular measurements using two-dimensional conventional methods and three-dimensional cone beam CT images reconstructed from a volumetric rendering program in vivo. Dentomaxillofac Radiol 2011;40:492-500.
33. Lin L, Ahn H-W, Kim S-J, Moon S-C, Kim S-H, Nelson G. Tooth-borne vs bone-borne rapid maxillary expanders in late adolescence. The Angle Orthodontist 2014;85:253-262.
34. Lagravère MO, Carey J, Heo G, Toogood RW, Major PW. Transverse, vertical, and anteroposterior changes from bone-anchored maxillary expansion vs traditional rapid maxillary expansion: A randomized clinical trial. American Journal of Orthodontics and Dentofacial Orthopedics 2010;137:304.e301-304.e312.
35. Krebs A. Expansion of the midpalatal suture, studied by means of metallic implants. Acta Odontologica Scandinavica 1959;17:491-501.
36. Wehrbein H, Göllner P. Skeletal Anchorage in Orthodontics – Basics and Clinical Application. Journal of Orofacial Orthopedics / Fortschritte der Kieferorthopädie 2007;68:443-461.
37. Hansen L, Tausche E, Hietschold V, Hotan T, Lagravère M, Harzer W. Skeletally-anchored Rapid Maxillary Expansion using the Dresden Distractor. Journal of Orofacial Orthopedics / Fortschritte der Kieferorthopädie 2007;68:148-158.

21
38. Baydas B, Yavuz İ, Uslu H, Dagsuyu İM, Ceylan İ. Nonsurgical rapid maxillary expansion effects on craniofacial structures in young adult females: a bone scintigraphy study. The Angle orthodontist 2006;76:759-767.
39. Tausche E, Hansen L, Hietschold V, Lagravère MO, Harzer W. Three-dimensional evaluation of surgically assisted implant bone-borne rapid maxillary expansion: A pilot study. American Journal of Orthodontics and Dentofacial Orthopedics 2007;131:S92-S99.
40. Rakosi T, Graber T. Orthodontic and Dentofacial Orthopedic Treatment, Chapter 7 2009:155-176.
41. Hassan AH, AlGhamdi AT, Al-Fraidi AA, Al-Hubail A, Hajrassy MK. Unilateral cross bite treated by corticotomy-assisted expansion: two case reports. Head & face medicine 2010;6:1.
42. Hesse KL, Årtun J, Joondeph DR, Kennedy DB. Changes in condylar position and occlusion associated with maxillary expansion for correction of functional unilateral posterior crossbite. American Journal of Orthodontics and Dentofacial Orthopedics 1997;111:410-418.
43. Harrison JE, Ashby D. Orthodontic treatment for posterior crossbites. The Cochrane Library 2001.
44. Thilander B, Wahlund S, Lennartsson B. The effect of early interceptive treatment in children with posterior cross-bite. The European Journal of Orthodontics 1984;6:25-34.
45. Schröder U, Schröder I. Early treatment of unilateral posterior crossbite in children with bilaterally contracted maxillae. The European Journal of Orthodontics 1984;6:65-69.
46. O'Byrn BL, Sadowsky C, Schneider B, BeGole EA. An evaluation of mandibular asymmetry in adults with unilateral posterior crossbite. American Journal of Orthodontics and Dentofacial Orthopedics 1995;107:394-400.
47. Pirttiniemi P, Kantomaa T, Lahtela P. Relationship between craniofacial and condyle path asymmetry in unilateral cross-bite patients. The European Journal of Orthodontics 1990;12:408-413.
48. De Felippe NLO, Da Silveira AC, Viana G, Kusnoto B, Smith B, Evans CA. Relationship between rapid maxillary expansion and nasal cavity size and airway resistance: short-and long-term effects. American Journal of Orthodontics and Dentofacial Orthopedics 2008;134:370-382.
49. Rodrigues Ado P, Monini Ada C, Gandini LG, Jr., Santos-Pinto A. Rapid palatal expansion: a comparison of two appliances. Braz Oral Res 2012;26:242-248.
50. Myers DR, Barenie JT, Bell RA, Williamson EH. Condylar position in children with functional posterior crossbites: before and after crossbite correction. Pediatr Dent 1980;2:190-194.
51. Piancino MG, Talpone F, Dalmasso P, Debernardi C, Lewin A, Bracco P. Reverse-sequencing chewing patterns before and after treatment of children with a unilateral posterior crossbite. The European Journal of Orthodontics 2006;28:480-484.
52. Iodice G, Danzi G, Cimino R, Paduano S, Michelotti A. Association between posterior crossbite, skeletal, and muscle asymmetry: a systematic review. The European Journal of Orthodontics 2016:cjw003.

22
53. Ileri Z, Basciftci FA. Asymmetric rapid maxillary expansion in true unilateral crossbite malocclusion: A prospective controlled clinical study. The Angle Orthodontist 2015;85:245-252.
54. Baka ZM, Akin M, Ucar FI, Ileri Z. Cone-beam computed tomography evaluation of dentoskeletal changes after asymmetric rapid maxillary expansion. American Journal of Orthodontics and Dentofacial Orthopedics 2015;147:61-71.
55. Proffit W FH, Sarver D.,. Contemporary orthodontics. Mosby; 2013.
56. Davidovitch M, Efstathiou S, Sarne O, Vardimon AD. Skeletal and dental response to rapid maxillary expansion with 2-versus 4-band appliances. American Journal of Orthodontics and Dentofacial Orthopedics 2005;127:483-492.
57. Isaacson RJ, Wood JL, Ingram AH. Forces produced by rapid maxillary expansion: I. Design of the force measuring system. The Angle Orthodontist 1964;34:256-260.
58. Zimring JF, Isaacson RJ. Forces Produced By Rapid Maxillary Expansion. 3. Forces Present During Retention. Angle Orthod 1965;35:178-186.
59. Chaconas SJ, Caputo AA. Observation of orthopedic force distribution produced by maxillary orthodontic appliances. Am J Orthod 1982;82:492-501.
60. Garib DG, Henriques JFC, Janson G, de Freitas MR, Fernandes AY. Periodontal effects of rapid maxillary expansion with tooth-tissue-borne and tooth-borne expanders: a computed tomography evaluation. American journal of orthodontics and dentofacial orthopedics 2006;129:749-758.
61. Weissheimer A, de Menezes LM, Mezomo M, Dias DM, de Lima EMS, Rizzatto SMD. Immediate effects of rapid maxillary expansion with Haas-type and hyrax-type expanders: a randomized clinical trial. American Journal of Orthodontics and Dentofacial Orthopedics 2011;140:366-376.
62. Garrett BJ, Caruso JM, Rungcharassaeng K, Farrage JR, Kim JS, Taylor GD. Skeletal effects to the maxilla after rapid maxillary expansion assessed with cone-beam computed tomography. American Journal of Orthodontics and Dentofacial Orthopedics 2008;134:8.e1-8.e11.
63. Garib DG, Henriques JFC, Janson G, Freitas MR, Coelho RA. Rapid maxillary expansion-tooth tissue-borne versus tooth-borne expanders: a computed tomography evaluation of dentoskeletal effects. The Angle orthodontist 2005;75:548-557.
64. Bazargani F, Feldmann I, Bondemark L. Three-dimensional analysis of effects of rapid maxillary expansion on facial sutures and bones: a systematic review. The Angle Orthodontist 2013;83:1074-1082.
65. Langford S, Sims M. Root surface resorption, repair, and periodontal attachment following rapid maxillary expansion in man. American journal of orthodontics 1982;81:108-115.
66. Barber AF, Sims M. Rapid maxillary expansion and external root resorption in man: a scanning electron microscope study. American journal of orthodontics 1981;79:630-652.
67. Garib DG, Henriques JF, Janson G, de Freitas MR, Fernandes AY. Periodontal effects of rapid maxillary expansion with tooth-tissue-borne and tooth-borne expanders: a computed tomography evaluation. Am J Orthod Dentofacial Orthop 2006;129:749-758.

23
68. Ramieri GA, Spada MC, Austa M, Bianchi SD, Berrone S. Transverse maxillary distraction with a bone-anchored appliance: dento-periodontal effects and clinical and radiological results. International Journal of Oral and Maxillofacial Surgery 2005;34:357-363.
69. Parr JA, Garetto LP, Wohlford ME, Arbuckle GR, Roberts WE. Sutural expansion using rigidly integrated endosseous implants: an experimental study in rabbits. The Angle orthodontist 1997;67:283-290.
70. Shapiro P, Kokich V. Uses of implants in orthodontics. Dental Clinics of North America 1988;32:539-550.
71. Baccetti T, Franchi L, Cameron CG, McNamara Jr JA. Treatment timing for rapid maxillary expansion. The Angle orthodontist 2001;71:343-350.
72. Lee HK, Bayome M, Ahn CS, Kim S-H, Kim KB, Mo S-S et al. Stress distribution and displacement by different bone-borne palatal expanders with micro-implants: a three-dimensional finite-element analysis. The European Journal of Orthodontics 2012:cjs063.
73. MacGinnis M, Chu H, Youssef G, Wu KW, Machado AW, Moon W. The effects of micro-implant assisted rapid palatal expansion (MARPE) on the nasomaxillary complex—a finite element method (FEM) analysis. Progress in orthodontics 2014;15:1.
74. Zhou Y, Long H, Ye N, Xue J, Yang X, Liao L et al. The effectiveness of non-surgical maxillary expansion: a meta-analysis. The European Journal of Orthodontics 2013:cjt044.
75. Ferro F, Spinella P, Lama N. Transverse maxillary arch form and mandibular asymmetry in patients with posterior unilateral crossbite. American Journal of Orthodontics and Dentofacial Orthopedics 2011;140:828-838.
76. Marcotte MR. The use of the occlusogram in planning orthodontic treatment. American journal of orthodontics 1976;69:655-667.
77. Fiorelli G, Melsen B. The "3-D occlusogram" software. Am J Orthod Dentofacial Orthop 1999;116:363-368.
78. Canuto LFG, de Freitas MR, Janson G, de Freitas KMS, Martins PP. Influence of rapid palatal expansion on maxillary incisor alignment stability. American Journal of Orthodontics and Dentofacial Orthopedics 2010;137:164. e161-164. e166.
79. Moussa R, O'Reilly MT, Close JM. Long-term stability of rapid palatal expander treatment and edgewise mechanotherapy. American Journal of Orthodontics and Dentofacial Orthopedics 1995;108:478-488.
80. Alavi DG, BeGole EA, Schneider BJ. Facial and dental arch asymmetries in Class II subdivision malocclusion. American Journal of Orthodontics and Dentofacial Orthopedics 1988;93:38-46.
81. Mraiwa N, Jacobs R, Van Cleynenbreugel J, Sanderink G, Schutyser F, Suetens P et al. The nasopalatine canal revisited using 2D and 3D CT imaging. Dentomaxillofac Radiol 2004;33:396-402.
82. Grayson B, Cutting C, Bookstein FL, Kim H, McCarthy JG. The three-dimensional cephalogram: theory, techniques, and clinical application. American Journal of Orthodontics and Dentofacial Orthopedics 1988;94:327-337.

24
83. Swennen GR, Schutyser F, Barth E-L, De Groeve P, De Mey A. A new method of 3-D cephalometry Part I: the anatomic Cartesian 3-D reference system. Journal of craniofacial surgery 2006;17:314-325.
84. Kusayama M, Motohashi N, Kuroda T. Relationship between transverse dental anomalies and skeletal asymmetry. American Journal of Orthodontics and Dentofacial Orthopedics 2003;123:329-337.
85. Ricketts RM. Perspectives in the clinical application of cephalometrics: the first fifty years. The Angle orthodontist 1981;51:115-150.
86. Ludlow JB, Gubler M, Cevidanes L, Mol A. Precision of cephalometric landmark identification: cone-beam computed tomography vs conventional cephalometric views. American Journal of Orthodontics and Dentofacial Orthopedics 2009;136:312. e311-312. e310.
87. de Oliveira AEF, Cevidanes LHS, Phillips C, Motta A, Burke B, Tyndall D. Observer reliability of three-dimensional cephalometric landmark identification on cone-beam computerized tomography. Oral Surgery, Oral Medicine, Oral Pathology, Oral Radiology, and Endodontology 2009;107:256-265.
88. Mah J HD. Three-dimensional craniofacial imaging. Am J Orthod Dentofacial Orthop 2004;126:308-309.
89. Lagravere MO, Hansen L, Harzer W, Major PW. Plane orientation for standardization in 3-dimensional cephalometric analysis with computerized tomography imaging. Am J Orthod Dentofacial Orthop 2006;129:601-604.
90. Park S-H, Yu H-S, Kim K-D, Lee K-J, Baik H-S. A proposal for a new analysis of craniofacial morphology by 3-dimensional computed tomography. American Journal of Orthodontics and Dentofacial Orthopedics 2006;129:600.e623-600.e634.
91. Shibata M, Nawa H, Kise Y, Fuyamada M, Yoshida K, Katsumata A et al. Reproducibility of three-dimensional coordinate systems based on craniofacial landmarks. The Angle Orthodontist 2012;82:776-784.
92. Nelson SJ. Wheeler's dental anatomy, physiology and occlusion. Elsevier Health Sciences; 2014.
93. Hayashi K, Uechi J, Mizoguchi I. Three-Dimensional Analysis of Dental Casts Based on a Newly Defined Palatal Reference Plane. The Angle Orthodontist 2003;73:539-544.
94. Porto OCL, de Freitas JC, de Alencar A, Estrela C. The use of three-dimensional cephalometric references in dentoskeletal. Dental Press J Orthod 2014;19:78-85.
95. Lagravere MO, Major PW, Carey J. Sensitivity analysis for plane orientation in three-dimensional cephalometric analysis based on superimposition of serial cone beam computed tomography images. Dentomaxillofac Radiol 2010;39:400-408.
96. Naji P, Alsufyani NA, Lagravère MO. Reliability of anatomic structures as landmarks in three-dimensional cephalometric analysis using CBCT. The Angle Orthodontist 2013;84:762-772.
97. Lagravère MO, Gordon JM, Flores-Mir C, Carey J, Heo G, Major PW. Cranial base foramen location accuracy and reliability in cone-beam computerized tomography. American Journal of Orthodontics and Dentofacial Orthopedics 2011;139:e203-e210.

25
98. Arat ZM, Rübendüz M, Arman Akgül A. The displacement of craniofacial reference landmarks during puberty: a comparison of three superimposition methods. The Angle orthodontist 2003;73:374-380.

26
Chapter 3

27
3. Reliability and Accuracy of three-dimensional reference planes and
landmarks related to maxillary expansion
3.1 Introduction
Anatomic landmarks are often identified, selected for specific interests, and used
extensively for quantifying treatment changes and diagnosis in orthodontics. Indubitably, one
must account for the possible errors to ensure landmarks are sufficiently accurate and
reliable for its purposes.
Landmark identification is a major source of measurement error 99. These are errors
that arise in the process of identifying specific landmarks with factors including, but not
limited to, sharpness of radiographic image, landmark definitions, examiner's (a.k.a. human)
error, and procedural errors 100,101. 3-D imaging has been shown to greatly reduce projection
errors compared to traditional 2-D techniques 32. These are all necessary considerations that
guide much of the landmark selection process.
In this document's context, only landmarks that are related to the maxillary expansion
were examined. This involved specially selecting landmarks used for transverse, vertical, and
antero-posterior measurements. Afterwards, the landmarks' accuracy and reliability were
evaluated for its respective purpose.
Traditional methods were reviewed for relevant landmark definitions and findings that
are still applicable in the 3-dimensional domain.
3.2 Landmark Selection
3.2.1 Selection Criteria
This study follows four main aspects for landmark selection criteria: accuracy,
reliability, relevance, and stability. Stability is the level of invariance exhibited with regards
to natural growth and treatment changes. Relevance is the representativeness of the
landmark(s) in reflecting the actual displacement of the anatomical structure of interest. In
the context of this section, Intra-examiner Reliability is the deviation of repeated measured
values obtained on the same image of the same patient by one examiner. Intra-examiner

28
Accuracy is the deviation of repeated measured values obtained on different images of the
same patient by one examiner.
Reliability and accuracy can both be affected by identification error. In this regard,
specific indicators were used to evaluate each landmark, as detailed in section 3.7. With 2-D
cephalometry, linear measurement errors of between 0.3 mm to 1.4 mm have been reported
to be satisfactory 102. This low level of measurement error must be maintained when selecting
appropriate 3-D landmarks. Baumrind and Frantz have also pointed out that any anatomic
landmark there can be a non-uniform envelope of measurement error in all axes (x-, y- and z-
axes)103,104. Therefore, errors in all axes were independently analyzed.
In general, the choice of relevant landmarks depends on the objective of the study 101.
Reference landmarks should be located on invariant structures that will not be influenced by
growth or treatment changes. Cranial base landmarks are considered to remain stable with
growth, since >85% of growth has been completed in this region by the age of 7 105. The
neurovascular bundles through the foramina of the cranial base remain largely as a non-
violated biological function during growth and development 98,106. Suitable landmarks with
small identification errors are generally located in areas of high density-contrast and located
on sharply curved or pointed bony structures. The center-point within small and consistently
rounded foramen serve as promising candidates during landmark selection 24.
3.2.2 Mid-Sagittal Plane
This section presents the candidate landmarks identified from the literature review in
section 2.4 and 2.5, along with their relevance in the construction of the mid-sagittal plane.
This reference plane is used for measuring transverse changes.
The postero-anterior and lateral cephalometric analyses involved a collection of
landmarks for transverse skeleto-dental assessment. However, landmarks such as Menton and
Antegonion (AG) lie on a wide radius of the bone; while Jugale (J) lie on the intersection
between two overlapping bone structures 26 making it difficult to pinpoint reliably. The
Anterior Nasal Spine (ANS) landmark can be partially or completely destroyed after RME
treatment 24, and it can be off-centered for patients who have maxillary asymmetry 15,99.
The Nasopalatine Foramen (NPF) landmark was selected to replace ANS, as it was
shown to be a relevant and stable landmark for midline definition 81. NPF is an important

29
landmark to represent how the mid-sagittal plane dissects the anterior palate. The
nasopalatine nerve and artery passes through this canal and into the incisive papilla. Its
palatal opening is the NPF, which has been shown a relatively stable area 80. One recent study
attempted to evaluate NPF as a stable landmark, but found difficulties in pinpointing the
exact geometric center of this foramen due to is broad obliquity 96. In recognition of this, the
left and right NPF was used to calculate the NPF mid-point (Mid.NPF), instead of locating the
center of NPF directly in this study.
The superior tip of the CG landmark was also chosen from the postero-anterior
cephalogram technique. It is consistently located on the mid-sagittal plane and has a sharply
pointed bony structure which can minimize identification error 24.
From two previous CBCT studies 24,96 (discussed in section 2.5), both SPIN and MDFM
landmarks were shown to be suitable as mid-sagittal 3-D landmarks. Furthermore, Marmary et
al also found that a perpendicular bisector drawn between the two foramina spinosum gave a
fairly accurate mid-sagittal line 98,107. MDFM also corresponded to the widely used 2-D
cephalometric landmark, the Basion 91. Basion is the most anterior-inferior point of the
foramen magnum where the spinal cord exits the posterior cranial base 100.
Posterior Vidian canal opening (PVID) was another candidate landmark in the cranial
base which satisfies the criteria of having a small diameter. It has a consistently round cross-
section of about 1.4 mm ± 0.6 mm diameter 108. The Vidian canal gives passage to the Vidian
artery and the Vidian nerve, and runs in a relatively straight antero-posterior direction at the
base of each medial pterygoid plate of the sphenoid bone 108. The vidian canal was found to
be bilaterally equidistant to mid-sagittal plane in 77% based on a sample of 167 subjects
according to Chen 2015 et al 109,.
Collectively, SPIN, Mid.NPF, MDFM, CG, and PVID were all candidate landmarks
analyzed for mid-sagittal plane construction in 3-D.
3.2.3 Palatal Plane
The palatal plane used by lateral cephalogram was constructed using two landmarks:
ANS and Posterior Nasal Spine (PNS). However, ANS is not reliable and PNS is not a 3-D point
(see section 3.2.2). To replace PNS, the greater palatine foramen (GPF) landmark was
selected. Langenegger et al found in 96% of cases, GPF were located distal to the mid-palatal

30
aspect of the maxillary third molar. It was also found to be situated 15 mm bilaterally
equidistant from the mid-palatal suture. To replace ANS, the NPF candidate landmark
presented in section 3.2.2 was selected as it is located posterior to the maxillary central
incisors.
Collectively, the Mid.NPF, left GPF, and right GPF together were the candidate 3-D
landmarks used for posterior palatal plane construction.
3.2.4 Frontal Plane
To determine antero-posterior changes of the anterior maxilla in 2-D cephalometry, a
perpendicular line is drawn from Nasion (N-perp) down to A-point (most concave point on the
anterior maxilla)110. Although widely used for its strategic location, the landmarks Point A and
Nasion has been reported as a non-ideal 3-D reference point since they are located on
relatively flat bony surfaces and both are subjected to changes with growth 111.
In 3-D, sharply pointed bony structure or small foramen would provide a more reliable
landmark. This led us to analyze bilateral Infra-orbital foramina (IORB) in replacement of N-
perp for sagittal dimension assessment. To replace the A-point, the NPF candidate landmark
presented in section 3.2.2 was selected as it is located posterior to the maxillary central
incisors. IORB has been used to analyse skeletal maxillary changes in a previous maxillary
expansion study 34. It is situated several millimeters apical to the roots of upper premolars
bilaterally and unlikely to be influenced by orthodontic tooth movement 112. An anatomical
study found the IORB to be located at a mean distance of 26 mm away from the mid-sagittal
plane of the skull 113. One previous study has also reported high intra-examiner reliability and
low measurement errors (< 0.8 mm mean variability) for the infra-orbital foramen (IORB) 96.
Collectively, the left IORB, right IORB, and Mid.NPF, together were the candidate 3-D
landmarks used for frontal plane construction.
3.2.5 Treatment Landmarks
Based on two previous studies 34,96, a collection of relevant 3-D landmarks have been
reported with low identification errors (< 1.4 mm mean variability), and high intra-examiner
reliability (ICC > 0.90). These existing landmarks will serve as treatment landmarks, namely,
mental foramen, root apex, and alveolar bone of the upper first molar, lower first molar, and
upper first premolar teeth as reported by Lagravere et al 34.
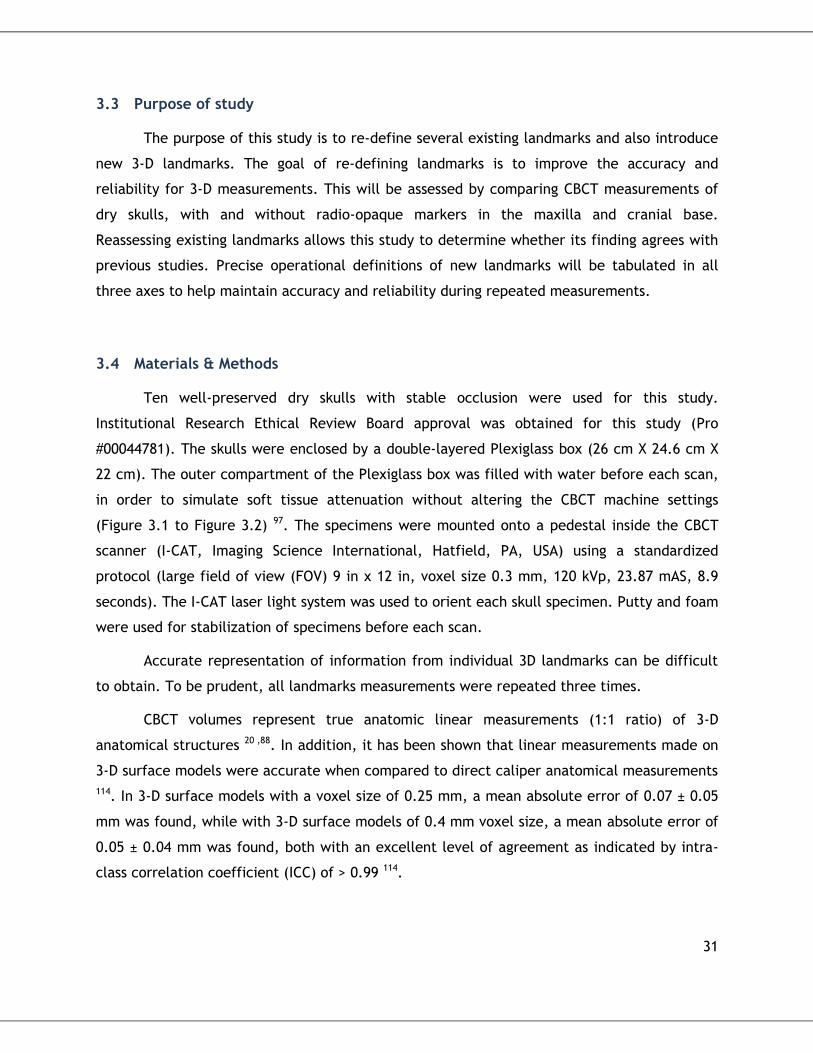
31
3.3 Purpose of study
The purpose of this study is to re-define several existing landmarks and also introduce
new 3-D landmarks. The goal of re-defining landmarks is to improve the accuracy and
reliability for 3-D measurements. This will be assessed by comparing CBCT measurements of
dry skulls, with and without radio-opaque markers in the maxilla and cranial base.
Reassessing existing landmarks allows this study to determine whether its finding agrees with
previous studies. Precise operational definitions of new landmarks will be tabulated in all
three axes to help maintain accuracy and reliability during repeated measurements.
3.4 Materials & Methods
Ten well-preserved dry skulls with stable occlusion were used for this study.
Institutional Research Ethical Review Board approval was obtained for this study (Pro
#00044781). The skulls were enclosed by a double-layered Plexiglass box (26 cm X 24.6 cm X
22 cm). The outer compartment of the Plexiglass box was filled with water before each scan,
in order to simulate soft tissue attenuation without altering the CBCT machine settings
(Figure 3.1 to Figure 3.2) 97. The specimens were mounted onto a pedestal inside the CBCT
scanner (I-CAT, Imaging Science International, Hatfield, PA, USA) using a standardized
protocol (large field of view (FOV) 9 in x 12 in, voxel size 0.3 mm, 120 kVp, 23.87 mAS, 8.9
seconds). The I-CAT laser light system was used to orient each skull specimen. Putty and foam
were used for stabilization of specimens before each scan.
Accurate representation of information from individual 3D landmarks can be difficult
to obtain. To be prudent, all landmarks measurements were repeated three times.
CBCT volumes represent true anatomic linear measurements (1:1 ratio) of 3-D
anatomical structures 20 ,88. In addition, it has been shown that linear measurements made on
3-D surface models were accurate when compared to direct caliper anatomical measurements
114. In 3-D surface models with a voxel size of 0.25 mm, a mean absolute error of 0.07 ± 0.05
mm was found, while with 3-D surface models of 0.4 mm voxel size, a mean absolute error of
0.05 ± 0.04 mm was found, both with an excellent level of agreement as indicated by intra-
class correlation coefficient (ICC) of > 0.99 114.

32
Each dry skull was imaged twice using CBCT. No radiopaque markers were inserted at
this initial round of imaging. Then prior to the second round of imaging, multiple radiopaque
markers (Gutta Percha, Dentsply-Maillefer, Tulsa, OK) were carefully placed inside the skull,
to pinpoint the true exact location of each anatomical structure for subsequent analysis
(Figure 3.3 to Figure 3.4).
Figure 3.1: Dry Skull Specimen enclosed by Plexiglass mounted on CBCT machine
Figure 3.2: Double-layered Plexiglass box (Left), filled with water in the external layer (Right).

33
Figure 3.3: Example of a Dry skull with Gutta Percha markers
Figure 3.4: Dry skull with Gutta Percha markers inside Plexiglass box (Left), CBCT scan (Right).
Nasopalatine (NPF) a.k.a. Incisive foramen
Greater palatine (GPF) foramen Foramen Ovale Foramen Spinosum

34
A total of twenty six sets of anatomic landmarks were investigated, including: 2
singular and 5 paired landmarks in the Cranial base, 4 pairs in the maxillary and mandibular
jaws, 5 pairs of dental crown, 5 pairs of root apex, and 5 pairs of alveolar bone landmarks.
All CBCT scans were exported as DICOM files (Digital Imaging and Communications in
Medicine), and subsequently loaded into the AVIZO version 8.0 software for analysis
(Visualization Sciences Group, Burlington, MA, USA). A Cartesian coordinate system was used
for each CBCT volume, with the origin of the x,y,z axis determined at the time of scan.
The CBCT volumes were viewed in three planes: the x-y axial (right-left), x-z coronal
(superior-inferior), and y-z sagittal (anterior-posterior). The principal investigator marked
each landmark in the AVIZO software using virtual sphere markers of 0.20 mm diameter. The
center of the virtual marker was used to determine the position of the landmark in this
software; hence the marker size did not affect the position of the landmark. Each CBCT was
first viewed in the most appropriate planar view (in the "Special note" column in Table 3-1 to
Table 3-3), then adjusted in each of the remaining planar views.
To assess intra-examiner reliability, three independent repeated measurements were
performed on CBCT images without Gutta percha markers, and each measurement were taken
at least 5 days apart. Each volume were identified by code and randomized in order to reduce
examiner bias.
To assess the identification accuracy of the 3-D anatomic landmarks, the dry skull
CBCT volumes with Gutta percha markers, were read by the principal investigator once. Then
readings from one randomly selected reading of the CBCT images without Gutta percha
markers were compared to the readings of CBCT images with Gutta percha. Since the skulls
cannot be oriented in the exact position in the CBCT machine (while imaged without Gutta
percha and with Gutta percha), the x,y,z landmark coordinates of CBCT volumes taken at the
two time-points could not be directly compared. Therefore, linear distances between the 3-D
coordinates were measured using the following Euclidean distance formula:
.
With this formula, d represented the distance (mm) between two anatomic landmarks,
while (X1, Y1, Z1) and (X2, Y2, Z2) are the respective coordinates of any two given landmarks of
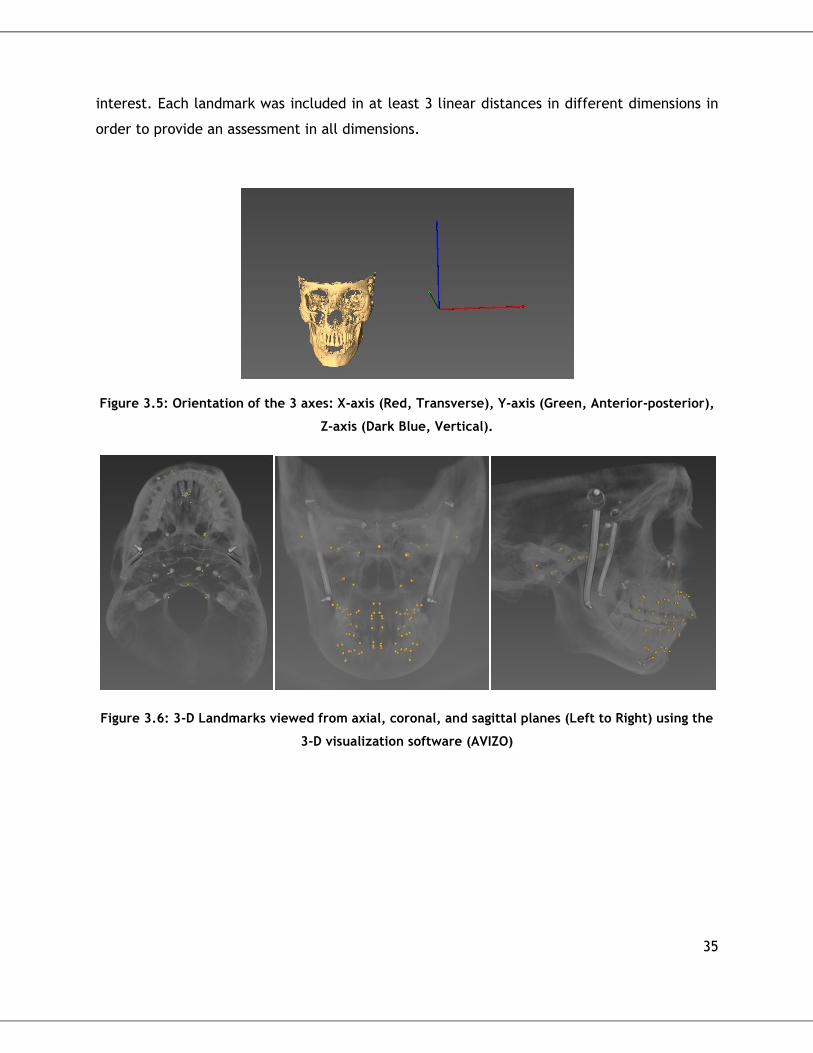
35
interest. Each landmark was included in at least 3 linear distances in different dimensions in
order to provide an assessment in all dimensions.
Figure 3.5: Orientation of the 3 axes: X-axis (Red, Transverse), Y-axis (Green, Anterior-posterior),
Z-axis (Dark Blue, Vertical).
Figure 3.6: 3-D Landmarks viewed from axial, coronal, and sagittal planes (Left to Right) using the
3-D visualization software (AVIZO)

36
Table 3-1: 3-D Maxilla-mandibular skeletal landmark definitions
Maxilla-Mandibular Skeletal Landmarks
Landmarks Special
Note
Axial view (XY) Coronal view (XZ) Sagittal view (YZ)
Greater
Palatine
Foramina
(GPF.L&R )
First use
Coronal
view. Find
orifice at
level of the
nasal floor.
Center-most
Inferior-Center-most
Center-most
Anterior-most
Orifice of the
Infraorbital
Foramina
(IORB.L&R )
First use
Axial &
Coronal
view. Find
orifice along
the canal.
Center-most
Center-most
Anterior-Center-most
Nasopalatine
(Incisive)
Foramina
(NPF.L&R )
First use
Axial view.
Mark most
concave
bony
cortical rims
for both
L&R halves.
Concave, Internal
& Center-Most
Concave, Internal &
Center-Most
Lateral-most Internal
Cortical Border
Mental
Foramina
(MENT.L&R )
First use
Coronal
view to find
middle
slice. Then
use Axial.
Center-most
Central-Lateral-most
Central-Lateral-most

37
Table 3-2: 3-D Cranial base skeletal landmark definitions
Cranial Base Skeletal Landmarks
Landmarks Special
Note
Axial view (XY) Coronal view (XZ) Sagittal view (YZ)
Crista Galli (CG) First use
Axial view,
then
Coronal.
Superior-most Tip
Center-most Tip
Center-most Tip
Foramina Ovale
(OVAL.L&R )
First use
Axial view
then
Coronal.
Center-most
Center-most
Center-most
Foramina
Spinosum
(SPIN.L&R )
First use
Axial view.
Guide using
Mandibular
condyles.
Center-most
Center-most
Center-most
Mesial-most
point of Dorsum
Foramen
Magnum (MDFM
a.k.a. Basion)
when left + right
bony cortices
first join
First use
Sagittal,
then Axial.
Find Mesial-
Inferior
most sharp
point
(Basion).
Mesial-Inferior-
Posterior-most
Bony Cortex
Inferior-Center-most
Inferior-Posterior-most

38
Posterior Vidian
Canals
(PVID.L&R )
First use
Axial then
Coronal.
Use OVAL
and SPIN as
guides.
Posterior-most
Center-most
Posterior-most
Hypoglossal
Canals
(HYPO.L&R )
First use
Coronal
view. Find
the Medial-
most Orifice
openings.
Medial-Center-
most
Center-most
Medial-Center-most
External
Auditory
Meatus (EAM.L)
(Bony portion)
First use
Coronal
view.
Center-most
Center-most
Center-most
External
Auditory
Meatus (EAM.R)
First use
Coronal
view.
Center-most
Center-most
Center-most

39
Table 3-3: 3-D Dental Root (PULP, APEX, AVBN) landmark definitions
Landmarks Axial (XY)
Definition
Landmarks Axial (XY)
Definition
Mesio-Buccal
Molar APEX Tip
Upper & Lower
Center-most-Tip
Molar PULP
(Buccal-Mesial Tip
of Pulp Horn)
Upper & Lower
Center-most-Tip
Buccal Alveolar
Cortical Bone of
Molar (AVBN)
Upper & Lower
Exact level with APEX,
along imaginary line
parallel to root canal
and center of root apex
Buccal Root
Premolar APEX
Tip
Upper only
Center-most-Tip
Premolar PULP
(Buccal Tip of
Pulp Horn)
Upper only Center-most-Tip
Buccal Alveolar
Cortical Bone of
Premolar (AVBN)
Upper only
Exact level with APEX,
along imaginary line
parallel to root canal
and center of root apex
APEX.16 APEX.36
AVBN.16 AVBN.36
PULP.16 PULP.36
APEX.14 + APEX.24
AVBN.14 + AVBN.24
PULP.14 + PULP.24

40
Canine APEX Tip
Upper & Lower
Center-most-Tip
Canine PULP
(Buccal Tip of
Pulp Horn )
Upper & Lower
Canine/Premolar Center-most-Tip
Buccal Alveolar
Cortical Bone of
Canine (AVBN)
(Upper & Lower)
Exact level with APEX,
along imaginary line
parallel to root canal
and center of root apex
APEX.13 APEX.33
AVBN.13 AVBN.33
PULP.33 PULP.13

41
3.5 Plane construction
Given the coordinates of three reference landmarks for a plane, 3-D visualization
software can compute the plane. But entering the three-point coordinates usually is a time-
consuming repetitive manual process. Similar argument applies to determining the
perpendicular distance. As a remedy, this study reproduced the mathematic procedure in
Microsoft Excel. This allows the reference planes and perpendicular distances to be
automatically calculated whenever the landmark coordinates were updated. Therefore, for
sake of completeness, the 3-D geometry used for plane construction is presented in this
section.
In 3-D geometry, three non-collinear points can be used to construct a reference
plane. This involved selection of three reference landmarks (P0, P1, P2) located as far apart as
possible within the head, along a plane with respect to the region of interest.
The general formula representing a plane is given by ax+by+cz+d=0. The values for a,
b, c, and d can be derived from coordinates of three points that lies on the plane 115.
Let the coordinates of the three landmarks (points) on the plane be denoted as:
P0= (x0, y0, z0), P1= (x1, y1, z1), P2= (x2, y2, z2).
Then:
a = (y1 - y0) x (z0 - z2) - (z1 - z0) x (y0 - y2)
b = (z1 - z0) x (x0 - x2) - (x1 - x0) x (z0 - z2)
c = (x1 - x0) x (y0 - y2) - (y1 - y0) x (x0 - x2)
Thus, d = - (ax0 + by0 + cz0)

42
3.5.1 Mid-Sagittal plane
The following figures illustrates the mid-sagittal plane constructed by the landmarks:
Mid.NPF (mid-point calculated from NPF.L and NPF.R), Mid.SPIN (mid-point calculated from
SPIN.L and SPIN.R), and MDFM. This allows assessment of transverse changes and symmetry
after maxillary expansion (Figure 3.7).
Figure 3.7: 3-D Mid-sagittal Reference Plane

43
3.5.2 Posterior Palatal plane
The following figure illustrates the posterior palatal plane constructed by the
landmarks: Mid.NPF, GPF.L, and GPF.R. This plane extended from anterior palate to posterior
palate, intersecting maxillary roots mid-way (Figure 3.8), and to allow assessment of bite
opening after maxillary expansion.
Figure 3.8: 3-D Posterior Palatal Reference Plane

44
3.5.3 Frontal plane
The following figure illustrates the frontal plane constructed by the landmarks:
Mid.NPF (mid-point calculated from NPF.L and NPF.R), IORB.R and IORB.L (Figure 3.9) to
allow assessment of antero-posterior dental changes after maxillary expansion.
Figure 3.9: 3-D Frontal Reference Plane

45
3.6 Finding orthogonal distances from landmark of interest to the reference plane
Once all final coordinates were obtained in AVIZO software, the dataset was exported
into a spreadsheet database (Excel 2007, Microsoft, Redmond, Wash). Using Excel, orthogonal
distances (shortest perpendicular, or normal distance) were calculated for each landmark
from its corresponding reference plane using this formula:
With this formula, D represented the signed perpendicular distance (mm) between the
3-D landmark of interest to the reference plane 115.
Note that orthogonal distances in each of the 3 dimensions, were assessed relative to
their individual reference planes, to isolate changes in the particular dimension of interest.
For example, transverse orthogonal changes were all measured with respect to the Mid-
sagittal plane, and vertical orthogonal changes were all measured with respect to the Palatal
plane.
3.7 Statistical analysis
The IBM SPSS statistical software was used for statistical data analysis (SPSS Statistics
for Windows, Version 22.0. Armonk, NY).
3.7.1 Accuracy for 3-D landmarks
Agreement for accuracy was assessed using Intra-class Correlation Coefficient (ICC), in
order to measure the level of agreement of CBCT measurements between the skull without
gutta percha compared to the skull with gutta percha. The two-way mixed model, single
measures with consistency was used, to ensure consistency in one rater's individual
measurements while the subjects were chosen randomly. The ICC values were interpreted as
per Portney and Watkins' recommendations, for all three axes. The absolute mean
measurement error differences (in mm) were also calculated for all landmarks in all three
axes in order to assess landmark accuracy.

46
Table 3-4: Portney and Watkins' ICC recommendation
ICC > 0.90 Excellent agreement
0.75 < ICC < 0.89 Good agreement
0.51 < ICC < 0.74 Moderate agreement
ICC < 0.50 Poor agreement
3.7.2 Intra-examiner reliability for 3-D landmarks
Intra-examiner reliability was also assessed in the X, Y, Z axes, using Intra-class
Correlation Coefficient (ICC), to measure the agreement between the three repeated
measurements of skull without gutta percha by the principal investigator. ICC interpreted
based on the general recommendations of Portney and Watkins 116 in Table 3-4. The chosen
statistical model was a two-way mixed model, single measures with consistency, to ensure
consistency in one rater's individual measurements while the subjects were chosen randomly.
The absolute mean differences of each landmark (in millimeters) were also reported in
all three axes (x, y, and z) for each measurement to assess landmark dispersion between
measurements trials.
3.7.3 Intra-examiner reliability for reference plane construction
This was assessed by repeating the nine 3-D reference landmarks used for reference
plane construction, and measuring the mean differences for twenty treatment landmarks in
the X, Y, and Z axes (in millimeters).
3.8 Results
A summary of ease/difficulties encountered during landmark identification in each of
the 3 axes are presented in Table 3-5.

47
3.8.1 Intra-examiner reliability of 3-D landmarks
Using the determined 3-D landmark definitions, excellent agreement for intra-
examiner reliability with was found for all skeletal landmarks in the 3 axes as indicated by an
ICC ≥ 0.98. Excellent agreement was also found for all dental landmarks with ICC ≥ 0.98 in
both transverse and vertical (x- and z-axes), and ICC ≥ 0.99 in the sagittal (y-axis). The only
exception was AVBN.36 which showed ICC of 0.96 in the transverse (x-axis), still excellent
intra-examiner reliability.
Mean variability of ≤ 0.4 mm and ≤ 0.5 mm were found for all skeletal and dental
landmarks respectively (Appendix 1 & 2). Profile plots in all three axes are presented in
Appendix 5-7.
3.8.2 Accuracy of 3-D landmarks
Majority of investigated landmarks (22 of the 26 sets) showed excellent agreement
(ICC ≥ 0.92) for accuracy between true anatomical landmarks (with gutta-percha markers)
and those on skulls imaged without gutta percha markers (Table 3-6 to Table 3-8). IORB
showed good agreement (ICC 0.88 and 0.80) in the antero-posterior dimension, and excellent
agreement in the other two dimensions. NPF showed good agreement (ICC 0.87) in the
transverse dimension, and excellent agreement in the other two dimensions. HYPO and
AVBN.33 which showed moderate agreement in the antero-posterior dimension (ICC 0.65 and
0.60 respectively), and excellent agreement in the other two dimensions.
With the exception of two landmarks, almost all landmarks (24 of the 26 sets) showed
low mean identification errors ≤ 0.85 mm in all 3 axes. Hypoglossal (HYPO) canal landmark
was the main exception, with mean error of 1.28 mm in the antero-posterior and vertical
axes; hence it was no longer preferred or considered as a reference landmark. MENT showed
mean errors of ≤ 1.3 mm only in the antero-posterior direction, but only ≤ 0.55 mm and ≤
0.20 mm in the vertical and transverse respectively. MENT landmark was kept in the pool of
final landmarks, for its small amount of error in the vertical and transverse dimensions,
although it was not as accurate in the antero-posterior dimension.

48
Table 3-5: Ease of Identification of the investigated 3-D landmarks
Landmarks Definition Transverse Vertical Sagittal Reason
Cranial Base
1 SPIN.L&R Center of Foramen Spinosum
Simple Simple Difficult Small diameter, short canal simplified the identification
2 OVALE.L&R Center of Foramen Ovale Simple Difficult Difficult Large diameter, oval elongated foramen, made it difficult
3 PVID.L&R
Center point of the Posterior-most aspect of the Vidian Canal Foramen Orifice
Simple Simple Difficult
Small diameter, fairly straight canal with a horizontal canal orientation, but posterior-most 10 mm of the canal ended on a taper which made it difficult
4 MDFM
Mesial-most point on the Anterior-Inferior portion of Dorsum Foramen Magnum (corresponds to Basion)
Simple Simple Simple
Like 2-D Basion landmark, this point was easy to identify accurately and reliably.
5 CG Most Superior point of the Crista Galli
Simple Difficult Simple Sharp point, allows easy identification
6 EAM.L&R Center of the Bony portion of the External Auditory Canal
Difficult Difficult Difficult
Extremely large diameter, tortuous canal, bone blended with cartilage portion
7 HYPO.L&R
Center point of the Medial-most Endocranial Orifice Opening of the Hypoglossal Canal
Difficult Difficult Difficult
Tapered densely radiopaque Canal opening which made it difficult to identify
Maxilla
8 GPF.L&R
Center point of the Inferior-most level of the Greater Palatine Canal Foramen Orifice
Simple Simple Difficult Thin palatal bone, tougher to determine antero-posterior limit
9 NPF.L&R
Center point of the Mesial and Distal Halves of the Inferior-most level of the Nasopalatine/Incisive Canal Orifice (Oral aspect)
Simple Simple Difficult
Large diameter, with tapered exit into oral cavity, mild difficulty in delineating cortical bony limits
10 IORB.L&R
Center point of the Anterior-most level of the Infraorbital Canal Foramen Orifice
Difficult Difficult Simple
Most Anterior 15-20 mm of the Canal Orifice Tapers Obliquely in a Medial-Inferior direction.
11 PULP.(tooth) Tip of the Buccal-Mesial-most Pulp horn of the specified tooth
Simple Difficult Simple Tip was simple to identify
12 APEX.(tooth) Tip of the Buccal-Mesial-most Root Apex of the specified tooth
Simple Simple Simple Tip was simple to identify

49
Table 3-6: Accuracy of Cranial Base Landmarks, based on ICC and Mean Identification Errors
Cranial
Base
Landmarks
Transverse Vertical Antero-posterior
Transverse Vertical Antero-posterior
ICC (Intra-class Correlation Coefficient) Mean measurement errors ± SD (mm)
Mid.SPIN n/a † ≥ 0.99 ≥ 1.00 n/a
† ≤ 0.51 ± 0.3 ≤ 0.50 ± 0.3
SPIN ≥ 0.99 ≥ 0.99 ≥ 0.97 ≤ 0.55 ± 0.3 ≤ 0.65 ± 0.3 ≤ 0.85± 0.8
Mid.PVID n/a † ≥ 0.99 ≥ 1.00 n/a
† ≤ 0.40 ± 0.5 ≤ 0.51 ± 0.3
PVID ≥ 1.00 ≥ 0.99 ≥ 1.00 ≤ 0.30 ± 0.3 ≤ 0.50 ± 0.5 ≤ 0.65 ± 0.5
Mid.OVAL n/a † ≥ 1.00 ≥ 0.98 n/a
† ≤ 0.40 ± 0.2 ≤ 0.85 ± 0.8
OVAL ≥ 0.99 ≥ 0.99 ≥ 0.98 ≤ 0.50 ± 0.4 ≤ 0.55 ± 0.4 ≤ 0.81± 0.8
CG n/a † ≥ 0.99 ≥ 0.99 n/a
† ≤ 0.75 ± 0.5 ≤ 0.55 ± 0.5
MDFM n/a † ≥ 1.00 ≥ 1.00 n/a
† ≤ 0.49 ± 0.3 ≤ 0.85 ± 0.5
EAM ≥ 0.98 ≥ 0.99 ≥ 0.99 ≤ 0.70 ± 0.4 ≤ 0.55 ± 0.4 ≤ 0.75 ± 0.9
HYPO ≥ 0.95 ≥ 0.98 ≥ 0.65 ≤ 0.51 ± 0.4 ≤ 1.10 ± 1.0 ≤ 1.28 ± 1.5
† n/a: not applicable in the transverse dimension, since this is a singular or midline landmark.
13 AVBN.(tooth)
Point on the Buccal Cortical Plate that aligns parallel to and at the same level as the specified root apex of the involved tooth
Simple Difficult Difficult
In the absence of reference based on the root apex tip, there is no vertical or antero-posterior stop to localize this point
Mandible
14 MENT.L&R Center point of the Lateral-most Foramen Orifice of the Mental Canal
Simple Difficult Difficult
Large diameter, broadly radiopaque tapered opening, made it difficult
15 PULP.(tooth) Tip of the Mesial- Buccal-most Pulp horn of the specified tooth
Simple Simple Simple Tip was simple to identify
16 APEX.(tooth) Tip of the Mesial-Buccal-most Root Apex of the specified tooth
Simple Simple Simple Tip was simple to identify
17 AVBN.(tooth)
Point on the Buccal Cortical Plate that aligns parallel and at the same level as the specified root apex of the involved tooth
Simple Difficult Difficult
In the absence of reference based on the root apex tip, there is no vertical or antero-posterior stop to localize this point

50
Table 3-7: Accuracy of Maxillo-mandibular Landmarks, based on ICC and Mean Identification Errors
Skeletal
Max/Mand
Landmarks
Transverse Vertical Antero-posterior
Transverse Vertical Antero-posterior
ICC (Intra-class Correlation Coefficient) Mean measurement errors ± SD (mm)
NPF ≥ 0.87 ≥ 0.99 ≥ 0.92 ≤ 0.52 ± 0.3 ≤ 0.55 ± 0.4 ≤ 0.85 ± 0.5
GPF ≥ 0.98 ≥ 0.99 ≥ 0.99 ≤ 0.52 ± 0.3 ≤ 0.51 ± 0.4 ≤ 0.65 ± 0.5
IORB ≥ 0.96 ≥ 0.99 ≥ 0.88 ≤ 0.69 ± 0.5 ≤ 0.55 ± 0.3 ≤ 0.85 ± 0.5
MENT ≥ 1.00 ≥ 0.99 ≥ 0.94 ≤ 0.20 ± 0.2 ≤ 0.55 ± 0.3 ≤ 1.30 ± 1.3
Table 3-8. Accuracy of Dental Landmarks, based on ICC and Mean Identification Errors.
Dental
Max/Mand
Landmarks
Transverse Vertical Antero-posterior
Transverse Vertical Antero-posterior
ICC (Intra-class Correlation Coefficient) Mean measurement errors ± SD (mm)
PULP ≥ 0.97 ≥ 0.99 ≥ 0.90 ≤ 0.30 ± 0.3 ≤ 0.75 ± 0.4 ≤ 0.50 ± 0.5
APEX ≥ 0.95 ≥ 0.99 ≥ 0.80 ≤ 0.50 ± 0.4 ≤ 0.70 ± 0.4 ≤ 0.60 ± 0.5
AVBN ≥ 0.92 ≥ 0.70 ≥ 0.60 ≤ 0.70 ± 0.5 ≤ 0.90 ± 0.7 ≤ 0.90 ± 0.8

51
3.8.3 Intra-examiner reliability of 3-D reference plane construction
Based on twenty selected landmarks, low mean errors were found for the orthogonal
distances to the averaged reference planes constructed by repeatedly locating the reference
landmarks three times (Table 3-9). The mean errors were ≤ 0.55 mm, ≤ 0.35 mm, and ≤ 0.45
mm, in the Mid-sagittal plane (Transverse orthogonal distances), Palatal plane (Vertical
orthogonal distances), and Frontal plane (Antero-posterior orthogonal distances) respectively.
This meant that the reference planes were suitable for clinical use. Note that each of the
planes were used individually based on the dimension of interest. For example, Transverse
The following diagrams illustrate the directions and magnitude of plane deviation
induced by imposing an artificial 0.2 mm of error into the reference landmarks responsible for
each plane (Figure 3.10 - Figure 3.12).
Figure 3.10: Mid-sagittal planes with 0.2 mm imposed errors in X-axis of
A) MDFM and Mid.SPIN (Left Picture), B) MDFM and Mid.NPF (Right picture).

52
Figure 3.11: Posterior Palatal planes with 0.2 mm imposed error in Z-axis of GPF.L&R and Mid.NPF
Figure 3.12: Frontal planes with 0.2 mm imposed error in Y-axis of IORB.L&R and Mid.NPF

53
Table 3-9: Mean errors (in mm) of orthogonal distances, from 3 repeated reference plane
constructions for 20 landmarks.
Transverse Vertical Antero-posterior
Landmark Mean ± SD
(mm)
Max
(mm)
Min
(mm)
Mean ± SD
(mm)
Max
(mm)
Min
(mm)
Mean ± SD
(mm)
Max
(mm)
Min
(mm)
PULP.16 0.19 ± 0.15 0.38 0.01 0.12 ± 0.20 0.65 0.01 0.20 ± 0.12 0.38 0.05
PULP.26 0.20 ± 0.17 0.51 0.04 0.12 ± 0.20 0.63 0.01 0.20 ± 0.12 0.37 0.05
PULP.46 0.35 ± 0.27 0.69 0.02 0.13 ± 0.21 0.67 0.01 0.29 ± 0.17 0.51 0.07
PULP.36 0.34 ± 0.28 0.82 0.03 0.12 ± 0.21 0.65 0.01 0.29 ± 0.17 0.48 0.06
APEX.16 0.10 ± 0.08 0.23 0.01 0.14 ± 0.23 0.73 0.02 0.14 ± 0.10 0.30 0.04
APEX.26 0.14 ± 0.11 0.37 0.01 0.13 ± 0.21 0.67 0.01 0.14 ± 0.10 0.29 0.04
APEX.46 0.44 ± 0.36 0.91 0.02 0.14 ± 0.22 0.70 0.02 0.35 ± 0.21 0.64 0.08
APEX.36 0.45 ± 0.37 0.99 0.02 0.13 ± 0.21 0.64 0.01 0.36 ± 0.21 0.62 0.08
OVAL.R 0.12 ± 0.09 0.26 0.01 0.16 ± 0.24 0.77 0.03 0.15 ± 0.07 0.25 0.04
OVAL.L 0.12 ± 0.10 0.33 0.01 0.17 ± 0.26 0.84 0.03 0.15 ± 0.08 0.27 0.04
PVID.R 0.11 ± 0.09 0.28 0.01 0.26 ± 0.47 1.50 0.01 0.14 ± 0.07 0.25 0.04
PVID.L 0.12 ± 0.10 0.33 0.03 0.27 ± 0.49 1.57 0.01 0.15 ± 0.08 0.29 0.04
MENT.R 0.53 ± 0.44 1.19 0.01 0.18 ± 0.29 0.91 0.01 0.44 ± 0.25 0.76 0.10
MENT.L 0.54 ± 0.46 1.32 0.02 0.18 ± 0.29 0.90 0.01 0.44 ± 0.25 0.75 0.10
IORB.R 0.25 ± 0.18 0.50 0.04 0.17 ± 0.29 0.94 0.04 n/a †
IORB.L 0.23 ± 0.18 0.48 0.02 0.17 ± 0.27 0.88 0.03 n/a †
GPF.R 0.08 ± 0.06 0.22 0.01 n/a † 0.05 ± 0.03 0.10 0.01
GPF.L 0.09 ± 0.07 0.22 0.01 n/a † 0.05 ± 0.04 0.10 0.01
MID.SPIN n/a † 0.33 ± 0.27 0.84 0.02 0.30 ± 0.39 1.32 0.03
MDFM n/a † n/a
† 0.24 ± 0.14 0.51 0.08
Mid.NPF n/a † n/a
† n/a †
† n/a: not applicable, since this landmark was used for plane construction.

54
3.9 Discussion
3.9.1 Overview
The purpose of this study was to select suitable landmarks for assessment of
transverse, vertical, and antero-posterior changes after rapid maxillary expansion therapy.
Based on ten dry human skulls, almost all investigated landmarks (24 out of 26 sets) proved to
be suitable for clinical use based on an ICC of > 0.92 for accuracy. HYPO and AVBN.33 were
the two exceptions in the antero-posterior dimension, showing moderate agreement in the y-
axis (ICC 0.65 and 0.60 respectively), and excellent agreement in the other two dimensions.
Based on previous studies, landmarks with mean identification errors < 1 mm are
considered precise and not clinically significant, those between 1.5 mm - 2.0 mm are
considered clinically significant and should be used with caution; errors over 2.5 mm are
considered inappropriate 97,101. In general, deviations in measurements under 1.5 mm is not
considered to have a significant impact on clinical decisions 96.
With the exception of two landmarks, almost all landmarks (24 of the 26 sets) showed
low mean identification errors of ≤ 0.85 mm in all 3 axes. Hypoglossal (HYPO) canal landmark
was the main exception, with mean error of 1.28 mm in the antero-posterior and vertical
axes; hence it was no longer preferred or considered in the pool of reference landmarks.
MENT showed mean errors of ≤ 1.3 mm only in the antero-posterior direction, but only
≤ 0.55 mm and ≤ 0.20 mm in the vertical and transverse respectively. MENT landmark was
kept in the pool of final landmarks, for its small amount of error in the vertical and transverse
dimensions, although it was not as accurate in the antero-posterior dimension. Furthermore,
MENT has been used in previous studies, and has been found to more reliable and accurate
than the Lingula (triangular projection immediately in front of the mandibular foramen) for
evaluation of mandibular changes 96.
3.9.2 Reference landmarks used for Plane construction
From this study’s observations, the preferred landmarks for mid-sagittal plane were:
Mid.Nasopalatine Foramen (Mid.NPF), Mesial Dorsal Foramen Magnum (MDFM), and Foramen
Spinosum (SPIN). The preferred landmarks for frontal plane were: IORB left & right, and

55
Mid.NPF. The preferred landmarks for palatal plane were: GPF left & right, and Mid.NPF.
These landmarks and combinations, proved to be comparatively superior to other options.
All the remaining candidates including CG, Posterior Vidian canal (PVID), External
Auditory Meatus (EAM), and Foramen Ovale (OVAL) showed promising accuracy and reliability,
but they were not chosen due to their relative weaknesses.
Nasopalatine Foramen (NPF) & Mid.NPF
The Nasopalatine foramen (NPF or incisive foramen) has already been shown to be a
relatively stable area 80. In the transverse, NPF.L&R showed excellent intra-examiner
reliability (ICC >0.99), good agreement for accuracy (ICC of 0.87), with low mean
identification errors ≤ 0.55 mm. Its mid-point (Mid.NPF), i.e. mid-point of the left and right
NPF, was used to pinpoint the center of the wide NPF opening, which can be up to 6 mm 81.
The Mid.NPF (average of the left and right NPF) replaces the 2-D landmark Anterior Nasal
Spine (ANS), which has been used for midline definition 81.
NPF is an important landmark to represent how the mid-sagittal plane dissects the
anterior palate. Extension of the reference plane from posterior to anterior region of interest
(i.e. maxillary molar, premolar and canine teeth) will help reduce extrapolation errors. This
agrees with the established principle, discussed by Nagasaka et al 117 and Lagravere et al 95, of
choosing landmarks further spaced apart to reduce measurement errors during plane
construction.
In the vertical dimension, NPF proved to have comparable accuracy and reliability as
SPIN. Mean identification errors were ≤ 0.55 mm for NPF, but ≤ 0.65 for SPIN. Both NPF and
SPIN showed excellent intra-examiner reliability (ICC > 0.99). These results justified the
choice of Mid.NPF for the palatal plane construction in combination with GPF.L&R, instead of
using Mid.SPIN.
In the antero-posterior dimension, NPF also showed excellent intra-examiner
reliability and agreement for accuracy (ICC > 0.92) and low mean identification errors ≤ 0.85
mm. Its stable and distinct location in the anterior palate justified the choice of Mid.NPF for
frontal plane construction in combination with IORB.L&R.

56
Foramen Spinosum (SPIN) & Mid.SPIN
Foramen Spinosum (SPIN) and Mid.SPIN (a.k.a. ELSA 95) was chosen based on several
factors. It is a blunt-ended and short canal of only 2-3 mm. It has consistent position along
the mid-sagittal plane, and its cross-section is consistently rounded and small (2.4x2.0 mm)
118. According to Berge and Bergman, SPIN was never absent bilaterally (0%, or 0/92) and
found to be equal-sized bilaterally (within 0.5 mm) in large majority of case (84%, 77/92)118.
Marmary et al also advocated using Mid.SPIN as a perpendicular bisector to produce an
accurate midline which was relatively unaffected by environmental factors 98,119. In
agreement with a past 2-D cephalometric study by Williamson et al, SPIN was found to have
the smallest identification errors in the vertical and horizontal dimensions as explained by its
narrow diameter 120. In this study, SPIN had ≤ 0.55 mm mean error in the transverse, and
Mid.SPIN had ≤ 0.51 mm mean errors in the vertical and antero-posterior dimensions.
Overall, this makes SPIN and Mid.SPIN a valuable 3-D reference landmark for future
clinical analyses. This observation aligns with several other previous 3-D studies, including
Lagravere et al, Tausche et al, and Hansen et al 34,37,39.
Mesial Dorsal Foramen Magnum (MDFM)
Mesial Dorsal Foramen Magnum (MDFM) showed excellent agreement for accuracy and
intra-examiner reliability (ICC >0.99) in this study. MDFM was chosen based on its ease of
identification and consistent position along the mid-sagittal plane. MDFM is analogous to the
widely used 2-D cephalometry landmark, Basion 121. Additionally, analogous to NPF being the
most anterior landmark within the set, MDFM is the most posterior. As mentioned previously,
this allows maximum posterior-anterior distance for reducing extrapolation errors 95.
IORB (Infra-orbital foramen) left & right
The left and right Infra-orbital landmarks (IORB.L&R) proved superior to other
candidates and were chosen for frontal plane construction, in combination with Mid.NPF.
Based on these ten dry skulls, the orientation of this plane tended to parallel mid-arch
maxillary teeth such as the first and second premolars and first molars. This was a best
attempt for measurement of antero-posterior movement of premolar and molar teeth after

57
maxillary expansion, although no attempts were made to account for the anterior-most or
posterior-most teeth (such as central incisors or second molars) owing to the natural Curve of
Spee found along the occlusal plane 122.
To construct an effective frontal plane, there needs to be 3+ reference landmarks
vertically aligned along a plane that would ideally parallel the long axis of the teeth to be
measured in order to reflect isolated antero-posterior changes. For the purpose of
orthodontics, the choice of MENT was not considered due to the likelihood of mandibular
deviation in posterior crossbite patients, and also because MENT proved to have mean
identification errors of between 0.75 mm to 1.3 mm. The used of CG in combination with
IORB or Mid.NPF could also be evaluated and compared with these results in a future study.
However CG was not used in this study because the superior aspect of its tip was marginally
just captured on this dry skull sample, and would likely be collimated off in CBCT scans on
young growing children seeking orthodontic treatment. The limitation of IORB is its densely
radiopaque tapering opening, making it difficult to mark its exact geometric center in the
three dimensions. However by using the specified 3-D definition of the landmark (Table 4.1-
4.4) and verifying the landmark from all planar views, good to excellent reliability and low
errors were found based on this study. Given the mentioned limitations, IORB.L&R and
Mid.NPF proved to serve as an effective frontal plane for assessment of anterior-posterior
changes limited to the premolar and first molar teeth.
Greater Palatine foramen (GPF) left & right
Greater palatine foramen (GPF) was another important landmark particularly for
constructing the palatal plane in this study. It is located on the horizontal plate of the palatal
bone. The greater palatine foramina (GPF) has been reported to maintain a set distance from
to the posterior margin of the osseous palate by Serjen et al and Damgaard et al 123, and to
not change significantly with age. Antero-posterior growth of the palate is believed to take
place at the Transverse palatine suture (TPS), which is positioned anterior to the GPF.
Greater differential osseous growth occurs on the maxillary edge of the suture compared to
the palatine edge, and the GPF is reported to be located palatal and posterior to the
posterior-most erupted molar teeth 123,124. Studies generally report GPF to be located
posterior and palatal to the mid-palatal aspect of the upper third molar although locations

58
palatal to the region between the third and second molar have also been reported 125. Since
maxillary expansion appliances are attached to the region between first molars and first
premolars, the position of GPF is highly favorable in that it is unlikely to be influenced by
orthodontic movements of the posterior teeth, and be able to reflect the skeletal changes
experienced by this region 123.
There is an important point to note when using the GPF landmark. One is that the
foramen tapers into thin area of bone in the antero-posterior dimension when viewed from
the occlusal direction 125. This foramen is two-fold longer in the antero-posterior dimension
than the medial-lateral/transverse dimension, approximately 2x4 mm on average 118.
Therefore, it is critical to give priority to the Coronal view of the GPF, where its diameter is
only 2 mm wide, and where the bony nasal floor is present as a guide during the identification
process. Excellent agreement for intra-examiner reliability and accuracy (ICC > 0.98) was
found using this technique, and mean identification errors were all kept ≤ 0.65 ± 0.5 mm in
this research. Particularly in the vertical dimension, its low mean identification errors were
comparable to that of SPIN and Mid.SPIN; as well as showing excellent agreement for
accuracy and reliability as indicated by an ICC ≥ 0.99 in all dimensions.
Remaining candidate reference landmarks
The remaining sets of landmarks proved to be promising for plane construction, but
nonetheless were not selected due to their respective identification difficulty. These
remaining landmarks were: Posterior Vidian canal opening (PVID), External Auditory Meatus
(EAM), Foramen Ovale (OVAL), and Crista galli (CG).
The Posterior Vidian canal opening (PVID) landmark proved to be a satisfactory choice
in all dimensions and particularly in the transverse where mean errors were as low as ≤ 0.30
mm. However, two limitations were encountered from using PVID. One is the tapered
posterior opening instead of a blunt orifice 109, making the antero-posterior limit difficult to
delineate. Second is PVID’s close proximity to similar sized foramen such as the
Palatosphenoidal canal 126 from the coronal view, making it difficult to distinguish the two.
Consequently, Mid.SPIN, with the more distinctive anatomical features, was chosen instead.
Pinpointing the exact geometric center was difficult and time-consuming for the EAM
since it had a long tortuous canal with an oval cylindrical cross-section of approximately 5 to

59
9 mm 127. Difficulties in identifying Porion, the 2-D analogous landmark to EAM, has also been
widely reported in past literature 128,129.
Foramen ovale (OVAL) was another landmark with relatively large cross-section area,
around 7 mm x 3.5 mm on average 118. Its elongated antero-posterior dimension may have
contributed to its mean error of ~0.85 mm, while errors were only 0.4 mm - 0.55 mm in the
other two dimensions. Calculation of Mid.OVAL by taking the average of bilateral OVAL did
not reduce the mean errors recorded in the antero-posterior dimension. Furthermore,
bilateral OVAL landmarks were reported to be varied in size (>0.5 mm difference), in 56/96
(58%) of subjects according to Berge and Bergeman 118.
Crista galli (CG) was a promising landmark, and one used widely in 2-D Postero-
anterior cephalometry. However, it was less preferred in this study due to its likelihood of
being collimated out of view during CBCT scan. This was due to a medical decision to reduce
radiation exposure to young growing children.
3.9.3 Reference plane construction
Based on three repeatedly constructed reference planes for 10 dry skulls as assessed
using twenty selected landmarks, low mean errors were found in all 3 dimensions (Table 4.8).
The mean errors were ≤ 0.55 mm, ≤ 0.35 mm, and ≤ 0.45 mm, in the Mid-sagittal plane
(transverse orthogonal distances), Palatal plane (vertical orthogonal distances), and Frontal
plane (antero-posterior orthogonal distances) respectively.
The small mean errors combined with visual verification of the planes, demonstrated
that these reference landmarks can be used for plane construction in future clinical studies
involving maxillary expansion. It should be noted that upon imposing an artificial 0.2 mm of
error into the reference landmarks responsible for each plane, the errors did increase but not
directly proportional. Errors were observed to cancel each other out when one landmark was
marked closer to origin while the second landmark was marked further from origin. This
finding is in agreement with Lagravere et al who commented on the same observation 95.
Further analysis was performed in attempt to observe the mean errors of orthogonal
distances from 3 repeated treatment landmark measurements against an averaged reference

60
plane. In this test case, the reference planes were constructed based on the average values
of three repeated reference landmark measurements.
Almost all measurements (22 out of 26 sets of landmarks) showed ≤ 0.35 mm, ≤ 0.85
mm, and ≤ 0.85 mm of mean errors (not clinically significant) for the Transverse, Vertical,
and Antero-posterior orthogonal distances, respectively.
The four exceptions included the antero-posterior orthogonal distances for Posterior
Vidian Canal (PVID) and Foramen Ovale (OVAL) which showed mean errors ≤ 1.25 mm; and
vertical orthogonal distances for IORB.L and APEX.16 with mean error ≤ 1.24 mm and ≤ 1.10
mm, respectively. These 4 landmarks still showed ≤ 0.35 mm error in the Transverse
dimension, and ≤ 0.85 mm in the other dimension (not clinically significant). Nonetheless,
these investigated landmarks all showed mean identification errors under 1.5 mm and are not
likely to have clinical implications. Hence, these were still kept in the pool of candidate
landmarks.
Defining 3D planes can be difficult by itself due to the high degree of freedom in all 3
axes. This study’s premise is to have an easily repeatable process for measuring skeletal and
dental changes over time. Using this mathematical procedure, given the same reference
landmark coordinate input, the computed plane will always be the same. This is a great
improvement to earlier methods that requires the examiner to manually draw the mid-sagittal
plane, as it will eliminate any human error that process may introduce. It should be noted
that this mathematically constructed plane is still susceptible to the measurement errors
from the individual reference landmarks itself.
3.9.4 Dental Landmarks for Treatment Evaluation
Root Apices
Root Apices (APEX) showed good-to-excellent agreement for accuracy and intra-
examiner reliability in all dimensions (ICC > 0.75). Mean identification errors were kept under
≤ 0.7 mm in all dimensions, which was still highly acceptable. The larger observed
identification errors at the APEX compared to the pulp horn may result from the fact that the
root apex was less sharply pointed in comparison. More pointed root apices, such as the
61
mesial-buccal root of the maxillary molar, did show slightly less identification errors
compared to the broader singular roots of the canines in this study.
Buccal Alveolar Bone at the level of Root Apex (AVBN)
Buccal alveolar bone landmarks (AVBN) showed good-to-excellent agreement for
accuracy and intra-examiner reliability in the transverse and vertical dimensions (ICC > 0.75)
in this study. It was helpful to use the guiding line to match the root apex level and ensure
that it’s parallel to the root canal. Without this guiding line, there would be multiple possible
landmark placements, particularly depending on the curvature or contours of the buccal bony
plate.
It should be noted that the AVBN landmark shall not be used for any antero-posterior
measurements since only moderate agreement for accuracy (ICC ≥ 0.60) was found, and there
is no anatomically distinct antero-posterior feature for repeatable identification. Use of this
guiding line is possibly the best guide available at this point in time.
Pulp Horn
Tip of Pulp horn (PULP) showed excellent agreement for accuracy and intra-examiner
reliability in all three dimensions (ICC > 0.90). Identification error in the vertical direction
was slightly larger, being ≤ 0.75 mm. Nonetheless, accuracy in this dimension was still ≤ 0.85
mm as with the other landmarks in this study. Mean identification errors was one of the
lowest in the transverse dimension (≤ 0.30 mm) and antero-posterior (≤ 0.5 mm) for the
maxillary and mandibular molars, maxillary premolar and canine teeth evaluated in this
study.
3.9.5 Limitations
Numerous factors need to be considered when interpreting these results. Firstly, the
assessment of reference landmark accuracy and intra-examiner reliability was performed on
dry skulls. As pointed out by Periago et al 130, the presence of nerves or other soft tissue
structures inside the foramina may affect the accuracy of landmark identification. In attempt

62
to mimic the soft tissues around the skull, the principal investigator incorporated a Plexiglass
box filled with water around every skull prior to the CBCT scan, in efforts to reduce possible
error.
Secondly, the number of dry skull specimens used in this study was 10. As
recommended by Springate 131, increasing the number of specimens to 25 to 30 would reduce
sampling errors for the statistical analyses in such types of study.
Third, the bone quality and scan quality were factors not fully within our control. The
voxel size was 0.3 mm in this study, and this placed a limit to the accuracy level possible.
During dry skull selection, efforts were made to check for a full healthy posterior dentition
and intact bony structures. Furthermore, the dry skulls were not all collected from adolescent
age group which could be commonly seen in subjects requesting for orthodontic treatment.
The size and location of the foramina may show slight variation in dry skulls of the mid-ages.
Three-dimension visualization software such as the one used by this study (AVIZO)
requires substantial training and patience to operate in general. Locating a 3-D landmark
accurately requires constantly switching between the 3 axial planes on the monitor and
iterating through hundreds of orthogonal slices. This may change in the near future when 3-D
monitors become more commonly available.
3.9.6 Summary & Conclusion
Reference landmarks
Accuracy: Nearly all investigated landmarks (24 out of 26 sets) showed low mean
errors (≤ 0.85 mm) and excellent agreement (ICC > 0.92), in all 3 axes, allowing them
to be used in future clinical studies.
Intra-examiner reliability: All 26 sets of landmarks showed excellent intra-examiner
reliability (ICC > 0.96), with low mean errors of ≤ 0.5 mm, in all 3 axes.
Landmarks used for reference plane construction
The preferred landmarks for mid-sagittal plane were: Mid.Nasopalatine Foramen
(Mid.NPF), Mesial Dorsal Foramen Magnum (MDFM), and Foramen Spinosum (SPIN).

63
The preferred landmarks for frontal plane were: Infra-orbital foramina (IORB) left &
right, and Mid.NPF.
The preferred landmarks for palatal plane were: Greater palatine foramina (GPF) left
& right, and Mid.NPF.
These combinations and landmarks, proved to be comparatively superior to other
options.
Based on three repeatedly constructed reference planes for 10 dry skulls as assessed
using twenty selected landmarks, low mean errors (≤ 0.55 mm) were found in all 3
dimensions.
Further analysis to observe the mean errors of orthogonal distances from 3 repeated
treatment landmark measurements against an averaged reference plane, also showed
low mean errors (≤ 0.85 mm) in all 3 dimensions.
Measurement errors ≤ 1.5 mm are not likely to have clinical implications from past
literature.
Treatment Landmarks
All teeth root apices (tip), pulp horn (tip), and alveolar bone landmarks (AVBN)
showed good to excellent reliability and accuracy particularly in the transverse and
vertical dimension; and will be used in the future maxillary expansion assessment
study.

64
3.10 References
15. Sievers MM, Larson BE, Gaillard PR, Wey A. Asymmetry assessment using cone beam CT: A Class I and Class II patient comparison. The Angle Orthodontist 2011;82:410-417.
20. Lagravère MO, Carey J, Toogood RW, Major PW. Three-dimensional accuracy of measurements made with software on cone-beam computed tomography images. American Journal of Orthodontics and Dentofacial Orthopedics 2008;134:112-116.
24. Lagravère MO, Gordon JM, Guedes IH, Flores-Mir C, Carey JP, Heo G et al. Reliability of traditional cephalometric landmarks as seen in three-dimensional analysis in maxillary expansion treatments. The Angle orthodontist 2009;79:1047-1056.
26. Lee K-M, Hwang H-S, Cho J-H. Comparison of transverse analysis between posteroanterior cephalogram and cone-beam computed tomography. Angle Orthodontist 2013;84:715-719.
32. Oz U, Orhan K, Abe N. Comparison of linear and angular measurements using two-dimensional conventional methods and three-dimensional cone beam CT images reconstructed from a volumetric rendering program in vivo. Dentomaxillofac Radiol 2011;40:492-500.
34. Lagravère MO, Carey J, Heo G, Toogood RW, Major PW. Transverse, vertical, and anteroposterior changes from bone-anchored maxillary expansion vs traditional rapid maxillary expansion: A randomized clinical trial. American Journal of Orthodontics and Dentofacial Orthopedics 2010;137:304.e301-304.e312.
37. Hansen L, Tausche E, Hietschold V, Hotan T, Lagravère M, Harzer W. Skeletally-anchored Rapid Maxillary Expansion using the Dresden Distractor. Journal of Orofacial Orthopedics / Fortschritte der Kieferorthopädie 2007;68:148-158.
39. Tausche E, Hansen L, Hietschold V, Lagravère MO, Harzer W. Three-dimensional evaluation of surgically assisted implant bone-borne rapid maxillary expansion: A pilot study. American Journal of Orthodontics and Dentofacial Orthopedics 2007;131:S92-S99.
80. Alavi DG, BeGole EA, Schneider BJ. Facial and dental arch asymmetries in Class II subdivision malocclusion. American Journal of Orthodontics and Dentofacial Orthopedics 1988;93:38-46.
81. Mraiwa N, Jacobs R, Van Cleynenbreugel J, Sanderink G, Schutyser F, Suetens P et al. The nasopalatine canal revisited using 2D and 3D CT imaging. Dentomaxillofac Radiol 2004;33:396-402.
88. Mah J HD. Three-dimensional craniofacial imaging. Am J Orthod Dentofacial Orthop 2004;126:308-309.
91. Shibata M, Nawa H, Kise Y, Fuyamada M, Yoshida K, Katsumata A et al. Reproducibility of three-dimensional coordinate systems based on craniofacial landmarks. The Angle Orthodontist 2012;82:776-784.
95. Lagravere MO, Major PW, Carey J. Sensitivity analysis for plane orientation in three-dimensional cephalometric analysis based on superimposition of serial cone beam computed tomography images. Dentomaxillofac Radiol 2010;39:400-408.
96. Naji P, Alsufyani NA, Lagravère MO. Reliability of anatomic structures as landmarks in three-dimensional cephalometric analysis using CBCT. The Angle Orthodontist 2013;84:762-772.

65
97. Lagravère MO, Gordon JM, Flores-Mir C, Carey J, Heo G, Major PW. Cranial base foramen location accuracy and reliability in cone-beam computerized tomography. American Journal of Orthodontics and Dentofacial Orthopedics 2011;139:e203-e210.
98. Arat ZM, Rübendüz M, Arman Akgül A. The displacement of craniofacial reference landmarks during puberty: a comparison of three superimposition methods. The Angle orthodontist 2003;73:374-380.
99. Trpkova B, Prasad NG, Lam EW, Raboud D, Glover KE, Major PW. Assessment of facial asymmetries from posteroanterior cephalograms: validity of reference lines. American journal of orthodontics and dentofacial orthopedics 2003;123:512-520.
100. Athanasiou AE. Orthodontic cephalometry. London ; Baltimore: : Mosby-Wolfe; 1995.
101. Major PW, Johnson DE, Hesse KL, Glover KE. Landmark identification error in posterior anterior cephalometrics. The Angle orthodontist 1994;64:447-454.
102. MIDTGÅRD J, BJÖRK G, Linder-Aronson S. Reproducibility of cephalometric landmarks and errors of measurements of cephalometric cranial distances. The Angle orthodontist 1974;44:56-61.
103. Jacobson A, RL J. Radiographic Cephalometry: From Basics to 3-D Imaging, (Book/CD-ROM set), Chapter 24; 2007: p. 293-299.
104. Baumrind S, Frantz RC. The reliability of head film measurements: 1. Landmark identification. American journal of orthodontics 1971;60:111-127.
105. Afrand M, Ling CP, Khosrotehrani S, Flores-Mir C, Lagravère-Vich MO. Anterior cranial-base time-related changes: A systematic review. American Journal of Orthodontics and Dentofacial Orthopedics 2014;146:21-32.e26.
106. Moss ML, Salentijn L. Differences between the functional matrices in anterior open-bite and in deep overbite. American journal of orthodontics 1971;60:264-280.
107. Keith A, Campion GG. A Contribution to the Mechanism of Growth of the Human Face. International Journal of Orthodontia, Oral Surgery and Radiography 1922;8:607-633.
108. Bidarkotimath S, Viveka S, Udyavar A. Vidian canal: radiological anatomy and functional correlations. J Morpholl Sci 2012;29:27-31.
109. Chen J, Xiao J. Morphological study of the pterygoid canal with high-resolution CT. Int J Clin Exp Med 2015;8:9484-9490.
110. Sayinsu K, Isik F, Trakyali G, Arun T. An evaluation of the errors in cephalometric measurements on scanned cephalometric images and conventional tracings. Eur J Orthod 2007;29:105-108.
111. Jacobson A, Jacobson RL. Radiographic Cephalometry: From Basics to 3-D Imaging, (Book/CD-ROM set) ,Chapter 7. 2007.
112. Gupta T. Localization of important facial foramina encountered in maxillo‐facial surgery. Clinical Anatomy 2008;21:633-640.
113. Aggarwal A, Kaur H, Gupta T, Tubbs RS, Sahni D, Batra YK et al. Anatomical study of the infraorbital foramen: A basis for successful infraorbital nerve block. Clin Anat 2015;28:753-760.

66
114. Damstra J, Fourie Z, Slater JJH, Ren Y. Reliability and the smallest detectable difference of measurements on 3-dimensional cone-beam computed tomography images. American journal of orthodontics and dentofacial orthopedics 2011;140:e107-e114.
115. Weisstein EW. "Point-Plane Distance.". MathWorld--A Wolfram Web Resource. http://mathworld.wolfram.com/Point-PlaneDistance.html; 2016.
116. Portney L WM. Foundations of clinical research: applications to practice.: Prentice Hall, Upper Saddle River 2008.
117. Nagasaka S, Fujimura T, Segoshi K. Development of a non-radiographic cephalometric system. Eur J Orthod 2003;25:77-85.
118. Berge JK, Bergman RA. Variations in size and in symmetry of foramina of the human skull. Clinical anatomy 2001;14:406-413.
119. Marmary Y, Zilberman Y, Mirsky Y. Use of foramina spinosa to determine skull midlines. The Angle Orthodontist 1979;49:263-268.
120. Williamson PC, Major PW, Nebbe B, Glover KE, West K. Landmark identification error in submentovertex cephalometrics: a computerized method for determining the condylar long axis. Oral Surgery, Oral Medicine, Oral Pathology, Oral Radiology, and Endodontology 1998;86:360-369.
121. Madsen DP, Sampson WJ, Townsend GC. Craniofacial reference plane variation and natural head position. The European Journal of Orthodontics 2008;30:532-540.
122. Braun S, Hnat WP, Johnson BE. The curve of Spee revisited. American journal of orthodontics and dentofacial orthopedics 1996;110:206-210.
123. Damgaard C, Caspersen LM, Kjaer I. Maxillary sagittal growth evaluated on dry skulls from children and adolescents. Acta Odontol Scand 2011;69:274-278.
124. Sejrsen B, Jakobsen J, Kjær I. Human palatal growth evaluated on medieval crania using nerve canal openings as references. American journal of physical anthropology 1996;99:603-611.
125. Ikuta CRS, Cardoso CL, Ferreira-Júnior O, Lauris JRP, Souza PHC, Rubira-Bullen IRF. Position of the greater palatine foramen: an anatomical study through cone beam computed tomography images. Surgical and Radiologic Anatomy 2013;35:837-842.
126. Pinheiro-Neto CD, Fernandez-Miranda JC, Rivera-Serrano CM, Vaezi AE, Snyderman CH, Gardner PA. Endoscopic Anatomy of the Palatovaginal Canal (Palatosphenoidal Canal): A Landmark for Dissection of the Vidian Nerve during Endonasal Transpterygoid Approaches. Skull Base 2011;21:A045.
127. Mahboubi H, Wu EC, Jahanbakhshi R, Coale K, Rothholtz VS, Zardouz S et al. A novel method to determine standardized anatomic dimensions of the osseous external auditory canal. Otol Neurotol 2012;33:715-720.
128. Pancherz H, Gökbuget K. The reliability of the Frankfort horizontal in roentgenographic cephalometry. The European Journal of Orthodontics 1996;18:367-372.
129. Choi JW, Jung SY, Kim H-J, Lee S-H. Positional symmetry of porion and external auditory meatus in facial asymmetry. Maxillofacial plastic and reconstructive surgery 2015;37:1.

67
130. Periago DR, Scarfe WC, Moshiri M, Scheetz JP, Silveira AM, Farman AG. Linear accuracy and reliability of cone beam CT derived 3-dimensional images constructed using an orthodontic volumetric rendering program. The Angle orthodontist 2008;78:387-395.
131. Springate S. The effect of sample size and bias on the reliability of estimates of error: a comparative study of Dahlberg's formula. The European Journal of Orthodontics 2012;34:158-163.

68
Chapter 4

69
4. Three-dimensional changes between tooth-borne versus bone-
borne (Dresden-type) rapid maxillary expansion in adolescents:
A randomized clinical trial.
4.1 Introduction
Posterior crossbite (PXB) is one of the most easily recognized clinical signs that result
from a transverse constricted maxilla 1. This narrow maxillary width relative to the mandible,
causes a mismatch between opposing posterior teeth when biting into maximum
intercuspation 1,8,9. This can bring a negative cosmetic and functional impact on patients,
including, but not limited to excess buccal corridor spaces when smiling, crowded anterior
teeth, and uneven dental attrition 1,10.
This study is interested specifically in the true maxillary constriction cases where the
primary treatment is through rapid maxillary expansion. As discussed in chapter 2,
conventional correction of maxillary constriction was often done using a Tooth-borne Rapid
Maxillary Expander (T-RME). Due to its dental attachment, T-RME has long been reported to
induce greater dental than skeletal expansion (70% dental vs. 30% skeletal)35. Mild levels of
undesirable maxillary molar crown tipping, and bite opening have been reported in previous
studies evaluating short-term effects of T-RME, although this has not been consistent
throughout the literature 13,34,132,133. Consequently, B-RME was designed to hopefully reduce
the various dental side-effects 36,37. B-RME attempts to minimize dental structures disturbance
and maximize skeletal expansion by directly inserting either shortened palatal implants or
temporary anchorage devices (TADs) 36,37 into the two halves of the bony maxillary palate.
The Dresden B-RME design was chosen to be used in adolescents for the first time in
this study. This appliance had been used in two previous studies on ten mature adult patients
who underwent surgically-assisted rapid maxillary expansion in the study by Tausche et al 39
and Hansen et al 37.The Dresden B-RME has a unique design feature where it is anchored by an
osteointegrated implant on one side and a mini-implant-anchor (a.k.a. Temporary Anchorage
Devices, or TAD) on the other.
Efforts from the previous chapter (see chapter 3) provided a set of 3-D reference
planes that have been experimentally proven to be accurate and reliable. Using these planes

70
along with selected treatment landmarks allows a quantitative measure of transverse,
vertical, and antero-posterior changes after T-RME/B-RME/no treatment after 6 months'
observation.
This study focuses on the maxillary changes, since spontaneous mandibular correction
is not very predictable beyond the early mixed dentition phase 11,44. Furthermore, correction
of the maxillary base allows more normal growth from an “unlocked” mandible 75,134.
The primary objective of this study is to understand the 3-dimensional skeletal and
dental maxillary effects of the Dresden Bone-Borne Rapid Maxillary Expander (B-RME) and the
4-Band Tooth-Borne Rapid Maxillary Expander (T-RME). Both of these treatments will be used
in patients with maxillary transverse constriction.
4.2 Materials & Methods
4.2.1 Subjects
This study was granted ethics approval by the Health Research Ethics Board at the
University of Alberta (Pro#00013379). Fifty healthy adolescent patients (27 females and 23
males) with transverse maxillary constriction and unilateral or bilateral posterior crossbite
who presented to the University of Alberta Orthodontic Clinic from Sept 2007 to Sept 2010
were included. All eligible patients were aged between 11-18 years, non-syndromic, and
diagnosed by an orthodontist to require at least 5 mm of maxillary transverse constriction
correction as directly measured using calipers. Maxillo-mandibular width difference was
determined by calculating the difference between maxillary and mandibular inter-molar
widths. Maxillary inter-molar width was measured from the palatal cusp tips of the left and
right upper first molars. Mandibular inter-molar width was measured between central fossae
of the left and right lower first molars. A 20% overcorrection was then added to the total
expansion requirements in order to account for potential maxillary relapse. Patients were
only eligible when no surgical or other orthodontic treatments were assigned during the
expansion period.
A minimum sample size of 45 patients (15 patients per treatment group) was
calculated using a statistical power of 0.9 considering a significance level of 0.05 116, based on

71
a previous study by Lagravère et al 24. Subjects were randomly allocated into one of three
groups (Table 4-1). Mean ages of the 3 groups were approximately 13 – 14 years.
4.2.2 RME Design and Activation Protocol
The chosen Bone-borne expander (B-RME) was the Dresden-type hyrax expander. Its
design consisted of a temporary anchorage device (TAD-side) on one side and a shortened-
implant (Implant-side) on the other. This Dresden-B-RME had the same design as the type
used by Tausche et al 39 and Hansen et al 37. The only difference is that their studies involved
surgically-assisted RME (SARME) in ten adults with skeletal maxillary constriction (Figure 4.1B,
Figure 4.2).
The TAD anchor of this B-RME appliance had a length of 8 mm, diameter of 1.5 mm
and made of titanium (Straumann, Andover, Mass). The self-tapping shortened palatal implant
(Implant-side), had a reduced length of 4 mm, diameter of 3.5 mm, made of Titanium
(Straumann, Andover, Mass). Both bone anchors were inserted paramedian to the midpalatal
suture, between the maxillary second premolars and first molars on an individualized basis.
Prior to TAD and palatal implant insertion, all patients received a 2-minute chlorhexidine
(0.12%) pre-rinse. All bone-borne expanders were placed by one orthodontist under topical
and local anesthesia. A total of 17 subjects were treated using the Dresden-B-RME. There was
1 week of healing period before activation of the B-RME expander screw. The expansion screw
(Palex II Extra-Mini Expander, Summit Orthodontic Services, OH, USA) was only activated by
0.25-mm daily. This was to take precautions and prevent potential palatal shelf fractures 33,34.
A traditional 4-band Tooth-borne expander (T-RME) design was used in 17 subjects.
The appliance was cemented to maxillary first molar and first premolar (Figure 4.1A). The
expansion screw was activated by 0.50-mm daily.
Both treatment groups received a minimum of 5 mm expander screw activation, until
the PXB was fully corrected and the palatal cusps of the maxillary molars met with the buccal
cusp of the lower molars according to the McNamara protocol. The expanders in both
treatment groups were left in passive state and sealed with light-cured composite, to prevent
screw unwinding in the additional 4 to 6 months of bony consolidation after active expansion.

72
The control group were age-matched and gender-matched adolescents with PXB who
had treatment delayed for 6 months, where there were no negative consequences regarding
the patient's treatment outcome. The purpose of the untreated control group was to control
for natural growth differences that may have occurred over the six month period without
treatment.
Figure 4.1. Clinical Photo of the A) Tooth-borne (Left), and B) Bone-borne Expander (Right)
Figure 4.2. Bone-borne RME (B-RME) with Mini-Hyrax jackscrew supported by
TAD on one side (TAD-anchor side), and palatal implant (Implant-anchor side) on the other.

73
Table 4-1. Subject Demographics
Appliance n Gender (F/M)
Mean Age ± S.D. at T1 (y)
Age Range at T1 (y)
Mean Age ± S.D. at T2 (y)
Age Range at T2 (y)
Time Interval T2 - T1 (y)
B-RME 17 10 7 14.1 ± 1.6 12.0 - 17.6 14.7 ± 1.6 12.7 - 18.2 0.6 ± 0.1
T-RME 17 9 8 13.7 ± 1.1 11.9 - 16.4 14.3 ± 1.1 12.5 - 16.9 0.6 ± 0.1
Ctrl 16 8 8 13.3 ± 1.7 10.5 - 15.8 14.1 ± 1.9 11.1 - 16.6 0.8 ± 0.6
Table 4-2. Subject Demographics within B-RME group
B-RME Analysis
n Gender (F/M)
Mean Age ± S.D. at T1 (y)
Age Range at T1 (y)
Mean Age ± S.D. at
T2 (y)
Age Range at T2 (y)
Time Interval T2 - T1 (y)
TAD- L
(IMP-R)
10 7 4 13.8 ± 1.3 12.0 - 15.9 14.5 ± 1.3 12.7 - 17.0 0.7 ± 0.1
TAD- R
(IMP-L)
7 3 3 14.6 ± 1.9 12.5 - 17.6 15.2 ± 2.0 13.1 - 18.2 0.6 ± 0.1
4.3 Identification of CBCT Landmarks
The CBCT scans of 0.3-mm voxel size were taken with the I-CAT 1st generation
machine (9 sec exposure time, 13 cm x 16 cm FOV, 0.3 mm voxel size, Imaging Sciences
International, Hatsfield, PA) at 120 kV, 5 mAs with 8 mm aluminum filtration according to
manufacturer's settings. The head position of all subjects were aligned and standardized using
the vertical laser beam (aimed at Mid-sagittal plane) and horizontal laser beam (aimed at
Frankfort horizontal) during radiographic acquisition. CBCT imaging was done before
treatment (T1) and 6 months after full PXB correction with overexpansion (T2) in all three
groups. The CBCT data were exported as DICOM files (Digital Imaging and Communications in
Medicine) and then loaded into AVIZO 8.1 software (FEI Visualization Sciences Group,
Burlington, Mass) for further analysis. A Cartesian coordinate system was used for each CBCT
volume, with the origin of the x,y,z axis determined at the time of scan.
The CBCT volumes were viewed in three planes: x-y axial (right-left), x-z coronal
(superior-inferior), and y-z sagittal (anterior-posterior). The principal investigator marked all

74
3-D landmarks using virtual sphere markers of 0.20 mm diameter. The center position of the
virtual marker was used to determine the landmark's precise location in this software; hence
the marker size did not affect the landmark position. The pre-determined 3-D definitions
detailed in chapter 3 (Table 3-1 - Table 3-3) were used to identify the landmarks. The
examiner was blinded to the subjects' age, treatment group and time of acquisition to reduce
bias.
Figure 4.3: Orientation of the 3 axes:
X-axis (Red, Transverse), Y-axis (Green, Anterior-posterior), Z-axis (Blue, Vertical).
4.3.1 Orthogonal distances between landmarks to planes
Using the experimentally proven technique in chapter 3, a set of accurate and reliable
3-D landmarks were identified and used to calculate orthogonal distances relative to
respective reference planes, in order to quantitatively compare the transverse, vertical and
antero-posterior differences between and within the three treatment groups, across both T1
(baseline) and T2 (6 months after). The reference and treatment landmarks all showed
excellent accuracy and intra-examiner reliability agreement, along with low identification
errors (ICC > 0.92; mean errors ≤ 0.85 mm) (see chapter 3).

75
4.4 Results
4.4.1 Measurement error
To assess measurement error of orthogonal distances relative to the reference planes,
24 randomly selected CBCT volumes were selected, and the reference landmarks used to
construct the three reference planes were repeated three times. Small mean measurement
errors of≤ 0.55 mm, ≤ 0.55 mm, and ≤ 0.30 mm, were found in the Mid-sagittal plane
(Transverse orthogonal distances), Palatal plane (Vertical orthogonal distances), and Frontal
plane (Antero-posterior orthogonal distances) respectively (Table 4-3).
Table 4-3: Mean errors (in mm) from 3 repeated reference plane constructions for the skeletal and
dental landmarks.
Transverse Vertical Antero-posterior
Land-marks
Mean +/- SD (mm)
Max (mm)
Min (mm)
Mean +/- SD (in mm)
Max (mm)
Min (mm)
Mean +/- SD (in mm)
Max (mm)
Min (mm)
PULP.16 0.31 ± 0.24 0.67 0.05 0.23 ± 0.21 0.58 0.03 0.21 ± 0.16 0.42 0.08
PULP.26 0.35 ± 0.26 0.68 0.05 0.26 ± 0.32 0.83 0.05 0.20 ± 0.04 0.27 0.09
PULP.14 0.25 ± 0.28 0.77 0.06 0.37 ± 0.32 0.91 0.04 0.19 ± 0.16 0.42 0.07
PULP.24 0.26 ± 0.29 0.78 0.05 0.38 ± 0.41 1.09 0.07 0.20 ± 0.08 0.29 0.09
PULP.13 0.30 ± 0.32 0.81 0.04 0.47 ± 0.37 1.05 0.04 0.22 ± 0.17 0.48 0.03
PULP.23 0.33 ± 0.35 0.82 0.07 0.48 ± 0.45 1.22 0.05 0.20 ± 0.13 0.34 0.09
PULP.46 0.46 ± 0.40 1.07 0.06 0.24 ± 0.17 0.50 0.03 0.21 ± 0.17 0.49 0.06
PULP.36 0.49 ± 0.46 1.26 0.06 0.24 ± 0.27 0.71 0.12 0.23 ± 0.13 0.40 0.08
APEX.16 0.17 ± 0.22 0.59 0.04 0.19 ± 0.13 0.39 0.04 0.22 ± 0.10 0.38 0.15
APEX.26 0.17 ± 0.22 0.60 0.02 0.23 ± 0.26 0.69 0.08 0.25 ± 0.10 0.37 0.18
APEX.14 0.24 ± 0.24 0.66 0.05 0.30 ± 0.22 0.65 0.04 0.20 ± 0.13 0.36 0.04
APEX.24 0.22 ± 0.23 0.67 0.04 0.33 ± 0.31 0.85 0.06 0.20 ± 0.06 0.28 0.11
APEX.13 0.27 ± 0.22 0.67 0.05 0.35 ± 0.25 0.73 0.03 0.18 ± 0.10 0.31 0.07
APEX.23 0.27 ± 0.22 0.67 0.05 0.35 ± 0.30 0.85 0.05 0.18 ± 0.04 0.22 0.12

76
APEX.46 0.55 ± 0.49 1.49 0.07 0.27 ± 0.20 0.59 0.03 0.26 ± 0.19 0.57 0.11
APEX.36 0.55 ± 0.46 1.46 0.07 0.28 ± 0.31 0.82 0.02 0.25 ± 0.17 0.47 0.07
AVBN.16 0.17 ± 0.21 0.58 0.04 0.18 ± 0.12 0.37 0.05 0.23 ± 0.10 0.39 0.16
AVBN.26 0.18 ± 0.22 0.60 0.01 0.24 ± 0.26 0.71 0.10 0.23 ± 0.14 0.46 0.10
AVBN.14 0.24 ± 0.24 0.66 0.05 0.30 ± 0.22 0.65 0.04 0.18 ± 0.12 0.37 0.03
AVBN.24 0.22 ± 0.23 0.67 0.04 0.31 ± 0.32 0.86 0.07 0.21 ± 0.07 0.31 0.11
OVAL.R 0.26 ± 0.48 1.22 0.03 0.55 ± 0.31 0.91 0.04 0.27 ± 0.27 0.75 0.09
OVAL.L 0.25 ± 0.43 1.12 0.04 0.54 ± 0.27 0.80 0.19 0.24 ± 0.08 0.35 0.15
PVID.R 0.24 ± 0.44 1.14 0.02 0.55 ± 0.30 0.94 0.23 0.28 ± 0.24 0.65 0.04
PVID.L 0.22 ± 0.40 1.04 0.02 0.46 ± 0.27 0.78 0.16 0.22 ± 0.13 0.34 0.03
MENT.R 0.55 ± 0.69 2.08 0.05 0.39 ± 0.26 0.87 0.03 0.29 ± 0.20 0.60 0.10
MENT.L 0.55 ± 0.69 2.09 0.06 0.39 ± 0.40 1.09 0.10 0.26 ± 0.24 0.60 0.06
IORB.R 0.53 ± 0.42 1.61 0.08 0.42 ± 0.25 0.78 0.17 n/a †
IORB.L 0.52 ± 0.42 1.56 0.07 0.39 ± 0.42 1.06 0.11 n/a †
GPF.R 0.19 ± 0.16 0.43 0.06 n/a † 0.17 ± 0.09 0.32 0.07
GPF.L 0.26 ± 0.24 0.61 0.06 n/a † 0.23 ± 0.16 0.50 0.10
ELSA n/a † 0.41 ± 0.29 0.53 0.10 0.23 ± 0.13 0.39 0.03
MDFM n/a † 0.49 ± 0.27 0.59 0.13 0.18 ± 0.09 0.27 0.05
Mid.NPF n/a † n/a † n/a †
† n/a: not applicable, since this landmark was used for plane construction.
4.4.2 Statistical analysis
The IBM SPSS statistical software was used for statistical data analysis (SPSS Statistics
for Windows, Version 22.0. Armonk, NY). A total of 24 sets of landmarks were analyzed. A p-
value of less than 0.05 was considered significant.
Repeated measures multiple analysis of covariance (rm-MANCOVA) was used (followed
by post-hoc analysis) to test for any differences between the three treatment groups (T-RME,
B-RME, Ctrl). The baseline values of all dento-skeletal variables (orthogonal distances for
each landmark) at T1 of all three groups were compared using rm-MANCOVA. Then, a second

77
rm-MANCOVA was carried out for the T2-T1 data to assess treatment effects. A follow-up
univariate analysis (Bonferroni tests) was then used for between-group and within-group
pairwise comparisons. The null hypothesis was that neither between-group nor within-group
differences exist for any of the parameters. Both rm-MANCOVA T1 and T2-T1 analysis were
performed to compare the starting age at T1, gender, along with dental and skeletal
measurements of the side of landmark measures (e.g. left, or right sided molar
measurements, named as the LRSide).
Before performing the rm-MANCOVA, model assumptions were evaluated. Assumptions
were met for independence (independent samples), sphericity (assumption did not apply,
since there were only 2 time points) and multivariate normality. All data were checked for
multivariate normality by visual examination of the P-P and Q-Q-plot (Appendix 15A), and by
box plot of the Mahalanobis distance of the difference between T1 and T2 of each measured
distance (dependent variable) (Appendix 15B). Furthermore, multiple analysis of covariance
(MANCOVA) is robust to reasonable deviations in normality and equal variances when sample
sizes are fairly large such as in this study. Assumption of linearity of repeated measures was
met by visual assessment of bivariate scatter plots (Appendix 16-18); no obvious curved
relationship was seen, which suggested normal distribution. Correlation was assessed by
regression analysis on the covariates (age, gender) for all the dependent variables. The
mentioned covariates were not well correlated (r<0.5) with the dependent variables. Overall,
the rm-MANCOVA results suggested that age and gender did not have a significant effect as a
covariate. Consequently, the covariates were eliminated and the analysis was repeated
without the covariate.
With covariates eliminated, the repeated measures multivariate analysis of variance
(rm-MANOVA) was run to compare baseline characteristics. There was no interaction between
the term Group*LRSide*Age*Gender (p=.518). To account for this finding, rm-MANOVA was re-
run by dropping the interaction terms one at a time. No significant difference were found for
the interaction terms Group*LRSide*Age (p=0.575), Group*LRSide*Gender (p=0.673),
Group*LRSide (p=.117) and LRSide*Age (p=.658), so they were dropped, rm-MANOVA was re-
run, and finally tested against the main effects. No significant differences were found for
Group (p=.207), LRSide (p=.371), Gender (p=.563) and Age (p=.542). Mean baseline
measurements (T1) in the transverse, vertical and antero-posterior (AP) dimension are shown
in Table 4-4.

78
Table 4-4. Baseline (T1) orthogonal distances (in mm) for all groups, from variable landmark to
respective planes (Transverse (T*), Vertical (V*), and Antero-posterior (AP*) dimensions).
Group
:
B-RME
B-RME
B-RME
Ctrl
Ctrl
Ctrl
T-RME
T-RME
T-RME
T1 T* V* AP* T* V* AP* T* V* AP*
Variables
Mean ± S.D. (mm)
Mean ± S.D. (mm)
Mean ± S.D. (mm)
Mean ± S.D. (mm)
Mean ± S.D. (mm)
Mean ± S.D. (mm)
Mean ± S.D. (mm)
Mean ± S.D. (mm)
Mean ± S.D. (mm)
PULP.16
-21.73 ± 2.20
14.71 ± 3.40
-18.20 ± 3.49
-22.17 ± 2.22
12.04 ± 3.80
-18.95 ± 2.91
-21.65 ± 1.72
13.73 ± 4.71
-18.98 ± 2.28
PULP.26
21.15 ± 2.03
16.07 ± 3.90
-18.69 ± 3.15
21.27 ± 2.20
12.43 ± 2.74
-19.70 ± 2.29
21.03 ± 2.12
13.79 ± 4.45
-19.52 ± 2.18
PULP.14
-17.20 ± 1.53
16.56 ± 5.70
-6.32 ± 2.71
-17.86 ± 1.73
13.22 ± 3.71
-7.19 ± 3.28
-16.71 ± 1.50
13.97 ± 5.73
-6.85 ± 2.39
PULP.24
16.94 ± 1.79
16.94 ± 5.50
-6.42 ± 2.45
17.76 ± 2.23
13.51 ± 3.56
-7.62 ± 3.41
16.38 ± 1.69
13.76 ± 6.12
-7.03 ± 2.33
PULP.13
-15.33 ± 1.66
17.38 ± 6.83
0.99 ± 2.67
-15.96 ± 1.84
15.44 ± 6.67
1.22 ± 3.51
-15.65 ± 1.48
16.44 ± 6.50
1.04 ± 2.99
PULP.23
14.52 ± 3.78
17.86 ± 6.74
0.03 ± 2.52
15.98 ± 2.17
15.11 ± 5.81
0.41 ± 3.73
15.42 ± 1.86
16.40 ± 5.53
0.52 ± 3.16
PULP.46
-22.81 ± 1.83
25.45 ± 3.95
-19.19 ± 4.29
-23.18 ± 1.93
24.24 ± 3.36
-21.19 ± 5.55
-23.42 ± 2.20
25.10 ± 4.02
-21.07 ± 3.95
PULP.36
22.32 ± 2.66
25.62 ± 4.41
-20.35 ± 4.53
22.25 ± 2.70
24.70 ± 3.47
-21.84 ± 5.21
22.24 ± 2.28
24.61 ± 3.99
-21.39 ± 3.86
APEX.16
-23.21 ± 1.73
1.03 ± 2.55
-14.63 ± 2.77
-23.60 ± 2.31
0.73 ± 2.20
-15.19 ± 2.58
-22.85 ± 2.17
0.72 ± 3.67
-14.63 ± 1.84
APEX.26
23.72 ± 1.81
1.85 ± 4.41
-15.62 ± 3.27
23.86 ± 1.58
1.21 ± 3.78
-15.57 ± 1.92
22.70 ± 2.37
0.14 ± 3.02
-14.72 ± 1.92
APEX.14
-16.50 ± 1.37
2.65 ± 3.70
-5.60 ± 2.37
-18.09 ± 1.53
2.32 ± 2.59
-6.23 ± 2.25
-16.88 ± 1.84
1.44 ± 4.70
-5.19 ± 2.09
APEX.24
17.08 ± 2.00
3.39 ± 3.97
-6.40 ± 1.59
18.55 ± 1.53
2.77 ± 3.00
-6.65 ± 2.42
17.22 ± 1.89
1.00 ± 4.70
-5.37 ± 2.29
APEX.13
-12.11 ± 2.16
-1.06 ± 5.26
-1.92 ± 1.33
-12.66 ± 1.74
-3.44 ± 5.40
-2.24 ± 1.66
-12.08 ± 1.71
-1.56 ± 4.38
-2.43 ± 1.85
APEX.23
12.15 ± 1.87
-0.87 ± 4.56
-2.76 ± 1.28
13.29 ± 1.55
-3.25 ± 4.62
-3.00 ± 1.98
12.17 ± 1.60
-1.63 ± 3.64
-2.40 ± 1.78
APEX.46
-25.42 ± 2.19
36.35 ± 3.59
-21.76 ± 4.81
-25.44 ± 1.64
35.17 ± 4.77
-23.63 ± 5.13
-26.26 ± 2.39
35.78 ± 6.80
-23.81 ± 5.19
APEX.36
25.69 ± 3.35
36.93 ± 4.44
-22.70 ± 4.50
24.75 ± 2.03
35.41 ± 3.60
-24.07 ± 5.04
25.20 ± 2.16
35.66 ± 6.13
-23.88 ± 4.90
AVBN.16
-27.45 ± 2.15
0.82 ± 2.55
-13.91 ± 3.35
-29.46 ± 3.36
0.55 ± 2.40
-14.34 ± 3.31
-27.03 ± 2.46
1.05 ± 3.95
-13.92 ± 2.01
AVBN.26
27.91 ± 1.95
1.13 ± 2.84
-14.93 ± 3.51
29.17 ± 2.44
1.02 ± 3.57
-15.12 ± 2.66
26.99 ± 2.61
0.56 ± 3.01
-14.23 ± 1.80
AVBN.14
-18.75 ± 1.29
2.69 ± 3.88
-4.49 ± 2.92
-20.68 ± 1.45
2.22 ± 2.65
-5.88 ± 2.33
-18.99 ± 1.68
1.71 ± 4.68
-4.66 ± 1.85
AVBN.24
20.04 ± 2.23
3.51 ± 4.03
-6.00 ± 1.92
20.96 ± 2.06
2.69 ± 2.93
-6.35 ± 2.69
18.98 ± 1.73
0.97 ± 4.55
-5.05 ± 2.22
AVBN.13
-14.35 ± 2.12
-1.32 ± 5.42
0.39 ± 1.49
-15.39 ± 1.94
-3.76 ± 5.67
0.70 ± 1.64
-14.42 ± 1.72
-2.52 ± 4.12
0.13 ± 1.44
AVBN.23
15.03 ± 1.75
-0.81 ± 4.69
-0.11 ± 1.32
16.02 ± 1.75
-3.52 ± 4.78
0.14 ± 2.08
15.17 ± 1.51
-2.07 ± 3.84
-0.06 ± 1.70
AVBN.46
-28.79 ± 2.22
36.47 ± 4.00
-19.45 ± 4.75
-29.10 ± 2.20
35.05 ± 4.83
-20.96 ± 5.24
-29.78 ± 2.53
35.63 ± 7.14
-20.99 ± 5.14

79
AVBN.36
29.43 ± 3.43
36.69 ± 4.28
-20.53 ± 4.39
28.45 ± 2.23
35.27 ± 3.77
-21.08 ± 5.04
28.88 ± 2.42
35.64 ± 6.24
-21.22 ± 4.75
OVAL_R
-25.44 ± 1.47
-20.62 ± 3.07
-51.87 ± 4.00
-23.70 ± 1.63
-20.00 ± 2.20
-55.46 ± 4.38
-25.09 ± 1.62
-19.56 ± 4.04
-53.64 ± 5.18
OVAL_L
25.12 ± 1.97
-20.88 ± 2.18
-51.88 ± 3.71
24.51 ± 0.93
-20.42 ± 1.66
-55.51 ± 3.84
24.93 ± 1.53
-19.95 ± 3.45
-52.95 ± 4.65
PVID_R
-15.29 ± 1.90
-21.31 ± 2.57
-51.49 ± 3.96
-14.63 ± 0.96
-20.22 ± 2.40
-54.40 ± 4.09
-14.67 ± 1.78
-20.19 ± 4.78
-52.03 ± 5.03
PVID_L
14.66 ± 2.60
-21.64 ± 2.05
-51.30 ± 3.78
14.87 ± 1.35
-20.61 ± 2.06
-55.00 ± 4.29
14.98 ± 1.53
-20.39 ± 4.38
-52.86 ± 5.06
MENT_R
-22.13 ± 1.94
41.92 ± 4.51
-14.56 ± 5.00
-22.84 ± 1.53
40.64 ± 4.54
-14.18 ± 5.48
-22.50 ± 2.87
42.31 ± 6.66
-15.16 ± 5.41
MENT_L
22.06 ± 1.99
42.26 ± 5.16
-14.30 ± 4.99
21.91 ± 2.75
39.90 ± 5.42
-14.05 ± 5.12
21.48 ± 2.87
41.80 ± 5.83
-15.12 ± 5.69
IORB_R
-23.60 ± 2.09
-19.00 ± 4.31
n/a †
-24.34 ± 2.48
-19.07 ± 2.40
n/a †
-23.43 ± 2.94
-19.00 ± 4.30
n/a †
IORB_L
23.10 ± 2.69
-18.64 ± 3.99
n/a †
24.27 ± 2.07
-19.78 ± 2.01
n/a †
23.68 ± 1.99
-19.52 ± 4.16
n/a †
GPF_R -14.14 ±
1.18 n/a
†
-29.77 ± 2.32
-13.82 ± 1.25
0.00 ± 0.00
-30.52 ± 2.17
-14.04 ± 1.36
0.00 ± 0.00
-30.61 ± 2.05
GPF_L 13.89 ±
1.23 n/a
†
-29.75 ± 2.59
13.76 ± 1.37
0.00 ± 0.00
-31.16 ± 2.43
13.45 ± 1.45
0.00 ± 0.00
-30.73 ± 2.17
† n/a: not applicable, since this landmark was used for plane construction.
Summary of Pre-treatment (T1) Findings
Subjects of all three groups had similar pre-treatment characteristics with regards to
age, gender, sample size, time interval, and pre-treatment dental and skeletal
measurements.
In the Control group, mean total inter-molar width was 43.44 mm in the maxilla, and
45.03 mm in the mandible (mean 1.59 mm transverse discrepancy).
In the B-RME group, mean total inter-molar width was 42.88 mm in the maxilla, and
45.33 mm in the mandible (mean 2.45 mm transverse discrepancy).
In the T-RME group, mean total inter-molar width was 42.18 mm in the maxilla, and
45.66 mm in the mandible (mean 1.74 mm transverse discrepancy).
4.4.3 Treatment Changes (T2-T1)
A repeated measures multivariate analysis of variance (rm-MANOVA) was run for the
treatment changes (T2-T1). The interaction term Group*LRSide*Age*Gender (p=.579) was not
found to be significant and rm-MANOVA was rerun by dropping this interaction term. There
was no significant difference for the interaction terms Group*LRSide*Gender (p=.552),

80
Group*LRSide*Age (p=.276), Group*LRSide (p=.104) and LRSide*Age (p=.531). Therefore, the
model was reduced and re-run without the interaction term to assess the main effects. No
significant differences were found for LRSide (p=.112), gender (p=.577), and age (p=.526), but
a significant difference was reported for Group (p=.012).
Then, rm-MANOVA was run for only B-RME subjects, using the interaction term
LRSide*TADSide (p=.267) but no significant difference was found. This interaction was
dropped, and the model was re-run in order to assess the main effects. The main effect
LRSide (p=.089) was not statistically significant, but a significant difference was reported for
TADSide (p=.035). A follow-up univariate analysis (Bonferroni tests) was then used for
between-group (Table 4-5 to Table 4-7) and within-group pairwise comparisons (Table 4-8 to
Table 4-12).
4.4.4 Between-Group Comparisons (T2-T1)
Transverse dento-skeletal changes relative to the mid-sagittal plane
More buccal displacement was noted by T-RME compared to B-RME group for the variables:
o PULP.16 (1.10 mm ; p=.010),
o PULP.14 (1.49 mm ; p<.001),
o PULP.24 (1.50 mm ; p<.001),
o APEX.26 (1.03 mm ; p=.010).
Compared to Control group, B-RME group showed statistically significant more buccal
displacement (expansion):
o PULP.16 (1.18 mm ; p=.010),
o PULP.26 (2.52 mm ; p<.001),
o APEX.26 (0.96 mm ; p=.030),
o PULP.24 (1.19 mm ; p=.030),
o GPF.L (0.91 mm ; p<.001).
Compared to Control group, T-RME group showed statistically significant greater buccal
displacement (expansion):
o PULP.16 (2.27 mm ; p<.001),
o PULP.26 (2.92 mm ; p<.001),

81
o APEX.26 (1.98 mm ; p<.001),
o PULP.24 (2.68 mm ; p<.001),
o GPF.L (0.83 mm ; p<.001),
o APEX.13 (1.31 mm ; p<.001),
o APEX.23 (1.09 mm ; p<.001),
o APEX.14 (1.54 mm ; p<.001),
o APEX.24 (1.20 mm ; p<.001),
o APEX.16 (1.38 mm ; p<.001),
o PULP.23 (1.09 mm ; p<.001),
o PULP.14 (2.19 mm ; p<.001).
Vertical distance changes relative to the palatal plane
Compared to Control, B-RME group TAD-side showed 1.31 mm greater superior skeletal
displacement of IORB, with statistical significance (p<.05).
Compared to Control, T-RME group showed greater inferior dental displacement of
PULP.26 (1.50 mm) and PULP.24 (1.80 mm), with statistical significance (p<.05).
Between B-RME and T-RME, no significant differences were found.
Antero-posterior distance changes relative to the frontal plane
Compared to Control, T-RME group showed greater forward (anterior) displacement of
PULP.14 (0.35 mm), with statistical significance (p<.05).
Compared to B-RME, T-RME group showed greater anterior movement of APEX.16 (1.46
mm) and APEX.26 (1.23 mm), with statistical significance (p<.05).
B-RME group showed no statistically significant differences compared to Control.
4.4.5 Within-Group Comparisons (T2-T1)
Left versus Right-side transverse discrepancy
In the T-RME and Control groups, no significant differences were found between the left-
and right-sides for any transverse changes (mean differences <0.60 mm).

82
B-RME group: TAD versus Implant-side transverse discrepancy
Compared to Implant-side from T2-T1, TAD-side showed greater expansion at the molar
crown by 1.84 mm (p=.014), with statistical significance.
Compared to the Implant-side from T2-T1, TAD-side showed statistically significant
expansion of the premolar crown and apex, by 1.43 mm (p=.010), and 1.44 mm (p=.008)
respectively (Table 4-9).
B-RME group: TAD- versus Implant-side vertical discrepancy
From T2-T1, TAD-side showed greater superior skeletal displacement of IORB.L by 1.50
mm, compared to the Implant-side, with statistical significance (p=.011).
Note that there were no statistical significant differences in any other vertical dento-
skeletal variables at T1 (all differences were < 0.58 mm).
Pulp- versus Apex- transverse discrepancy
In the T-RME group, greater crown expansion than root expansion (1.25 mm) was noted on
the upper left premolar, with statistical significance (p=.001). This indicated significant
crown tipping. No statistically significant molar crown tipping was noted (<0.85 mm).
In the B-RME group, greater crown expansion than root expansion (1.39 mm) was noted
only on the TAD-side upper molar, with statistical significance (p=.003). No statistically
significant difference was noted on the upper molar of the Implant-side (0.58 mm). This
indicated molar crown tipping on the TAD-side, but not the Implant-side. No significant
crown tipping was noted on premolars either side.
The Control group, showed no statistically significant difference between crown and root
expansion (Table 4-12).
Posterior versus Anterior transverse discrepancy
T-RME group showed greater expansion between the upper molar than between canines by
1.6 mm per side, with statistical significance (p<.002). No statistical significant
differences between inter-molar and inter-premolar expansion were found.
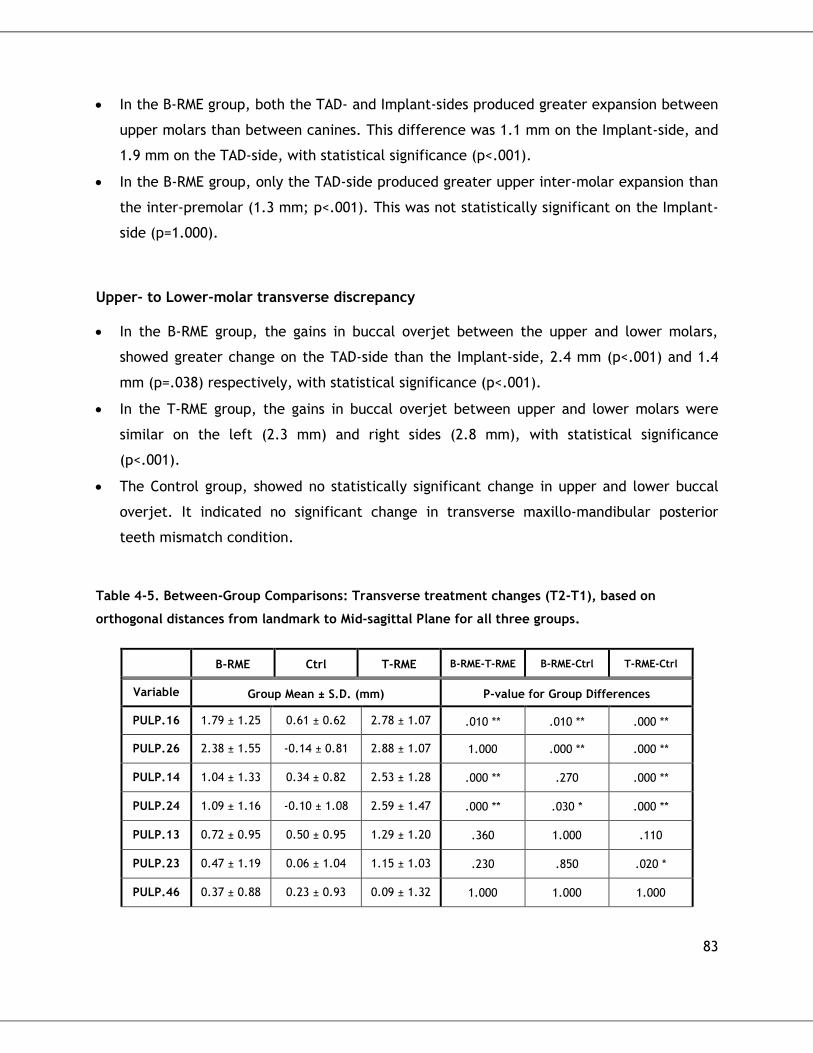
83
In the B-RME group, both the TAD- and Implant-sides produced greater expansion between
upper molars than between canines. This difference was 1.1 mm on the Implant-side, and
1.9 mm on the TAD-side, with statistical significance (p<.001).
In the B-RME group, only the TAD-side produced greater upper inter-molar expansion than
the inter-premolar (1.3 mm; p<.001). This was not statistically significant on the Implant-
side (p=1.000).
Upper- to Lower-molar transverse discrepancy
In the B-RME group, the gains in buccal overjet between the upper and lower molars,
showed greater change on the TAD-side than the Implant-side, 2.4 mm (p<.001) and 1.4
mm (p=.038) respectively, with statistical significance (p<.001).
In the T-RME group, the gains in buccal overjet between upper and lower molars were
similar on the left (2.3 mm) and right sides (2.8 mm), with statistical significance
(p<.001).
The Control group, showed no statistically significant change in upper and lower buccal
overjet. It indicated no significant change in transverse maxillo-mandibular posterior
teeth mismatch condition.
Table 4-5. Between-Group Comparisons: Transverse treatment changes (T2-T1), based on
orthogonal distances from landmark to Mid-sagittal Plane for all three groups.
B-RME Ctrl T-RME B-RME-T-RME B-RME-Ctrl T-RME-Ctrl
Variable Group Mean ± S.D. (mm) P-value for Group Differences
PULP.16 1.79 ± 1.25 0.61 ± 0.62 2.78 ± 1.07 .010 ** .010 ** .000 **
PULP.26 2.38 ± 1.55 -0.14 ± 0.81 2.88 ± 1.07 1.000 .000 ** .000 **
PULP.14 1.04 ± 1.33 0.34 ± 0.82 2.53 ± 1.28 .000 ** .270 .000 **
PULP.24 1.09 ± 1.16 -0.10 ± 1.08 2.59 ± 1.47 .000 ** .030 * .000 **
PULP.13 0.72 ± 0.95 0.50 ± 0.95 1.29 ± 1.20 .360 1.000 .110
PULP.23 0.47 ± 1.19 0.06 ± 1.04 1.15 ± 1.03 .230 .850 .020 *
PULP.46 0.37 ± 0.88 0.23 ± 0.93 0.09 ± 1.32 1.000 1.000 1.000

84
PULP.36 -0.01 ± 0.85 -0.31 ± 0.99 0.51 ± 1.15 .410 1.000 .070
APEX.16 1.21 ± 1.19 0.66 ± 0.89 2.03 ± 1.39 .140 .560 .000 **
APEX.26 0.99 ± 1.07 0.03 ± 0.80 2.02 ± 1.11 .010 * .030 * .000 **
APEX.14 0.79 ± 1.25 0.11 ± 0.84 1.65 ± 1.26 .100 .270 .000 **
APEX.24 0.87 ± 1.15 0.14 ± 0.83 1.34 ± 1.30 .670 .200 .010 **
APEX.13 0.86 ± 1.34 0.20 ± 0.79 1.51 ± 1.18 .300 .300 .010 **
APEX.23 0.62 ± 1.01 0.03 ± 0.75 1.13 ± 0.81 .280 .180 .000 **
APEX.46 0.55 ± 1.13 0.44 ± 1.37 0.16 ± 1.22 1.000 1.000 1.000
APEX.36 0.06 ± 1.24 -0.66 ± 1.29 0.24 ± 0.91 1.000 .250 .090
AVBN.16 1.09 ± 1.04 0.48 ± 1.25 0.85 ± 1.45 1.000 .490 1.000
AVBN.26 0.57 ± 0.93 -0.33 ± 0.63 0.70 ± 0.89 1.000 .010 ** .000 **
AVBN.14 0.80 ± 1.27 -0.03 ± 0.60 1.01 ± 1.27 1.000 .100 .030 *
AVBN.24 0.24 ± 0.93 0.05 ± 0.82 1.09 ± 1.33 .070 1.000 .020 *
AVBN.13 0.87 ± 1.19 0.05 ± 0.93 1.21 ± 1.13 1.000 .110 .010 *
AVBN.23 0.25 ± 1.01 0.16 ± 1.02 0.59 ± 0.92 .950 1.000 .660
AVBN.46 0.38 ± 1.16 0.25 ± 1.35 -0.02 ± 1.34 1.000 1.000 1.000
AVBN.36 -0.14 ± 1.33 -0.51 ± 1.71 0.28 ± 1.14 1.000 1.000 .340
MENT_R 0.20 ± 1.50 0.31 ± 1.42 0.22 ± 1.34 1.000 1.000 1.000
MENT_L -0.05 ± 1.10 0.08 ± 1.48 0.45 ± 0.98 .710 1.000 1.000
IORB_R 0.83 ± 1.48 0.26 ± 1.26 0.87 ± 1.29 1.000 .690 .580
IORB_L 0.11 ± 1.18 0.20 ± 1.36 0.38 ± 0.98 1.000 1.000 1.000
GPF_R 0.80 ± 0.71 0.40 ± 0.52 0.84 ± 0.72 1.000 .260 .190
GPF_L 0.99 ± 0.61 0.08 ± 0.58 0.91 ± 0.55 1.000 .000 ** .000 **
*: statistically significant P < 0.05, **: statistically significant P < 0.01.
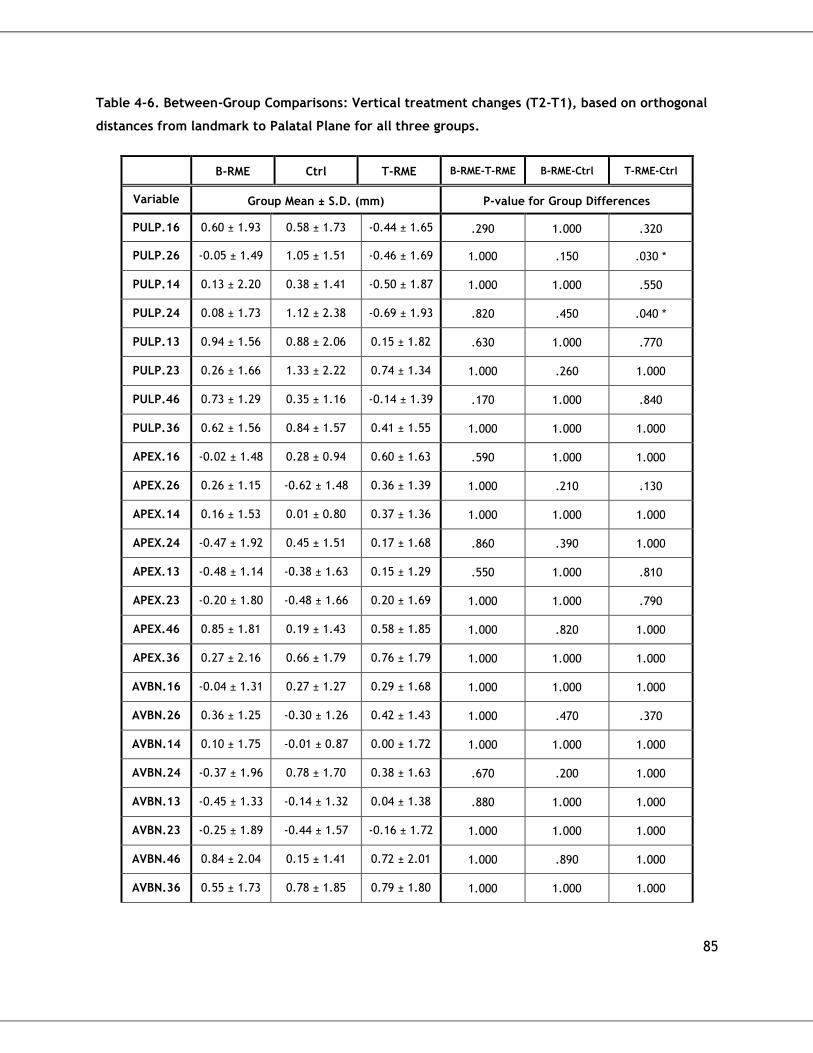
85
Table 4-6. Between-Group Comparisons: Vertical treatment changes (T2-T1), based on orthogonal
distances from landmark to Palatal Plane for all three groups.
B-RME Ctrl T-RME B-RME-T-RME B-RME-Ctrl T-RME-Ctrl
Variable Group Mean ± S.D. (mm) P-value for Group Differences
PULP.16 0.60 ± 1.93 0.58 ± 1.73 -0.44 ± 1.65 .290 1.000 .320
PULP.26 -0.05 ± 1.49 1.05 ± 1.51 -0.46 ± 1.69 1.000 .150 .030 *
PULP.14 0.13 ± 2.20 0.38 ± 1.41 -0.50 ± 1.87 1.000 1.000 .550
PULP.24 0.08 ± 1.73 1.12 ± 2.38 -0.69 ± 1.93 .820 .450 .040 *
PULP.13 0.94 ± 1.56 0.88 ± 2.06 0.15 ± 1.82 .630 1.000 .770
PULP.23 0.26 ± 1.66 1.33 ± 2.22 0.74 ± 1.34 1.000 .260 1.000
PULP.46 0.73 ± 1.29 0.35 ± 1.16 -0.14 ± 1.39 .170 1.000 .840
PULP.36 0.62 ± 1.56 0.84 ± 1.57 0.41 ± 1.55 1.000 1.000 1.000
APEX.16 -0.02 ± 1.48 0.28 ± 0.94 0.60 ± 1.63 .590 1.000 1.000
APEX.26 0.26 ± 1.15 -0.62 ± 1.48 0.36 ± 1.39 1.000 .210 .130
APEX.14 0.16 ± 1.53 0.01 ± 0.80 0.37 ± 1.36 1.000 1.000 1.000
APEX.24 -0.47 ± 1.92 0.45 ± 1.51 0.17 ± 1.68 .860 .390 1.000
APEX.13 -0.48 ± 1.14 -0.38 ± 1.63 0.15 ± 1.29 .550 1.000 .810
APEX.23 -0.20 ± 1.80 -0.48 ± 1.66 0.20 ± 1.69 1.000 1.000 .790
APEX.46 0.85 ± 1.81 0.19 ± 1.43 0.58 ± 1.85 1.000 .820 1.000
APEX.36 0.27 ± 2.16 0.66 ± 1.79 0.76 ± 1.79 1.000 1.000 1.000
AVBN.16 -0.04 ± 1.31 0.27 ± 1.27 0.29 ± 1.68 1.000 1.000 1.000
AVBN.26 0.36 ± 1.25 -0.30 ± 1.26 0.42 ± 1.43 1.000 .470 .370
AVBN.14 0.10 ± 1.75 -0.01 ± 0.87 0.00 ± 1.72 1.000 1.000 1.000
AVBN.24 -0.37 ± 1.96 0.78 ± 1.70 0.38 ± 1.63 .670 .200 1.000
AVBN.13 -0.45 ± 1.33 -0.14 ± 1.32 0.04 ± 1.38 .880 1.000 1.000
AVBN.23 -0.25 ± 1.89 -0.44 ± 1.57 -0.16 ± 1.72 1.000 1.000 1.000
AVBN.46 0.84 ± 2.04 0.15 ± 1.41 0.72 ± 2.01 1.000 .890 1.000
AVBN.36 0.55 ± 1.73 0.78 ± 1.85 0.79 ± 1.80 1.000 1.000 1.000

86
MENT_R 0.71 ± 1.55 0.92 ± 1.25 0.04 ± 1.28 .490 1.000 .220
MENT_L 0.43 ± 1.95 0.68 ± 1.55 0.35 ± 1.57 1.000 1.000 1.000
IORB_R 1.13 ± 1.82 0.48 ± 1.23 0.58 ± 1.55 .930 .730 1.000
IORB_L 0.95 ± 1.28 -0.36 ± 1.45 0.61 ± 1.30 1.000 .020 * .140
*: statistically significant P < 0.05, **: statistically significant P < 0.01.
Table 4-7. Between-Group Comparisons: Antero-posterior treatment changes (T2-T1), based on
orthogonal distances from landmark to Frontal Plane for all three groups.
B-RME Ctrl T-RME B-RME-T-RME B-RME-Ctrl T-RME-Ctrl
Variable Group Mean ± S.D. (mm) P-value for Group Differences
PULP.16 -0.11 ± 1.54 0.40 ± 1.58 -0.35 ± 1.38 1.000 .990 .460
PULP.26 -0.24 ± 1.34 0.31 ± 0.99 -0.41 ± 1.41 1.000 .670 .330
PULP.14 0.35 ± 1.27 0.50 ± 1.38 -0.78 ± 1.62 .080 1.000 .040 *
PULP.24 0.53 ± 1.36 0.42 ± 1.56 -0.44 ± 1.61 .210 1.000 .330
PULP.13 -0.07 ± 1.18 -0.53 ± 1.90 0.20 ± 1.16 1.000 1.000 .470
PULP.23 0.48 ± 0.91 -0.31 ± 1.71 -0.06 ± 1.54 .830 .360 1.000
PULP.46 0.25 ± 1.43 0.23 ± 1.71 0.12 ± 1.94 1.000 1.000 1.000
PULP.36 0.11 ± 1.89 0.36 ± 1.76 0.21 ± 1.96 1.000 1.000 1.000
APEX.16 0.74 ± 1.57 0.44 ± 1.98 -0.72 ± 1.11 .030 * 1.000 .120
APEX.26 0.57 ± 1.54 0.06 ± 0.90 -0.66 ± 1.02 .010 * .680 .260
APEX.14 0.53 ± 1.17 0.33 ± 1.30 -0.36 ± 1.62 .200 1.000 .480
APEX.24 0.04 ± 1.16 0.37 ± 1.02 -0.33 ± 1.48 1.000 1.000 .340
APEX.13 0.31 ± 1.10 0.25 ± 1.03 -0.80 ± 1.75 .060 1.000 .090
APEX.23 -0.02 ± 0.97 0.12 ± 0.75 -0.32 ± 1.17 1.000 1.000 .600
APEX.46 0.83 ± 1.91 0.91 ± 2.77 0.57 ± 2.09 1.000 1.000 1.000
APEX.36 0.53 ± 2.02 0.78 ± 3.04 1.26 ± 2.23 1.000 1.000 1.000
AVBN.16 0.79 ± 1.81 0.26 ± 1.77 -0.74 ± 1.38 .030 * 1.000 .270

87
AVBN.26 0.39 ± 1.44 -0.06 ± 1.55 -0.41 ± 0.92 .250 1.000 1.000
AVBN.14 0.38 ± 1.15 0.45 ± 1.28 -0.29 ± 1.44 .420 1.000 .320
AVBN.24 0.06 ± 1.08 0.56 ± 1.11 -0.37 ± 1.47 .960 .760 .110
AVBN.13 -0.14 ± 0.79 -0.15 ± 0.83 -0.22 ± 0.79 1.000 1.000 1.000
AVBN.23 0.21 ± 0.82 -0.11 ± 0.72 -0.07 ± 1.03 1.000 .890 1.000
AVBN.46 0.74 ± 1.80 1.05 ± 2.70 1.02 ± 2.13 1.000 1.000 1.000
AVBN.36 0.61 ± 2.31 1.26 ± 2.88 1.36 ± 2.40 1.000 1.000 1.000
MENT_R 0.82 ± 1.57 1.46 ± 2.68 0.88 ± 2.68 1.000 1.000 1.000
MENT_L 0.94 ± 1.88 1.59 ± 2.53 1.21 ± 2.80 1.000 1.000 1.000
GPF_R 0.14 ± 0.84 0.48 ± 1.32 0.17 ± 1.36 1.000 1.000 1.000
GPF_L 0.37 ± 0.83 -0.09 ± 0.90 0.44 ± 1.17 1.000 .550 .370
*: statistically significant P < 0.05, **: statistically significant P < 0.01.
Table 4-8. Within-Group comparisons: Left- to Right-side discrepancy in treatment changes (T2-
T1), based on orthogonal distances to the mid-sagittal 3-D plane, for all three groups.
Point A - Point B B-RME Ctrl T-RME
A) R-sided
Landmarks
B) L-sided
Landmarks
Mean
(mm) (95% CI)
P-
value
Mean
(mm) (95% CI)
P-
value
Mean
(mm) (95% CI)
P-
value
PULP.16 PULP.26 -0.60 (-2.4, 1.2) 1.000 0.85 (-1.6, 2.6) 1.000 0.10 (-1.7, 1.9) 1.000
PULP.14 PULP.24 -0.05 (-1.8, 1.7) 1.000 0.44 (-1.4, 2.3) 1.000 -0.06 (-1.8, 1.7) 1.000
PULP.13 PULP.23 0.25 (-1.4, 1.9) 1.000 0.44 (-1.2, 2.1) 1.000 0.14 (-1.5, 1.8) 1.000
PULP.46 PULP.36 0.38 (-1.6, 2.4) 1.000 0.55 (-1.5, 2.6) 1.000 -0.41 (-2.4, 1.6) 1.000
MENT.R MENT.L 0.24 (-2.3, 2.8) 1.000 0.23 (-2.4, 2.8) 1.000 -0.23 (-2.8, 2.3) 1.000
IORB.R IORB.L 0.71 (-1.6, 3.0) 1.000 0.05 (-2.3, 2.4) 1.000 0.49 (-1.8, 2.8) 1.000
GPF.R GPF.L -0.18 (-1.2, 0.8) 1.000 0.32 (-0.7, 1.4) 1.000 -0.07 (-1.1, 0.9) 1.000
*: statistically significant P < 0.05, **: statistically significant P < 0.01.

88
Table 4-9. Within-Group B-RME comparisons: transverse discrepancy in treatment changes (T2-T1)
between TAD- and Implant-side.
Transverse TAD-anchor side Implant-anchor side TAD - IMP TAD - IMP
Variables Mean ± S.D. (mm) Mean ± S.D. (mm) Mean ± S.E. (mm) P-value (approx.)
PULP.16 (R-side) 2.03 ± 1.31 1.33 ± 1.09 0.70 ± 0.63 .285
PULP.26 (L-side) 3.58 ± 1.70 1.74 ± 1.05 1.84 ± 0.74 .014 *
APEX.16 (R-side) 1.29 ± 1.40 1.06 ± 0.74 0.23 ± 0.62 .710
APEX.26 (L-side) 1.53 ± 1.58 0.70 ± 0.54 0.84 ± 0.71 .120
PULP.14 (R-side) 1.24 ± 1.46 0.69 ± 1.08 0.55 ± 0.68 .434
PULP.24 (L-side) 2.02 ± 1.06 0.58 ± 0.90 1.43 ± 0.75 .010 **
APEX.14 (R-side) 0.90 ± 1.41 0.59 ± 0.98 0.31 ± 0.65 .640
APEX.24 (L-side) 1.80 ± 0.79 0.36 ± 0.99 1.44 ± 0.81 .008 **
*: statistically significant P < 0.05, **: statistically significant P < 0.01.
Table 4-10. Within-Group B-RME comparisons: vertical discrepancy in treatment changes (T2-T1)
between TAD- and Implant-side.
Vertical TAD-anchor side Implant-anchor side TAD - IMP TAD - IMP
Variables Mean ± S.D. (mm) Mean ± S.D. (mm) Mean ± S.E. (mm)
(mm)(mm)
P-value (approx.)
IORB.R (R-side) 1.62 ± 1.68 0.22 ± 1.87 1.40 ± 0.88 .134
IORB.L (L-side) 1.50 ± 1.10 -0.06 ± 0.99 1.56 ± 0.74 .011 *
*: statistically significant P < 0.05, **: statistically significant P < 0.01.
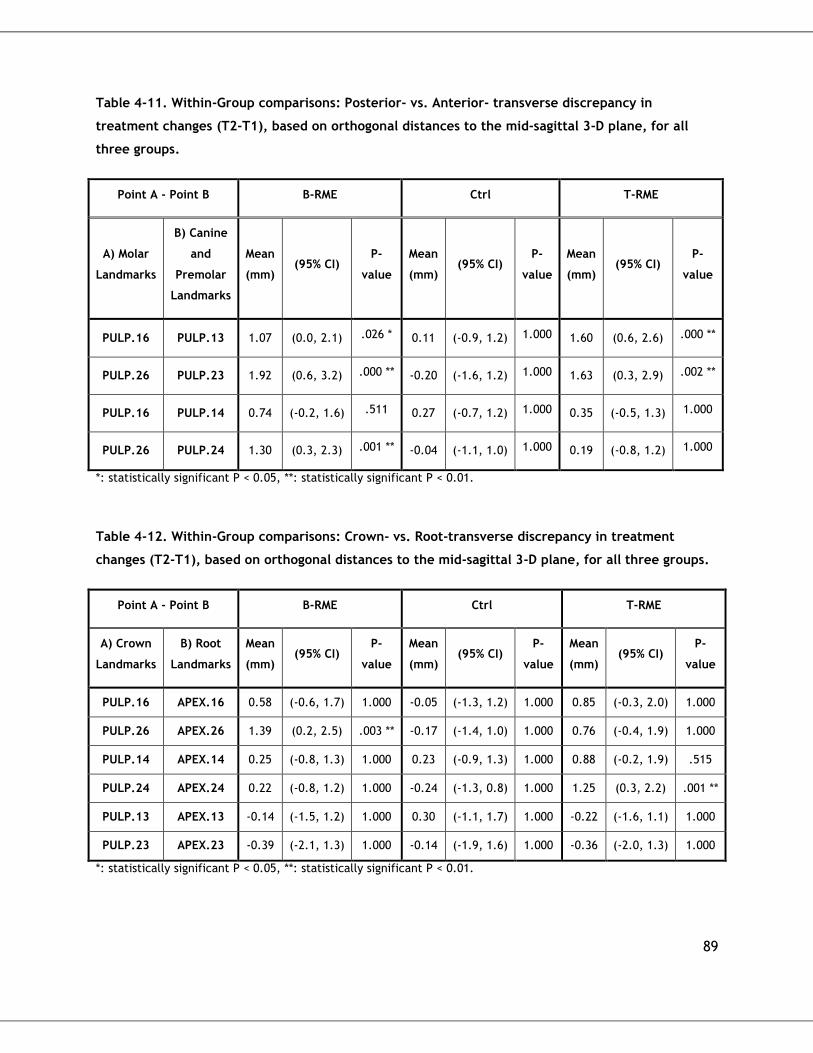
89
Table 4-11. Within-Group comparisons: Posterior- vs. Anterior- transverse discrepancy in
treatment changes (T2-T1), based on orthogonal distances to the mid-sagittal 3-D plane, for all
three groups.
Point A - Point B B-RME Ctrl T-RME
A) Molar
Landmarks
B) Canine
and
Premolar
Landmarks
Mean
(mm) (95% CI)
P-
value
Mean
(mm) (95% CI)
P-
value
Mean
(mm) (95% CI)
P-
value
PULP.16 PULP.13 1.07 (0.0, 2.1) .026 * 0.11 (-0.9, 1.2) 1.000 1.60 (0.6, 2.6) .000 **
PULP.26 PULP.23 1.92 (0.6, 3.2) .000 ** -0.20 (-1.6, 1.2) 1.000 1.63 (0.3, 2.9) .002 **
PULP.16 PULP.14 0.74 (-0.2, 1.6) .511 0.27 (-0.7, 1.2) 1.000 0.35 (-0.5, 1.3) 1.000
PULP.26 PULP.24 1.30 (0.3, 2.3) .001 ** -0.04 (-1.1, 1.0) 1.000 0.19 (-0.8, 1.2) 1.000
*: statistically significant P < 0.05, **: statistically significant P < 0.01.
Table 4-12. Within-Group comparisons: Crown- vs. Root-transverse discrepancy in treatment
changes (T2-T1), based on orthogonal distances to the mid-sagittal 3-D plane, for all three groups.
Point A - Point B B-RME Ctrl T-RME
A) Crown
Landmarks
B) Root
Landmarks
Mean
(mm) (95% CI)
P-
value
Mean
(mm) (95% CI)
P-
value
Mean
(mm) (95% CI)
P-
value
PULP.16 APEX.16 0.58 (-0.6, 1.7) 1.000 -0.05 (-1.3, 1.2) 1.000 0.85 (-0.3, 2.0) 1.000
PULP.26 APEX.26 1.39 (0.2, 2.5) .003 ** -0.17 (-1.4, 1.0) 1.000 0.76 (-0.4, 1.9) 1.000
PULP.14 APEX.14 0.25 (-0.8, 1.3) 1.000 0.23 (-0.9, 1.3) 1.000 0.88 (-0.2, 1.9) .515
PULP.24 APEX.24 0.22 (-0.8, 1.2) 1.000 -0.24 (-1.3, 0.8) 1.000 1.25 (0.3, 2.2) .001 **
PULP.13 APEX.13 -0.14 (-1.5, 1.2) 1.000 0.30 (-1.1, 1.7) 1.000 -0.22 (-1.6, 1.1) 1.000
PULP.23 APEX.23 -0.39 (-2.1, 1.3) 1.000 -0.14 (-1.9, 1.6) 1.000 -0.36 (-2.0, 1.3) 1.000
*: statistically significant P < 0.05, **: statistically significant P < 0.01.
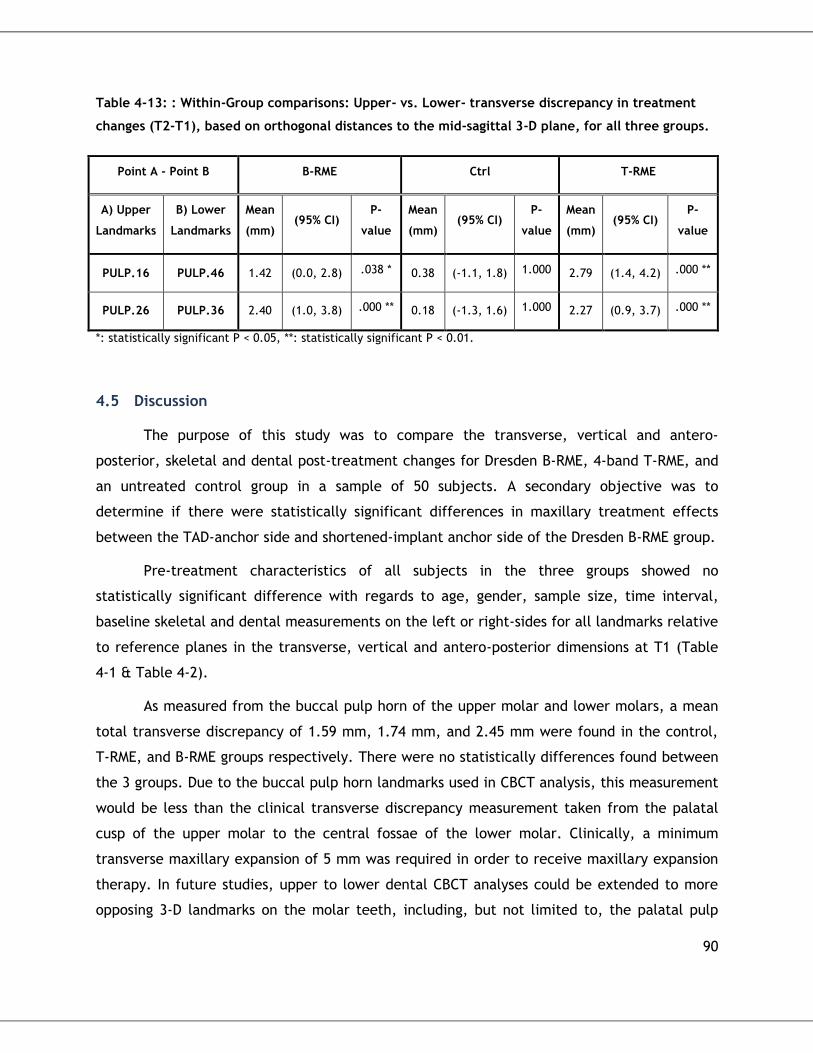
90
Table 4-13: : Within-Group comparisons: Upper- vs. Lower- transverse discrepancy in treatment
changes (T2-T1), based on orthogonal distances to the mid-sagittal 3-D plane, for all three groups.
Point A - Point B B-RME Ctrl T-RME
A) Upper
Landmarks
B) Lower
Landmarks
Mean
(mm) (95% CI)
P-
value
Mean
(mm) (95% CI)
P-
value
Mean
(mm) (95% CI)
P-
value
PULP.16 PULP.46 1.42 (0.0, 2.8) .038 * 0.38 (-1.1, 1.8) 1.000 2.79 (1.4, 4.2) .000 **
PULP.26 PULP.36 2.40 (1.0, 3.8) .000 ** 0.18 (-1.3, 1.6) 1.000 2.27 (0.9, 3.7) .000 **
*: statistically significant P < 0.05, **: statistically significant P < 0.01.
4.5 Discussion
The purpose of this study was to compare the transverse, vertical and antero-
posterior, skeletal and dental post-treatment changes for Dresden B-RME, 4-band T-RME, and
an untreated control group in a sample of 50 subjects. A secondary objective was to
determine if there were statistically significant differences in maxillary treatment effects
between the TAD-anchor side and shortened-implant anchor side of the Dresden B-RME group.
Pre-treatment characteristics of all subjects in the three groups showed no
statistically significant difference with regards to age, gender, sample size, time interval,
baseline skeletal and dental measurements on the left or right-sides for all landmarks relative
to reference planes in the transverse, vertical and antero-posterior dimensions at T1 (Table
4-1 & Table 4-2).
As measured from the buccal pulp horn of the upper molar and lower molars, a mean
total transverse discrepancy of 1.59 mm, 1.74 mm, and 2.45 mm were found in the control,
T-RME, and B-RME groups respectively. There were no statistically differences found between
the 3 groups. Due to the buccal pulp horn landmarks used in CBCT analysis, this measurement
would be less than the clinical transverse discrepancy measurement taken from the palatal
cusp of the upper molar to the central fossae of the lower molar. Clinically, a minimum
transverse maxillary expansion of 5 mm was required in order to receive maxillary expansion
therapy. In future studies, upper to lower dental CBCT analyses could be extended to more
opposing 3-D landmarks on the molar teeth, including, but not limited to, the palatal pulp
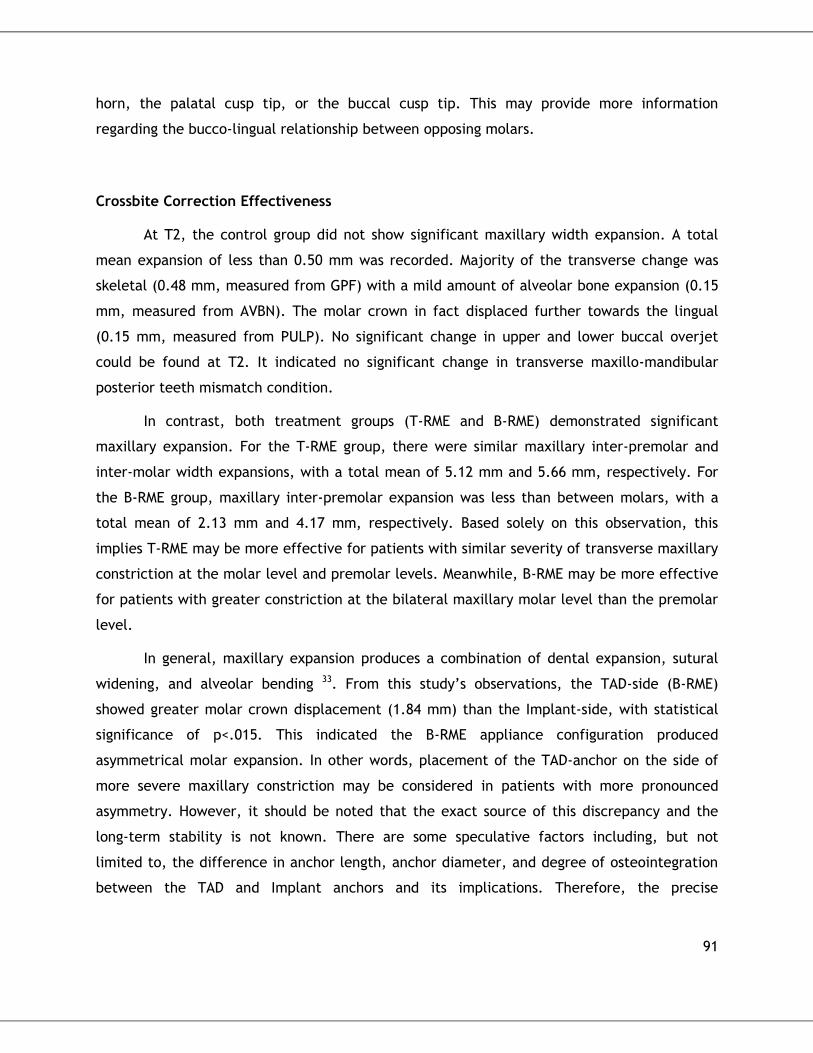
91
horn, the palatal cusp tip, or the buccal cusp tip. This may provide more information
regarding the bucco-lingual relationship between opposing molars.
Crossbite Correction Effectiveness
At T2, the control group did not show significant maxillary width expansion. A total
mean expansion of less than 0.50 mm was recorded. Majority of the transverse change was
skeletal (0.48 mm, measured from GPF) with a mild amount of alveolar bone expansion (0.15
mm, measured from AVBN). The molar crown in fact displaced further towards the lingual
(0.15 mm, measured from PULP). No significant change in upper and lower buccal overjet
could be found at T2. It indicated no significant change in transverse maxillo-mandibular
posterior teeth mismatch condition.
In contrast, both treatment groups (T-RME and B-RME) demonstrated significant
maxillary expansion. For the T-RME group, there were similar maxillary inter-premolar and
inter-molar width expansions, with a total mean of 5.12 mm and 5.66 mm, respectively. For
the B-RME group, maxillary inter-premolar expansion was less than between molars, with a
total mean of 2.13 mm and 4.17 mm, respectively. Based solely on this observation, this
implies T-RME may be more effective for patients with similar severity of transverse maxillary
constriction at the molar level and premolar levels. Meanwhile, B-RME may be more effective
for patients with greater constriction at the bilateral maxillary molar level than the premolar
level.
In general, maxillary expansion produces a combination of dental expansion, sutural
widening, and alveolar bending 33. From this study’s observations, the TAD-side (B-RME)
showed greater molar crown displacement (1.84 mm) than the Implant-side, with statistical
significance of p<.015. This indicated the B-RME appliance configuration produced
asymmetrical molar expansion. In other words, placement of the TAD-anchor on the side of
more severe maxillary constriction may be considered in patients with more pronounced
asymmetry. However, it should be noted that the exact source of this discrepancy and the
long-term stability is not known. There are some speculative factors including, but not
limited to, the difference in anchor length, anchor diameter, and degree of osteointegration
between the TAD and Implant anchors and its implications. Therefore, the precise
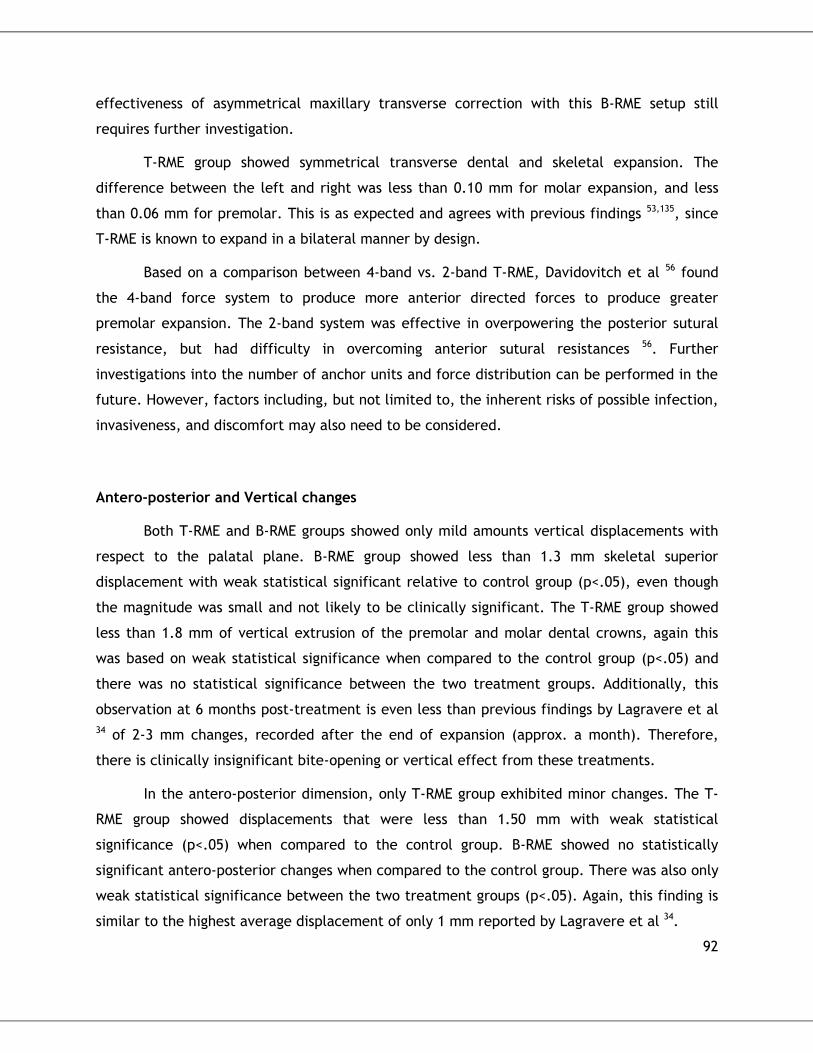
92
effectiveness of asymmetrical maxillary transverse correction with this B-RME setup still
requires further investigation.
T-RME group showed symmetrical transverse dental and skeletal expansion. The
difference between the left and right was less than 0.10 mm for molar expansion, and less
than 0.06 mm for premolar. This is as expected and agrees with previous findings 53,135, since
T-RME is known to expand in a bilateral manner by design.
Based on a comparison between 4-band vs. 2-band T-RME, Davidovitch et al 56 found
the 4-band force system to produce more anterior directed forces to produce greater
premolar expansion. The 2-band system was effective in overpowering the posterior sutural
resistance, but had difficulty in overcoming anterior sutural resistances 56. Further
investigations into the number of anchor units and force distribution can be performed in the
future. However, factors including, but not limited to, the inherent risks of possible infection,
invasiveness, and discomfort may also need to be considered.
Antero-posterior and Vertical changes
Both T-RME and B-RME groups showed only mild amounts vertical displacements with
respect to the palatal plane. B-RME group showed less than 1.3 mm skeletal superior
displacement with weak statistical significant relative to control group (p<.05), even though
the magnitude was small and not likely to be clinically significant. The T-RME group showed
less than 1.8 mm of vertical extrusion of the premolar and molar dental crowns, again this
was based on weak statistical significance when compared to the control group (p<.05) and
there was no statistical significance between the two treatment groups. Additionally, this
observation at 6 months post-treatment is even less than previous findings by Lagravere et al
34 of 2-3 mm changes, recorded after the end of expansion (approx. a month). Therefore,
there is clinically insignificant bite-opening or vertical effect from these treatments.
In the antero-posterior dimension, only T-RME group exhibited minor changes. The T-
RME group showed displacements that were less than 1.50 mm with weak statistical
significance (p<.05) when compared to the control group. B-RME showed no statistically
significant antero-posterior changes when compared to the control group. There was also only
weak statistical significance between the two treatment groups (p<.05). Again, this finding is
similar to the highest average displacement of only 1 mm reported by Lagravere et al 34.
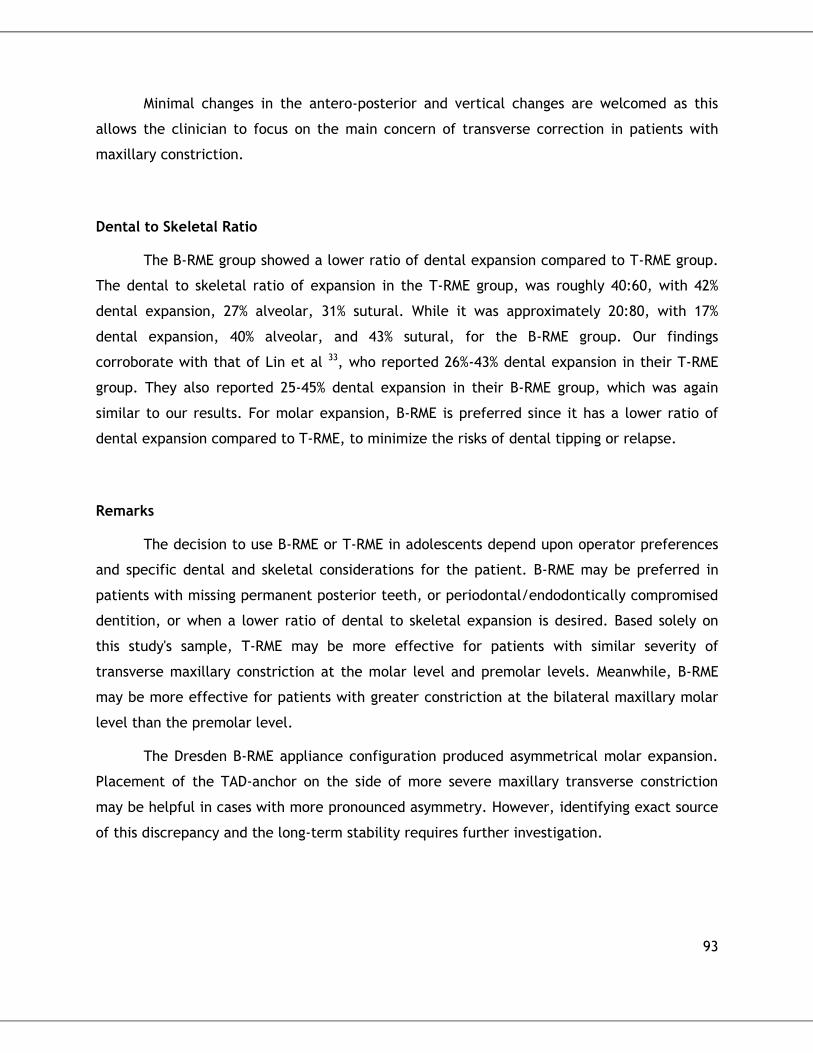
93
Minimal changes in the antero-posterior and vertical changes are welcomed as this
allows the clinician to focus on the main concern of transverse correction in patients with
maxillary constriction.
Dental to Skeletal Ratio
The B-RME group showed a lower ratio of dental expansion compared to T-RME group.
The dental to skeletal ratio of expansion in the T-RME group, was roughly 40:60, with 42%
dental expansion, 27% alveolar, 31% sutural. While it was approximately 20:80, with 17%
dental expansion, 40% alveolar, and 43% sutural, for the B-RME group. Our findings
corroborate with that of Lin et al 33, who reported 26%-43% dental expansion in their T-RME
group. They also reported 25-45% dental expansion in their B-RME group, which was again
similar to our results. For molar expansion, B-RME is preferred since it has a lower ratio of
dental expansion compared to T-RME, to minimize the risks of dental tipping or relapse.
Remarks
The decision to use B-RME or T-RME in adolescents depend upon operator preferences
and specific dental and skeletal considerations for the patient. B-RME may be preferred in
patients with missing permanent posterior teeth, or periodontal/endodontically compromised
dentition, or when a lower ratio of dental to skeletal expansion is desired. Based solely on
this study's sample, T-RME may be more effective for patients with similar severity of
transverse maxillary constriction at the molar level and premolar levels. Meanwhile, B-RME
may be more effective for patients with greater constriction at the bilateral maxillary molar
level than the premolar level.
The Dresden B-RME appliance configuration produced asymmetrical molar expansion.
Placement of the TAD-anchor on the side of more severe maxillary transverse constriction
may be helpful in cases with more pronounced asymmetry. However, identifying exact source
of this discrepancy and the long-term stability requires further investigation.

94
4.5.1 Limitations
While there was a sufficient pool of subjects (34) in the two treatment groups
combined, this number did limit us from further assessing relationships between the TAD-side
and Implant-side within the B-RME group. It also limited further investigations based on
skeletal maturity which may influence final treatment outcomes. Furthermore, this clinical
study also evaluated the skeletal and dental post-expansion changes over a relatively short
period of time (6 months), and hence long-term inferences cannot be made.
Since this chapter's work is based on the previous chapter, all the limitations
mentioned in section 3.9.5 still applies.
4.6 Summary & Conclusions
Transverse
Both treatment groups (T-RME and B-RME) showed proper bucco-lingual molar
interdigitation at this 6 month observation.
T-RME group showed symmetrical premolar and molar expansion.
The Dresden B-RME appliance configuration did produce asymmetrical molar expansion.
The TAD-anchor side of B-RME, showed greater molar crown displacement (mean 1.84
mm) than the Implant-anchor side, with statistical significance of p<.015.
Antero-posterior
T-RME group showed minimal anterior displacement of molar apex and premolar crown (<
1.5 mm), compared to other groups, with only weak statistical significance (p<.05).
No significant antero-posterior changes were found for B-RME group.
Posterior versus Anterior transverse discrepancy
T-RME group showed greater expansion between the upper molar than between canines by
1.6 mm per side, with statistical significance (p<.002). No statistical significant
differences between inter-molar and inter-premolar expansion were found.
In the B-RME group, both the TAD- and Implant-sides produced greater expansion between
upper molars than between canines. This difference was 1.1 mm on the Implant-side, and
1.9 mm on the TAD-side, with statistical significance (p<.001).

95
In the B-RME group, only the TAD-side produced greater upper inter-molar expansion than
the inter-premolar (1.3 mm; p<.001). This was not statistically significant on the Implant-
side (p=1.000).
Vertical
T-RME showed some dental vertical extrusion of premolar and molar crowns (< 1.8 mm ;
p<.05), relative to control group.
No significant dental vertical changes were found for the B-RME group. Minimal skeletal
superior displacement at infra-orbital foramen (IORB) was noted for B-RME group (mean <
1.3 mm ; p<.05), relative to control group.
Vertical changes were minimal and non-significant between the B-RME and T-RME groups.
Dental to Skeletal Ratio
The dental to skeletal ratio of expansion in the T-RME group, was roughly 40:60, with 42%
dental expansion, 27% alveolar, 31% sutural.
The dental to skeletal ratio of expansion in the B-RME group was approximately 20:80,
with 17% dental expansion, 40% alveolar, and 43% sutural.
4.7 Future recommendations:
1) A more in-depth analysis can be conducted to evaluate the effects of expansion treatment
on arch symmetry. This would involve a new randomized clinical trial that accounts for
the level of pre-treatment asymmetry. In the case of Dresden B-RME, for example,
patients that were significantly asymmetric at pre-treatment should have the TAD
inserted into the side with shorter distance from the maxillary midline(greater maxillary
constriction), and test for symmetry correction relative to controls. Thus, a careful
selection of side for implant placement is crucial to identify the true asymmetry effects of
expansion.
2) Final symmetry of both the mandibular and maxillary arches relative to the mid-sagittal
plane can also be examined. Spontaneous correction of mandibular symmetry corection
could also be investigated.

96
3) Specifically for posterior crossbites, future studies can evaluate how well the mandibular
and maxillary molars, premolars, canines are interdigitated. This may involve use of
landmarks on other parts of a tooth (eg. multiple pulp horns, cusp tips, or root tips) in
addition to the buccal pulp horns used in this study.
4) Further investigation may investigate the interaction between arch perimeter availability
in any quadrants of the maxilla in relation to anterior or posterior dental midlines changes
after expansion treatment. Dental midline deviations can also be compared with any
skeletal midline deviations.
5) Further investigation is needed to examine the effect of mandibular dental tipping and
crowding compensations which may contribute to the maxillo-mandibular transverse
discrepancy and dental interdigitation. This may involve the use of more 3-D landmarks in
the mandible than could be covered in this study.
6) This 3-D measurement technique could be extended to assess other orthodontic
treatments and the effects.
7) Further investigation can be conducted to more extensively validate the effectiveness of
this mathematically calculated plane, versus a manually defined plane. In particular, the
researcher should focus on the amount of time required to define such a plane, the
variations and accuracies compared to manually defined planes, and therefore, be able to
quantitatively demonstrate this new technique's reliability.
8) The landmarks PVID.L&R and OVALE.L&R could be useful reference landmarks to consider
for reference plane construction in future studies.

97
4.8 References
1. McNamara JA. Maxillary transverse deficiency. American Journal of Orthodontics and Dentofacial Orthopedics 2000;117:567-570.
8. Bishara SE, Staley RN. Maxillary expansion: clinical implications. American Journal of Orthodontics and Dentofacial Orthopedics 1987;91:3-14.
9. Lagravère MO, Heo G, Major PW, Flores-Mir C. Meta-analysis of immediate changes with rapid maxillary expansion treatment. The Journal of the American Dental Association 2006;137:44-53.
10. Bell RA. A review of maxillary expansion in relation to rate of expansion and patient's age. American journal of orthodontics 1982;81:32-37.
11. Kennedy DB, Osepchook M. Unilateral posterior crossbite with mandibular shift: a review. Journal-Canadian Dental Association 2005;71:569.
13. Lagravere MO, Major PW, Flores-Mir C. Long-term dental arch changes after rapid maxillary expansion treatment: a systematic review. The Angle orthodontist 2005;75:155-161.
24. Lagravère MO, Gordon JM, Guedes IH, Flores-Mir C, Carey JP, Heo G et al. Reliability of traditional cephalometric landmarks as seen in three-dimensional analysis in maxillary expansion treatments. The Angle orthodontist 2009;79:1047-1056.
33. Lin L, Ahn H-W, Kim S-J, Moon S-C, Kim S-H, Nelson G. Tooth-borne vs bone-borne rapid maxillary expanders in late adolescence. The Angle Orthodontist 2014;85:253-262.
34. Lagravère MO, Carey J, Heo G, Toogood RW, Major PW. Transverse, vertical, and anteroposterior changes from bone-anchored maxillary expansion vs traditional rapid maxillary expansion: A randomized clinical trial. American Journal of Orthodontics and Dentofacial Orthopedics 2010;137:304.e301-304.e312.
35. Krebs A. Expansion of the midpalatal suture, studied by means of metallic implants. Acta Odontologica Scandinavica 1959;17:491-501.
36. Wehrbein H, Göllner P. Skeletal Anchorage in Orthodontics – Basics and Clinical Application. Journal of Orofacial Orthopedics / Fortschritte der Kieferorthopädie 2007;68:443-461.
37. Hansen L, Tausche E, Hietschold V, Hotan T, Lagravère M, Harzer W. Skeletally-anchored Rapid Maxillary Expansion using the Dresden Distractor. Journal of Orofacial Orthopedics / Fortschritte der Kieferorthopädie 2007;68:148-158.
39. Tausche E, Hansen L, Hietschold V, Lagravère MO, Harzer W. Three-dimensional evaluation of surgically assisted implant bone-borne rapid maxillary expansion: A pilot study. American Journal of Orthodontics and Dentofacial Orthopedics 2007;131:S92-S99.
44. Thilander B, Wahlund S, Lennartsson B. The effect of early interceptive treatment in children with posterior cross-bite. The European Journal of Orthodontics 1984;6:25-34.
53. Ileri Z, Basciftci FA. Asymmetric rapid maxillary expansion in true unilateral crossbite malocclusion: A prospective controlled clinical study. The Angle Orthodontist 2015;85:245-252.

98
56. Davidovitch M, Efstathiou S, Sarne O, Vardimon AD. Skeletal and dental response to rapid maxillary expansion with 2-versus 4-band appliances. American Journal of Orthodontics and Dentofacial Orthopedics 2005;127:483-492.
75. Ferro F, Spinella P, Lama N. Transverse maxillary arch form and mandibular asymmetry in patients with posterior unilateral crossbite. American Journal of Orthodontics and Dentofacial Orthopedics 2011;140:828-838.
116. Portney L WM. Foundations of clinical research: applications to practice.: Prentice Hall, Upper Saddle River 2008.
132. Garib DG, Henriques JF, Carvalho PE, Gomes SC. Longitudinal effects of rapid maxillary expansion. Angle Orthod 2007;77:442-448.
133. Chang JY, McNamara JA, Jr., Herberger TA. A longitudinal study of skeletal side effects induced by rapid maxillary expansion. Am J Orthod Dentofacial Orthop 1997;112:330-337.
134. Brin I, Ben-Bassat Y, Blustein Y, Ehrlich J, Hochman N, Marmary Y et al. Skeletal and functional effects of treatment for unilateral posterior crossbite. Am J Orthod Dentofacial Orthop 1996;109:173-179.
135. Marshall SD, Southard KA, Southard TE. Early transverse treatment Seminars in Orthodontics: Elsevier; 2005: p. 130-139.

99
Chapter 5

100
5. Summary of findings
5.1 Introduction
Posterior crossbite is one of the most easily recognized clinical signs that result from a
transverse constricted maxilla 1. This narrow maxillary width relative to the mandible, causes
a mismatch between opposing posterior teeth 1,8,9. Conventional correction of maxillary
constriction was primarily done through use of a Tooth-borne Rapid Maxillary Expander (RME).
Due to its dental attachment, T-RME has been reported to induce greater dental than skeletal
expansion (70% dental vs. 30% skeletal)35 Mild levels of undesirable maxillary molar crown
tipping, and bite opening have been reported in previous studies evaluating short-term
effects of T-RME, although this has not been consistent throughout the literature 13,34,132,133.
Consequently, B-RME was designed to hopefully reduce this dental side-effect 36,37. B-RME
attempts to minimize dental structures disturbance and maximize skeletal expansion by
directly inserting either shortened palatal implants or temporary anchorage devices (TADs)
36,37 into the two halves of the bony maxillary palate.
The Dresden B-RME design was chosen to be used in adolescents for the first time in
this study. This appliance had been used in two previous studies on ten mature adult patients
who underwent surgically-assisted rapid maxillary expansion in the study by Tausche et al and
Hansen et al 37,39.The Dresden B-RME has a unique design feature where it is anchored by an
osteointegrated implant on one side and a mini-implant-anchor (a.k.a. Temporary Anchorage
Devices, or TAD) on the other.
Efforts from chapter 3 provided a set of 3-D reference planes that has been
experimentally proven to be accurate and reliable. Using these planes along with selected
treatment landmarks allowed a quantitative measure of transverse, vertical, and antero-
posterior changes after T-RME/B-RME/no treatment after 6 months' observation.
The main objectives of this thesis were to
1) Identify accurate and easily repeatable (intra-examiner reliability) 3-D landmarks in the
cranial base, maxilla, and mandible which can be used to quantify treatment changes
after rapid maxillary expansion (RME).
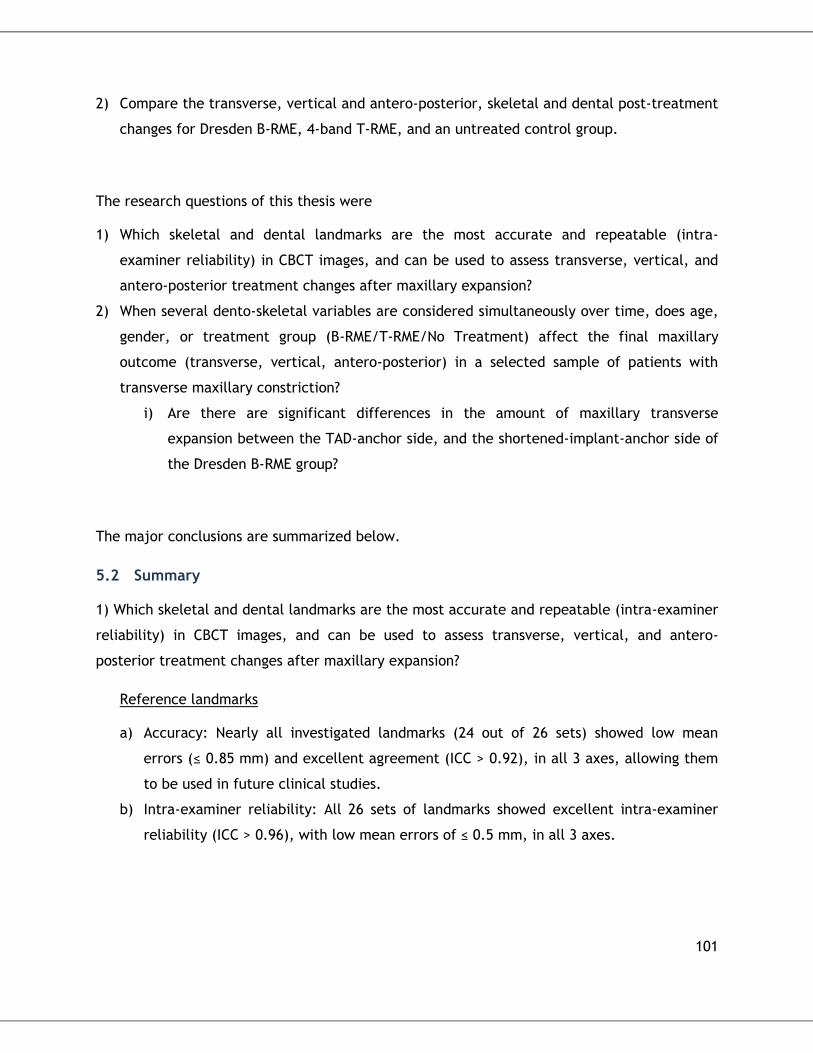
101
2) Compare the transverse, vertical and antero-posterior, skeletal and dental post-treatment
changes for Dresden B-RME, 4-band T-RME, and an untreated control group.
The research questions of this thesis were
1) Which skeletal and dental landmarks are the most accurate and repeatable (intra-
examiner reliability) in CBCT images, and can be used to assess transverse, vertical, and
antero-posterior treatment changes after maxillary expansion?
2) When several dento-skeletal variables are considered simultaneously over time, does age,
gender, or treatment group (B-RME/T-RME/No Treatment) affect the final maxillary
outcome (transverse, vertical, antero-posterior) in a selected sample of patients with
transverse maxillary constriction?
i) Are there are significant differences in the amount of maxillary transverse
expansion between the TAD-anchor side, and the shortened-implant-anchor side of
the Dresden B-RME group?
The major conclusions are summarized below.
5.2 Summary
1) Which skeletal and dental landmarks are the most accurate and repeatable (intra-examiner
reliability) in CBCT images, and can be used to assess transverse, vertical, and antero-
posterior treatment changes after maxillary expansion?
Reference landmarks
a) Accuracy: Nearly all investigated landmarks (24 out of 26 sets) showed low mean
errors (≤ 0.85 mm) and excellent agreement (ICC > 0.92), in all 3 axes, allowing them
to be used in future clinical studies.
b) Intra-examiner reliability: All 26 sets of landmarks showed excellent intra-examiner
reliability (ICC > 0.96), with low mean errors of ≤ 0.5 mm, in all 3 axes.

102
Landmarks used for reference plane construction
c) The preferred landmarks for mid-sagittal plane were: Mid.Nasopalatine Foramen
(Mid.NPF), Mesial Dorsal Foramen Magnum (MDFM), and Foramen Spinosum (SPIN).
d) The preferred landmarks for frontal plane were: Infra-orbital foramina (IORB) left &
right, and Mid.NPF.
e) The preferred landmarks for palatal plane were: Greater palatine foramina (GPF) left
& right, and Mid.NPF.
f) These combinations and landmarks, proved to be comparatively superior to other
options.
g) Based on three repeatedly constructed reference planes for 10 dry skulls as assessed
using twenty selected landmarks, low mean errors (≤ 0.55 mm) were found in all 3
dimensions.
h) Further analysis to observe the mean errors of orthogonal distances from 3 repeated
treatment landmark measurements against an averaged reference plane, also showed
low mean errors (≤ 0.85 mm) in all 3 dimensions.
i) Measurement errors ≤ 1.5 mm are not likely to have clinical implications from past
literature.
Treatment Landmarks
j) All teeth root apices (tip), pulp horn (tip), and alveolar bone landmarks (AVBN)
showed good to excellent reliability and accuracy particularly in the transverse and
vertical dimension; and will be used in the future maxillary expansion assessment
study.
Remarks
Defining 3D planes can be difficult by itself due to the high degree of freedom in all 3
axes. This study’s premise is to have an easily repeatable process for measuring skeletal
and dental changes over time. Using this mathematical procedure, given the same
reference landmark coordinate input, the computed plane will always be the same. This is
a great improvement to earlier methods that requires the examiner to manually draw the
mid-sagittal plane, as it will eliminate any human error that process may introduce. It
should be noted that this mathematically constructed plane is still susceptible to the
measurement errors from the individual reference landmarks itself.

103
2) When several dento-skeletal variables are considered simultaneously over time, does age,
gender, or treatment group (B-RME/T-RME/No Treatment) affect the final maxillary outcome
(transverse, vertical, antero-posterior) in a selected sample of patients with maxillary
constriction?
i) Are there are significant differences in the amount of maxillary transverse expansion
between the TAD-anchor side, and the shortened-implant-anchor side of the Dresden
B-RME group?
Pre-treatment characteristics
Subjects of all three groups started with similar pre-treatment characteristics with
regards to pre-treatment dental and skeletal measurements, age, gender, sample size
and observation time interval.
Transverse
Both treatment groups (T-RME and B-RME) showed proper bucco-lingual molar
interdigitation at this 6 month observation.
T-RME group showed symmetrical premolar and molar expansion.
The Dresden B-RME appliance configuration did produce asymmetrical molar
expansion.
The TAD-anchor side of B-RME, showed greater molar crown displacement (1.84 mm)
than the Implant-anchor side, with statistical significance of p<.015.
Antero-posterior
T-RME group showed minimal anterior displacement of molar apex and premolar crown
(< 1.5 mm), compared to other groups, with only weak statistical significance (p<.05).
No significant antero-posterior changes were found for B-RME group.
Posterior versus Anterior transverse discrepancy
T-RME group showed greater expansion between the upper molar than between
canines by 1.6 mm per side, with statistical significance (p<.002). No statistical
significant differences between inter-molar and inter-premolar expansion were found.

104
In the B-RME group, both the TAD- and Implant-sides produced greater expansion
between upper molars than between canines. This difference was 1.1 mm on the
Implant-side, and 1.9 mm on the TAD-side, with statistical significance (p<.001).
In the B-RME group, only the TAD-side produced greater upper inter-molar expansion
than the inter-premolar (1.3 mm; p<.001). This was not statistically significant on the
Implant-side (p=1.000).
Vertical
T-RME showed some dental vertical extrusion of premolar and molar crowns (< 1.8 mm
; p<.05), relative to control group.
No significant dental vertical changes were found for the B-RME group. Minimal
skeletal superior displacement at infra-orbital foramen (IORB) was noted for B-RME
group (mean < 1.3 mm ; p<.05), relative to control group.
Vertical changes were minimal and non-significant between the B-RME and T-RME
groups.
Dental to Skeletal Ratio
The dental to skeletal ratio of expansion in the T-RME group, was roughly 40:60, with
42% dental expansion, 27% alveolar, 31% sutural.
The dental to skeletal ratio of expansion in the B-RME group was approximately 20:80,
with 17% dental expansion, 40% alveolar, and 43% sutural.
Remarks
The decision to use B-RME or T-RME in adolescents depend upon operator preferences
and specific dental and skeletal considerations for the patient. B-RME may be preferred in
patients with missing permanent posterior teeth, or periodontal/endodontically
compromised dentition, or when a lower ratio of dental to skeletal expansion is desired.
Based solely on this study's sample, T-RME may be more effective for patients with similar
severity of transverse maxillary constriction at the molar level and premolar levels.
Meanwhile, B-RME may be more effective for patients with greater constriction at the
bilateral maxillary molar level than the premolar level. In addition, the Dresden B-RME
appliance configuration produced asymmetrical molar expansion. Placement of the TAD-
anchor on the side of more severe maxillary transverse constriction may be helpful in
105
cases with more pronounced asymmetry. However, identifying exact source of this
discrepancy and the long-term stability requires further investigation.
5.3 Limitations:
5.3.1 Reliability & Accuracy chapter:
Numerous factors need to be considered when interpreting these results. Firstly, the
assessment of reference landmark accuracy and intra-examiner reliability was performed on
dry skulls. As pointed out by Periago et al 130, the presence of nerves or other soft tissue
structures inside the foramina may affect the accuracy of landmark identification. In attempt
to mimic the soft tissues around the skull, the principal investigator incorporated a Plexiglass
box filled with water around every skull prior to the CBCT scan, in efforts to reduce possible
error.
Secondly, the number of dry skull specimens used in this study was 10. As
recommended by Springate 131, increasing the number of specimens to 25 to 30 would reduce
sampling errors for the statistical analyses in such types of study.
Third, the bone quality and scan quality were factors not fully within our control. The
voxel size was 0.3 mm in this study, and this placed a limit to the accuracy level possible.
During dry skull selection, efforts were made to check for a full healthy posterior dentition
and intact bony structures. Furthermore, the dry skulls were not all collected from adolescent
age group which could be commonly seen in subjects requesting for orthodontic treatment.
The size and location of the foramina may show slight variation in dry skulls of the mid-ages.
Three-dimension visualization software such as the one used by this study (AVIZO)
requires substantial training and patience to operate in general. Locating a 3-D landmark
accurately requires constantly switching between the 3 axial planes on the monitor and
iterating through hundreds of orthogonal slices. At the fastest rate, a minimum of about 2
minutes was required per landmark, including landmark identification, verification in all 3
dimensions, and data input. This may change in the near future with 3-D monitors becoming
more commonly available.
106
5.3.2 Randomized Controlled Clinical trial chapter:
There was an adequate pool of subjects (34) in the two treatment groups combined,
however it did limit us from further assessing relationships between the TAD-side and
Implant-side within the B-RME group. It also limited further investigations based on skeletal
maturity which may influence final treatment outcomes. This clinical study also evaluated the
skeletal and dental post-expansion changes over a relatively short period of time (6 months),
and hence long-term inferences cannot be made.
Since this chapter's work is based on the previous chapter, all the limitations
mentioned in section 3.9.5 still applies.
5.4 Remarks
a) A more in-depth analysis can be conducted to evaluate the effects of expansion
treatment on arch symmetry. This would involve a new randomized clinical trial that
accounts for the level of pre-treatment asymmetry. In the case of Dresden B-RME, for
example, patients that were significantly asymmetric at pre-treatment should have
the TAD inserted into the side with shorter distance from the maxillary
midline(greater maxillary constriction), and test for symmetry correction relative to
controls. Thus, a careful selection of side for implant placement is crucial to identify
the true asymmetry effects of expansion.
b) Final symmetry of both the mandibular and maxillary arches relative to the mid-
sagittal plane can also be examined. Spontaneous correction of mandibular symmetry
corection could also be investigated.
c) Specifically for posterior crossbites, future studies can evaluate how well the
mandibular and maxillary molars, premolars, canines are interdigitated. This may
involve use of landmarks on other parts of a tooth (eg. multiple pulp horns, cusp tips,
or root tips) in addition to the buccal pulp horns used in this study.
d) Further investigation may investigate the interaction between arch perimeter
availability in any quadrants of the maxilla in relation to anterior or posterior dental
midlines changes after expansion treatment. Dental midline deviations can also be
compared with any skeletal midline deviations.

107
e) Further investigation is needed to examine the effect of mandibular dental tipping and
crowding compensations which may contribute to the maxillo-mandibular transverse
discrepancy and dental interdigitation. This may involve the use of more 3-D
landmarks in the mandible than could be covered in this study.
f) This 3-D measurement technique could be extended to assess other orthodontic
treatments and the effects.
g) Further investigation can be conducted to more extensively validate the effectiveness
of this mathematically calculated plane, versus a manually defined plane. In
particular, the researcher should focus on the amount of time required to define such
a plane, the variations and accuracies compared to manually defined planes, and
therefore, be able to quantitatively demonstrate this new technique's reliability.
h) The landmarks PVID.L&R and OVALE.L&R could be useful reference landmarks to
consider for reference plane construction in future studies.
i) Current common computer monitors and controls are mostly 2-D. Much patience is
required in locating 3-D landmarks accurately, including the constant switching
between the 3 planes on the monitor and iterating through hundreds of orthogonal
slices with a computer mouse. Once 3-D monitors become more commonly available,
identification of 3-D landmarks and reference planes may be greatly expedited.

108
5.5 References
1. McNamara JA. Maxillary transverse deficiency. American Journal of Orthodontics and Dentofacial Orthopedics 2000;117:567-570.
8. Bishara SE, Staley RN. Maxillary expansion: clinical implications. American Journal of Orthodontics and Dentofacial Orthopedics 1987;91:3-14.
9. Lagravère MO, Heo G, Major PW, Flores-Mir C. Meta-analysis of immediate changes with rapid maxillary expansion treatment. The Journal of the American Dental Association 2006;137:44-53.
13. Lagravere MO, Major PW, Flores-Mir C. Long-term dental arch changes after rapid maxillary expansion treatment: a systematic review. The Angle orthodontist 2005;75:155-161.
34. Lagravère MO, Carey J, Heo G, Toogood RW, Major PW. Transverse, vertical, and anteroposterior changes from bone-anchored maxillary expansion vs traditional rapid maxillary expansion: A randomized clinical trial. American Journal of Orthodontics and Dentofacial Orthopedics 2010;137:304.e301-304.e312.
35. Krebs A. Expansion of the midpalatal suture, studied by means of metallic implants. Acta Odontologica Scandinavica 1959;17:491-501.
36. Wehrbein H, Göllner P. Skeletal Anchorage in Orthodontics – Basics and Clinical Application. Journal of Orofacial Orthopedics / Fortschritte der Kieferorthopädie 2007;68:443-461.
37. Hansen L, Tausche E, Hietschold V, Hotan T, Lagravère M, Harzer W. Skeletally-anchored Rapid Maxillary Expansion using the Dresden Distractor. Journal of Orofacial Orthopedics / Fortschritte der Kieferorthopädie 2007;68:148-158.
39. Tausche E, Hansen L, Hietschold V, Lagravère MO, Harzer W. Three-dimensional evaluation of surgically assisted implant bone-borne rapid maxillary expansion: A pilot study. American Journal of Orthodontics and Dentofacial Orthopedics 2007;131:S92-S99.
130. Periago DR, Scarfe WC, Moshiri M, Scheetz JP, Silveira AM, Farman AG. Linear accuracy and reliability of cone beam CT derived 3-dimensional images constructed using an orthodontic volumetric rendering program. The Angle orthodontist 2008;78:387-395.
131. Springate S. The effect of sample size and bias on the reliability of estimates of error: a comparative study of Dahlberg's formula. The European Journal of Orthodontics 2012;34:158-163.
132. Garib DG, Henriques JF, Carvalho PE, Gomes SC. Longitudinal effects of rapid maxillary expansion. Angle Orthod 2007;77:442-448.
133. Chang JY, McNamara JA, Jr., Herberger TA. A longitudinal study of skeletal side effects induced by rapid maxillary expansion. Am J Orthod Dentofacial Orthop 1997;112:330-337.

109
Appendices
Appendix 1: Intra-class correlation coefficients (ICC), for Intra-examiner reliability of Dental landmarks, based
on three repeated measurements (in X,Y,Z axes)
X Y Z
Dental Landmarks
ICC
ICC (Lower Bound)
ICC (Upper Bound)
ICC
ICC (Lower Bound)
ICC (Upper Bound)
ICC
ICC (Lower Bound)
ICC (Upper Bound)
PULP.26 0.99 0.97 1.00 1.00 0.99 1.00 1.00 0.99 1.00
PULP.16 1.00 0.99 1.00 1.00 1.00 1.00 0.99 0.98 1.00
PULP.24 0.99 0.98 1.00 1.00 1.00 1.00 1.00 1.00 1.00
PULP.14 1.00 0.99 1.00 1.00 1.00 1.00 1.00 0.99 1.00
PULP.23 0.99 0.97 1.00 1.00 1.00 1.00 1.00 0.99 1.00
PULP.13 1.00 1.00 1.00 1.00 1.00 1.00 1.00 0.99 1.00
PULP.46 0.99 0.98 1.00 1.00 1.00 1.00 0.99 0.96 1.00
PULP.36 0.99 0.96 1.00 1.00 1.00 1.00 0.99 0.98 1.00
PULP.43 1.00 1.00 1.00 1.00 1.00 1.00 0.99 0.98 1.00
PULP.33 0.99 0.97 1.00 1.00 1.00 1.00 1.00 0.99 1.00
APEX.26 0.99 0.98 1.00 1.00 0.99 1.00 0.99 0.98 1.00
APEX.16 0.99 0.97 1.00 1.00 0.99 1.00 0.99 0.98 1.00
APEX.24 0.99 0.97 1.00 1.00 0.99 1.00 0.99 0.98 1.00
APEX.14 0.99 0.97 1.00 1.00 1.00 1.00 0.99 0.96 1.00
APEX.23 0.99 0.97 1.00 0.99 0.97 1.00 0.98 0.93 0.99
APEX.13 0.99 0.97 1.00 0.99 0.98 1.00 0.98 0.94 0.99
APEX.46 1.00 1.00 1.00 1.00 1.00 1.00 0.99 0.96 1.00
APEX.36 0.99 0.97 1.00 1.00 1.00 1.00 1.00 0.99 1.00
APEX.43 1.00 0.99 1.00 1.00 1.00 1.00 1.00 0.99 1.00
APEX.33 1.00 0.99 1.00 1.00 1.00 1.00 1.00 0.99 1.00
AVBN.26 0.97 0.91 0.99 0.99 0.97 1.00 0.99 0.98 1.00
AVBN.16 0.98 0.95 0.99 0.99 0.98 1.00 0.99 0.96 1.00
AVBN.24 1.00 0.98 1.00 1.00 0.99 1.00 0.99 0.98 1.00
AVBN.14 0.98 0.95 1.00 1.00 0.99 1.00 0.99 0.96 1.00
AVBN.23 0.97 0.93 0.99 0.98 0.95 1.00 0.98 0.94 0.99
AVBN.13 0.98 0.94 0.99 0.99 0.98 1.00 0.98 0.94 0.99
AVBN.46 0.99 0.98 1.00 1.00 1.00 1.00 0.99 0.96 1.00
AVBN.36 0.96 0.88 0.99 1.00 1.00 1.00 1.00 0.99 1.00
AVBN.43 0.99 0.96 1.00 1.00 1.00 1.00 1.00 0.99 1.00
AVBN.33 0.98 0.93 0.99 1.00 1.00 1.00 1.00 0.99 1.00

110
Appendix 2: Intra-class correlation coefficients (ICC), for Intra-examiner reliability for Skeletal landmarks,
based on three repeated measurements (in X,Y,Z axes)
X Y Z
Skeletal Landmarks
ICC
ICC (Lower Bound)
ICC (Upper Bound)
ICC
ICC (Lower Bound)
ICC (Upper Bound)
ICC
ICC (Lower Bound)
ICC (Upper Bound)
Cranial Base Foramina
CG 0.99 0.98 1.00 1.00 1.00 1.00 1.00 1.00 1.00
MDFM 0.99 0.96 1.00 1.00 1.00 1.00 1.00 1.00 1.00
EAM.L 1.00 1.00 1.00 1.00 1.00 1.00 1.00 1.00 1.00
EAM.R 1.00 1.00 1.00 1.00 1.00 1.00 1.00 1.00 1.00
MID.SPIN 1.00 0.99 1.00 1.00 0.99 1.00 1.00 1.00 1.00
HYPO.L 0.99 0.97 1.00 1.00 1.00 1.00 1.00 1.00 1.00
HYPO.R 0.98 0.93 0.99 1.00 0.99 1.00 1.00 1.00 1.00
OVAL.L 0.99 0.97 1.00 1.00 0.99 1.00 1.00 1.00 1.00
OVAL.R 0.99 0.98 1.00 1.00 0.99 1.00 1.00 1.00 1.00
ROT.L 1.00 1.00 1.00 1.00 1.00 1.00 1.00 1.00 1.00
ROT.R 1.00 0.99 1.00 1.00 0.99 1.00 1.00 1.00 1.00
SPIN.L 1.00 0.99 1.00 1.00 0.99 1.00 1.00 1.00 1.00
SPIN.R 1.00 0.99 1.00 1.00 0.99 1.00 1.00 0.99 1.00
Maxilla-Mandibular Foramina
GPF.L 0.99 0.96 1.00 1.00 0.99 1.00 1.00 0.99 1.00
GPF.R 0.98 0.95 1.00 1.00 0.99 1.00 1.00 0.99 1.00
IORB.L 0.98 0.95 1.00 0.99 0.98 1.00 0.99 0.98 1.00
IORB.R 0.98 0.95 1.00 0.99 0.98 1.00 0.99 0.98 1.00
NPF.L 1.00 0.99 1.00 1.00 0.99 1.00 1.00 0.99 1.00
NPF.R 1.00 0.99 1.00 0.99 0.98 1.00 1.00 0.99 1.00
MENT.L 0.99 0.98 1.00 1.00 1.00 1.00 1.00 0.99 1.00
MENT.R 1.00 0.99 1.00 1.00 1.00 1.00 1.00 1.00 1.00
Constructed Midline Landmarks
Mid.EAM 0.98 0.95 1.00 1.00 1.00 1.00 1.00 1.00 1.00
Mid.GPF 0.99 0.97 1.00 1.00 0.99 1.00 1.00 0.99 1.00
Mid.IORB 0.98 0.95 1.00 1.00 0.99 1.00 1.00 0.98 1.00
Mid.MENT 1.00 0.99 1.00 1.00 1.00 1.00 1.00 1.00 1.00
Mid.NPF 1.00 0.99 1.00 1.00 0.99 1.00 1.00 0.99 1.00
Mid.OVAL 1.00 0.99 1.00 1.00 0.99 1.00 1.00 1.00 1.00

111
Appendix 3: Intra-examiner reliability mean differences (mm) for Dental landmarks, based on three repeated
measurements (in X,Y,Z axes).
Mean_X (mm) Mean_Y (mm) Mean_Z (mm) Minimum Error (mm) Maximum Error (mm)
Dental Landmarks N Mean S.D. Mean S.D. Mean S.D. Min_X Min_Y Min_Z Max_X Max_Y Max_Z
PULP.26 10 0.17 0.14 0.20 0.13 0.19 0.16 0.06 0.06 0.00 0.54 0.47 0.40
PULP.16 10 0.17 0.08 0.15 0.14 0.23 0.22 0.07 0.03 0.00 0.31 0.53 0.60
PULP.24 10 0.18 0.06 0.11 0.08 0.12 0.19 0.10 0.01 0.00 0.24 0.24 0.60
PULP.14 10 0.22 0.12 0.18 0.18 0.18 0.15 0.09 0.04 0.00 0.44 0.68 0.40
PULP.23 10 0.16 0.06 0.16 0.07 0.28 0.19 0.09 0.08 0.00 0.28 0.30 0.60
PULP.13 10 0.19 0.13 0.15 0.13 0.32 0.23 0.00 0.00 0.00 0.36 0.41 0.60
PULP.46 10 0.20 0.15 0.18 0.10 0.32 0.30 0.03 0.08 0.00 0.56 0.41 0.80
PULP.36 10 0.22 0.18 0.12 0.09 0.27 0.30 0.06 0.04 0.00 0.65 0.36 0.80
PULP.43 10 0.16 0.13 0.19 0.11 0.36 0.30 0.00 0.00 0.00 0.38 0.44 0.80
PULP.33 10 0.16 0.11 0.24 0.16 0.32 0.25 0.05 0.03 0.00 0.36 0.52 0.80
APEX.26 10 0.19 0.13 0.20 0.16 0.34 0.27 0.05 0.02 0.00 0.46 0.48 0.80
APEX.16 10 0.21 0.14 0.25 0.16 0.29 0.21 0.01 0.03 0.00 0.52 0.64 0.60
APEX.24 10 0.22 0.15 0.24 0.16 0.31 0.26 0.10 0.07 0.00 0.52 0.55 0.60
APEX.14 10 0.21 0.10 0.19 0.11 0.44 0.31 0.03 0.02 0.00 0.38 0.31 0.80
APEX.23 10 0.21 0.15 0.32 0.22 0.49 0.26 0.05 0.03 0.00 0.49 0.85 0.80
APEX.13 10 0.26 0.12 0.35 0.26 0.38 0.30 0.09 0.06 0.00 0.44 0.79 0.80
APEX.46 10 0.12 0.07 0.14 0.07 0.43 0.23 0.02 0.04 0.00 0.23 0.25 0.80
APEX.36 10 0.20 0.11 0.25 0.20 0.30 0.18 0.09 0.04 0.07 0.47 0.61 0.60
APEX.43 10 0.16 0.09 0.23 0.19 0.37 0.28 0.05 0.04 0.00 0.32 0.67 0.80
APEX.33 10 0.14 0.12 0.18 0.13 0.34 0.27 0.03 0.05 0.00 0.43 0.48 0.80
AVBN.26 10 0.34 0.17 0.34 0.21 0.34 0.27 0.12 0.07 0.00 0.64 0.75 0.80
AVBN.16 10 0.33 0.17 0.41 0.19 0.31 0.30 0.05 0.05 0.00 0.63 0.74 1.00
AVBN.24 10 0.18 0.07 0.23 0.19 0.31 0.26 0.06 0.02 0.00 0.28 0.62 0.60
AVBN.14 10 0.24 0.18 0.27 0.18 0.44 0.28 0.00 0.00 0.00 0.56 0.58 0.80
AVBN.23 10 0.28 0.21 0.49 0.29 0.46 0.26 0.04 0.17 0.00 0.80 0.86 0.80
AVBN.13 10 0.42 0.25 0.37 0.21 0.38 0.30 0.07 0.07 0.00 0.71 0.64 0.80
AVBN.46 10 0.27 0.13 0.17 0.09 0.43 0.23 0.16 0.04 0.00 0.53 0.32 0.80
AVBN.36 10 0.24 0.18 0.25 0.14 0.29 0.20 0.04 0.06 0.00 0.55 0.43 0.60
AVBN.43 10 0.39 0.25 0.28 0.16 0.37 0.29 0.12 0.06 0.00 0.83 0.54 0.80
AVBN.33 10 0.33 0.21 0.17 0.12 0.31 0.24 0.10 0.04 0.00 0.77 0.40 0.80

112
Appendix 4: Intra-examiner reliability mean differences (mm) for Skeletal landmarks, based on three
repeated measurements (in X,Y,Z axes).
Mean_X (mm) Mean_Y (mm) Mean_Z (mm) Minimum Error (mm) Maximum Error (mm)
Skeletal Landmarks N Mean S.D. Mean S.D. Mean S.D. Min_X Min_Y Min_Z Max_X Max_Y Max_Z
Cranial Base Foramina
CG 10 0.11 0.07 0.12 0.10 0.09 0.10 0.02 0.03 0.00 0.25 0.30 0.20
MDFM 10 0.17 0.12 0.19 0.19 0.36 0.27 0.07 0.05 0.00 0.47 0.70 0.80
EAM.L 10 0.32 0.23 0.16 0.13 0.24 0.12 0.00 0.01 0.06 0.60 0.48 0.39
EAM.R 10 0.29 0.28 0.20 0.08 0.25 0.16 0.00 0.10 0.03 0.80 0.33 0.52
HYPO.L 10 0.22 0.11 0.24 0.11 0.33 0.22 0.09 0.02 0.13 0.40 0.42 0.80
HYPO.R 10 0.31 0.14 0.33 0.18 0.30 0.14 0.09 0.05 0.13 0.55 0.64 0.60
OVAL.L 10 0.21 0.14 0.34 0.18 0.18 0.18 0.06 0.02 0.00 0.46 0.61 0.40
OVAL.R 10 0.16 0.07 0.29 0.15 0.26 0.23 0.02 0.04 0.00 0.27 0.52 0.80
ROT.L 10 0.06 0.06 0.07 0.09 0.12 0.20 0.00 0.00 0.00 0.20 0.20 0.67
ROT.R 10 0.08 0.06 0.14 0.28 0.07 0.07 0.00 0.00 0.00 0.20 0.60 0.21
SPIN.L 10 0.15 0.07 0.25 0.16 0.29 0.17 0.04 0.08 0.00 0.25 0.60 0.60
SPIN.R 10 0.15 0.08 0.19 0.12 0.36 0.30 0.04 0.02 0.00 0.32 0.34 0.80
Maxilla-Mandibular Foramina
GPF.L 10 0.23 0.17 0.32 0.23 0.28 0.24 0.03 0.00 0.00 0.56 0.72 0.73
GPF.R 10 0.26 0.18 0.28 0.19 0.19 0.14 0.06 0.00 0.00 0.65 0.60 0.47
IORB.L 10 0.24 0.24 0.34 0.10 0.37 0.24 0.04 0.17 0.14 0.84 0.49 0.80
IORB.R 10 0.33 0.20 0.34 0.21 0.30 0.21 0.10 0.08 0.00 0.65 0.63 0.80
NPF.L 10 0.12 0.11 0.23 0.24 0.21 0.19 0.00 0.00 0.00 0.38 0.71 0.60
NPF.R 10 0.11 0.12 0.28 0.27 0.23 0.18 0.00 0.00 0.00 0.36 0.85 0.60
MENT.L 10 0.22 0.15 0.24 0.17 0.25 0.14 0.08 0.07 0.00 0.60 0.52 0.40
MENT.R 10 0.23 0.14 0.15 0.10 0.14 0.13 0.08 0.03 0.00 0.50 0.29 0.40
Constructed Midline Landmarks
Mid.EAM 10 0.25 0.15 0.12 0.05 0.18 0.09 0.04 0.05 0.03 0.50 0.24 0.31
Mid.GPF 10 0.13 0.07 0.19 0.16 0.21 0.16 0.05 0.00 0.00 0.24 0.54 0.57
Mid.IORB 10 0.20 0.17 0.27 0.13 0.26 0.21 0.03 0.08 0.10 0.50 0.49 0.80
Mid.MENT 10 0.17 0.10 0.18 0.10 0.19 0.10 0.08 0.02 0.00 0.41 0.37 0.30
Mid.NPF 10 0.09 0.07 0.21 0.22 0.22 0.18 0.00 0.00 0.00 0.23 0.78 0.60
Mid.OVAL 10 0.09 0.05 0.23 0.14 0.19 0.14 0.00 0.03 0.00 0.15 0.42 0.50
Mid.SPIN (= ELSA) 10 0.10 0.05 0.18 0.07 0.23 0.11 0.01 0.06 0.10 0.19 0.31 0.37

113
Appendix 5: Profile Plots of Estimated Marginal Means (in mm) of Intra-examiner reliability in X, Y, Z-axes
(APEX.13 to AVBN 46)

114
Appendix 6: Profile Plots of Estimated Marginal Means (in mm) of Intra-examiner reliability in X, Y, Z-axes
(MDFM to NPF)

115
Appendix 7: Profile Plots of Estimated Marginal Means (in mm) of Intra-examiner reliability in X, Y, Z-axes (CG
to SPIN)

116
Appendix 8: Assessment of Accuracy between Cranial Base Landmarks based on Intra-class correlation
coefficient (ICC), Mean differences and standard deviation (in mm).
Appendix 9: Assessment of Accuracy between Cranial Base Landmarks to CG & MDFM based on Intra-class
correlation coefficient (ICC), Mean differences and standard deviation (in mm).
Cranial Base to Crista Galli (CG) Cranial Base to Foramen Magnum (MDFM)
Euclidean Distances
ICC Mean difference
± SD (mm) Euclidean
Distances ICC
Mean difference ± SD (mm)
MID.SPIN-CG 0.99 0.51 ± 0.28 MID.SPIN-MDFM 1.00 0.49 ± 0.30
SPIN.R-CG 0.99 0.65 ± 0.39
SPIN.R-MDFM 0.97 0.84 ± 0.78
SPIN.L-CG 0.99 0.43 ± 0.37
SPIN.L-MDFM 0.97 0.73 ± 0.86
Mid.PVID-CG 0.99 0.39 ± 0.30
Mid.PVID- MDFM 1.00 0.51 ± 0.47
PVID.R-CG 0.99 0.45 ± 0.28
PVID.R- MDFM 1.00 0.56 ± 0.45
PVID.L-CG 0.99 0.48 ± 0.24
PVID.L- MDFM 1.00 0.62 ± 0.52
Mid.OVAL-CG 1.00 0.37 ± 0.26 Mid.OVAL-MDFM 1.00 0.84 ± 0.78
OVAL.R-CG 0.99 0.52 ± 0.37 OVAL.R-MDFM 0.98 0.81 ± 0.89
OVAL.L-CG 1.00 0.32 ± 0.25 OVAL.L-MDFM 1.00 0.49 ± 0.30
Mid.EAM-CG 0.99 0.52 ± 0.37 Mid.AEM-MDFM 0.99 0.73 ± 0.86
HYPO.R-CG 0.98 1.08 ± 0.95 HYPO.R-MDFM 0.89 0.78 ± 0.63
HYPO.L-CG 0.99 0.85 ± 0.73 HYPO.L-MDFM 0.65 1.28 ± 1.48
CG-MDFM 0.99 1.00 ± 0.52
Transverse Cranial Base Measurements
Euclidean Distances
ICC Mean difference ±
SD (mm)
PVID.R-PVID.L 1.00 0.28 ± 0.22
OVAL.R-OVAL.L 0.99 0.47 ± 0.30
SPIN.R-SPIN.L 0.99 0.53 ± 0.37
OVAL.L-MID.SPIN 0.96 0.46 ± 0.35
OVAL.R-MID.SPIN 0.89 0.60 ± 0.63
EAM.R-EAM.L 0.98 0.70 ± 0.37
HYPO.R-HYPO.L 0.95 0.51 ± 0.43
Vertical/AP Cranial Base Measurements
Euclidean Distances
ICC Mean difference ±
SD (mm)
PVID.L-OVAL.L 1.00 0.46 ± 0.31
Mid.Oval-MID.SPIN 0.98 0.28 ± 0.21
Mid.PVID-MID.SPIN 1.00 0.45 ± 0.29
PVID.L-MID.SPIN 0.99 0.68 ± 0.47
PVID.R-MID.SPIN 0.97 0.70 ± 0.65
MID.SPIN-CG 0.99 0.51 ± 0.28
MID.SPIN-MDFM 1.00 0.49 ± 0.30

117
Appendix 10: Assessment of Accuracy for Maxillary and Mandibular Skeletal Landmarks.
Appendix 11: Assessment of Accuracy for Dental Landmarks in the Transverse dimension.
Euclidean Distances N ICC Mean ± SD (mm) Min. (mm) Max. (mm)
Maxillary Skeletal (Anterior to Posterior)
GPF.L-NPF.L 10 0.92 0.82 ± 0.51 0.12 1.94
GPF.L- IORB.L 10 0.88 0.63 ± 0.46 0.11 1.41
IORB.L-MDFM 10 0.98 1.16 ± 1.04 0.34 3.55
IORB.R-MDFM 10 0.98 1.29 ± 1.27 0.16 4.71
MENT.L-MDFM 10 0.94 1.30 ± 1.35 0.04 4.92
MENT.R-MDFM 10 0.97 1.28 ± 1.33 0.11 4.20
Maxilla to Mandible (Vertical)
MENT.L-GPF.L 10 0.99 0.51 ± 0.38 0.06 1.22
MENT.R-NPF.R 10 0.99 0.52 ± 0.34 0.07 1.11
MENT.R-IORB.R 10 0.99 0.55 ± 0.26 0.13 0.88
Skeletal to Skeletal (Transverse)
GPF.R-GPF.L 10 0.98 0.52 ± 0.27 0.24 1.06
NPF.R-NPF.L 10 0.87 0.52 ± 0.34 0.07 1.03
IORB.R-IORB.L 10 0.96 0.69 ± 0.49 0.17 1.49
MENT.R-MENT.L 10 1.00 0.20 ± 0.15 0.02 0.42
Euclidean Distances
ICC Mean ± SD
(mm) Min. (mm)
Max. (mm)
Maxillary Teeth Pairings (Transverse)
PULP.16-26 1.00 0.23 ± 0.23 0.08 0.86
PULP.14-24 0.99 0.27 ± 0.27 0.04 0.92
PULP.13-23 0.99 0.26 ± 0.17 0.05 0.47
APEX.16-26 0.95 0.48 ± 0.39 0.10 1.27
APEX.14-24 0.96 0.46 ± 0.35 0.06 1.15
APEX.13-23 0.99 0.22 ± 0.21 0.03 0.74
AVBN.16-26 0.95 0.67 ± 0.38 0.25 1.27
AVBN.14-24 0.98 0.35 ± 0.21 0.04 0.59
AVBN.13-23 0.98 0.55 ± 0.28 0.15 0.99
Euclidean Distances
ICC Mean ± SD
(mm) Min. (mm)
Max. (mm)
Mandibular Teeth Pairings (Transverse)
PULP.43-33
1.00 0.17 ± 0.12 0.05 0.43
PULP.46-36
0.97 0.23 ± 0.18 0.06 0.61
APEX.43-33
0.99 0.25 ± 0.19 0.02 0.64
APEX.46-36
0.99 0.26 ± 0.26 0.03 0.87
AVBN.43-33
0.97 0.51 ± 0.37 0.05 1.13
AVBN.46-36
0.92 0.68 ± 0.45 0.25 1.59

118
Appendix 12: Assessment of Accuracy for Dental Landmarks in the Vertical dimension.
Appendix 13: Assessment of Accuracy for Dental Landmarks in the Antero-posterior dimension.
Euclidean Distances
ICC Mean ± SD
(mm) Min. (mm)
Max. (mm)
Maxillary Teeth to Crista Galli (CG)
PULP.26-CG 1.00 0.41 ± 0.31 0.03 0.85
PULP.24-CG 0.99 0.73 ± 0.25 0.30 1.08
PULP.23-CG 0.99 0.74± 0.36 0.07 1.11
APEX.26-CG 0.99 0.40 ± 0.38 0.01 1.08
APEX.24-CG 1.00 0.28 ± 0.21 0.02 0.75
APEX.23-CG 0.99 0.66 ± 0.40 0.23 1.27
AVBN.26-CG 0.99 0.67 ± 0.37 0.07 1.17
AVBN.24-CG 0.99 0.57 ± 0.45 0.03 1.36
AVBN.23-CG 0.99 0.68 ± 0.47 0.04 1.43
Euclidean Distances
ICC Mean ± SD
(mm) Min. (mm)
Max. (mm)
Mandibular Teeth to Crista Galli (CG)
PULP.36-CG
0.99 0.71 ± 0.31 0.11 1.08
PULP.33-CG
0.99 0.69 ± 0.44 0.04 1.29
APEX.36-CG
1.00 0.46 ± 0.27 0.16 1.07
APEX.33-CG
1.00 0.59 ± 0.38 0.08 1.35
AVBN.33-CG
0.72 0.90 ± 0.71 0.09 2.21
AVBN.36-CG
1.00 0.46 ± 0.24 0.01 0.77
Euclidean Distances
ICC Mean ± SD
(mm) Min. (mm)
Max. (mm)
Maxillary Teeth (Anterior-Posterior)
PULP.26-24 0.97 0.22 ± 0.20 0.02 0.53
PULP.16-14 0.98 0.34 ± 0.11 0.19 0.51
PULP.24-23 0.94 0.24 ± 0.13 0.03 0.51
PULP.14-13 0.99 0.23 ± 0.22 0.01 0.75
APEX.26-24 0.94 0.54 ± 0.35 0.04 1.26
APEX.16-14 0.95 0.33 ± 0.51 0.01 1.62
APEX.24-23 0.94 0.34 ± 0.33 0.01 0.95
APEX.14-13 0.84 0.57 ± 0.49 0.04 1.41
AVBN.26-24 0.62 0.86 ± 0.78 0.09 2.39
AVBN.16-14 0.94 0.58 ± 0.30 0.11 1.19
AVBN.24-23 0.67 0.75 ± 0.70 0.04 2.28
AVBN.14-13 0.64 0.71 ± 0.42 0.07 1.34
Euclidean Distances
ICC Mean ± SD
(mm) Min. (mm)
Max. (mm)
Mandibular Teeth (Anterior-Posterior)
PULP.46-43 1.00 0.49 ± 0.50 0.01 1.75
PULP.36-33 0.90 0.50 ± 0.53 0.10 1.93
APEX.46-43 0.95 0.38 ± 0.39 0.04 1.37
APEX.36-33 0.99 0.22 ± 0.22 0.01 0.8
AVBN.46-43 0.96 0.38 ± 0.36 0.01 0.97
AVBN.36-33 0.91 0.59 ± 0.64 0.01 1.92

119
Appendix 14: Intra-class correlation coefficient (ICC), Mean differences & Standard deviation for Accuracy of
the remaining Cranial Base Landmarks.
Crista Galli (CG) to Cranial Base Foramen Magnum (MDFM) to Cranial Base
Euclidean Distances ICC Mean difference ±
SD (mm) Euclidean
Distances ICC
Mean difference ± SD (mm)
Mid.EAM-CG 0.99 0.52 ± 0.37 Mid.AEM-MDFM 0.99 0.73 ± 0.86
HYPO.R-CG 0.98 1.08 ± 0.95 HYPO.R-MDFM 0.89 0.78 ± 0.63
HYPO.L-CG 0.99 0.85 ± 0.73 HYPO.L-MDFM 0.65 1.28 ± 1.48
CG-MDFM 0.99 1.00 ± 0.52
Appendix 15: A) P-P Plot (Left) and B) Box Plot (Right) Of the Mahalanobis Distance.
Multivariate outlier detection was performed using the Mahalanobis’ distance.

120
Appendix 16: Bivariate Scatter Plots Of Measurements At T1 (Above) And T2 (Below).
A Maximum of 16 variables were included in each Scatter Plot, due to the limitation of SPSS in
generating a readable table.

121

122
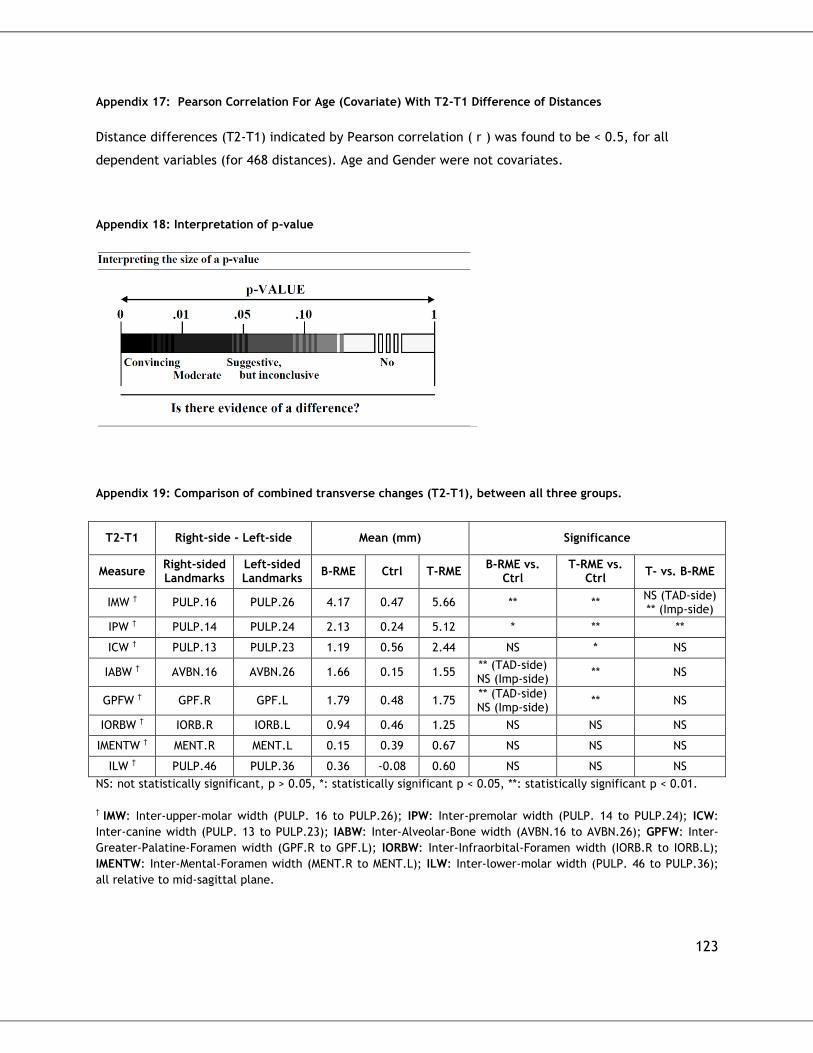
123
Appendix 17: Pearson Correlation For Age (Covariate) With T2-T1 Difference of Distances
Distance differences (T2-T1) indicated by Pearson correlation ( r ) was found to be < 0.5, for all
dependent variables (for 468 distances). Age and Gender were not covariates.
Appendix 18: Interpretation of p-value
Appendix 19: Comparison of combined transverse changes (T2-T1), between all three groups.
T2-T1 Right-side - Left-side Mean (mm) Significance
Measure Right-sided Landmarks
Left-sided Landmarks
B-RME Ctrl T-RME B-RME vs.
Ctrl T-RME vs.
Ctrl T- vs. B-RME
IMW † PULP.16 PULP.26 4.17 0.47 5.66 ** ** NS (TAD-side) ** (Imp-side)
IPW † PULP.14 PULP.24 2.13 0.24 5.12 * ** **
ICW † PULP.13 PULP.23 1.19 0.56 2.44 NS * NS
IABW † AVBN.16 AVBN.26 1.66 0.15 1.55 ** (TAD-side) NS (Imp-side)
** NS
GPFW † GPF.R GPF.L 1.79 0.48 1.75 ** (TAD-side) NS (Imp-side)
** NS
IORBW † IORB.R IORB.L 0.94 0.46 1.25 NS NS NS
IMENTW † MENT.R MENT.L 0.15 0.39 0.67 NS NS NS
ILW † PULP.46 PULP.36 0.36 -0.08 0.60 NS NS NS
NS: not statistically significant, p > 0.05, *: statistically significant p < 0.05, **: statistically significant p < 0.01.
† IMW: Inter-upper-molar width (PULP. 16 to PULP.26); IPW: Inter-premolar width (PULP. 14 to PULP.24); ICW:
Inter-canine width (PULP. 13 to PULP.23); IABW: Inter-Alveolar-Bone width (AVBN.16 to AVBN.26); GPFW: Inter-
Greater-Palatine-Foramen width (GPF.R to GPF.L); IORBW: Inter-Infraorbital-Foramen width (IORB.R to IORB.L);
IMENTW: Inter-Mental-Foramen width (MENT.R to MENT.L); ILW: Inter-lower-molar width (PULP. 46 to PULP.36);
all relative to mid-sagittal plane.

124
Appendix 20: Percentage of Skeletal to Dental Change (T2-T1)
Percentage Change (T2-T1) B-RME Ctrl T-RME
% Dental Expansion (IMW-GPFW-IABW) / IMW) 17.27% -34.04% 41.70%
% Alveolar Bone Expansion (IABW / IMW) 39.81% 31.91% 27.39%
% Skeletal Expansion (GPFW / IMW) 42.93% 102.13% 30.92%
% Skeletal Expansion (IORBW / IMW) 22.54 % 97.87 % 22.08 %
Total Expansion (IMW+IABW+GPFW Expansion) 100.00% 100.00% 100.00%
† GPFW: Inter-Greater-Palatine-Foramen width (GPF.R to GPF.L); IORBW: Inter-Infraorbital-Foramen width (IORB.R
to IORB.L); IABW: Inter-Alveolar-Bone width (AVBN.16 to AVBN.26); IMW: Inter-upper-molar width (PULP. 16 to
PULP.26).
Appendix 21: Distribution of subjects by L-R difference > 1 mm relative to Mid-sagittal plane. Results were all
not statistically significant (p=1.000).
Number of
Symmetrical
Cases across L-R
Landmarks:
T1 (# of subjects)/(total subjects) (%) T2-T1 change (# of subjects (%))
B-RME
Ctrl T-RME Total B-RME Ctrl T-RME
Lower 6 crowns 5/17 (29%) 4/16 (25%) 8/17 (47%) 17/50 (24%) +1 (+6%) +1(+6%) +1 (+10%)
Mental foramina 6/17 (35%) 3/16 (19%) 5/17 (29%) 14/50 (28%) +2 (+12%) +2 (+13%) +3 (+18%)
Upper 6 crowns 5/17 (29%) 7/16 (44%) 9/17 (53%) 21/50 (42%) +1 (+6%) 0 (+0%) -1 (-6%)
Greater Palatine 7/16 (41%) 9/16 (56%) 11/17 (65%) 27/50 (68%) +3 (+18%) -1 (-6%) +2 (+12%)
Upper 4 crowns 8/17 (47%) 5/16 (31%) 12/17 (71%) 25/50 (50%) -1 (-6%) +2 (+13%) +2 (+12%)
Posterior Arch Symmetry
No statistically significant differences (p=1.000) were found in any of the three groups at T1 or T2.

125
Appendix 22: Cranial Base Reference Landmark Changes (T2-T1)
Cranial base changes from T2-T1 (Appendix Tables: 22A, 22B, 22C, below), based on:
OVAL = Foramen Ovale
PVID = Posterior Vidian Canal
During the 6 month observation period, mild of displacement of the reference landmark PVID was
noted: ≤ 0.40 mm (transverse), ≤ 0.55 mm (antero-posterior), and ≤ 1.10 mm (vertical).
During the 6 month observation period, mild of displacement of the reference landmark OVALE was
noted: ≤ 0.40 mm (transverse and antero-posterior), and ≤ 0.55 mm and ≤ 0.70 mm in the vertical
dimension respectively.
This reflects statistically non-significant (p>0.05), amount of vertical growth, minimal transverse
and antero-posterior cranial base growth changes during this 6 month observation period.
Appendix 22A: Between-Group Comparisons: Transverse treatment changes (T2-T1)
Group Mean ± S.D. (in mm) P-value for Group Differences
Variable B-RME Ctrl T-RME T-RME-B-RME B-RME-Ctrl T-RME-Ctrl
OVAL_R -0.10 ± 1.07 0.37 ± 1.41 0.20 ± 0.76 1.000 .680 1.000
OVAL_L 0.16 ± 0.98 -0.18 ± 1.22 0.08 ± 0.73 1.000 .990 1.000
PVID_R -0.05 ± 0.90 0.37 ± 0.93 0.01 ± 1.07 1.000 .660 .870
PVID_L 0.20 ± 0.93 -0.25 ± 1.12 -0.02 ± 1.10 1.000 .670 1.000
Appendix 22B: Between-Group Comparisons: Antero-posterior treatment changes (T2-T1)
Group Mean ± S.D. (in mm) P-value for Group Differences
Variable B-RME Ctrl T-RME T-RME-B-RME B-RME-Ctrl T-RME-Ctrl
OVAL_R 0.29 ± 1.24 -0.13 ± 1.57 0.37 ± 1.63 1.000 1.000 1.000
OVAL_L -0.14 ± 1.31 -0.54 ± 1.40 0.40 ± 1.23 .710 1.000 .140
PVID_R 0.10 ± 1.74 -0.33 ± 2.25 0.44 ± 1.26 1.000 1.000 .670
PVID_L 0.13 ± 1.12 -0.46 ± 1.29 0.07 ± 1.25 1.000 .520 .650
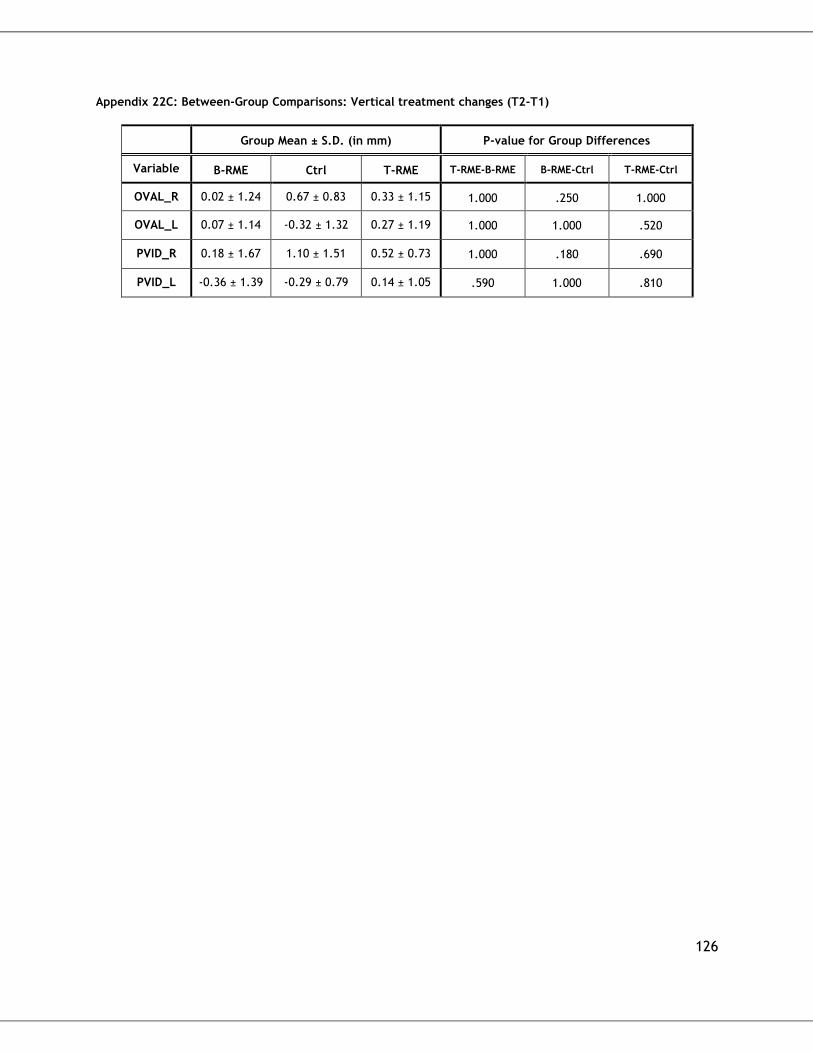
126
Appendix 22C: Between-Group Comparisons: Vertical treatment changes (T2-T1)
Group Mean ± S.D. (in mm) P-value for Group Differences
Variable B-RME Ctrl T-RME T-RME-B-RME B-RME-Ctrl T-RME-Ctrl
OVAL_R 0.02 ± 1.24 0.67 ± 0.83 0.33 ± 1.15 1.000 .250 1.000
OVAL_L 0.07 ± 1.14 -0.32 ± 1.32 0.27 ± 1.19 1.000 1.000 .520
PVID_R 0.18 ± 1.67 1.10 ± 1.51 0.52 ± 0.73 1.000 .180 .690
PVID_L -0.36 ± 1.39 -0.29 ± 0.79 0.14 ± 1.05 .590 1.000 .810

127
References
1. McNamara JA. Maxillary transverse deficiency. American Journal of Orthodontics and Dentofacial Orthopedics 2000;117:567-570.
2. Kutin G, Hawes RR. Posterior cross-bites in the deciduous and mixed dentitions. American journal of orthodontics 1969;56:491-504.
3. Thilander B, Myrberg N. The prevalence of malocclusion in Swedish schoolchildren. European Journal of Oral Sciences 1973;81:12-20.
4. Heikinheimo K, Salmi K, Myllärniemi S. Long term evaluation of orthodontic diagnoses made at the ages of 7 and 10 years. The European Journal of Orthodontics 1987;9:151-159.
5. Thilander B, Pena L, Infante C, Parada SS, de Mayorga C. Prevalence of malocclusion and orthodontic treatment need in children and adolescents in Bogota, Colombia. An epidemiological study related to different stages of dental development. The European Journal of Orthodontics 2001;23:153-168.
6. Keski-Nisula K, Lehto R, Lusa V, Keski-Nisula L, Varrela J. Occurrence of malocclusion and need of orthodontic treatment in early mixed dentition. American Journal of Orthodontics and Dentofacial Orthopedics 2003;124:631-638.
7. da Silva Filho OG, Santamaria Jr M, Filho LC. Epidemiology of posterior crossbite in the primary dentition. Journal of Clinical Pediatric Dentistry 2007;32:73-78.
8. Bishara SE, Staley RN. Maxillary expansion: clinical implications. American Journal of Orthodontics and Dentofacial Orthopedics 1987;91:3-14.
9. Lagravère MO, Heo G, Major PW, Flores-Mir C. Meta-analysis of immediate changes with rapid maxillary expansion treatment. The Journal of the American Dental Association 2006;137:44-53.
10. Bell RA. A review of maxillary expansion in relation to rate of expansion and patient's age. American journal of orthodontics 1982;81:32-37.
11. Kennedy DB, Osepchook M. Unilateral posterior crossbite with mandibular shift: a review. Journal-Canadian Dental Association 2005;71:569.
12. Haas AJ. Long-term posttreatment evaluation of rapid palatal expansion. Angle Orthod 1980;50:189-217.
13. Lagravere MO, Major PW, Flores-Mir C. Long-term dental arch changes after rapid maxillary expansion treatment: a systematic review. The Angle orthodontist 2005;75:155-161.
14. Lagravere MO, Major PW, Flores-Mir C. Long-term skeletal changes with rapid maxillary expansion: a systematic review. The Angle orthodontist 2005;75:1046-1052.
15. Sievers MM, Larson BE, Gaillard PR, Wey A. Asymmetry assessment using cone beam CT: A Class I and Class II patient comparison. The Angle Orthodontist 2011;82:410-417.
16. Sanders DA, Rigali PH, Neace WP, Uribe F, Nanda R. Skeletal and dental asymmetries in Class II subdivision malocclusions using cone-beam computed tomography. American Journal of Orthodontics and Dentofacial Orthopedics 2010;138:542. e541-542. e520.

128
17. Katsumata A, Fujishita M, Maeda M, Ariji Y, Ariji E, Langlais RP. 3D-CT evaluation of facial asymmetry. Oral Surgery, Oral Medicine, Oral Pathology, Oral Radiology, and Endodontology 2005;99:212-220.
18. Baek S-H, Cho I-S, Chang Y-I, Kim M-J. Skeletodental factors affecting chin point deviation in female patients with class III malocclusion and facial asymmetry: a three-dimensional analysis using computed tomography. Oral Surgery, Oral Medicine, Oral Pathology, Oral Radiology, and Endodontology 2007;104:628-639.
19. Jacobson A, RL J. Radiographic Cephalometry: From Basics to 3-D Imaging, (Book/CD-ROM set), Chapter 23. 2007.
20. Lagravère MO, Carey J, Toogood RW, Major PW. Three-dimensional accuracy of measurements made with software on cone-beam computed tomography images. American Journal of Orthodontics and Dentofacial Orthopedics 2008;134:112-116.
21. Scarfe WC, Farman AG, Sukovic P. Clinical applications of cone-beam computed tomography in dental practice. Journal-Canadian Dental Association 2006;72:75.
22. Yajima A, Otonari-Yamamoto M, Sano T, Hayakawa Y, Otonari T, Tanabe K et al. Cone-beam CT (CB Throne) applied to dentomaxillofacial region. The Bulletin of Tokyo Dental College 2006;47:133-141.
23. Mah JK, Huang JC, Choo H. Practical applications of cone-beam computed tomography in orthodontics. The Journal of the American Dental Association 2010;141:7S-13S.
24. Lagravère MO, Gordon JM, Guedes IH, Flores-Mir C, Carey JP, Heo G et al. Reliability of traditional cephalometric landmarks as seen in three-dimensional analysis in maxillary expansion treatments. The Angle orthodontist 2009;79:1047-1056.
25. de Moraes ME, Hollender LG, Chen CS, Moraes LC, Balducci I. Evaluating craniofacial asymmetry with digital cephalometric images and cone-beam computed tomography. Am J Orthod Dentofacial Orthop 2011;139:e523-531.
26. Lee K-M, Hwang H-S, Cho J-H. Comparison of transverse analysis between posteroanterior cephalogram and cone-beam computed tomography. Angle Orthodontist 2013;84:715-719.
27. Ghafari J, Cater PE, Shofer FS. Effect of film-object distance on posteroanterior cephalometric measurements: suggestions for standardized cephalometric methods. American Journal of Orthodontics and Dentofacial Orthopedics 1995;108:30-37.
28. Gateno J, Xia JJ, Teichgraeber JF. Effect of facial asymmetry on 2-dimensional and 3-dimensional cephalometric measurements. Journal of Oral and Maxillofacial Surgery 2011;69:655-662.
29. Thiesen G, Gribel BF, Freitas MPM. Facial asymmetry: a current review. Dental press journal of orthodontics 2015;20:110-125.
30. Betts N, Vanarsdall R, Barber H, Higgins-Barber K, Fonseca R. Diagnosis and treatment of transverse maxillary deficiency. The International journal of adult orthodontics and orthognathic surgery 1994;10:75-96.
31. Chien P, Parks E, Eraso F, Hartsfield J, Roberts W, Ofner S. Comparison of reliability in anatomical landmark identification using two-dimensional digital cephalometrics and three-dimensional cone beam computed tomography in vivo. Dentomaxillofacial Radiology 2014.

129
32. Oz U, Orhan K, Abe N. Comparison of linear and angular measurements using two-dimensional conventional methods and three-dimensional cone beam CT images reconstructed from a volumetric rendering program in vivo. Dentomaxillofac Radiol 2011;40:492-500.
33. Lin L, Ahn H-W, Kim S-J, Moon S-C, Kim S-H, Nelson G. Tooth-borne vs bone-borne rapid maxillary expanders in late adolescence. The Angle Orthodontist 2014;85:253-262.
34. Lagravère MO, Carey J, Heo G, Toogood RW, Major PW. Transverse, vertical, and anteroposterior changes from bone-anchored maxillary expansion vs traditional rapid maxillary expansion: A randomized clinical trial. American Journal of Orthodontics and Dentofacial Orthopedics 2010;137:304.e301-304.e312.
35. Krebs A. Expansion of the midpalatal suture, studied by means of metallic implants. Acta Odontologica Scandinavica 1959;17:491-501.
36. Wehrbein H, Göllner P. Skeletal Anchorage in Orthodontics – Basics and Clinical Application. Journal of Orofacial Orthopedics / Fortschritte der Kieferorthopädie 2007;68:443-461.
37. Hansen L, Tausche E, Hietschold V, Hotan T, Lagravère M, Harzer W. Skeletally-anchored Rapid Maxillary Expansion using the Dresden Distractor. Journal of Orofacial Orthopedics / Fortschritte der Kieferorthopädie 2007;68:148-158.
38. Baydas B, Yavuz İ, Uslu H, Dagsuyu İM, Ceylan İ. Nonsurgical rapid maxillary expansion effects on craniofacial structures in young adult females: a bone scintigraphy study. The Angle orthodontist 2006;76:759-767.
39. Tausche E, Hansen L, Hietschold V, Lagravère MO, Harzer W. Three-dimensional evaluation of surgically assisted implant bone-borne rapid maxillary expansion: A pilot study. American Journal of Orthodontics and Dentofacial Orthopedics 2007;131:S92-S99.
40. Rakosi T, Graber T. Orthodontic and Dentofacial Orthopedic Treatment, Chapter 7 2009:155-176.
41. Hassan AH, AlGhamdi AT, Al-Fraidi AA, Al-Hubail A, Hajrassy MK. Unilateral cross bite treated by corticotomy-assisted expansion: two case reports. Head & face medicine 2010;6:1.
42. Hesse KL, Årtun J, Joondeph DR, Kennedy DB. Changes in condylar position and occlusion associated with maxillary expansion for correction of functional unilateral posterior crossbite. American Journal of Orthodontics and Dentofacial Orthopedics 1997;111:410-418.
43. Harrison JE, Ashby D. Orthodontic treatment for posterior crossbites. The Cochrane Library 2001.
44. Thilander B, Wahlund S, Lennartsson B. The effect of early interceptive treatment in children with posterior cross-bite. The European Journal of Orthodontics 1984;6:25-34.
45. Schröder U, Schröder I. Early treatment of unilateral posterior crossbite in children with bilaterally contracted maxillae. The European Journal of Orthodontics 1984;6:65-69.
46. O'Byrn BL, Sadowsky C, Schneider B, BeGole EA. An evaluation of mandibular asymmetry in adults with unilateral posterior crossbite. American Journal of Orthodontics and Dentofacial Orthopedics 1995;107:394-400.
47. Pirttiniemi P, Kantomaa T, Lahtela P. Relationship between craniofacial and condyle path asymmetry in unilateral cross-bite patients. The European Journal of Orthodontics 1990;12:408-413.

130
48. De Felippe NLO, Da Silveira AC, Viana G, Kusnoto B, Smith B, Evans CA. Relationship between rapid maxillary expansion and nasal cavity size and airway resistance: short-and long-term effects. American Journal of Orthodontics and Dentofacial Orthopedics 2008;134:370-382.
49. Rodrigues Ado P, Monini Ada C, Gandini LG, Jr., Santos-Pinto A. Rapid palatal expansion: a comparison of two appliances. Braz Oral Res 2012;26:242-248.
50. Myers DR, Barenie JT, Bell RA, Williamson EH. Condylar position in children with functional posterior crossbites: before and after crossbite correction. Pediatr Dent 1980;2:190-194.
51. Piancino MG, Talpone F, Dalmasso P, Debernardi C, Lewin A, Bracco P. Reverse-sequencing chewing patterns before and after treatment of children with a unilateral posterior crossbite. The European Journal of Orthodontics 2006;28:480-484.
52. Iodice G, Danzi G, Cimino R, Paduano S, Michelotti A. Association between posterior crossbite, skeletal, and muscle asymmetry: a systematic review. The European Journal of Orthodontics 2016:cjw003.
53. Ileri Z, Basciftci FA. Asymmetric rapid maxillary expansion in true unilateral crossbite malocclusion: A prospective controlled clinical study. The Angle Orthodontist 2015;85:245-252.
54. Baka ZM, Akin M, Ucar FI, Ileri Z. Cone-beam computed tomography evaluation of dentoskeletal changes after asymmetric rapid maxillary expansion. American Journal of Orthodontics and Dentofacial Orthopedics 2015;147:61-71.
55. Proffit W FH, Sarver D.,. Contemporary orthodontics. Mosby; 2013.
56. Davidovitch M, Efstathiou S, Sarne O, Vardimon AD. Skeletal and dental response to rapid maxillary expansion with 2-versus 4-band appliances. American Journal of Orthodontics and Dentofacial Orthopedics 2005;127:483-492.
57. Isaacson RJ, Wood JL, Ingram AH. Forces produced by rapid maxillary expansion: I. Design of the force measuring system. The Angle Orthodontist 1964;34:256-260.
58. Zimring JF, Isaacson RJ. Forces Produced By Rapid Maxillary Expansion. 3. Forces Present During Retention. Angle Orthod 1965;35:178-186.
59. Chaconas SJ, Caputo AA. Observation of orthopedic force distribution produced by maxillary orthodontic appliances. Am J Orthod 1982;82:492-501.
60. Garib DG, Henriques JFC, Janson G, de Freitas MR, Fernandes AY. Periodontal effects of rapid maxillary expansion with tooth-tissue-borne and tooth-borne expanders: a computed tomography evaluation. American journal of orthodontics and dentofacial orthopedics 2006;129:749-758.
61. Weissheimer A, de Menezes LM, Mezomo M, Dias DM, de Lima EMS, Rizzatto SMD. Immediate effects of rapid maxillary expansion with Haas-type and hyrax-type expanders: a randomized clinical trial. American Journal of Orthodontics and Dentofacial Orthopedics 2011;140:366-376.
62. Garrett BJ, Caruso JM, Rungcharassaeng K, Farrage JR, Kim JS, Taylor GD. Skeletal effects to the maxilla after rapid maxillary expansion assessed with cone-beam computed
131
tomography. American Journal of Orthodontics and Dentofacial Orthopedics 2008;134:8.e1-8.e11.
63. Garib DG, Henriques JFC, Janson G, Freitas MR, Coelho RA. Rapid maxillary expansion-tooth tissue-borne versus tooth-borne expanders: a computed tomography evaluation of dentoskeletal effects. The Angle orthodontist 2005;75:548-557.
64. Bazargani F, Feldmann I, Bondemark L. Three-dimensional analysis of effects of rapid maxillary expansion on facial sutures and bones: a systematic review. The Angle Orthodontist 2013;83:1074-1082.
65. Langford S, Sims M. Root surface resorption, repair, and periodontal attachment following rapid maxillary expansion in man. American journal of orthodontics 1982;81:108-115.
66. Barber AF, Sims M. Rapid maxillary expansion and external root resorption in man: a scanning electron microscope study. American journal of orthodontics 1981;79:630-652.
67. Garib DG, Henriques JF, Janson G, de Freitas MR, Fernandes AY. Periodontal effects of rapid maxillary expansion with tooth-tissue-borne and tooth-borne expanders: a computed tomography evaluation. Am J Orthod Dentofacial Orthop 2006;129:749-758.
68. Ramieri GA, Spada MC, Austa M, Bianchi SD, Berrone S. Transverse maxillary distraction with a bone-anchored appliance: dento-periodontal effects and clinical and radiological results. International Journal of Oral and Maxillofacial Surgery 2005;34:357-363.
69. Parr JA, Garetto LP, Wohlford ME, Arbuckle GR, Roberts WE. Sutural expansion using rigidly integrated endosseous implants: an experimental study in rabbits. The Angle orthodontist 1997;67:283-290.
70. Shapiro P, Kokich V. Uses of implants in orthodontics. Dental Clinics of North America 1988;32:539-550.
71. Baccetti T, Franchi L, Cameron CG, McNamara Jr JA. Treatment timing for rapid maxillary expansion. The Angle orthodontist 2001;71:343-350.
72. Lee HK, Bayome M, Ahn CS, Kim S-H, Kim KB, Mo S-S et al. Stress distribution and displacement by different bone-borne palatal expanders with micro-implants: a three-dimensional finite-element analysis. The European Journal of Orthodontics 2012:cjs063.
73. MacGinnis M, Chu H, Youssef G, Wu KW, Machado AW, Moon W. The effects of micro-implant assisted rapid palatal expansion (MARPE) on the nasomaxillary complex—a finite element method (FEM) analysis. Progress in orthodontics 2014;15:1.
74. Zhou Y, Long H, Ye N, Xue J, Yang X, Liao L et al. The effectiveness of non-surgical maxillary expansion: a meta-analysis. The European Journal of Orthodontics 2013:cjt044.
75. Ferro F, Spinella P, Lama N. Transverse maxillary arch form and mandibular asymmetry in patients with posterior unilateral crossbite. American Journal of Orthodontics and Dentofacial Orthopedics 2011;140:828-838.
76. Marcotte MR. The use of the occlusogram in planning orthodontic treatment. American journal of orthodontics 1976;69:655-667.
77. Fiorelli G, Melsen B. The "3-D occlusogram" software. Am J Orthod Dentofacial Orthop 1999;116:363-368.

132
78. Canuto LFG, de Freitas MR, Janson G, de Freitas KMS, Martins PP. Influence of rapid palatal expansion on maxillary incisor alignment stability. American Journal of Orthodontics and Dentofacial Orthopedics 2010;137:164. e161-164. e166.
79. Moussa R, O'Reilly MT, Close JM. Long-term stability of rapid palatal expander treatment and edgewise mechanotherapy. American Journal of Orthodontics and Dentofacial Orthopedics 1995;108:478-488.
80. Alavi DG, BeGole EA, Schneider BJ. Facial and dental arch asymmetries in Class II subdivision malocclusion. American Journal of Orthodontics and Dentofacial Orthopedics 1988;93:38-46.
81. Mraiwa N, Jacobs R, Van Cleynenbreugel J, Sanderink G, Schutyser F, Suetens P et al. The nasopalatine canal revisited using 2D and 3D CT imaging. Dentomaxillofac Radiol 2004;33:396-402.
82. Grayson B, Cutting C, Bookstein FL, Kim H, McCarthy JG. The three-dimensional cephalogram: theory, techniques, and clinical application. American Journal of Orthodontics and Dentofacial Orthopedics 1988;94:327-337.
83. Swennen GR, Schutyser F, Barth E-L, De Groeve P, De Mey A. A new method of 3-D cephalometry Part I: the anatomic Cartesian 3-D reference system. Journal of craniofacial surgery 2006;17:314-325.
84. Kusayama M, Motohashi N, Kuroda T. Relationship between transverse dental anomalies and skeletal asymmetry. American Journal of Orthodontics and Dentofacial Orthopedics 2003;123:329-337.
85. Ricketts RM. Perspectives in the clinical application of cephalometrics: the first fifty years. The Angle orthodontist 1981;51:115-150.
86. Ludlow JB, Gubler M, Cevidanes L, Mol A. Precision of cephalometric landmark identification: cone-beam computed tomography vs conventional cephalometric views. American Journal of Orthodontics and Dentofacial Orthopedics 2009;136:312. e311-312. e310.
87. de Oliveira AEF, Cevidanes LHS, Phillips C, Motta A, Burke B, Tyndall D. Observer reliability of three-dimensional cephalometric landmark identification on cone-beam computerized tomography. Oral Surgery, Oral Medicine, Oral Pathology, Oral Radiology, and Endodontology 2009;107:256-265.
88. Mah J HD. Three-dimensional craniofacial imaging. Am J Orthod Dentofacial Orthop 2004;126:308-309.
89. Lagravere MO, Hansen L, Harzer W, Major PW. Plane orientation for standardization in 3-dimensional cephalometric analysis with computerized tomography imaging. Am J Orthod Dentofacial Orthop 2006;129:601-604.
90. Park S-H, Yu H-S, Kim K-D, Lee K-J, Baik H-S. A proposal for a new analysis of craniofacial morphology by 3-dimensional computed tomography. American Journal of Orthodontics and Dentofacial Orthopedics 2006;129:600.e623-600.e634.
91. Shibata M, Nawa H, Kise Y, Fuyamada M, Yoshida K, Katsumata A et al. Reproducibility of three-dimensional coordinate systems based on craniofacial landmarks. The Angle Orthodontist 2012;82:776-784.

133
92. Nelson SJ. Wheeler's dental anatomy, physiology and occlusion. Elsevier Health Sciences; 2014.
93. Hayashi K, Uechi J, Mizoguchi I. Three-Dimensional Analysis of Dental Casts Based on a Newly Defined Palatal Reference Plane. The Angle Orthodontist 2003;73:539-544.
94. Porto OCL, de Freitas JC, de Alencar A, Estrela C. The use of three-dimensional cephalometric references in dentoskeletal. Dental Press J Orthod 2014;19:78-85.
95. Lagravere MO, Major PW, Carey J. Sensitivity analysis for plane orientation in three-dimensional cephalometric analysis based on superimposition of serial cone beam computed tomography images. Dentomaxillofac Radiol 2010;39:400-408.
96. Naji P, Alsufyani NA, Lagravère MO. Reliability of anatomic structures as landmarks in three-dimensional cephalometric analysis using CBCT. The Angle Orthodontist 2013;84:762-772.
97. Lagravère MO, Gordon JM, Flores-Mir C, Carey J, Heo G, Major PW. Cranial base foramen location accuracy and reliability in cone-beam computerized tomography. American Journal of Orthodontics and Dentofacial Orthopedics 2011;139:e203-e210.
98. Arat ZM, Rübendüz M, Arman Akgül A. The displacement of craniofacial reference landmarks during puberty: a comparison of three superimposition methods. The Angle orthodontist 2003;73:374-380.
99. Trpkova B, Prasad NG, Lam EW, Raboud D, Glover KE, Major PW. Assessment of facial asymmetries from posteroanterior cephalograms: validity of reference lines. American journal of orthodontics and dentofacial orthopedics 2003;123:512-520.
100. Athanasiou AE. Orthodontic cephalometry. London ; Baltimore: : Mosby-Wolfe; 1995.
101. Major PW, Johnson DE, Hesse KL, Glover KE. Landmark identification error in posterior anterior cephalometrics. The Angle orthodontist 1994;64:447-454.
102. MIDTGÅRD J, BJÖRK G, Linder-Aronson S. Reproducibility of cephalometric landmarks and errors of measurements of cephalometric cranial distances. The Angle orthodontist 1974;44:56-61.
103. Jacobson A, RL J. Radiographic Cephalometry: From Basics to 3-D Imaging, (Book/CD-ROM set), Chapter 24; 2007: p. 293-299.
104. Baumrind S, Frantz RC. The reliability of head film measurements: 1. Landmark identification. American journal of orthodontics 1971;60:111-127.
105. Afrand M, Ling CP, Khosrotehrani S, Flores-Mir C, Lagravère-Vich MO. Anterior cranial-base time-related changes: A systematic review. American Journal of Orthodontics and Dentofacial Orthopedics 2014;146:21-32.e26.
106. Moss ML, Salentijn L. Differences between the functional matrices in anterior open-bite and in deep overbite. American journal of orthodontics 1971;60:264-280.
107. Keith A, Campion GG. A Contribution to the Mechanism of Growth of the Human Face. International Journal of Orthodontia, Oral Surgery and Radiography 1922;8:607-633.
108. Bidarkotimath S, Viveka S, Udyavar A. Vidian canal: radiological anatomy and functional correlations. J Morpholl Sci 2012;29:27-31.

134
109. Chen J, Xiao J. Morphological study of the pterygoid canal with high-resolution CT. Int J Clin Exp Med 2015;8:9484-9490.
110. Sayinsu K, Isik F, Trakyali G, Arun T. An evaluation of the errors in cephalometric measurements on scanned cephalometric images and conventional tracings. Eur J Orthod 2007;29:105-108.
111. Jacobson A, Jacobson RL. Radiographic Cephalometry: From Basics to 3-D Imaging, (Book/CD-ROM set) ,Chapter 7. 2007.
112. Gupta T. Localization of important facial foramina encountered in maxillo‐facial surgery. Clinical Anatomy 2008;21:633-640.
113. Aggarwal A, Kaur H, Gupta T, Tubbs RS, Sahni D, Batra YK et al. Anatomical study of the infraorbital foramen: A basis for successful infraorbital nerve block. Clin Anat 2015;28:753-760.
114. Damstra J, Fourie Z, Slater JJH, Ren Y. Reliability and the smallest detectable difference of measurements on 3-dimensional cone-beam computed tomography images. American journal of orthodontics and dentofacial orthopedics 2011;140:e107-e114.
115. Weisstein EW. "Point-Plane Distance.". MathWorld--A Wolfram Web Resource. http://mathworld.wolfram.com/Point-PlaneDistance.html; 2016.
116. Portney L WM. Foundations of clinical research: applications to practice.: Prentice Hall, Upper Saddle River 2008.
117. Nagasaka S, Fujimura T, Segoshi K. Development of a non-radiographic cephalometric system. Eur J Orthod 2003;25:77-85.
118. Berge JK, Bergman RA. Variations in size and in symmetry of foramina of the human skull. Clinical anatomy 2001;14:406-413.
119. Marmary Y, Zilberman Y, Mirsky Y. Use of foramina spinosa to determine skull midlines. The Angle Orthodontist 1979;49:263-268.
120. Williamson PC, Major PW, Nebbe B, Glover KE, West K. Landmark identification error in submentovertex cephalometrics: a computerized method for determining the condylar long axis. Oral Surgery, Oral Medicine, Oral Pathology, Oral Radiology, and Endodontology 1998;86:360-369.
121. Madsen DP, Sampson WJ, Townsend GC. Craniofacial reference plane variation and natural head position. The European Journal of Orthodontics 2008;30:532-540.
122. Braun S, Hnat WP, Johnson BE. The curve of Spee revisited. American journal of orthodontics and dentofacial orthopedics 1996;110:206-210.
123. Damgaard C, Caspersen LM, Kjaer I. Maxillary sagittal growth evaluated on dry skulls from children and adolescents. Acta Odontol Scand 2011;69:274-278.
124. Sejrsen B, Jakobsen J, Kjær I. Human palatal growth evaluated on medieval crania using nerve canal openings as references. American journal of physical anthropology 1996;99:603-611.
125. Ikuta CRS, Cardoso CL, Ferreira-Júnior O, Lauris JRP, Souza PHC, Rubira-Bullen IRF. Position of the greater palatine foramen: an anatomical study through cone beam computed tomography images. Surgical and Radiologic Anatomy 2013;35:837-842.

135
126. Pinheiro-Neto CD, Fernandez-Miranda JC, Rivera-Serrano CM, Vaezi AE, Snyderman CH, Gardner PA. Endoscopic Anatomy of the Palatovaginal Canal (Palatosphenoidal Canal): A Landmark for Dissection of the Vidian Nerve during Endonasal Transpterygoid Approaches. Skull Base 2011;21:A045.
127. Mahboubi H, Wu EC, Jahanbakhshi R, Coale K, Rothholtz VS, Zardouz S et al. A novel method to determine standardized anatomic dimensions of the osseous external auditory canal. Otol Neurotol 2012;33:715-720.
128. Pancherz H, Gökbuget K. The reliability of the Frankfort horizontal in roentgenographic cephalometry. The European Journal of Orthodontics 1996;18:367-372.
129. Choi JW, Jung SY, Kim H-J, Lee S-H. Positional symmetry of porion and external auditory meatus in facial asymmetry. Maxillofacial plastic and reconstructive surgery 2015;37:1.
130. Periago DR, Scarfe WC, Moshiri M, Scheetz JP, Silveira AM, Farman AG. Linear accuracy and reliability of cone beam CT derived 3-dimensional images constructed using an orthodontic volumetric rendering program. The Angle orthodontist 2008;78:387-395.
131. Springate S. The effect of sample size and bias on the reliability of estimates of error: a comparative study of Dahlberg's formula. The European Journal of Orthodontics 2012;34:158-163.
132. Garib DG, Henriques JF, Carvalho PE, Gomes SC. Longitudinal effects of rapid maxillary expansion. Angle Orthod 2007;77:442-448.
133. Chang JY, McNamara JA, Jr., Herberger TA. A longitudinal study of skeletal side effects induced by rapid maxillary expansion. Am J Orthod Dentofacial Orthop 1997;112:330-337.
134. Brin I, Ben-Bassat Y, Blustein Y, Ehrlich J, Hochman N, Marmary Y et al. Skeletal and functional effects of treatment for unilateral posterior crossbite. Am J Orthod Dentofacial Orthop 1996;109:173-179.
135. Marshall SD, Southard KA, Southard TE. Early transverse treatment Seminars in Orthodontics: Elsevier; 2005: p. 130-139.