trapping network: user's guide - nrcancfs.nrcan.gc.ca/pubwarehouse/pdfs/9767.pdf · trapping...
TRANSCRIPT
°l%
100-05951/
NODA/NFP TECHNICAL REPORT TR-38
Data Management System for the
Spruce Budworm Pheromone
Trapping Network: User's Guide
D. Barry Lyons, Barry G. Pierce, and Christopher J. Sanders
Natural Resources Canada
Canadian Fores! Service
Great Lakes Forestry Centre
P.O. Box 490
Sault Ste. Marie, Ontario
P6A 5M7
Telephone: 705-949-9461
Fax: 705-759-5700
Email: [email protected]
1997
CANADA
IONTARIO Noriturn Ontario
pp
. dp nurd de I'OpiIjtl^
Forestry • Forcsteric
Funding for this repott has been provided through the
Northern Ontario Development Agreement's Northern Forestry Program.

Canadian Cataloguing in Publication Data
The National Library of Canada has catalogued this publication as follows:
Lyons. D. B.
Data management system for the spruce budwonn
phcromonc trapping network : user's guide
(NODA/NFP Technical report; TR-38)
Includes an abstract in French.
Includes bibliographical references.
ISBN0-6C2-25275-6
Cat. no. Fo29-42/38-1997E
1. Spruce budworm—Control-Computer programs—Handbook, manuals, etc 2. Pheromones—Computer programs—Handbooks, manuals, etc. 3. Insect imps—Computer programs—Handbooks, manuals, etc.
4. Forest insects—Control—Computer programs—Handbooks, manuals eic I. Pierce, B.C.
II. Sanders, C. J.
III. GreaL Lakes Forestry Centre.
IV. Title.
V. Series.
S13945.S7L96 1997 634.9752678 C97-98O332-2
' Her Majesty the Queen in Right of Canada 1997 Catalogue No. Fo29-42/38-]997
ISBN 0-662-25276-6
ISSN 1195-2334
Copies of this publication are available at no charge from: Publications Services
Natural Resources Canada
Canadian Foresi Service
Great Lakes Forestry Centre
P.O. Box 490
Sault Ste. Marie, Ontario
P6A 5M7
Microfiche copies of this publication may be purchased from: Micro Media Inc.
Place du Portage
165,Hoiel-dc-Villc
Hull, Quebec J8X 3X2
This report was produced in fulfillment of the requirements for NODA/NFP Project No. 4217 "Predicting budworm ouihreaks with pheromone traps".

Lyons, D.B.; Pierce, B.G.; Sanders, CJ. 1997. Dala management system
for the spruce budworm plieramone trapping network: User's guide. Nat.
Resour. Can., Canadian Forest Service, Great Lakes Forestry Centre, Sault
Ste. Marie, ON. NODA/NFP Tech. Rep. TR-3S. 38 p.
ABSTRACT
A data management system for spruce budworm pheromone trapping data
has been developed to operate on a MS-DOS platform running Windows.
The system produces contour maps of moth captures that can be used in a
geographic information system (GIS). A graphic user interface (GUI),
written in Visual Basic, actively links the system components. The GUI
allows the user access to a database to enter and manipulate data. Point data
are interpolated (and extrapolated) into complete spatial coverage using a
geo.statistical technique known as block kriging. The system uses a scries
of public domain FORTRAN software programs (GSLIB) for analysis and
in-house developed C++ programs for formatting and parameter file cre
ation. The steps are highly automated using defaults calculated from the
data set and "rules of thumb". Idrisi. which is a fully functional and inex
pensive raster-based GIS. is linked to the system. Maps can be exported to
other GIS formats; however, to produce publication quality maps, the user
can export maps from the GIS to CorelDRAW! from within the GUI.
RESUME
On a developpe un sysleme de gestion des donnees sur la capture de la
tordeusedes bourgeons de I'epinetteau inoyen de piegesapheromoncs;ce
systeme tourne surune plate-forme MD-DOS sous Windows. II produit des
cartes d'isoligncs des niveaux de capture des insectes, canes qui peuvent
etre utilisees dans un sysieme d'information geographiquc (SIG). Une in
terface utilisateurgraphique, redigee en Visual Basic, reliedynamiquement
iescomposantesdusy steme. Cette interface pcrmet a I'utilisateurd'acceder
a une base de donnees dans laquelle il pcut entrer et manipuler des donnees.
Par interpolation et extrapolation des donnees recueillies, on obtient une
couverture spatiale complete par la technique geostatistique du krigeage de
blocs. Le systeme utilise une serie de programmes FORTRAN du domainc
public (GSLIB) pour I'analyse, et des programmes C++ developpes a
1'internc pour le formatage et la creation de fiehiers de parametres. Les
etapes du processns sont fortement automatisees grace aux valeurs par
defaut calculecs a partir de I'ensemble de donnees et a des "regies pra
tiques". Idrisi, un SIG a images trainees fonctionnel et peu couteux, est relie
au systeme. Les cartes peu vent etre exportccs dans d"autres formats de SIG;
loutefois, pourproduirc des cartes avec une qualite publiable. I'utilisateur
peut les exporter du SIG vets CorelDRAW depuis 1'interface graphique.
TABLE OF CONTENTS
INTRODUCTION 1
Spatial Analysis 1
GRAPHIC USER INTERFACE 3
TRAP MANAGEMENT DATABASE 5
GEOSTATISTICAL MODULE 9
Select Working Directory 10
Select Data Set 10
Equidistant Azimuthal Projection Conversion 12
Create Idrisi Vector Files 13
GSLIB Format 13
Construct Variogram Model 13
Interpolation (Kriging) 16
Back Transformation 16
Create IDRISI Image File 16
Reclassify z-values in Idrisi 17
GEOGRAPHICAL INFORMATION SYSTEM 18
STRUCTURED DRAWING PROGRAM 20
ACKNOWLEDGMENTS 21
LITERATURE CITED 22
APPENDIX 1: OUTPUT FILES FROM THE PHEROMONE
TRAPPING NETWORK 23
Back Transformation File 23
Data Files 24
Debugging File 25
Idrisi Image Document Files 25
Idrisi Vector Document File 27
Idrisi Environment File 27

Idrisi Image Files 28
Output File 28
IDRISI Palette File 28
Parameter Files 29
Point Files 32
Transformation File 33
Text Files 33
Value File 35
Variogram File 35
Idrisi Vector File 36
APPENDIX 2: GLOSSARY OF TERMS 37

INTRODUCTION
Spatial Analysis
The spruce budworm, Chorhtoneiira fiuniferana (Clements), is the most
serious defoliator of spruce (Picea spp.) and balsam fir (Abies balsamea (L.)
Mill.) trees in the boreal forest of North America. The species is transcontinen
tal, occurring from Newfoundland lo Alaska and down inlolhc northeastern US.
Females of the spruce budworm produce a powerful sex pheromonc. The
identification of this pheromonc (Sanders and Wcaiherston 1976) allowed the
development of a monitoring program for spruce budworm using sex phero
monc traps. During the CANUSA Spruce Budworms Project the program was
accelerated and resulted in a coordinated monitoring program across eastern
North America. The program has now been further expanded to include the
Prairie provinces (Sanders 1992, Sanders and Lyons 1993).
The rationale for the monitoring program is described in detail by Sanders
(1992). Briefly, sex pheromone traps arc far more sensitive and efficient than
conventional branch sampling techniques and can track changes taking place
at extremely low huclworm densities between outbreaks. When set lo monitor
ihe same locations annually, pheromone traps can be used as an early warning
system, detecting increasing population densities several years before defolia
tion is evident. Moreover, by establishing the relationship between moth catch
and larval density, catches can also be used to indicate when populations have
reached threshold densities that can be assessed more definitively by conven
tional sampling techniques. Protocols for the deployment and handling of the
traps were outlined by Allen ct al. (1986) and subsequently updated by
Sanders .
Conventional sampling of spruce bud worm determines the number of insects
per branch or unit of foliage. Conventional sampling and pheromone trapping
generate point data. Thai is, samples for an area are collected at a single point.
The number of samples collected is limited by available resources — labor,
materials, and logistical costs — soil is usually not possible to sample all areas
of interest. If the resulting data arc plotted on a map using different symbols for
population level categories, the end result is often a mosaic of dots with liitle
interprelable pattern. Using point data, it is difficult to estimate population
levels in areas between the sample points.
Complete spatial coverage resulting from aerial surveys or satellite imagery
showing insect caused depredations (e.g., defoliation or tree mortality) arc
some of ihe few exceptions of indices of population density that are not point
data. Compleic spatial coverage is required for most geographical information
system (CIS) applications. Contour map data can be electronically digitized
into polygons or rasters from survey maps for use in a GIS. Year-to-year
changes can be determined using mapalgebrain the GIS. Unfortunately, by the
time that defoliation is apparent from the air or space, the time and the options
available for forest management response are greatly reduced. Other popula
tion thematic data cannot be used in GIS-based predictive models if the data are
in poini format. Therefore, there is a need to transform point data inlo complete
spatial coverage in a meaningful way. One solution to the problem is provided
through the use of geostatistical techniques (Liebhold et al. 1993). These
Sanders, C.J. (in prep.) Pheromone imps for predicting spruce budworm outbreaks: A user's guide. Nat. Resour. Can.,
Canadian Forest Service, Great Lakes Forestry Centre, Saull Ste. Marie. ON.
Data Management System for the Spruce Budworm Pheromone Trapping Network: User's Guide

numerical methods, as the name implies, have their origins in geological
explorations. Geostatistics provides the mathematical tools required to interpo
late between sample points. Significant advances have been made in adapting
these methods to forest entomological problems (Cage 1990, Liebhold ct al.
1993. Lyons and Sanders 1993).
This manual describes a series of software tools, incorporating geostatistical
techniques, that have been developed to produce contour distribution maps of
male moth captures of the spruce budworm in pheromone traps for CIS
analysis. The geographic location of each irap grid is defined using UTM
(Universal Transverse Mercator) coordinates (Snyder 1987). The world is
divided into 60 UTM zones that run from pole to pole. Each zone encompasses
6 degrees of longitude. Contiguous trap coverage (excluding traps in Alberta
and Saskatchewan) occurs from zone 15 in western Ontario lo /one 22 in
eastern Newfoundland. For the Pheromone Trapping Network, the location of
the traps within a zone is defined by a two-digit easting and a three-digit
northing. This defines the location of the traps to the nearest 10 km by 10 km
grid. Ten consecutive years of data are being analyzed from about 700 trap
locations within the distribution of spruce budworm in North America. Con
tour intervals represent "isomoths" or regions of equal moth numbers or
categories. The long term goal is to use these software tools to analyze patterns
of spruce budworm populations and to develop models using these techniques
to predict budworm outbreaks. This system also serves as a model lo demon
strate the utility of the techniques for other entomological point data. This
manual assumes that you are familiar with the Microsoft Windows operating
environment, and that you have already installed the programs using the
instructions in Lyons and Sanders".
2 Lyons, D.B., Sanders,C.J. (inprep.) Adatnmanagetnent and map interpolaiionsystemforspruce budworm pheromone Iraps.
Nat. Resour. Can., Canadian Forest Service. Great Lakes Forestry Centre, Sault Sic. Marie, ON.
2 Data Management System for the Spruce Budworm Pheromone Trapping Network: User's Guide

GRAPHIC USER INTERFACE
SBW
System
Figure I. The graphic user interface
(GUI) of the data management system
far the spruce budworm pheromone
trapping network
Database
Kriging
Idrisi
CorelDRAW!
Convert File
Geocalc
When the SBWSystem icon is activated (ram Windows, the following graphic
user interface (GUI) window will open.
Kiiging
BOH
CorelDRAW!
Conveil File I Exit
The GUI is written in the Visual Basic Version 4.0 programming language.
This window allows you to navigate through the .system. There are six large
buttons on the left side of the window, with the following functions:
Opens the Trap Management Database lor manipulation of the data.
Accesses the geostatistical module for conversion of point data inio contour
interval maps.
Accesses the geographical information system.
Launches the structured drawing program.
Launches a file conversion utility.
Runs the Geographic Calculator (Blue Marble Geographies, Gardiner, Maine),
a map projection conversion program.
Data Management System for thn Spruce Budworm Pheromone Trapping Network: User's Guide

Help
Configure n Exit
In addition, there are three smaller buttons on the right side of the window with
the following functions:
Runs a Windows Help utility — essentially a hypertext version of this manual.
Allows you to custom configure the system for a specific computer.
Closes the program.
The modules and functions assigned to the GUI are shown in the following
flowchart.
Figure 2. A flowchart showing the
modules and functions lhat are
accessed from ihe GUI.
Convert
File
File Ccnwatiion
U! ■.
START Exit
Minimize
see Fig. 3 see Fig. 7
Data Management System for the Spruce Budworm Pheromone Trapping Network: User's Guide

TRAP MANAGEMENT DATABASE
A flowchart of the steps lor editing and manipulating phcromonc trap data in the Database module is shown in Figure 3.
Figure 3. A flowchart detailing the
stepsfor editing and manipulating data
in the pheromane trap database.
Edil'View Trap
I
Selecl Stalions
to Edi!
Select OK
Edit Dala
Copy changes1o
main database
lable
And Neiv
Trap Locations Manual Data
Input
Data Management System lor the Spruce Budworm Phemmonc Trapping Network: Users Guide

Figure 4. The Trap Management
Database window in Microsoft Access-
Add New Trap Database
Edit/View Trap Database
I Exit
Click the Database hutton on the GUI to open the Microsoft Access Version
2.0 database file. The following Trap Management Database window is
displayed on the screen.
V- -»,:vr. * " v:- ,1-V :':V"_;.^
Database ■■ ■
■ ' ■ ■.' - ■ ■■ •„■''.
::' ■• ■.'■."■' ■■"■■■.■■".: ■
This database Hie (e.g., SBW.MDB) contains all the data tables, screen forms
and associated programs to edit and view the dala. There arc three options from
this window:
Allows iht: user to enter new UTM locations.
Allows the user to work with existing data.
Closes the database and returns the user to the GUI.
Data Management System for the Spruce Budworm Pheromone Trapping Network: User's Guide
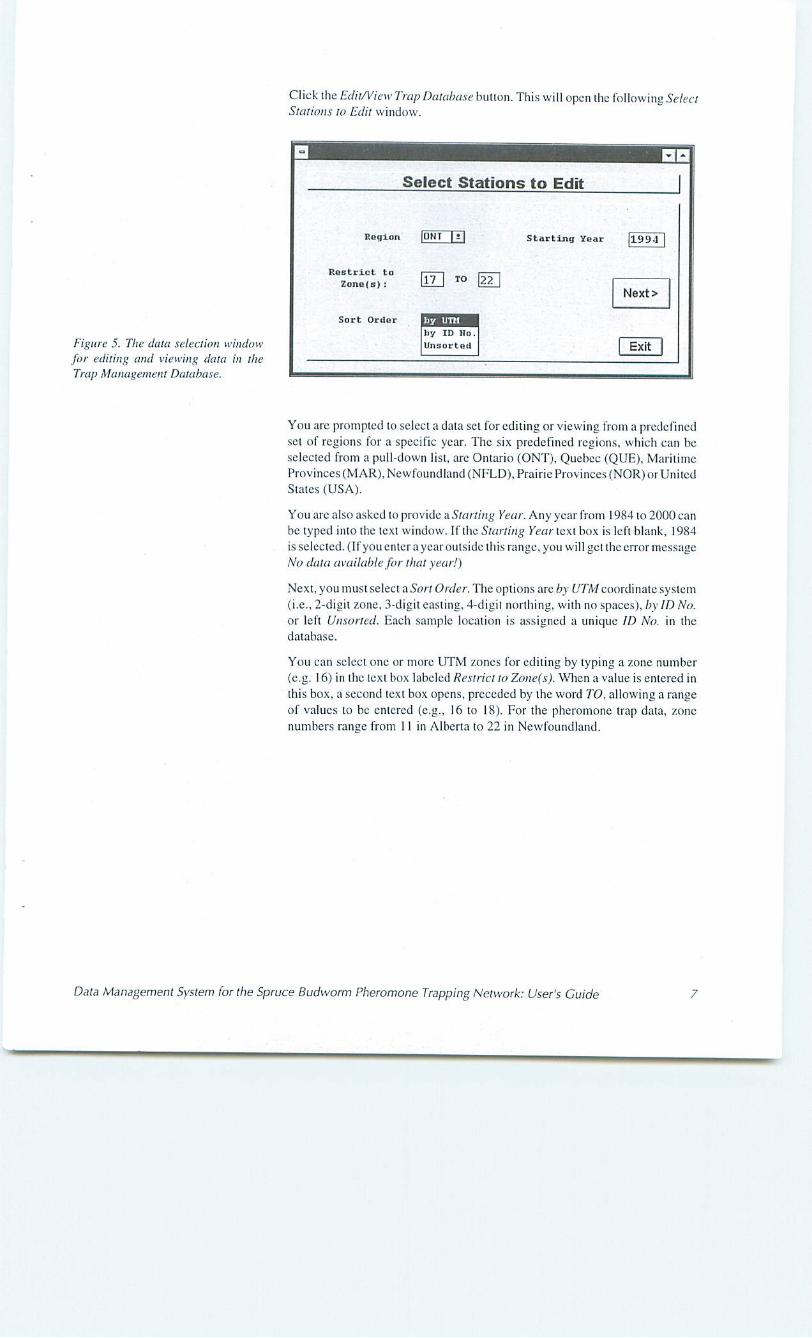
Click the Edit/View Trap Database bullon. This will open the following Select
Stations to Edit window.
Figure 5. The data selection window
for editing and viewing data in the
Trap Management Database.
Select Stations to Edit
Restrict to
Zono(s);
Sort Order
Starting Year 1D9J
17 TO 22
liy ID Ho
Unaortert
Next>
You are prompted to select a data set for editing or viewing from a predefined
set of regions for a specific year. The sis predefined regions, which can be
selected from a pull-down list, are Ontario (ONT), Quebec (QUE), Maritime
Provinces (MAR), Newfoundland (NFLD), Prairie Provinces (NOR) or United
Stales (USA).
You are also asked to provide a.Starling Year. Any year from 19K4 to 20(10 can
be typed into the text window. If the Starting Year text box is left blank, 1984
is selected. (If you enierayearoulsidc this range, you will get the error message
No data available for that year!)
Next, you musi select a Sort Order. The options are by UTM coordinate system
(i.e., 2-digit zone, 3-digiteasiing, 4-digii northing, with no spaces), by ID Ho.
or left Vnsorted. Each sample location is assigned a unique ID No. in the
database.
You can select one or more UTM zones for editing by typing a zone number
(e.g. 16) in the text box labeled Restrict to Zone(s). When a value is entered in
[his box, a second text box opens, preceded by the word TO, allowing a range
of values to be entered (e.g., 16 to IS). For the pheromone trap data, /.one
numbers ransze from 11 in Alberta to 22 in Newfoundland.
Data Management System for the Spruce Budworm Pheromone Trapping Network: User's Guide 7

Figure 6. Data editing and viewing
window in the Trap Management
Database.
Once the desired starting pointfor editing is defined, click the Next button. This
closes me Select Stations to Edit window and opens a dala editing and viewing
window like the following.
ONT | Yeu |I99<| ««*«■■
U/IOM
The editing and viewing window consist of three sections, a header, a footer,
and a detail section.
The header displays the Region and Year selecied and the titles for the dala
columns. The header's Find UTM text box allows you to locate a specific
UTM coordinate. Type a UTM value, in the same format as described
previously, inio the lext window and press the<Enter> key and the system will
search the database for that coordinate and display ii in the first Hue of the detail
seeiion. The circle labeled Working... will darken when information is being
processed.
The detail section coniains the selected dala. Each row represents one phcro-
mnne trapping location. The first column displays the UTM coordinates of the
sample louaiion while columns 3 to 5 show the number of male moths captured
in the three traps at that location. Column 6 displays the average for ihc three
iraps. This figure is automatically calculated as data is entered in the other three
columns; however, if the cooperator providing the data only gives average
values, ihesc can be entered direelly into the average column.
Additional columns in the delail section allow for input of auxiliary data.
Columns 2.7, 8, and 9 provide space for the number of 3rd and 4th i nstar larvae
per branch (L3-L4), the number of 2nd instar larvae per 10 sq.m of foliage (L2/
HIM), the percent defoliation (% DHF). and the number of egg masses per
branch (Egg Mass), respeclively.
The footer section of the form contains four buttons. The Prev Year and Next
Year buttons allow you lo move backwards and forwards through the years of
dala. Pressing the Selea bulion will return you lo the data selection window.
The End button exits the data editing and viewing window and returns you lo
the GUI. As you exit the dalabase, a small window opens asking Update Main
Table? Seiecl YES or NO depending on whether or not the changes to the file
are lo be saved.
Data Management System for the Spruce Budworm Pheromone Trapping Network: User's Guide

GEOSTATISTICAL MODULE
Figure 7. A flowchart showing the
analysis steps in the krlging
(geosiaiistical) module of the data
management system for spruce
budworm pheromone traps.
The following flowchart describes the functioning oftbegeostatistical module (Figure 7).
i Working
Normal Score
Transiormaiion
Craala IDRISI Image
Frla
Back Tran^lormalion
Selecr Va
I-ike the GUI, this module is a shell program written in Visual Basic. Ils purpose
is io automate the interpolation of point data to raster map coverage in a
meaningful way.
Data Management System for the Spruce Budworm Pheromone Trapping Network: User's Guide
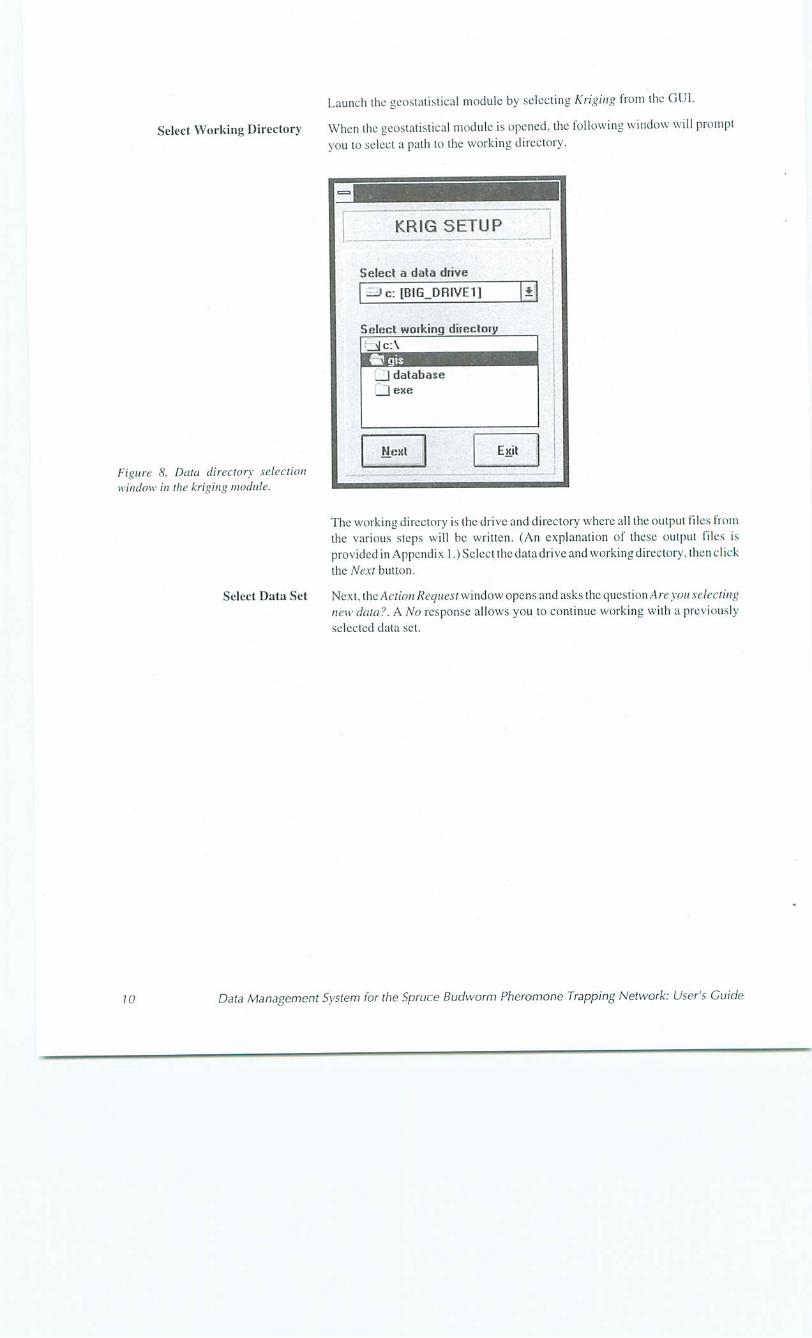
Launch the geostatistical module by selecting Kriging from the GUI.
Select Working Directory When the geostatistical module is opened, the following window will prompt
you to select a path to the working directory.
Figure 8. Deila directory selection
window in the kriging module.
KRIG SETUP
Select a data drive
c:IB1G_DRIVE1]
Select working directory
database
| ewe
Next Exit
Select Data Set
The working directory is the drive and directory where all the output Hies from
the various steps will he written. (An explanation of these output files is
provided in Appendix I.) Select the data drive and working directory, then click
the Next button.
Next, tbsAclionBequest window opens and asks the questionAreyonseleaing
new data?. A No response allows you to continue working with a previously
selected data set.
10 Data Management System for the Spruce Budworm Pheromone Trapping Network: User's Guide
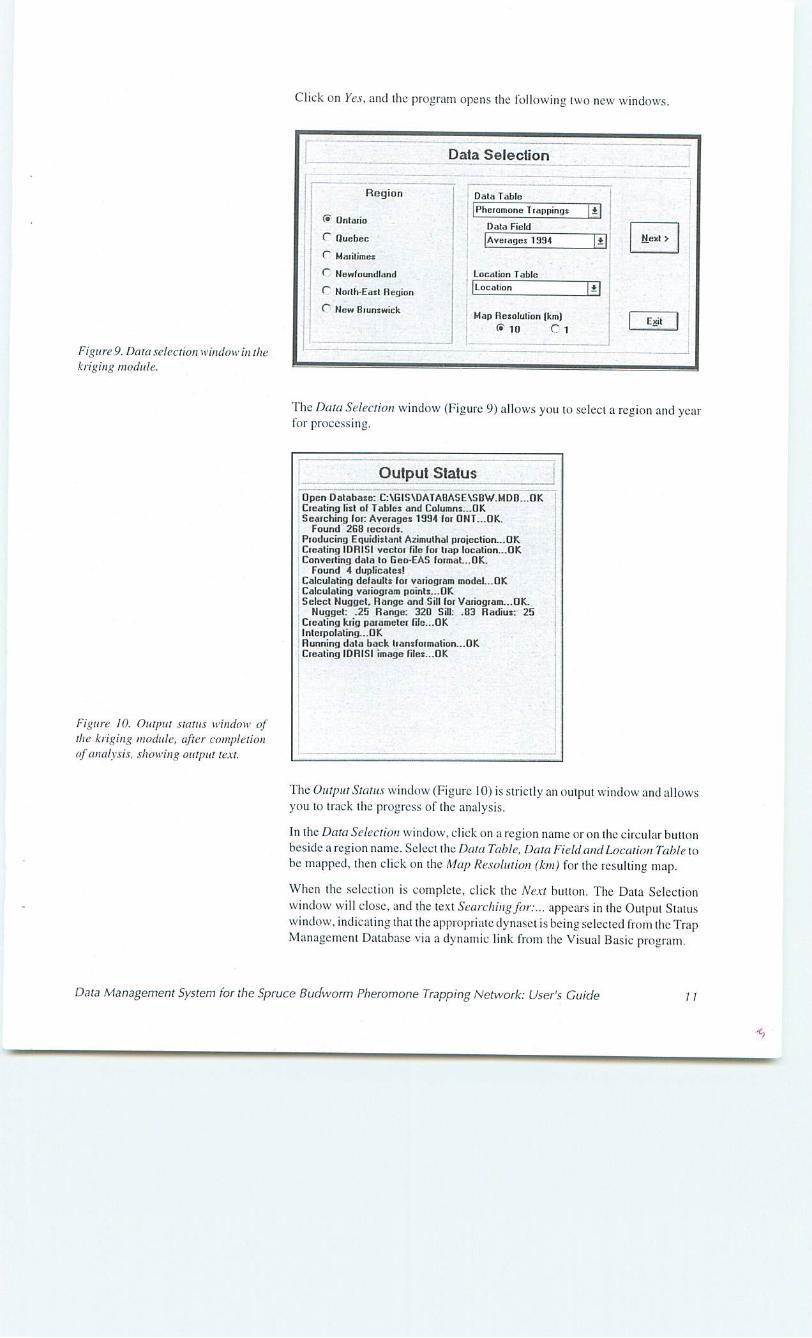
Click on Yes, and the program opens the following two new windows.
Figure9. Dala selection window in the
k rig ing moduli:.
Data Selection
Data Table
Pheramonu Trappings
Data Field
1334
The Data Selection window (Figure 9) allows you to select a region and year for processing.
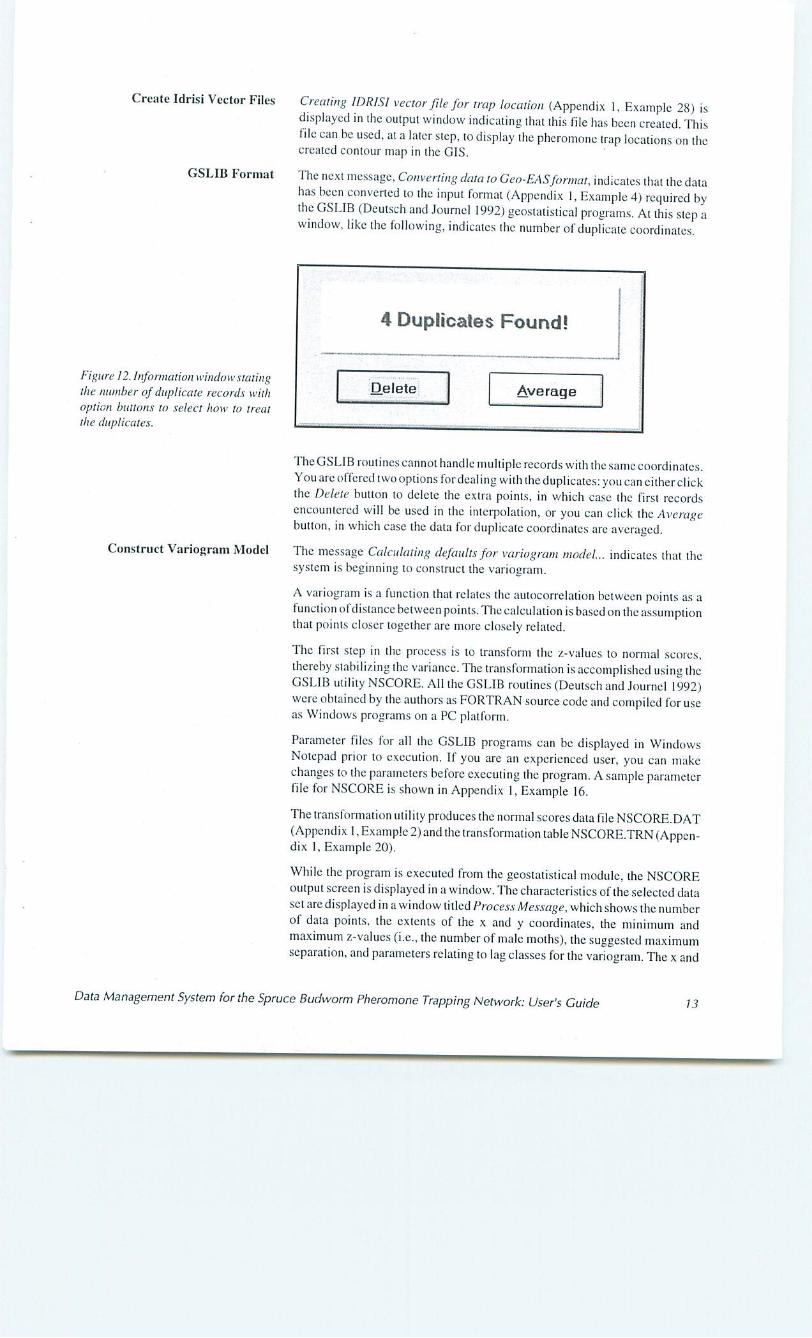
Figure 10. Output status window of
the kriging module, after completion
of analysis, showing output text.
Output Status
Open Database: CAGI5\DATA13ASE\SBW.MDB...OK
Dealing list o( Tables anil Column:...OK
Searching lor: Averages 1S94 lot [INT...OK.
Found 2GB record).
Producing Equidistant Azimuthal projection...OK
Creating IDRISI vector Hie For trap location...OK
Converting dala to Geo-EAS format...OK.
Found A duplicate!!
Calculating default! for variogram model...OK.
Calculating variogram points...OK
Select Nugget. Flange and Sill for Variogiam...OK.
Nugget: .25 Range: 320 Sill: .33 Radius: 25
Creating krig parameter file...OK
li.ii..,'. ' 11,
Running data back transfarmalion...OK
Creating IDRISI image files...QK
The Output Status window (Figure 10) is strictly an output window and allows
you to track the progress of the analysis.
In the Data Selection window, click on a region name or on ihe circular button
beside a region name. Select the Dala Table, Dam Field and Location Table to
be mapped, then click on the Map Resolution (km) for the resulting map.
When the selection is complete, click the Next buuon. The Dala Selection
window will close, and the text Searching for:... appears in the Output Status
window, indicating thai the appropriate dynaset is being selected Irom the Trap
Management Database via a dynamic link from the Visual Basic program.
Dala Management System for the Spruce Budworm Pheromone Trapping Network: User's Guide U

Nexl, a small window, like the following, lists the number of records found.
Figure 11. Information window suiting
the number of records selected from
the database.
Found 260 records.
Equidistant Azimuthal
Projection Conversion
Ai this point, you can cither select the Back button and go to the previous Dutit
Selection window. Exit the program or click ihe Next hullon in this window to
continue.
The output filename (Appendix 1. Example 18), although not displayed, is
made up of the three letter region code, plus the last two digits of the year,
followed by the extension ".PTS". Thus, the output filename for 1992 daia from
Quebec would be QUB92.PTS. The output file contains the sample point
locations in hitiiude/longilude coordinates.
Next, Producing Equidistant Azinuithal Projection is displayed in the output
window to indicate that ihc selected data are about to be converted from the
Geodetic (latitude/longitude) coordinate system to an equidistant azfrnuthal
projection. An equidistant projection is used for the interpolation procedure,
since it requires that we work in real world distances between points. At this
poinl the geostatistical module opens The Geographical Calculator. The opening
screen with the company logo is briefly displayed and then the conversion
window is displayed. In the conversion window, the conversion systems
(predefined for each region) are displayed. The coordinates wilhin a region arc
specified in positive and negative distances (m), north or south f Y coordinate)
and easi or west (X coordinate) of a poinl in the ccnlre of the region. You do
not need to provide any input at this step.
Once the conversion is completed the program indicates the number of poinls
processed from the input file to the output file. The ouiput filename for Ihe
conversion consists of the input file, preceded by the Idler E for equidistant
(Appendix 1, Example 19). So, the input file QUE92.PTS would produce ihc
output file EQUE»2.PTS.
A second information window opens at this poinl and gives the same informa
tion about the number of poinls processed and the input and outpul filenames.
Click OK lo continue. Close The Geographic Calculator window by clicking
the button on ihe upper left corner or opening File from the menu bar and
selecting ihe menu item Exit.
12 Data Management System for the Spruce Budworm Pheromone Trapping Network: User's Guide
Create Idrisi Vector Files
GSLIB Format
Creating IDRISI vector file for trap location (Appendix 1. Example 28) is displayed in the ouipul window indicating that this file has been created. This file can be used, at a later step, <o display the pheromone trap locations on the created contour map in the GIS.
Hie next message, Converting data to Gen-EASformat, indicates that the data has been convened to the input format (Appendix 1, Example 4) required by the GSLIB (Deutsch and Joumel 1992) geostatistical programs. At this step a
window, like the following, indicates the number of duplicate coordinates.
Figure 12. Information window staling
the number of duplicate records with
option buttons to select how to treat
the duplicates.
Construct Variogram Model
4 Duplicates Found!
Delete Average
The GSLIB routines cannot handle multiple records with the same coordinates.
You are offered two options fordealing with the duplicates: you can eitherclick
Ihe Delete button to delete the extra points, in which case the first records
encountered will be used in the interpolation, or you can click the Average
button, in which case the data for duplicate coordinates are averaged.
The message Calculating defaults for variogram model... indicates that the system is beginning to construct the variogram.
A variogram is a function that relates ihe autocorrelation between points as a
Junction of distance between points. The calculation is based on the assumption
that points closer together arc more closely related.
The first step in the process is to transform the z-values to normal scores,
thereby stabilizing the variance. The trans formation is accomplished using the
GSLIB utility NSCQRE. All the GSLIB routines (Deutsch and Journel 1992)
were obtained by the authors as FORTRAN source code and compiled for use
as Windows programs on a PC platform.
Parameter files for all the G.SLIB programs can be displayed in Windows
Notepad prior to execution. If you are an experienced user, you can make
changes to the parameters before executing the program. A sample parameter
file for NSCORE is shown in Appendix 1, Example 16.
The transformation utility produces the normal scores data file NSCORE.DAT
(Appendix 1, Example 2) and the transformalion tahle NSCORE.TRN (Appen dix I, Example 20).
While the program is executed from the geostatistical module, the NSCORE
output screen is displayed in a window. The characteristics of the selected data
set aredispiayed in a window titled Process Message, which shows the number
of data points, the extents of the x and y coordinates, the minimum and
maximum z-values (i.e., the number of male moths), the suggested maximum
separation, and parameters relating to lag classes for the variogram. The x and
Data Management System for the Spruce Budworm Pheromone Trapping Network: User's Guide 13

Figure 13. Variogram plot window in
the kriging module.
y extents are displayed in kilometres and the minimum dimension of the shell
of points is indicated as being in the x or y direction. The system uses an
isotropic variogram model and assumes that the autocorrelation is equal in all
direciions. The Suggested Maximum Separation is defined as half the width ol
the narrowest dimension of the shell of data points (Liebhold et al. 1993). The
system attempts to use 20 lag intervals wilh at least 30 pairs of points in ihc first
lag class. Loss than 30 pairs of points reduces the reliability of variogram
(Liebhold ct al. 1993). If the minimum number of lag intervals is not achieved,
Ihc system reduces the number of lag intervals until 30 pairs is achieved. If 30
pairs ofpoims is not possible, processing continues but a warning message is
displayed in this window. Parameters nlag, xlag, and xltol, which arc displayed
in the window, are the number of lag intervals, unit separation distance, and lag
tolerance, respectively.
Next, the system opens the Windows Notepad and displays (he file
GAMV2.I'AR. This is the parameter file for the GSLIB routine GAMV2
(Deulseh and Journcl 1992) that constructs the variogram. If you are an
experienced user, you could change parameter values at this point; usually,
however, this window is closed by clicking the button on the upper left comer
or opening File from the menu bar and selecting the menu item Exit.
The usermust now fit a variogram model to the variogram data. 'Hie message
Select Nugget and Range for Variogram Model is displayed in the output
window, and a Variogram Plot window like the following will open.
Select Vfliingiam Paiamtlen
Nuggol In
ct V.iringiam Function
s Spherical
r Exponanliol
r Goussion
VARIOGRAM PLOT
Suorth Rndius Z5 Exit
This window contains a graph of observed variogram class values. You must
now modify the parameters by trial and error until you have created a plot with
a goiid fit. This model will then be used in the interpolation procedure. (Models
must be fitted this way, rather than by a nonlinearregression technique, because
of the disproportionate weighting of lag classes.)
In the upper left corner of the window is the section titled Selecr Variogram
Parameters. Here you may enter parameter values for the model. Three
parameters arc required: Nugget, Range, and Sill.
The nugget is the Y value at which the proposed model intersects the Y axis.
This represents the local discontinuity of the data and the reason the model does
not pass through the origin. The sill is the Y value where the data reaches a
plateau and the range is the lag interval where the Y values reach the plateau,
that is the distance over which sample points are aulocon elated.
Data Management System for the Spruce Budworm Pheromone Trapping Network: User's Guide

Below the parameter values, select Vaii&gram Function. The three optional
scmivariogram models (Figure 14) used in the system arc:
(l)a spherical model;
(2) an exponential model; and.
= co cn + c 1.5^ -0.5^ a
* c, if h > a
y(h) = c0 + c
(3) a Gaussian model;
Y(A) = ca + c
1 - exp - -a
1 - exp -
, if h i. a
Plot
where y(h) is the semi variance, c0 is the nugget variance, c is the slruclural
variance, h is lag interval, and a is the range parameter (actual range for
spherical model). The sum of cQ and c is the sill. Selection of model type is
determined subjectively, depending on which model ndequaiely reflects the
distribution of points.
When these values have been estimated, click the plot button and the chosen
function, using selected parameter values, is fitted to the data points on the
graph. Improve the 111 of the model by selecting new parameter values until you
find the fit that looks best.
Figure 14. A hypothetical variogmm
showing ihc nugget, sill, and range,
Three model types with the same
parameter values are shown.
0) u c .CO
(0
1 10
100 200 300 400
lag interval (h)
500 600 700
Data Management System for the Spruce Budworm Pheromone Trapping Network: User's Guide 15

Continue
Interpolation (Kriging)
Back Transformation
Create Idrisi Image File
You may also select the search radius in the Variogram Plot window. This is
the value the interpolation algorithm uses to determine the (linear) distance that
it will search for points to use in ils estimation. The default value in the
pheromone trapping network is 150 km and can be changed by an experienced
user by typing a new value into the tcxi box. The 150 value has no biological
basis but was selected based on ranges of observed data and is a value (hat
produces a minimum of unestimated cells.
When you are satisfied with the values, click the Continue button.
An Action Request window reminds you of the selected values and asks Use
these parameters?. If you were to click No at this point, you would be returned
to the model development window.
Click on Yes. The output window will display the message Clearing krig
parameter file, and the Windows Notepad program will open, displaying the
Tile OKB2D.PAR. This is the parameter Tile for ihe GSLIB routine (Detitsch
and Journel 1992) OKB2D that carries out the two-dimensional ordinary
kriging to interpolate between sample points. The experienced user can modify
this file. When you have finished, or if you do not wish to modify the
parameters, close Notepad by clicking the button on the upper left comer or
selecting Exit from the File menu.
Next, an Action Request window asks Produce Kriged Map?, A Wo response
at this point would stop processing and return you to the GUI. The files are kept
and available when you reenter the system.
Click on Yes to run the OKB2D routine. The line Interpolating... appears in the
output window and the screen goes blank. The OKB2D output window is
displayed indicating kriging is in progress.
The routine uses the input file NSCORE.DAT (Appendix I, Example 2) and
produces the Hie OKB2D.OUT (Appendix I, Example 9) that contains the
kriged estimates. Another file, 0KB2D.DBG, is also created and contains the
debugging information. It is not used further.
The next line to appear in the Output Slants window is the line Running data
back nans-formation. The output window from the GSLIB (Dcutsch and
Journel 1992) routine BACKTR appears on the screen. This routine performs
a back transformation that converts the estimated z-values in normal scores
back lo number of male moths.
The input file is OKB2D.0UT and ihe output file is OKB2D.BTR (Appendix
1, Example 1). NSCORE.TRN is the transformation table (Appendix 1,
Example 20).
The message Creating IDRISI image fde in the output window means thai the
output from the back transformation has been converted to an Idrisi image Tile
format. The message Creating IDRISI.DOC file indicates that the companion
document file is also being created. The Idrisi GIS system requires both types
of file for displaying rasier data.
The image file, with ihe extension .IMG, contains the kriged estimates lor each
rasier in a single column. The .DOC file (Appendix 1. Examples 5 and 6)
coniains the spatial information to plot these rasters, including the number of
columns and rows and the X and Y extents for the data.
Data Management System for the Spruce Budworm Pheromone Trapping Network: User's Guide
a
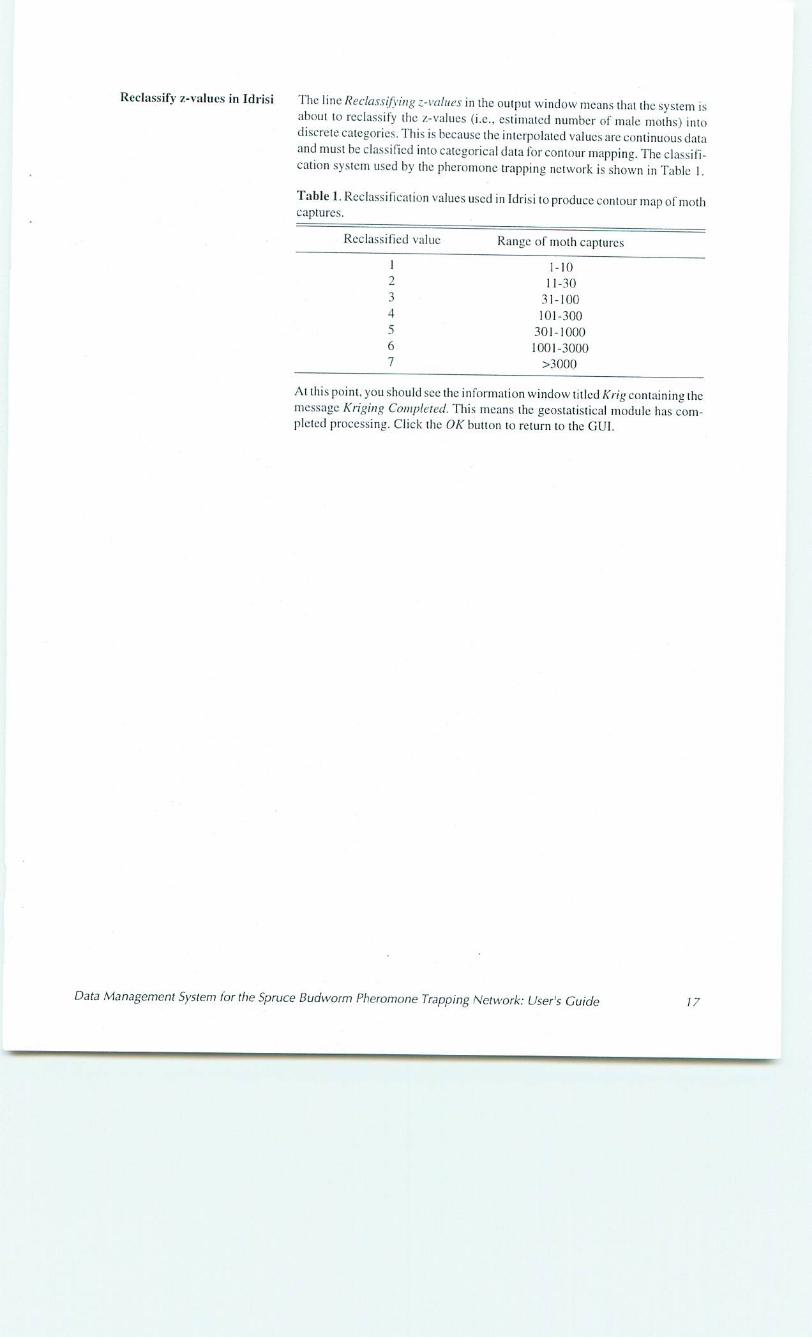
Rectify z-values in Idrisi The line Reclassijying z-values in the output window moans thai the system is about to reclassify the z-valucs (i.e., estimated number of male moths) inio
discrete categories. This is because the interpolated values are continuous data and must be classified into categorical data for contour mapping. The classifi
cation system used by the pheromone trapping network is shown in Table 1.
Table I. ̂ classification values used in Idrisi to produce contour map of moth captures.
Rcclassified value Range of moth captures
1 1-10
2 11-30
3 31-100
101-300
5 301-1000
° 1001-3000
7
At this point, you should see the information window tilled Kiig containing the
message Kri};ing Completed. This means the geostatistieal module has com
pleted processing. Click the OK button to return to the GUI.
Data Management System lor the Spruce Budworm Pheromone Trapping Network; User's Guide 17

GEOGRAPHICAL INFORMATION SYSTEM
Idrisi To display ihe kriged output map, click the Idrisi buttoa from the GUI to open
the geographical information system. The Idrisi menu system will appear.
Use the arrow keys to select Display from this menu and press <Entcr>. Tiie
Display submenu will open. Select Color by pressing the <Enter> key when this item is highlighted. You will be prompted 10 enier the name of the file you
want lo display. Enter the name of the reel assi tied image file, without the .IMG
extension (which is assumed). So, for the file REMAR90.IMG, you would
enter "REMAR90".
When you are prompted to enter the palette you desire, select 4 for User-
Defined palette. At the prompt Enter the name oj the palette file {".pal"
extension assumed), enter ferig to select the file KRIG.PAL (Appendix I.
Example 10). The program responds with Do you wish a legend. Select / for
Yes.
Next the program asks the question Do you wish to display factors by hand
(default - "n"). Press the <Entcr> key, for the default no option. The contour
map will be displayed. To display a posting of sample points over the contour
map, press v for vector. Enter file name: is displayed at the bottom right corner
of the screen. Enter the name of the vector point file (Appendix 1, Example 28)
created in the geostatistical module. Do not add the .VEC extension: it is
assumed.
When Idrisi prompts you to Enter color code, provide a number between 0 and
15. It doesn't matter what number is provided, because Idrisi uses a default
color. A vector map can also be overlaid on the contour map, if one isavailable.
by using the v option. The coordinates of any point on the map ami its z-value
can be obtained by typing c or x, moving the cursor to the desired point, and
pressing the right mouse button.
A kriged contour map of pheromone irap catches for Ontario in 1992 follows.
The contour map produced can now be manipulated using any ol the Idrisi GIS
functions. For more information about idrisi consult the user's guide (Eastman
1992a), technical reference manual (Eastman 1992b), and update manual
{Eastman 1993).
To convert a raster image file to a vector file to export the map for use in
CorelDRAW!, select Pnlyvec from ihe Spatial Data Management submenu.
The program prompts you to enter the name of the image to be processed and
the vector Hie to be created.
To eliminate the background, type Y for yes when you are asked if there is a
background polygon that should not be processed, and enter the numherO when
you are prompted to enter the identi Her number of the background polygon. To
bypass the next prompt (i.e., select the default n), press <Enter> when asked Do
you wish to process only Ihe polygons listed in a values file (y/n).
The next step in producing a vector output file is to select Outpost from the
Import/Export submenu. This creates a vector file in a formal suitable for
importing into CorelDRAW!. Alternatively, an image file can be exported in rasierformatasa.TIFfileandthcndisplaycdinCorelPHOTO-PAlNT'.biuthe
vector format provides more flexibility.
18 Data Management System for the Spruce Budworm Pheromone Trapping Network: User's Guide

Exit the program and remrn to ihe GUI by selecting Exit Menu System from the Idrisi main menu or by pressing ihc escape key twice.
I
Fij'Hre /5. /I kriged contour map of pheromone trap catches fo: Ontario in 1993 displayed in Idrisi with geographic areas overlaid as vectors. The symbols are a vector overlay of sample points.
Data Management System for the Spruce Budworm Pheromone Trapping Network: User's Guide
STRUCTURED DRAWING PROGRAM
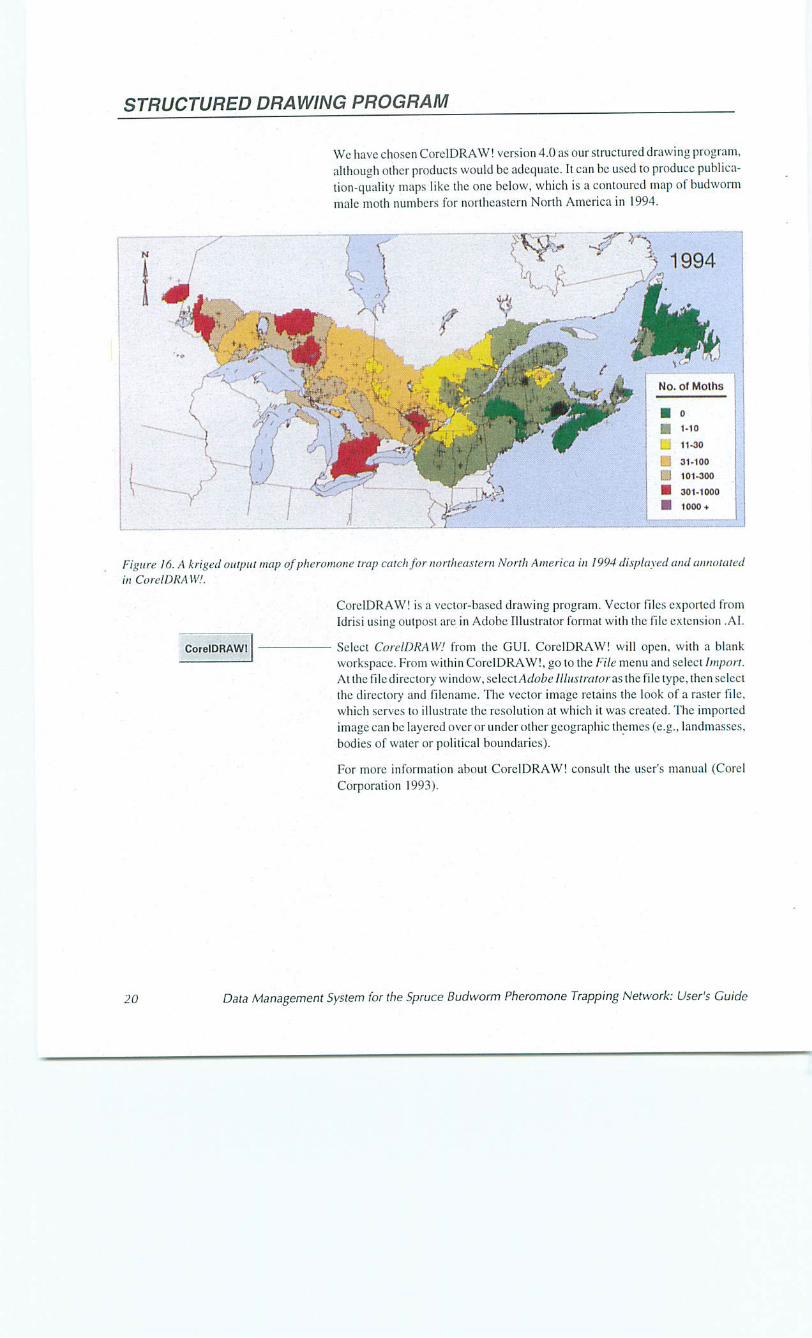
We have chosen CorelDRAW! version 4.0 as our structured drawing program,
although other products would be adequate. It can be used 10 produce publica
tion-quality maps like the one below, which is a contoured map of budwomi
male moth numbers for northeastern North America in 1994.
:7 1994
Figure 16. A kriged output map of pheramone trap catch for northeastern North America In 1994 displayed and annotated
in CorelDRAW!,
CorelDRAW! is a vector-based drawing program. Vector files exported from
Idrisi using outpost arc in Adobe Illustrator format with the file extension -AI.
CorelDRAW! Select CorelDRAW! from the GUI. CorelDRAW! will open, with a blank
workspace. From within CorelDRAW!, go to the File menu and select Import.
Al the file directory window, select Adobe Illustrator a.s\\\c file type, then select
the directory and filename. The vector image retains the look of a raster file,
which serves to illustrate the resolution at which it was created. The imported
image can be layered over or under oihcr geographic themes (e.g.,landmasscs,
bodies of water or political boundaries).
For more information about CorelDRAW! consult the user's manual (Corel
Corporation 1993).
20 Data Management System for the Spruce Budworm Pheromone Trapping Network: User's Guide

ACKNO WLEDGMENTS
We would like 10 lhank G.S. Lucuik for technical assistance and P.S. Robertson Tor programming assistance. A.M. Liebhold provided expert advice through out Hie development of the sysiem and R. Sims reviewed an earlier draft of the manuscript Trap deployment and sampling in Ontario could not have taken place without the assistance of the Forest Insect and Disease Survey unil of the Canadian Foresl Service, Great Lakes Forestry Centre. Thanks are also
extended to all ihe other collaborators in the Spruce Budworm Pheromnne Trapping Network. Funding for this project was supplied by the Northern
Ontario Development Agreement, Northern Forestry Program and the Deci sion Support System Initiative of the Canadian Forest Service's Green Plan. Mention of aproduci name does not imply endorsement by the Canadian Forest Service.
Data Management System for the Spruce Budworm Pheromone Trapping Network: User's Guide 21
LITERATURE CITED
Allen, D.C.; Abrahamson, [-.P.; Jobin, L.:-Souto. D.J.; Sanders.C.J. 1986. Use
of pheromone iraps to monitor spruce budworm populations. Govt. of Canada,
Canadian Foresiry Service, Ottawa, ON. Spruce Budworms Handbook. 16 p.
Corel Corporation. 1993. CorelDRAW user's manual, version 4.0. Corel
Corporation, Ottawa, ON.
DeutSCh. C.V.; Journel, A.G. 1992. GSLIB: gcostatistical software library and
user's guide. Oxford University Press, New York, NY.
Baseman, J.R. 1992a. klrisi: user's guide, version 4.0. Clark University,
Worcester, MA. 17K p.
Eastman, J.R. 1992b. Idrisi: technical reference, version 4.0. Clark University,
Worcester, MA. 213 p.
Eastman, J.R. 1993. Idrisi: update manual, version 4.1. Clark University,
Worcester, MA. 209 p. + 4 color plates.
Gage. S.H.;Wirth,T.M.;Simmons,G.A. 1990. Predicting regional gypsy moth
(Lymantriidae) population trends in an expanding population using
pheromone irap catch and spalial analysis. Environmental Entomology 19:
370-377.
Liebhold, A.M.; Rossi. R.E.: Kemp, W.P. 1993. Gcostatistics and geographic
information systems in applied insect ecology. Annu. Rev. Enlomol. 38: 303-
327.
Lyons, D.B.; Sanders, C.J. 1993. The North American spruce budworm
pheromone trappingnetwork. p. 37-48 in A.M. Liebhold and H.R. Barret!,cds.
Proceedings: spatial analysis and forest pest management. USDA Forest
Service, Northeastern Forest Experiment Station, Radnor, PA. General Tech
nical Report NE-175. 186 p.
Sanders. CJ. 1992. Sex pheromone traps for monitoring spruce budworm
populations: resolving operational problems. Foresiry Canada. Ontario Re
gion, Sault Ste. Marie, ON. Information Report O-X-425. 30 p.
Sanders. C.J.; Lyons, D.B. 1993. Development of an extensive pheromone trap
monitoring system for foresl pesls. Bull. OILB/SROP 16: 43-49.
Sanders, C.J.; Weathcrston. J, 1976. Sex pheromone of the eastern spruce
budworm: optimum blend of trans and cis-11-ietradecenal. Can. Ent. 108:
1285-1290.
Snyder, J.P. 1987. Map projections - a working manual. U.S. Geol. Surv. Prof.
Pap. 1395. 383 p.
22 Data Management System for the Spruce Budworm Pheromone Trapping Network: User's Guide

APPENDIX 1. OUTPUT FILES FROM THE PHEROMONE TRAPPING NETWORK
The following Tiles (excluding KRIG.PAL) arc created by one complete execution of the data management system for (he spruce bud worm pheromone trapping network. Ideally, all output files should he directed lo a unique dala directory to ensure ease of backup or deletion. The file KRIG.PAL (sec below) is an Idrisi palette file and must be kept in the data directory. The files are listed
below in alphabetical order by fife type extension. Within the Hie type description the files are listed alphabetically. In some cases only a sample of the text in the file is presented to illustrate the format. In the examples containing
only samples of the file contents, three periods {i.e.,...) represent acontinufltion ol the data.
The file OKB2D.BTR (Example 11 is the output file of kriged estimates after back transformation from normal scores tonumberof male moths. The first line in the file is the title, while the next four lines are the number of variables and
their names. The data starts on ihe fith line of the file. The columns are kriged
estimate, estimate of variance, and back transformed value. A value of -9 represent no estimate.
Back Transformation File
Example /. File 0KB2D.BTR.
Data Management System for the Spruce Budworm Pheromone Trapping Network: User's Guide 23

The file GBOEAS.DAT (Example 2) is the data exported from the database
converted to GEOEAS format suitable for input into the GSL1B routine NSCORB. The first line is the title and the next four lines define the variables
and their position in ihc file (i.e.. 3 variables, X, Y. Z). Beginning on line five, the three fields are x coordinate (km), y coordinate (km), and the average
number of male moths at that point.
Example 2. File GEOEAS.DAT.
Data Files The file NSCORE.DAT (Example 3) is the data in the same formal as
GEOEAS.DAT, with the addition of a fourth field, the z-valuc converted to
normal score values.
Example 3. Hie NSCORE.DAT.
24 Data Management System for the Spruce Budworm Pberomone Trapping Network: User's Guide

Debugging File The file 0KB2D.DBG (Example 4) is the mitpui fife for debugging produced by the GSLIB routine 0KU2D.
Example 4. File 0KB2D.DBG.
IDRISf Image Document Files Piles with the extension .DOC are Idrisi image document files. Two document
Hies arc produced, corresponding to the two image files (.IMG) created. The document file for kriged output image has the name convention E+region+year.DOC (Example 5).
Example 5. File EQVF92.DOC.
Data Management System for the Spruce Budworm Pheromone Trapping Network: User's Guide 25

Example 6. File REQUE92.DOC.
The document file for Hie reclassificd image has the name convention
RE+region+ycar.DOC (Example 6).
Idrisi image files consist of a single column nf numhers, each number representing the value of an individual raster. Image files do not contain any
positional or georeferencing informalion. Providing this coordinate informa
tion is the function of the image document files.The document files conlain lile
attribute names in the first column and their associated values preceded by a
colon in the second column.
Data Management System for the Spruce Budworm Pheromone Trapping Network: User's Guide
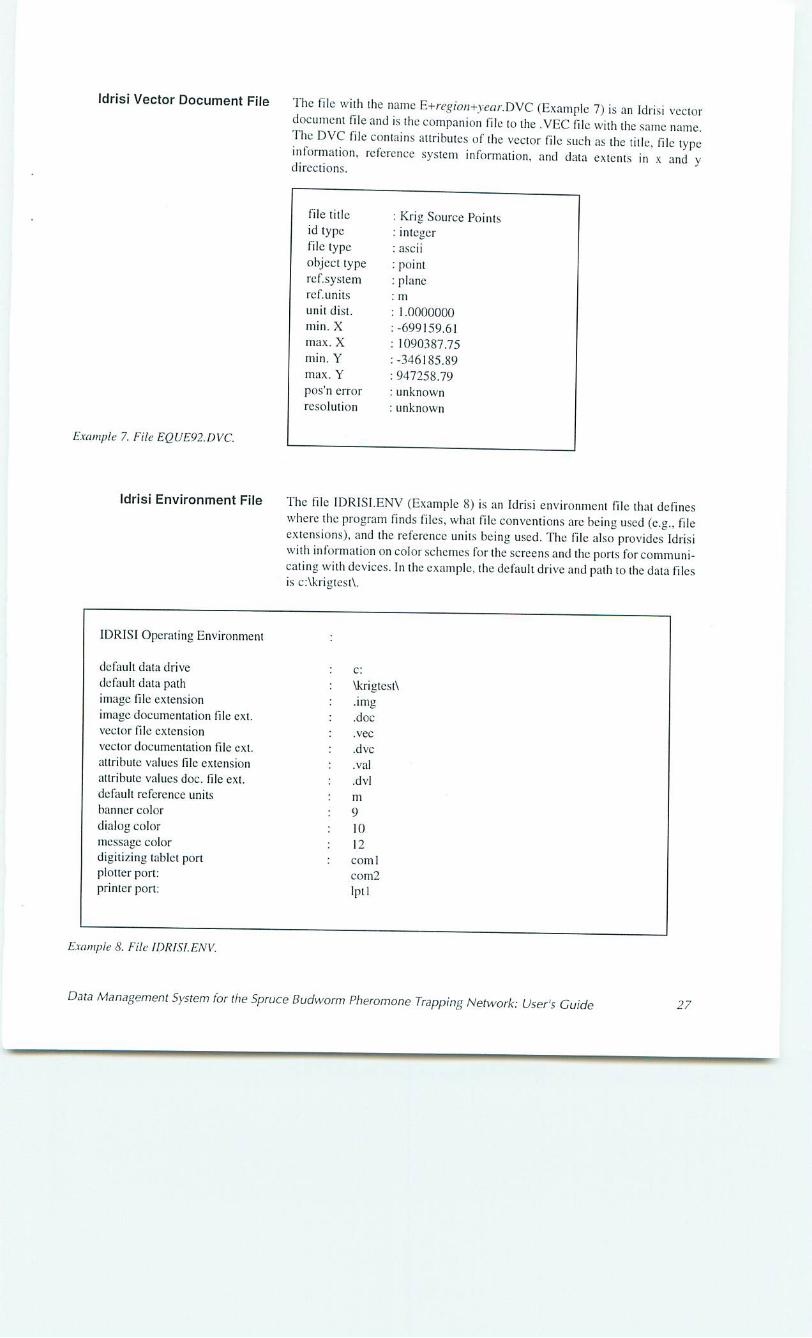
Idrisi Veclor Document File The file with .he name E+region+ywr.DVC (Example 7) is an Idrisi vector document file and is the companion file to [he .VEC file with the same name The DVC file contains attributes at the vector file such as the title, file type information, reference system information, and data extents in X and y directions.
Example 7. File EQUE92.DVC.
Idrisi Environment File The file IDRISI.ENV (Example 8) is an Idrisi environment file that defines
where the program finds files, wiiat file conventions are being used (e.g., file
extensions), and the reference units being used. The file also provides Idrisi
with information on color schemes for the screens and the ports for communi
cating with devices. In the example, the default drive and path to the data files is c:\krigtcstY
Example S. File fDRlSl.ENV.
Data Management System for the Spruce Budworm Pheromone Trapping Network: User's Guide 27

IDRISI Image Files
Output File
Files with the extension .IMG are image files for producing taster maps in the Idrisi geographical information system. As indicated in their associated .DOC files, both image files are binary and unprintable. They can be convened 10
ASCII text files, in Idrisi, if necessary. The first file with the name convention
E+rcgicm+year.MG (e.g., EQUE92.IMG), is the raw kriged values after hack
transformation. The second image file, with the filename convention
RE+regimt+year.lMG (e.g., REQUE92.IMG). is the reclassified rasters (i.e..
the final product).
0KB2D.0UT (Example 9) is ihe output file from the GSLIB routine 0KB2D,
The first two lines are the title and the next three lines define the columns. The
two columns are the estimated kriged value for each raster and iis associated
estimation variance.
Example 9. File 0KB2D.0UT.
IDRISI Palette File KRIG.PAL (Example 10) is an Idrisi custom palette file used by COLOR to
produce the selected colors for the contour interval map of male moth density
classes. Only the firsl 8 values (i.e.. 0-7) arc used, and they represent the seven
categories of molh captures plus a null color. Each line in ihc file represents u
color. The first column is ihe color's number while the numbers in the next ihree
columns represent the strengths (values range from 0-63) of the three additive
primary colors used to compose the color. The three columns are red, green, and
blue.
28 Data Management System for the Spruce Budworm Pheromone Trapping Network: User's Guide

Example 10. File KR1G.PAL.
Parameter Files Files with the extension .PAR arc parameter files. There are two types of
parameter files used in the system. The first type (Examples 12, 14, 15) arc
parameter files used for proeessing internal data.
The second type (Examples 11. 13, 16, 17) are parameter files required as input
by the GSLIB FORTRAN routines with the same names.
Example 11. File BACKTli.PAR.
Data Management System for the Spruce Budworm Pheromone Trapping Network: User's Guide 29

Example 12. File BTRT01DR.PAR.
I I 1
okb2d.btr rawkrig.img
179 129
START OF PARAMETERS;
n score .da!
1 2
I 4
-l.0e+21 l-Oc+21
gamv2.var
20
20.41
10.20
1
90.000 90.0 10000.00
1
Parameters for GAMV2 *********************
\Dala File in CEOEAS formal
\columns for x and y coordinates
\nvar; column numbers . . .
\imin, tmax (trimming limits)
\Outpul Tile for variogram
\nlag - the number of lags
\xlag - unit separation distance
\xltol- lag tolerance
\ndir - number of directions
\nzm(i),atol(i),bnndw(i)i=l,ndir
\numher of variograms
Mail, head, variogram type
Example 13. File GAMV2.PAR.
Example 14. File GEOTOIDR.PAR.
22 1
EQUE92.pis EQUE92.vec
Example 15. File IDRTOGSLPAR.
2 13
EQUE92.vec geocas-dai
30 Data Management System tor the Spruce Budworm Pheromone Trapping Network: User's Guide
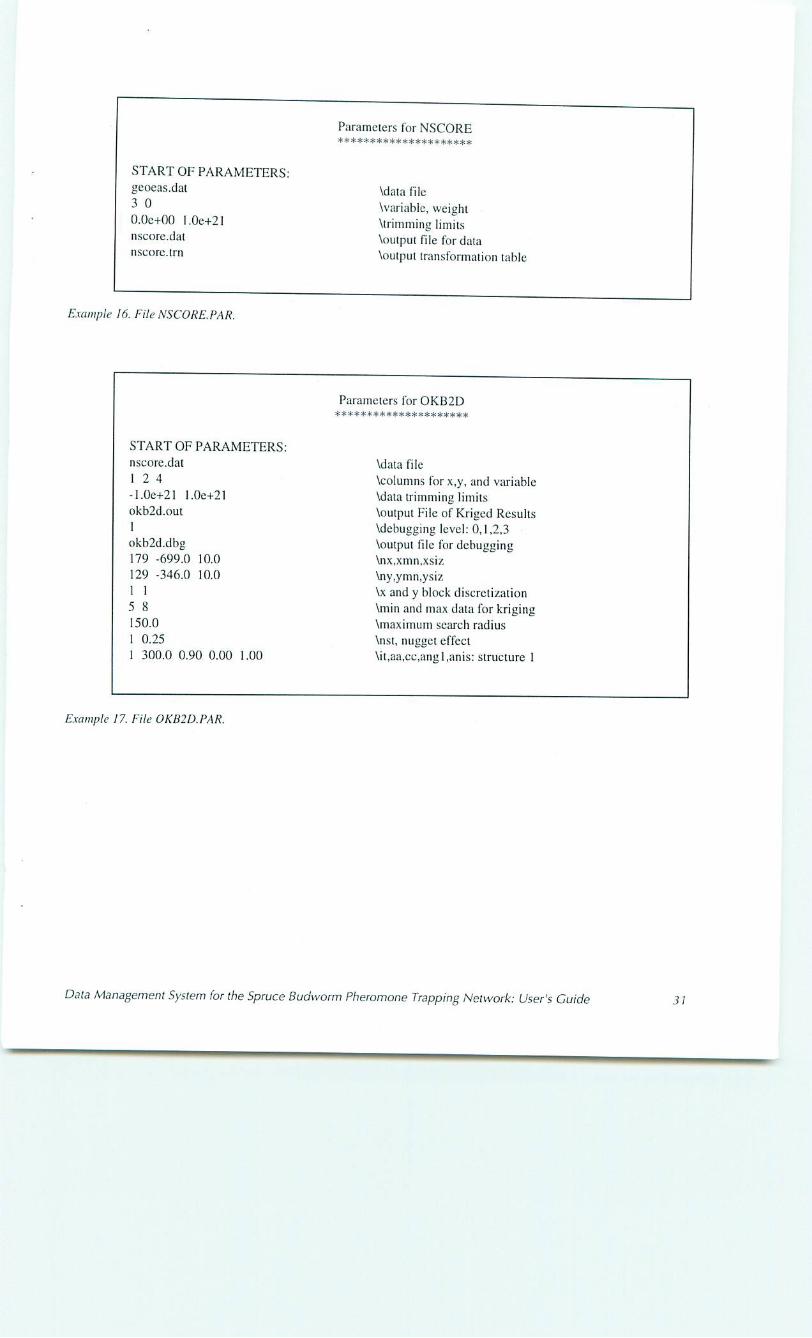
Example 16. File NSCORE.PAR.
Example 17. File OKB2D.PAR.
Data Management System for the Spruce Budworm Pheromone Trapping Network: User's Guide 31
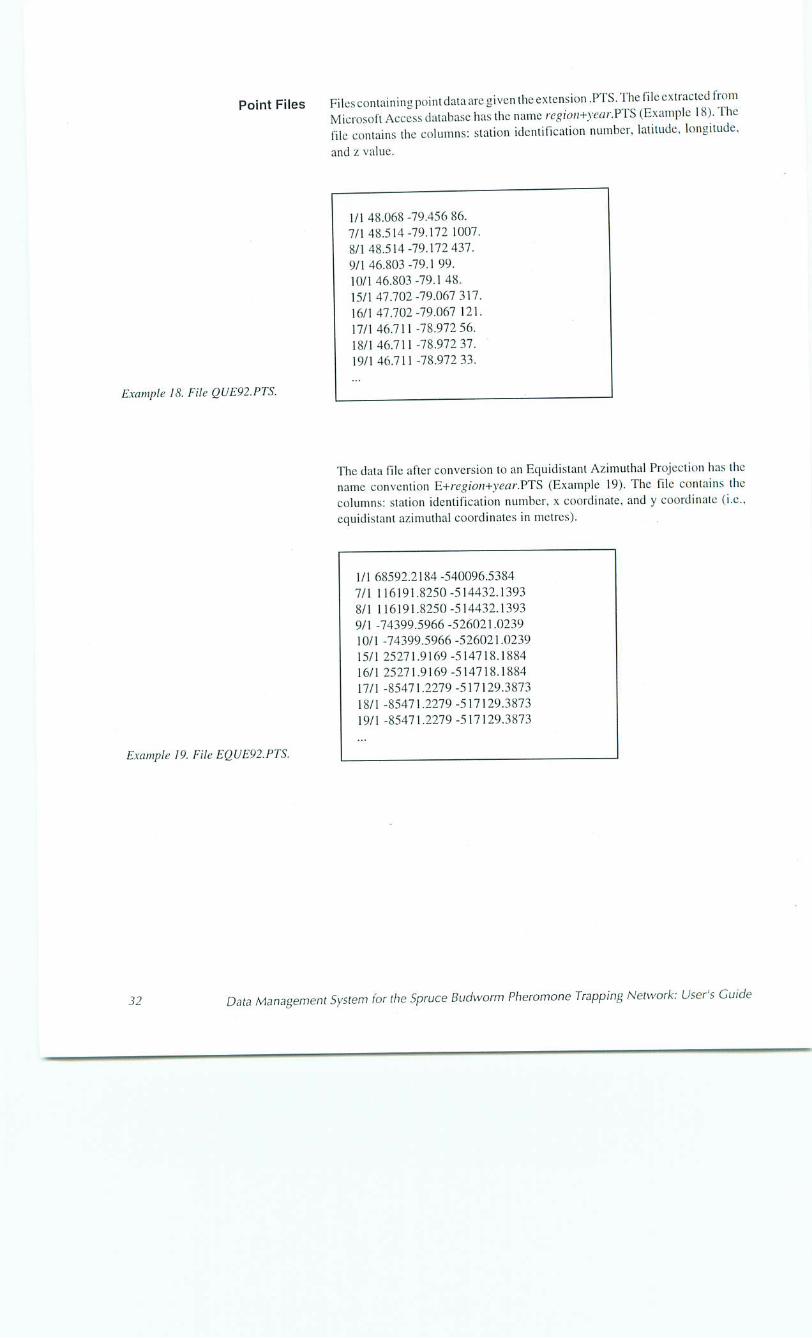
Point Files Filesranteiningpointdataarg^
Microsoft Access database lias the name regioH+ynir.PTS (Example IB). 1 he file contains the columns: station identification number, latitude, longitude.
and z value.
Example IS. File QUE92.PTS.
1/i 48.068-79.456 86.
7/148.514-79.172 1007.
8/148.514-79.172 437.
9/146.803-79.199.
10/146.803-79.1 48.
15/1 47.702-79.067 317.
16/147.702-79.067 121.
17/146.711 -78.972 56.
18/146.711-78.972 37.
19/1 46.711 -7K.972 33.
The dala Tile afier conversion lo an Equidistant Azimulhal Projection has the
name convention E+region+year.PTS (Example 19). The Hie contains the
columns: station identification number, x coordinate, and y coordinate (i.e.,
equidistant azimulhal coordinates in melres).
Example 19. File EQUE92.PTS,
1/1 68592.2184-540096.5384
7/1 116191.8250-514432.1393
8/1 116191.8250-514432.1393
9/1 -74399.5966-526021.0239
10/1 -74399.5966-526021.0239
15/1 25271.9169-514718.1884
16/1 25271.9169-514718.1884
17/1 -85471.2279-517129.3873
18/1 -85471.2279-517129.3873
19/1 -85471.2279-517129.3873
32 Data Management System for the Spruce Budworm Phcromone Trapping Network; User's Guide

Transformation File
Example 20. File NSCORE.TRN.
he he NSCORBTRN (Example 20) H me ̂ formation look up tahle created us ouipu. by the GSLIB routine NSCORE and used in th back fransformation by the GSLIB routine BACKTR. The columns in the file are original data values and normal scores values.
Text Files
Example 21. File BTPARM. TXT.
Filcswuh theexlcnsion.TXT are text files that are used lo iransferdata between modules in the system. Text files are the simplest method of passing data, especially between the Visual Basic modules and ihe C++ .DLL's.
I here are five text files createdduringcxccution of thesystem. BTPARM.TXT (Example 21) contains the minimum and maximum z values required for ihe back transformation.
1.5607.
EX1 KNT.TXT (Example 22) contains the minimum and maximum values of
x and y in kilometres (i.e., the coordinate extents for the shell of sample points) as well as the minimum and maximum /, values.
Example 22. File EXTENT. TXT.
-699.16 1090.388
-346.186 947.259
1.0 5607.0
Data Management System lor the Spruce Budworm Rhcromonc- Trapping Network: User's Guide 33

OKPARM TXT (Example 23) contains the data required in ihe construction of the GSUB parameter file for the kriging routine 0KB2D. The first two rows
o, .he ie contains the number of rasters (e.g 179 by 29) k^l™ (minimum x = -699 km. minimum y = -346) and increment (10 km) for he kriged oulput for the x and y directions. The third row is the search radios value
and the last row is the nugget, range, sill, and model type.
Example 23. File OKPARM.TXT.
Example 24. File REGION.TXT.
The code for the region being analyzed and the data year are writlen to the lext
file RHGION.TXT (Example 24).
XVPARM.TXT (Example 25) contains varicgram model parameters. 1 he firsl
row is the search radius, while ihe second raw contains the nugget, range, silt,
and model type values.
Example 25. File XVPARM.TXT.
150.
0.25 300. 0.9 1
34 Management System for the Spruce Budworm Pheromone Trapping Network: User's Guide

Value File
Example 26. File EQUE92. VAL
and z v (Example 26, is a value lile .ontainin, the station
(i.e.. the number of male moths).
Variogram File &AMV2.VAR (Example 27) is the outpui file from the GSLIB variogram routine GAMV2 for irregularly spaced two-dimensional data. Data from this file are used lo make the variogram graph. The first line in the file is ihe title followed by the variogram values. The columns are iag numher, lag separation distance, semivanance value, number of pairs in the lag interval. Die mean of Ihe data contributing lo the head, and the mean of the data contributing to ihe tail. The latter two values are the same since the same variable is used for the head and tail.
Example 27. File GAMV2.VAR.
Data Management System for the Spruce Budworm Pheromono Trapping Network: User's Guide 35
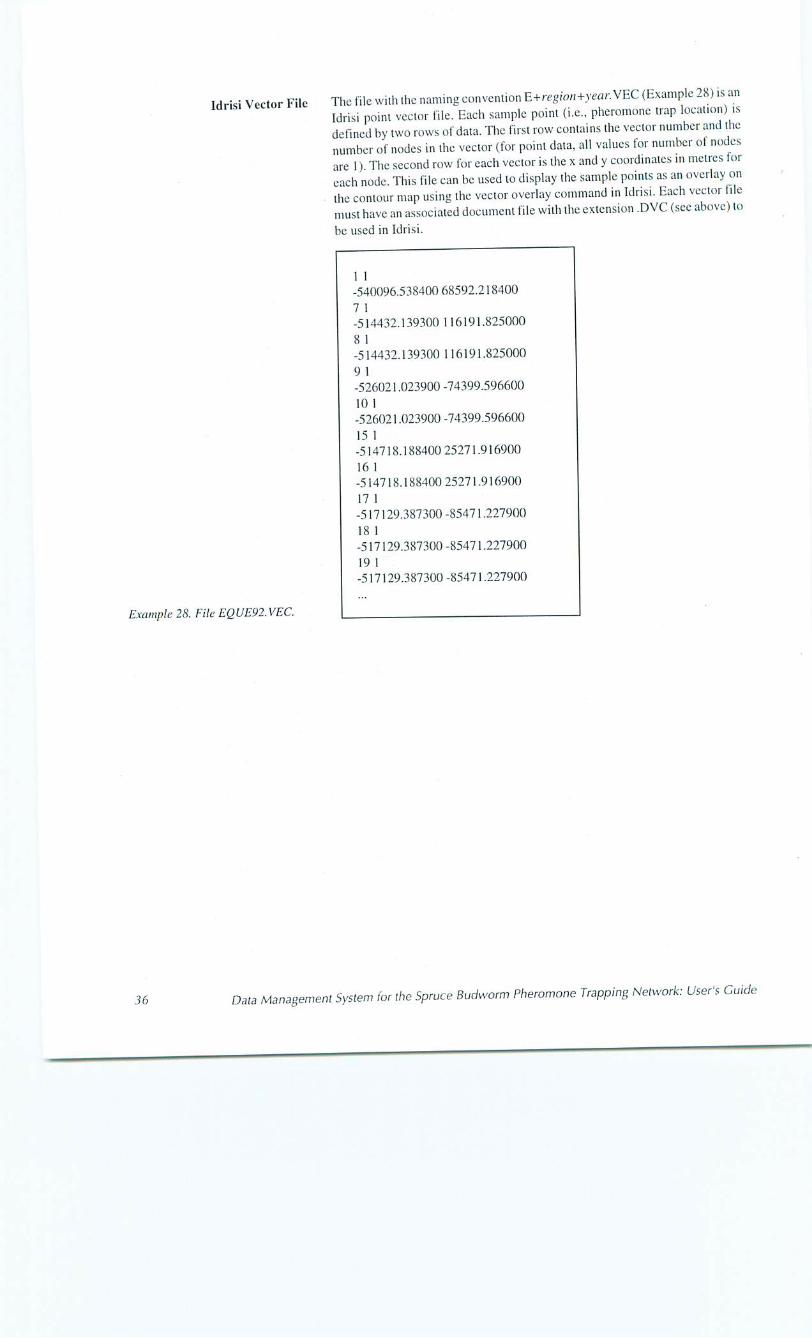
Iclrisi Vector File The file with the naming convention R+region+year.VEC (Example 28) is an
Idrisi point vector die. Bach sample poim (i.e., pheromonc trap location) is defined by two rows of data. The first row contains the vector number and the number of nodes in the vector (for point data, all values for number oi nodes are I) The second row for each vector is the x and y coordinates in metres lor
each node This file can be used to display the sample points as an overlay on the eontour map using the vector overlay command in Idrisi. Each vector file must have an associated document file with the extension .DVC (see above) to
be used in Idrisi.
Example 2S. FUe EQUE92. VEC.
36 Data Management System for the Spruce Budworm Pheromone Trapping Network: User's Guide

APPENDIX 2. GLOSSARY OF TERMS
back transfnrmation-A transformation used to convert normal score values back 10 z-values (i.e. number of moths).
contour interval-In a contour map, these divide attribute classes into areas of equal value.
contour mup-A map in which lines are used to enclose areas of equal value or attribute, n
dynaset-A subsel of data stored in a database that was extracted using a query.
equidistant azimuthal projeetion-A map projection that conserves linear distances in a portion of the world projected onlo a flat surface.
geodetic coordinate system-A map coordinate system that uses latitude and longitude values to position locations in two-dimensional space.
geographic inrorma.ion system (GIS)-A set of computer programs thai stores, manipulates, displays, and analyses spatial data.
geutatirtbfr-A se. of statistical techniques originating in the geological discipline thai uuhze adaptations of regression techniques to analyze natural phenomena thai have spatial continuity.
graphic user interface (GUI)-A graphical method of interacting with a computer wherem llieuser uses a pointing device (e.g., mouse) to select options rrom menu icons or lists.
hypertext-A system di writing and displaying text that allows parts of the document to be linked to other text. Clicking the mouse button while hypertext is selected by the cursor causes the cursor to move to new place in the file or to open a new file.
isntropic varfogram model-This is a type of variogram that depicts spatial autocorrelation in all directions as opposed to individual directions.
kriging-A method in geosiatislics for interpolating between data points that is based on the assumption that relationships are spatially consistent.
lag class-TTic distance grouping of pairs of points in a varioeram. All points within a range of distances are in the same lag class.
laginterval-nicdistanceover which autocorrelation Lsmodelcdinavariogram.
map algebra-This is a mathematical system wherein maps can be used as variables in arithmetic and Boolean equations.
normal scores-This is a type of transformation that is used to normalize a Highly skewed frequency distribution of /-values.
nu^ct-One of the parameters used to define a variogram. This is the value of the variogram model when the lag distance is 0.
paktteille-Tlnsisafileusedbyldrisitodelinethecolors.hatw'illbcdisplayed
point data-A point occupies a location or coordinate in two- or three-dimensional space bu, has no area. Point data defines an attribute value at tha, point in space.
Data Management System for the Spruce Budworm Pheromone Trapping Network: User's Guide 37
pDlygon-In a vectDF-based GIS system, areas of equal value arc enclosed within lines or vectors. Polygons are made up of vectors that have their starting
point and ending point at the same location in space.
range-One of the parameter values used to define the variogram model- This is the lag distance over which pairs of points are autocorrelated and have not
reached the plateau or sill.
raster-ln a raster-based GIS system, images are composed of matrices of equal-sized cells, each having an attribute value. Groups of rasters with the
same attrihute value represent features.
search radius-ln the interpolation process (i.e., kriging). the search radius
deilnes the maximum distance that poinis can be separated to he included as
pairs.
shell of poinls-The area defined by the distribution of coordinate points in
space.
sill-One ofihe parameters used to define the variogram model. The sill is the sum of the structural and nugget variance. This is where the variogram reaches
a plateau.
structural variance-Thc structural variance is the difference between the
nugget and sill variances.
thematic data-Map data that relates to an individual subject or theme (e.g.,
moth captures, forest cover type).
unit scparation-This is the distance between lag classes in a scatter plot of
semivariancc values.
Universal Transverse Mercator (UTM) coordinates-Coordinates that de
fine spatial locations in a UTM map projection.
variogram-A variogram is a plot of the variance of pairs of points in space as
a function of distance between pairs of points.
vector data-Data represented by lines that connect points or nodes in space.
z-vaiue-In two dimensional space, coordinate points are defined by their x and y coordinates. The z-values are the values of the attribute (e.g.. number oi
moths) at that point in space.
38 Data Management System tor the Spruce Budworm Pheromone Trapping Network: User's Cuide