intalus.com tr˜ding tips. 1issue5 · intraday emissions trading. how to trade volatility breakouts...
TRANSCRIPT
intalus.com
TR�DINGTIPS. 15
Issue
A publication ofPowered by
SKYS
CRA
PER.
ICC
Tow
er, H
ong
Kon
g.Th
e to
days
tal
lest
bui
ldin
g in
Hon
g K
ong
on t
he s
cale
of
48
4 m
etre
s hi
gh.
How to trade volatility breakouts profitably.
INTRADAY EMISSIONS TRADING. INCLUDING
WORKSPACEFOR DOWNLOAD.
INCLUDESVIDEO
INTRADAY EMISSIONS TRADING. How to trade volatility breakouts profitably.
When it comes to energy trading the emissions market is one of the most liquid. It shows great trends and quite radical intraday moves. This months trading tip will give you some ideas and a full trading strategy to make use of the intraday volatility in this market.
DAY RANGE: A SIMPLE BUT POWERFUL INDICATOR.
With the Day Range indicator you will see what a powerful and easily made indicator it is. Open a 15min intraday chart of emissions (CFI2Z5 on Reuters) and apply the Day Range indicator. This indicator does not need a lot of calculation; it just normalizes the daily intraday movement. Every day the indicator starts at 0, and then builds the bars exactly like a normal chart. If the market raises 10 points from the opening, the indicator will show a bar going from 0 to 10 points. That’s not a lot of maths, but it enables you to compare the intraday moves day by day, without being confused with the general trend or long term support and resistance on the chart.
Can this be enough to build a profitable trading strategy? Yes! Just have a look at a long history of the indicator and you will see where the money can be made.
INTRADAY EMISSIONS TRADING. TR�DING TIPS. 15
SHARE THIS TRADING TIPS! MORE TRADING TIPS!
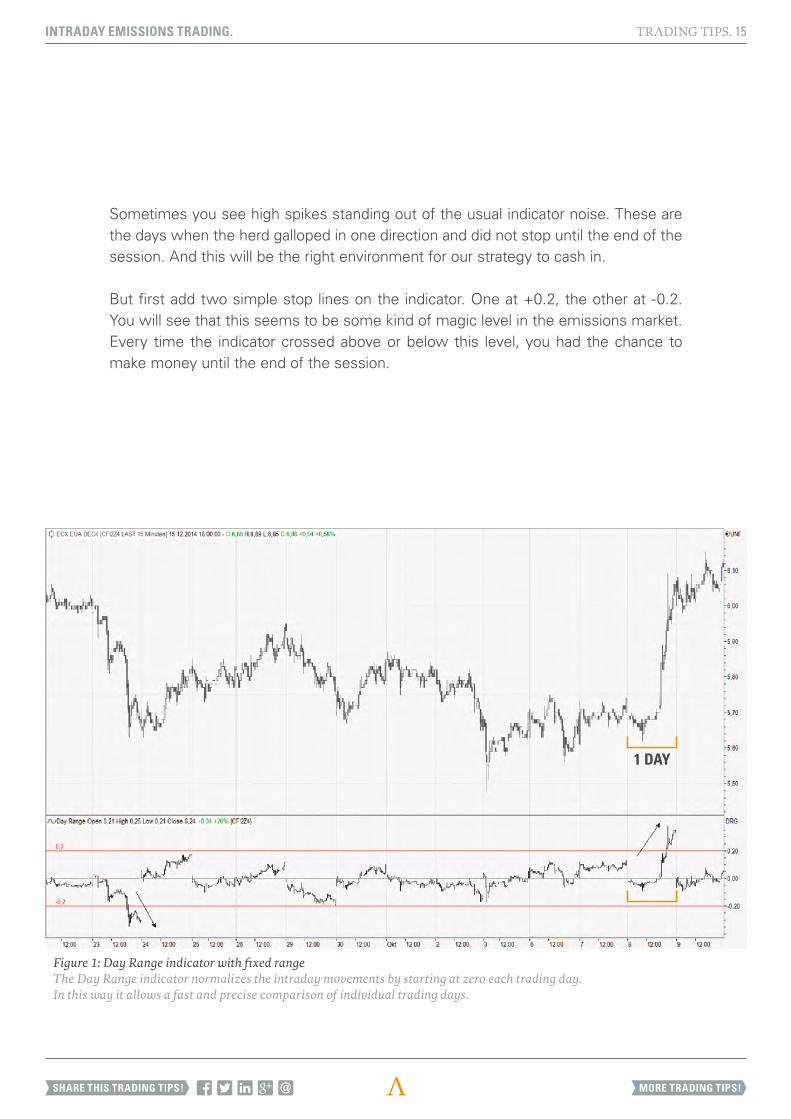
Figure 1: Day Range indicator with fixed range The Day Range indicator normalizes the intraday movements by starting at zero each trading day. In this way it allows a fast and precise comparison of individual trading days.
1 DAY
Sometimes you see high spikes standing out of the usual indicator noise. These are the days when the herd galloped in one direction and did not stop until the end of the session. And this will be the right environment for our strategy to cash in.
But first add two simple stop lines on the indicator. One at +0.2, the other at -0.2. You will see that this seems to be some kind of magic level in the emissions market. Every time the indicator crossed above or below this level, you had the chance to make money until the end of the session.
INTRADAY EMISSIONS TRADING. TR�DING TIPS. 15
SHARE THIS TRADING TIPS! MORE TRADING TIPS!

Figure 2: Enhanced Day Range indicator with volatility band With the use of standard deviation as a measure of “normal” daily fluctuations, the enhanced version of the Day Range indicator can be used in all markets.
DEVIATION BAND ENABLES APPLICATION TO DIFFERENT MARKETS.
Of course there are no magic numbers in the market, so better let your software calculate the “breakout volatility level” on its own. Therefore you could just drag and drop a long term Bollinger band onto the indicator, or you use the altered version of the Day Range indicator that is included with this trading tip.
The enhanced indicator plots a two standard deviations band around the daily movements. This enables you to apply the indicator without adjustments to different markets, as emissions is not the only market with nice intraday breakouts.
INTRADAY EMISSIONS TRADING. TR�DING TIPS. 15
SHARE THIS TRADING TIPS! MORE TRADING TIPS!
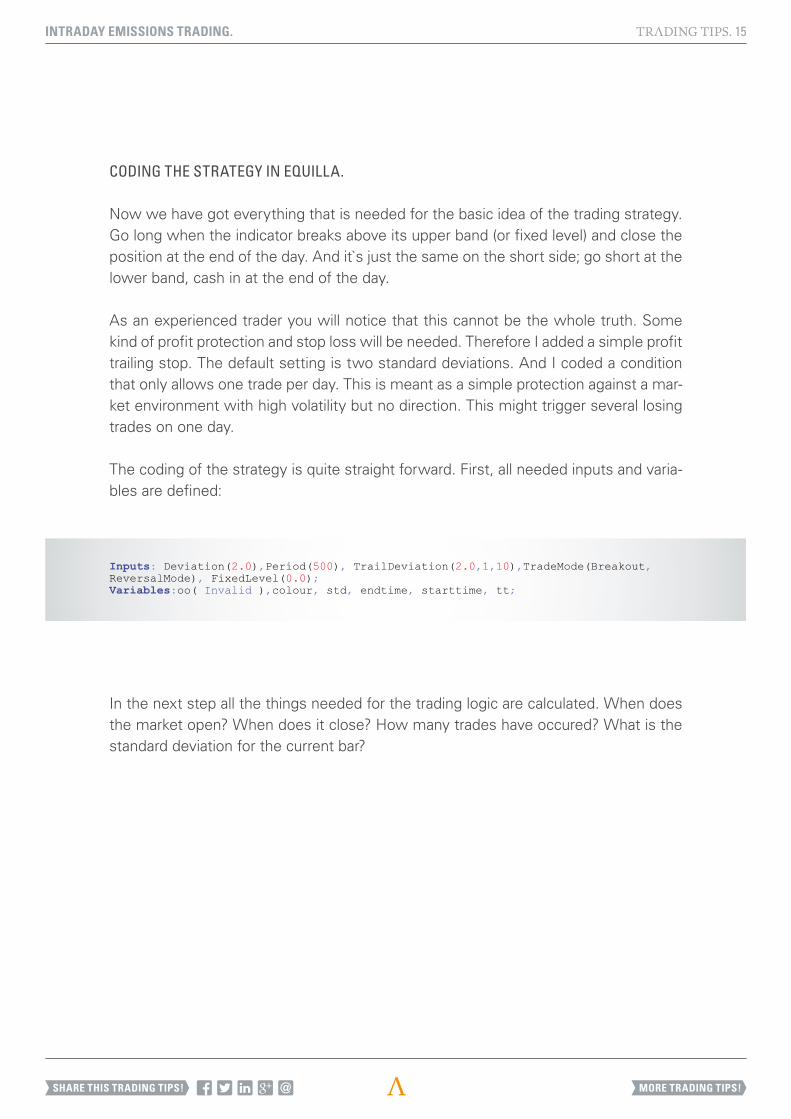
Inputs: Deviation(2.0),Period(500), TrailDeviation(2.0,1,10),TradeMode(Breakout, ReversalMode), FixedLevel(0.0); Variables:oo( Invalid ),colour, std, endtime, starttime, tt;
CODING THE STRATEGY IN EQUILLA.
Now we have got everything that is needed for the basic idea of the trading strategy. Go long when the indicator breaks above its upper band (or fixed level) and close the position at the end of the day. And it`s just the same on the short side; go short at the lower band, cash in at the end of the day.
As an experienced trader you will notice that this cannot be the whole truth. Some kind of profit protection and stop loss will be needed. Therefore I added a simple profit trailing stop. The default setting is two standard deviations. And I coded a condition that only allows one trade per day. This is meant as a simple protection against a mar-ket environment with high volatility but no direction. This might trigger several losing trades on one day.
The coding of the strategy is quite straight forward. First, all needed inputs and varia-bles are defined:
In the next step all the things needed for the trading logic are calculated. When does the market open? When does it close? How many trades have occured? What is the standard deviation for the current bar?
INTRADAY EMISSIONS TRADING. TR�DING TIPS. 15
SHARE THIS TRADING TIPS! MORE TRADING TIPS!
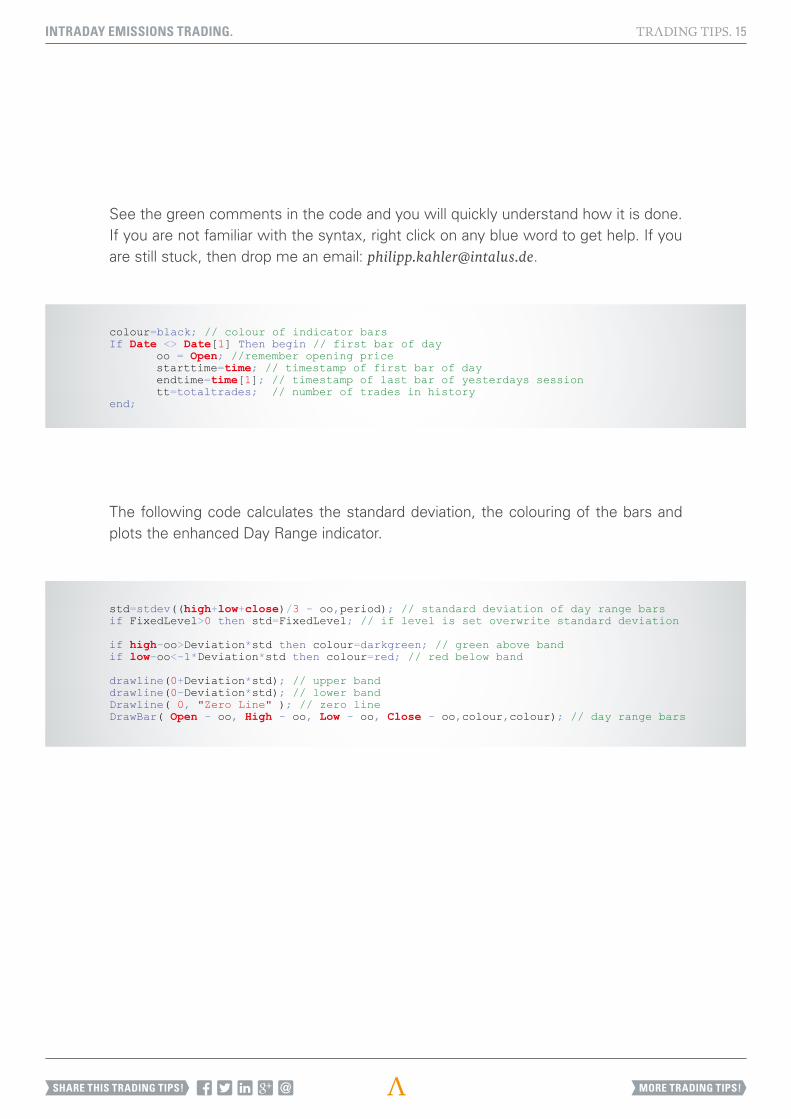
colour=black; // colour of indicator barsIf Date <> Date[1] Then begin // first bar of day oo = Open; //remember opening price starttime=time; // timestamp of first bar of day endtime=time[1]; // timestamp of last bar of yesterdays session tt=totaltrades; // number of trades in historyend;
std=stdev((high+low+close)/3 - oo,period); // standard deviation of day range barsif FixedLevel>0 then std=FixedLevel; // if level is set overwrite standard deviation
if high-oo>Deviation*std then colour=darkgreen; // green above band if low-oo<-1*Deviation*std then colour=red; // red below band
drawline(0+Deviation*std); // upper banddrawline(0-Deviation*std); // lower bandDrawline( 0, "Zero Line" ); // zero lineDrawBar( Open - oo, High - oo, Low - oo, Close - oo,colour,colour); // day range bars
See the green comments in the code and you will quickly understand how it is done. If you are not familiar with the syntax, right click on any blue word to get help. If you are still stuck, then drop me an email: [email protected].
The following code calculates the standard deviation, the colouring of the bars and plots the enhanced Day Range indicator.
INTRADAY EMISSIONS TRADING. TR�DING TIPS. 15
SHARE THIS TRADING TIPS! MORE TRADING TIPS!
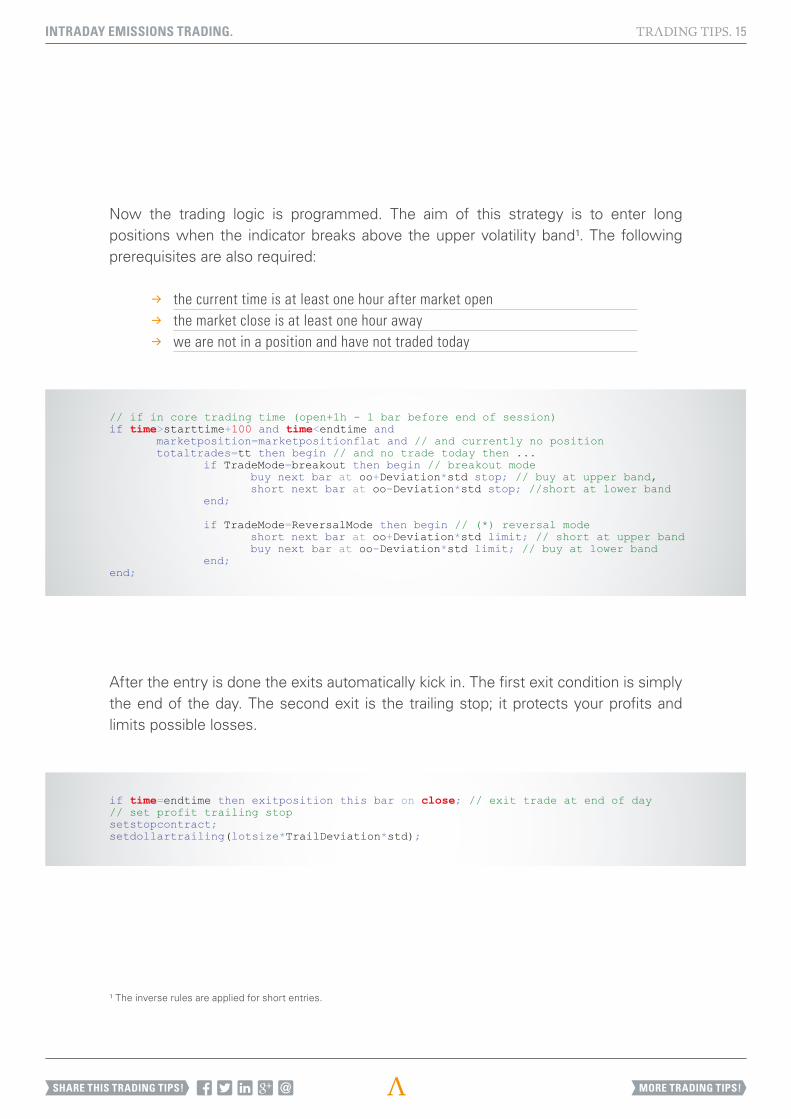
// if in core trading time (open+1h - 1 bar before end of session)if time>starttime+100 and time<endtime and marketposition=marketpositionflat and // and currently no position totaltrades=tt then begin // and no trade today then ... if TradeMode=breakout then begin // breakout mode buy next bar at oo+Deviation*std stop; // buy at upper band, short next bar at oo-Deviation*std stop; //short at lower band end;
if TradeMode=ReversalMode then begin // (*) reversal mode short next bar at oo+Deviation*std limit; // short at upper band buy next bar at oo-Deviation*std limit; // buy at lower band end;end;
if time=endtime then exitposition this bar on close; // exit trade at end of day// set profit trailing stop setstopcontract;setdollartrailing(lotsize*TrailDeviation*std);
Now the trading logic is programmed. The aim of this strategy is to enter long positions when the indicator breaks above the upper volatility band¹. The following prerequisites are also required:
b the current time is at least one hour after market open b the market close is at least one hour away b we are not in a position and have not traded today
After the entry is done the exits automatically kick in. The first exit condition is simply the end of the day. The second exit is the trailing stop; it protects your profits and limits possible losses.
¹ The inverse rules are applied for short entries.
INTRADAY EMISSIONS TRADING. TR�DING TIPS. 15
SHARE THIS TRADING TIPS! MORE TRADING TIPS!
www.intalus.com/workspacesDOWNLOAD. OPEN. TRADE.
ANALYSIS POWER.New workspaces for your Tradesignal workstation.
FINDING ROBUST PARAMETERS BY USING THE OPTIMIZER.
All inputs of this strategy can be changed after optimization.
b Deviation(2.0): Multiplier for the standard deviation TIP: Try to optimize it between 1.5 and 3
b Period(500): Number of bars needed for the calculation of the standard deviation
b TrailDeviation Number of standard deviations used for the trailing stop (2.0, 1,10): TIP: It can be optimized between one and ten standard deviations
INTRADAY EMISSIONS TRADING. TR�DING TIPS. 15
SHARE THIS TRADING TIPS! MORE TRADING TIPS!
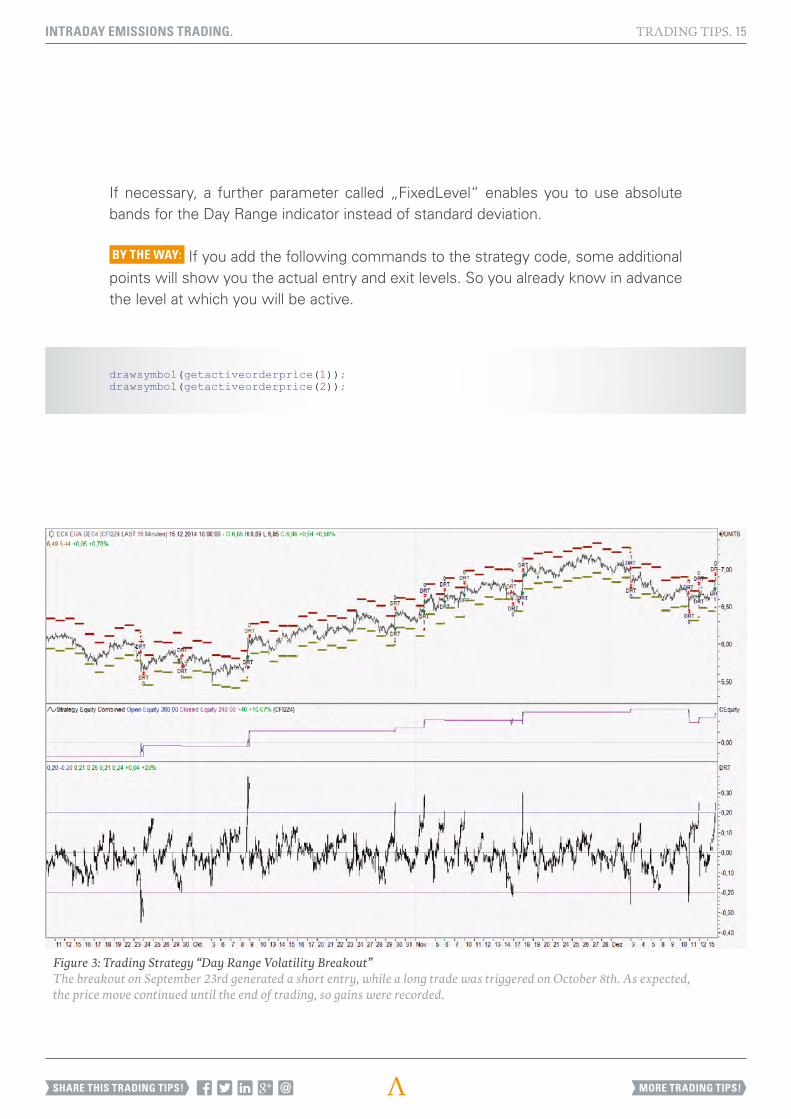
Figure 3: Trading Strategy “Day Range Volatility Breakout”The breakout on September 23rd generated a short entry, while a long trade was triggered on October 8th. As expected, the price move continued until the end of trading, so gains were recorded.
drawsymbol(getactiveorderprice(1));drawsymbol(getactiveorderprice(2));
If necessary, a further parameter called „FixedLevel“ enables you to use absolute bands for the Day Range indicator instead of standard deviation.
BY THE WAY: If you add the following commands to the strategy code, some additional points will show you the actual entry and exit levels. So you already know in advance the level at which you will be active.
INTRADAY EMISSIONS TRADING. TR�DING TIPS. 15
SHARE THIS TRADING TIPS! MORE TRADING TIPS!
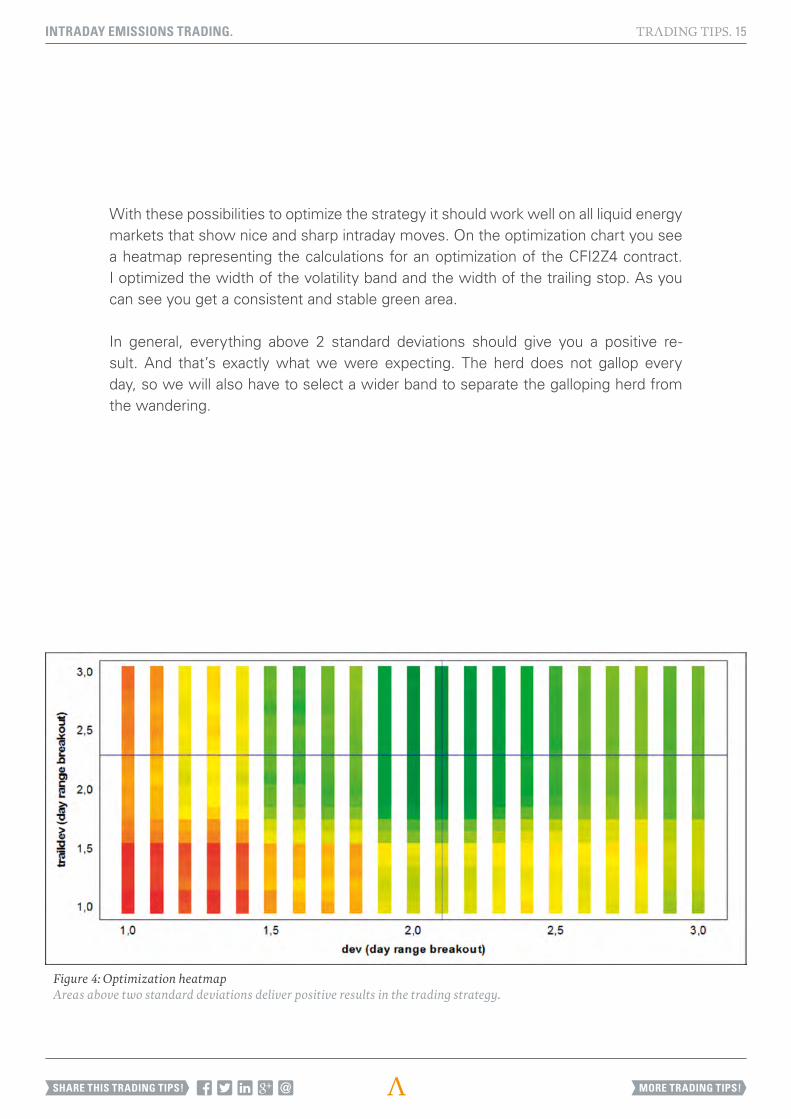
Figure 4: Optimization heatmapAreas above two standard deviations deliver positive results in the trading strategy.
With these possibilities to optimize the strategy it should work well on all liquid energy markets that show nice and sharp intraday moves. On the optimization chart you see a heatmap representing the calculations for an optimization of the CFI2Z4 contract. I optimized the width of the volatility band and the width of the trailing stop. As you can see you get a consistent and stable green area.
In general, everything above 2 standard deviations should give you a positive re-sult. And that’s exactly what we were expecting. The herd does not gallop every day, so we will also have to select a wider band to separate the galloping herd from the wandering.
INTRADAY EMISSIONS TRADING. TR�DING TIPS. 15
SHARE THIS TRADING TIPS! MORE TRADING TIPS!
BLOOMBERGTHOMSON REUTERS
INVERTING THE STRATEGY FROM BREAKOUT TO REVERSAL MODE.
One last point. Sometimes markets just do not listen to what analysts write. There-fore I added a switch in the input section of the strategy that lets me switch the trading logic from breakout to reversal. In reversal mode the strategy does not buy when the indicator touches its upper band, it goes short. So if you are unable to find a stable setting for the breakout mode, just try the reversal mode. Let the market select by itself which strategy is the right one.
I hope this months trading tip will give you some new ideas on how to use a systematic approach in trading emissions and volatility breakouts in general. Let the indicators inspire you, and test your ideas systematically. It might not give you a free lunch, but you can expect a great meal with little cost.
DOWNLOAD WORKSPACE & STRATEGY CODEFOR TRADESIGNAL HERE:
Try the new workspace which is provided here for both Thomson Reuters and Bloomberg data. More workspaces can be downloaded at www.intalus.com/workspaces.
That’s it for today – take care, take profit and “auf Wiedersehen”.
Philipp KahlerSenior Quantitativ Analyst at Intalus
INTRADAY EMISSIONS TRADING. TR�DING TIPS. 15
SHARE THIS TRADING TIPS! MORE TRADING TIPS!

© 2015 Intalus – www.intalus.com
Distribution allowed under a Creative Commons Attribution-Noncommercial license:
http://creativecommons.org/licenses/by-nc/3.0/
Tradesignal® is a registered trademark of Tradesignal GmbH. Unauthorized use or misuse is specifically prohibited.
All other protected brands and trademarks mentioned in this document conform, without restriction, to the provisions of applicable
trademark law and the copyrights of the respective registered owners.
WATCH VIDEO TO SEE HOW TO TRADE VOLATILITY BREAKOUTSPROFITABLY IN TRADESIGNAL.
www.intalus.com/vimeo www.intalus.com/youtube
MORE TR�DING TIPS IN OUR VIDEO CHANNELS:
INTRADAY EMISSIONS TRADING. TR�DING TIPS. 15
SHARE THIS TRADING TIPS! MORE TRADING TIPS!

ABOUT THE AUTHOR.Philipp Kahler.
Philipp is the Senior Quant Analyst at Intalus. He was born in Austria and studied electrical engineering before joining a large German bank where he developed fully automated trading strategies for the proprietary trading department. His book about designing successful trading strategies has been among the top sellers in Germany for the last two years. Currently at Intalus, he is responsible for the in-house training of institutional traders and the development of custom-made algorithmic trading strategies.
You may contact Philipp [email protected]
INTRADAY EMISSIONS TRADING. TR�DING TIPS. 15
SHARE THIS TRADING TIPS! MORE TRADING TIPS!
A publication of
TR�DINGTIPS. Issue
07
How to find the best risk/ reward opportunities based on candlestick patterns.
intalus.com
Powered by
SCAN FOR CANDLE PATTERNS.
TR�DINGTIPS.
ALGORITHMICTRADING WITH RENKO CHARTS. SK
YSCR
APE
R 01
. Men
ara
Car
igal
i, K
uala
Lum
pur.
The
toda
ys t
hird
tal
lest
bui
ldin
g in
Mal
aysi
a on
the
sca
le o
f 26
7 m
etre
s hi
gh.
intalus.com
A publication ofPowered by
10Issue
SKYS
CRA
PER
02. P
etro
nas
Twin
Tow
ers,
Kua
la L
umpu
r.Th
e to
days
tal
lest
bui
ldin
g in
Mal
aysi
a on
the
sca
le o
f 45
2 m
etre
s hi
gh.
1–3
PARTS 1–3:How to combine Renko charts and Bar charts to create a profitable trading strategy.
A publication of
How to identify and profit well from a short trade.
intalus.com
Powered by
HIGHLYEFFICIENTSHORTING.
TR�DINGTIPS. Issue
04
A publication of
How to use point & figure trend lines in candlestick charts.
intalus.com
Powered by
RULE-BASEDTRENDLINES IMPROVEDISCIPLINE.
TR�DINGTIPS. Issue
05
intalus.com
TR�DINGTIPS. 11
Issue
How to profit from seasonal patterns.
SELL IN MAY AND GO AWAY?
A publication ofPowered by
SKYS
CRA
PER.
One
Wor
ld T
rade
Cen
ter,
New
Yor
k C
ity.
The
toda
ys t
alle
st b
uild
ing
in t
he U
S o
n th
e sc
ale
of 5
41,3
met
res
high
.
A publication of
A simple, but effective strategy.
intalus.com
Powered by
PROFIT FROM GAP TRADING.
TR�DINGTIPS. Issue
06
intalus.com
12Issue
A publication ofPowered by
How to create a portfolio in Tradesignal, apply trading strategies & monitor all positions.
CONTROLAND MONITORYOUR ASSETSBY RULE-BASEDAPPROACHES.
SKYS
CRA
PER.
The
Sha
rd, L
ondo
n.Th
e to
days
tal
lest
bui
ldin
g in
the
UK
on
the
scal
e of
310
met
res
high
.
HOW TO.
TR�DINGTIPS.
TR�DINGTIPS. Issue
08
A publication of
Simple steps to advanced analysis.
intalus.com
Powered by
INDICATORSON INDICATORS.
intalus.com
TR�DINGTIPS. 13
Issue
WHAT IS THE MARKET OUTLOOK?
A publication ofPowered by
SKYS
CRA
PER.
Gua
ngzh
ou In
tern
atio
nal F
inan
ce C
entr
e, G
uang
zhou
.Th
e to
days
fou
rth
talle
st b
uild
ing
in C
hina
on
the
scal
e of
438
,6 m
etre
s hi
gh.
How to create your own dashboard in Tradesignal for a quick, precise overview.
INCLUDING
WORKSPACEFOR DOWNLOAD.
TR�DINGTIPS. Issue
09
A publication of
How to visualize forward curves to maximize information.
intalus.com
Powered by
UNLEASH THEFORWARD CURVE.
intalus.com
TR�DINGTIPS. 14
Issue
A publication ofPowered by
SKYS
CRA
PER.
Tai
pei 1
01, T
aipe
i.Th
e to
days
tal
lest
bui
ldin
g in
Tai
wan
on
the
scal
e of
50
8 m
etre
s hi
gh.
How to optimize the position size of your investments systematically.
MAXIMIZE PROFITS USING THE KELLY FORMULA.
INCLUDING
WORKSPACEFOR DOWNLOAD.
INCLUDESVIDEO
www.intalus.com/tradingtips
MORE KNOW-HOW AND VIDEOS HERE
PROFIT FROM THESE TR�DING TIPS & VIDEOS TOO.
TRADING TIPS 04
HIGHLY EFFICIENTSHORTING.
How to identify and profit well from a short trade.
TRADING TIPS 05
RULE-BASED TRENDLINES.
How to use point & figure trend lines in candlestick charts.
TRADING TIPS 06
PROFIT FROM GAP TRADING.
A simple, but effective strategy.
TRADING TIPS 07
SCAN FOR CANDLE PATTERNS.
How to find best performing stocks and the best risk/reward opportunities by identifying promising candlestick patterns.
TRADING TIPS 08
INDICATORS ON INDICATORS.
Simple steps to advanced analysis.
TRADING TIPS 09
UNLEASH THEFORWARD CURVE.
How to visualize forward curves to maximize information.
TRADING TIPS 10 | PARTS 1–3
ALGORITHMIC TRADINGWITH RENKO CHARTS.
Parts 1–3: How to combine Renko charts and Bar charts to create a profitable trading strategy.
TRADING TIPS 11
SELL IN MAYAND GO AWAY?
How to profit fromseasonal patterns.
TRADING TIPS 12
CONTROL AND MONITOR YOUR ASSETS BY RULE-BASED APPROACHES.How to create a portfolio in Tradesignal, apply trading strategies & monitor all positions.
TRADING TIPS 13
WHAT IS THE MARKET OUTLOOK?
How to create your own dashboard in Tradesignal for a quick, precise overview.
TRADING TIPS 14
MAXIMIZE PROFITS USING THE KELLY FORMULA.
How to optimize the position size of your investments systematically.
INTRADAY EMISSIONS TRADING. TR�DING TIPS. 15
SHARE THIS TRADING TIPS! MORE TRADING TIPS!
CLEAR STRATEGIES NOT GUT REACTIONS.Act smart and always use objective and clear signals.Tradesignal. Überlegen handeln. Made in Germany.
OOPS – YOU AREN’T ALREADY A TRADESIGNAL USER?
VISIT �
AND START TESTING THE SOFTWARE RIGHT NOW.
Trad
esig
nal®
is a
reg
iste
red
trad
emar
k of
Tra
desi
gnal
Gm
bH. U
naut
horiz
ed u
se o
r m
isus
e is
spe
cific
ally
pro
hibi
ted.
OOPS – YOU AREN’T ALREADY A TRADESIGNAL USER?
VISIT
AND START TESTING THE SOFTWARE RIGHT NOW.
www.intalus.com/tradesignal-trial

A publication ofPowered by
That is why we have produced these Trading Tips.If you have enjoyed them please help us and share them with your friends.
ANALYSING AND TRADING MARKETS SHOULD BE PLEASURABLE, NOT A CAUSE OF PAIN.
intalus.com
SH�RETHIS!
SHARE THIS TRADING TIP!