treasury management strategy 2018/19 - torbay council · torbay council | treasury management...
TRANSCRIPT

Insert photo 18cm high x 21 wide January 2018
Treasury Management Strategy 2018/19
incorporating the Annual Investment Strategy and the Minimum Revenue Provision Policy
2 Treasury Management Strategy 2018/19 | Torbay Council
Contents
1 Introduction ....................................................................................................................................... 3
2 Core funds and expected investment balances ................................................................................. 4
3 Prospects for Interest Rates .............................................................................................................. 5
4 Borrowing .......................................................................................................................................... 6
4.1 The current borrowing position ..................................................................................................................... 6
4.2 The Borrowing Strategy ................................................................................................................................ 6
5 Annual Investment Strategy............................................................................................................... 8
5.1 Investment policy .......................................................................................................................................... 8
5.2 Investment strategy....................................................................................................................................... 8
6 Treasury Management Consultants ................................................................................................. 10
7 Reporting Arrangements and Management Evaluation.................................................................... 11
8 Other Matters .................................................................................................................................. 12
8.1 Loans to organisations ................................................................................................................................ 12
8.2 Advancing cash ........................................................................................................................................... 12
8.3 Investing cash for Local Payment Scheme (LPS) Schools ........................................................................ 12
8.4 Soft Loans ................................................................................................................................................... 12
Appendix 1: Prudential & Treasury Management Indicators 2018/19 – 2020/21 .................................... 13
Appendix 2: Policy on Minimum Revenue Provision for 2018/19 ........................................................... 16
Appendix 3: Economic Commentary (Capita Treasury Services – December 2017) .............................. 18
Appendix 4: Creditworthiness Policy ...................................................................................................... 20
Appendix 5: Approved Investment Instruments: Specified and Non-Specified ....................................... 22

Torbay Council | Treasury Management Strategy 2018/19 3
1 Introduction
The Council defines its treasury management activities as:
“The management of the authority’s borrowing, investments and cash flows, it’s banking, money market and capital market transactions; the effective control of the risks associated with those activities; and the pursuit of optimum performance consistent with those risks.”
The Strategy for 2018/19 covers two main areas:
Treasury management issues
the current treasury position;
treasury indicators which limit the treasury risk and activities of the Council;
prospects for interest rates;
the borrowing strategy;
the investment strategy;
policy on use of external service providers;
reporting arrangements and management evaluation
other matters
Capital issues
the capital plans and the prudential indicators;
the minimum revenue provision (MRP) policy.
4 Treasury Management Strategy 2018/19 | Torbay Council
2 Core funds and expected investment balances
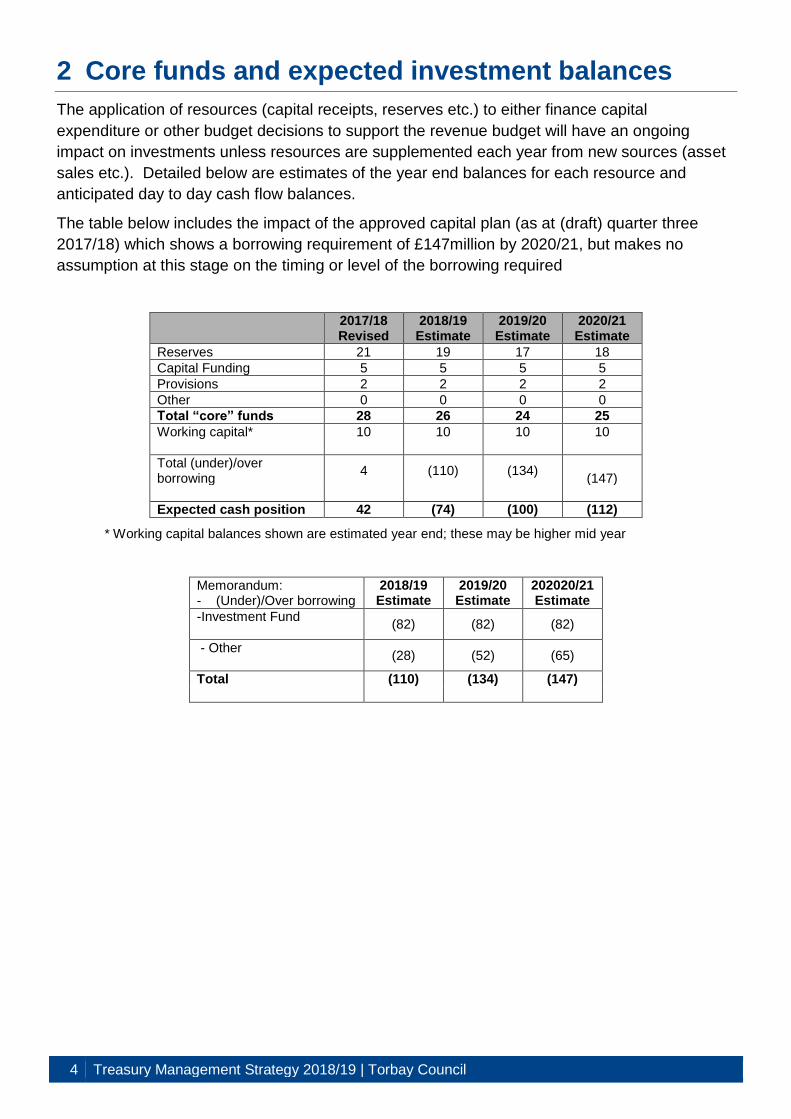
The application of resources (capital receipts, reserves etc.) to either finance capital
expenditure or other budget decisions to support the revenue budget will have an ongoing
impact on investments unless resources are supplemented each year from new sources (asset
sales etc.). Detailed below are estimates of the year end balances for each resource and
anticipated day to day cash flow balances.
The table below includes the impact of the approved capital plan (as at (draft) quarter three
2017/18) which shows a borrowing requirement of £147million by 2020/21, but makes no
assumption at this stage on the timing or level of the borrowing required
E 2017/18 Revised
2018/19 Estimate
2019/20 Estimate
2020/21 Estimate
Reserves 21 19 17 18
Capital Funding 5 5 5 5
Provisions 2 2 2 2
Other 0 0 0 0
Total “core” funds 28 26 24 25
Working capital* 10 10 10 10
Total (under)/over borrowing
4 (110) (134)
(147)
Expected cash position 42 (74) (100) (112)
* Working capital balances shown are estimated year end; these may be higher mid year
Memorandum: - (Under)/Over borrowing
2018/19 Estimate
2019/20 Estimate
202020/21 Estimate
-Investment Fund
(82) (82) (82)
- Other
(28) (52) (65)
Total (110) (134) (147)
Torbay Council | Treasury Management Strategy 2018/19 5
3 Prospects for Interest Rates
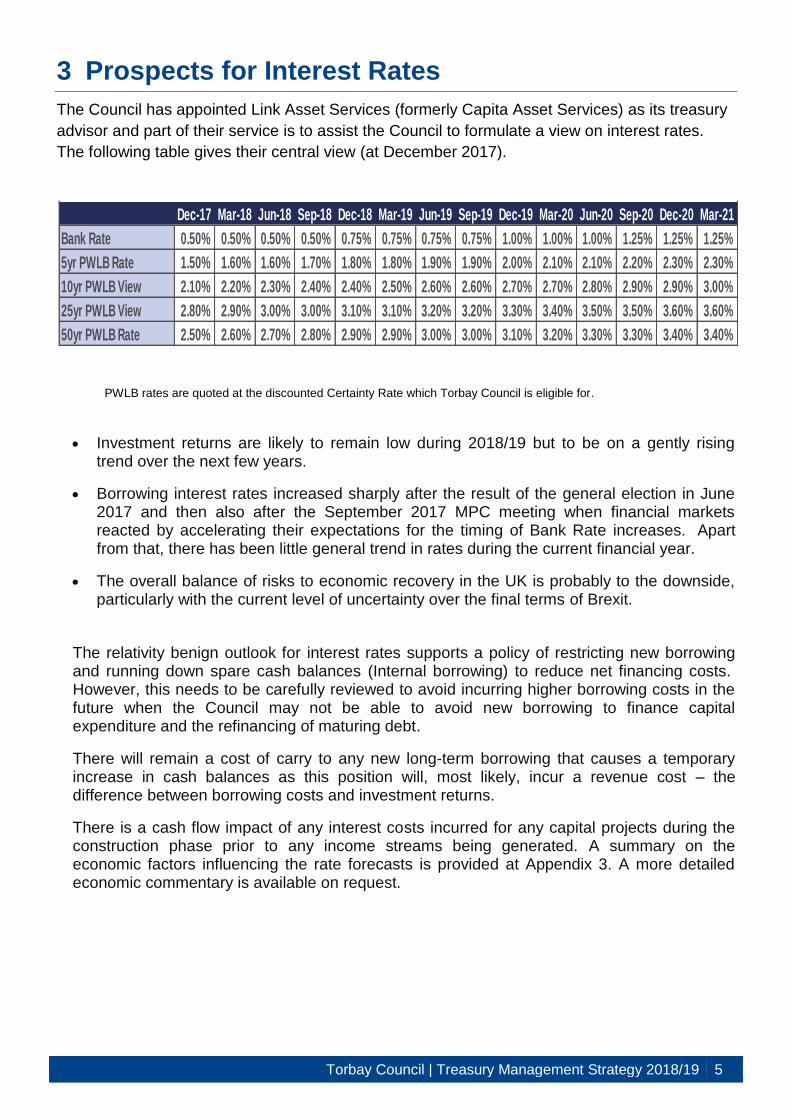
The Council has appointed Link Asset Services (formerly Capita Asset Services) as its treasury
advisor and part of their service is to assist the Council to formulate a view on interest rates.
The following table gives their central view (at December 2017).
PWLB rates are quoted at the discounted Certainty Rate which Torbay Council is eligible for.
Investment returns are likely to remain low during 2018/19 but to be on a gently rising trend over the next few years.
Borrowing interest rates increased sharply after the result of the general election in June 2017 and then also after the September 2017 MPC meeting when financial markets reacted by accelerating their expectations for the timing of Bank Rate increases. Apart from that, there has been little general trend in rates during the current financial year.
The overall balance of risks to economic recovery in the UK is probably to the downside, particularly with the current level of uncertainty over the final terms of Brexit.
The relativity benign outlook for interest rates supports a policy of restricting new borrowing and running down spare cash balances (Internal borrowing) to reduce net financing costs. However, this needs to be carefully reviewed to avoid incurring higher borrowing costs in the future when the Council may not be able to avoid new borrowing to finance capital expenditure and the refinancing of maturing debt.
There will remain a cost of carry to any new long-term borrowing that causes a temporary increase in cash balances as this position will, most likely, incur a revenue cost – the difference between borrowing costs and investment returns.
There is a cash flow impact of any interest costs incurred for any capital projects during the construction phase prior to any income streams being generated. A summary on the economic factors influencing the rate forecasts is provided at Appendix 3. A more detailed economic commentary is available on request.
Dec-17 Mar-18 Jun-18 Sep-18 Dec-18 Mar-19 Jun-19 Sep-19 Dec-19 Mar-20 Jun-20 Sep-20 Dec-20 Mar-21
Bank Rate 0.50% 0.50% 0.50% 0.50% 0.75% 0.75% 0.75% 0.75% 1.00% 1.00% 1.00% 1.25% 1.25% 1.25%
5yr PWLB Rate 1.50% 1.60% 1.60% 1.70% 1.80% 1.80% 1.90% 1.90% 2.00% 2.10% 2.10% 2.20% 2.30% 2.30%
10yr PWLB View 2.10% 2.20% 2.30% 2.40% 2.40% 2.50% 2.60% 2.60% 2.70% 2.70% 2.80% 2.90% 2.90% 3.00%
25yr PWLB View 2.80% 2.90% 3.00% 3.00% 3.10% 3.10% 3.20% 3.20% 3.30% 3.40% 3.50% 3.50% 3.60% 3.60%
50yr PWLB Rate 2.50% 2.60% 2.70% 2.80% 2.90% 2.90% 3.00% 3.00% 3.10% 3.20% 3.30% 3.30% 3.40% 3.40%

6 Treasury Management Strategy 2018/19 | Torbay Council
4 Borrowing
4.1 The current borrowing position
The Council’s treasury portfolio position with forward projections (excluding new borrowing) is
summarised below. The table shows the actual external debt (the treasury management
operations), against the underlying capital borrowing need (the Capital Financing Requirement
(CFR)), highlighting any over or under borrowing.
£m 2016/17 Actual
2017/18 Revised
2018/19 Estimate
2019/20 Estimate
2020/21 Estimate
Debt at 1 April
138 153 273 273 273
Change in Debt 15
20 0 0 0
Other long-term liabilities – School PFI
7 7 6 6 6
Other long-term liabilities – EFW PFI
12 12 12 12 12
Actual gross debt at 31 March
172 292 291 291 291
The Capital Financing Requirement
174 288 401 425 438
(Under) / over borrowing (2) 4 (110) (134) (147)
The table above based on (draft) quarter three 2017/18 capital monitoring report shows the
Council’s capital financing requirement (including PFI liabilities) rising to £438m by the end of
2020/21 of which £147m is yet to be borrowed. This total could increase if Council approve any
additional schemes to be funded from borrowing such as for additional regeneration schemes.
The Borrowing Strategy
The Council’s Capital Investment Plan at (draft) quarter 3 2017/18 is detailed within the
Prudential Indicators at Appendix 1. This plan and the impact on core cash, indicate the need to
borrow £147 million of funds over the next three years to ensure that gross debt is in line with
the CFR. If the profile of capital spend changes, the in year treasury strategy will be updated
and borrowing decisions expedited by the Chief Finance Officer under delegated powers.
Ongoing capital transactions will initially be funded from the balance of new borrowing in
2017/18. Subsequent to this resource being applied, it is proposed to use existing cash
resources to initially fund planned capital expenditure in order to delay the additional borrowing
cost to the General Fund until income streams are realised. Under this primary strategy new
borrowing will be limited to levels sufficient to cover cash requirements for individual capital
transactions and only at the point of reasonable certainty that the funds will be applied quickly.
The budget for payment of interest on debt for 2018/19 of £9m, based on £273m of borrowing
as at 15/1/18, is based on an overall borrowing rate of 3.40% (3.90% in 2017/18).
The Chief Finance Officer has recognised the value in aligning current low borrowing rates to
the business cases of specific schemes generating new income streams and this policy is
currently being applied to Investment Fund related schemes. Decisions on other schemes will
be made on a case by case basis and non-applicable schemes will continue to reflect the
Council’s average rate of borrowing.

Torbay Council | Treasury Management Strategy 2018/19 7
The outlook for interest rates in section 2 recognises the risk of deferring borrowing and
exposure to higher borrowing costs. In the event of a significant rise in the outlook for interest
rates, the Chief Finance Officer has delegated authority to vary the primary strategy outlined
above and take a greater proportion of the borrowing requirement earlier to protect the
affordability of capital schemes over the longer term. The Council will not borrow more than, or
in advance of its needs, purely in order to profit from the investment of the extra sums
borrowed.
Any decision to borrow in advance, linked to forecast interest rates, will be within forward
approved CFR estimates, and will be considered carefully to ensure that value for money can
be demonstrated and that the Council can ensure the security of such funds. No borrowing in
advance will be made in relation to any capital project funded from borrowing until individual
schemes have been approved by Council and there is a high assumption of spend occurring.
Finance officers continue to monitor alternative funding sources to PWLB. Discussions have
been held with banking partners on market structures available and while these currently offer
no advantage over PWLB, groundwork has been prepared if the Council’s circumstances
change in the future.
Treasury Indicators for limits to borrowing activity are published within Appendix 1 to this report.

8 Treasury Management Strategy 2018/19 | Torbay Council
5 Annual Investment Strategy
5.1 Investment policy The Council’s investment policy has regard to the CLG’s Guidance on Local Government Investments (“the Guidance”) and the revised CIPFA Treasury Management in Public Services Code of Practice and Cross Sectoral Guidance Notes (“the CIPFA TM Code”). The Council’s investment priorities will be security first, liquidity second, and then return. In accordance with the above guidance from the CLG and CIPFA, and in order to minimise the risk to investments, the Council applies minimum acceptable credit criteria in order to generate a list of highly creditworthy counterparties which also enables diversification and thus avoidance of concentration risk. The key ratings used to monitor counterparties are the Short Term and Long Term ratings. The creditworthiness policy adopted is detailed at Appendix 4. A decision by the Chief Finance Officer to temporarily remove all Eurozone Banks, regardless of rating, from the approved counterparty list for in-house investments remains in place but does not form part of this policy. Investment instruments identified for use in the financial year are listed at Appendix 5 under the ‘Specified’ and ‘Non-Specified’ Investments categories. Counterparty limits will be set within the schedules accompanying the Council’s Treasury Management Practices.
5.2 Investment strategy
Investment rates are forecast to improve marginally during 2018/19.
Expected cash levels are likely to be artificially buoyant at the start of the year from the balance of unapplied borrowing in 2017/18. It is proposed to decrease cash levels through the year as internal resources are used to initially fund income generating capital schemes and delay the cost of borrowing, rather than maintain cash levels earning negligible investment returns.
Based on strategic cash flow forecasts £15million of the Council’s investments can be regarded as core cash and be invested over a longer periods in higher risk/return instruments. Previous investment decisions have locked out £12 million of these funds to gain higher returns (average 1.07%) and £3 million has been placed with the Local Authorities Property Fund (current yield around 4.50%). The fixed deposits are due to mature during 2018/19 and will be subject to reinvestment over a further longer term based on the forecast slow rise in interest rates. Additional exposure to Property Funds will be considered but need to be balanced against any impact on the General Fund from new accounting requirements.
A facility to pay £10million of short term cash to TOR2 in advance of 12 months contracted fees, to earn a significant discount was renewed in December 2017. This facility will be reviewed annually.
Under the strategy of using cash resources as internal borrowing for capital expenditure, remaining cash will need to be maintained in short term liquidity instruments. As such extensive use will be made of the Council’s money market funds and fixed deposits are expected to be limited to short 3 or 6 month durations and instant access instruments to maintain sufficient liquidity. The expected return on these investments is unlikely to exceed 0.5%
The Council’s holding in the Funding Circle (peer-to-peer lending platform) is being wound down as previously approved and at 31/12/17 stood at £166,500.

Torbay Council | Treasury Management Strategy 2018/19 9
The overall investment performance will be benchmarked against the 7-Day LIBID market rate and is budgeted at a revised level of 0.65%
A new directive (MIFID II) from the European Union affecting financial dealing was implemented into UK law in January 2018. Prior to the new directive Torbay Council was classed as a “professional” client with its investment counterparties, recognising officers have knowledge and expertise in dealing with more complex investment instruments. Under MIFID II all Local Authorities are by default classed as “retail” clients meaning that banks and other counterparties will only be able to offer the most basic of investment vehicles e.g. fixed deposits, notice accounts. Authorities can apply to be reclassified as a professional client and this would be required for each investment type with each counterparty.
Officers have successfully applied for opt-up professional status in respect of all existing instruments. However, there remains a possibility that the Council will not pass the criteria for reclassification for new applications denying access to higher risk/return markets in future years.
Investment treasury indicator and limits are published within Appendix 1 to this report

10 Treasury Management Strategy 2018/19 | Torbay Council
6 Treasury Management Consultants
Link Asset Services (formerly Capita Asset Services) was reappointed as the Council’s external
treasury management advisors for three years from February 2016, following a full tender
process.
The Council acknowledges that there is value in employing external providers of treasury
management services in order to acquire access to specialist skills and resources. The Chief
Finance Officer will ensure that the terms of their appointment and the methods by which their
value will be assessed are properly agreed and documented, and subjected to regular review.
The Council recognises that responsibility for treasury management decisions remains with the
organisation at all times and will ensure that undue reliance is not placed upon our external
service providers.

Torbay Council | Treasury Management Strategy 2018/19 11
7 Reporting Arrangements and Management
Evaluation
Members will receive the following reports for 2018/19 as standard in line with the requirements
of the Code of Practice:
Annual Treasury Management Strategy
Mid-Year Treasury Review report
Annual Treasury Outturn report
The CFO will inform the Mayor/Executive Lead for Finance of any long-term borrowing or
repayment undertaken or any significant events that may affect the Council’s treasury
management activities. The CFO will maintain a list of staff authorised to undertake treasury
management transactions on behalf of the Council.
The Chief Finance Officer is authorised to approve any movement between borrowing and other
long-term liabilities within the Authorised Limit (see Appendix 1). Any such change will be
reported to the next meeting of the Council.
The impact of these policies will be reflected as part of the Council’s revenue budget and
therefore will be reported through the quarterly budget monitoring process.
The Council’s management and evaluation arrangements for Treasury Management will be as
follows:
Monthly monitoring report to the Chief Finance Officer, Finance Manager-Budget &
Technical, Executive Lead for Finance and Group Leaders
Quarterly meeting of the Treasury Manager/ Finance Manager-Budget & Technical/
Chief Finance Officer to review previous quarter performance and plan following
period activities
Regular meetings with the Council’s treasury advisors
Membership and participation in the LINK Investment Benchmarking Club
The Audit Committee is the body responsible for scrutiny of Treasury Management.
Reporting arrangements may be reviewed during 2018/19 in light of the new Treasury
Management Code of Practice.
12 Treasury Management Strategy 2018/19 | Torbay Council
8 Other Matters
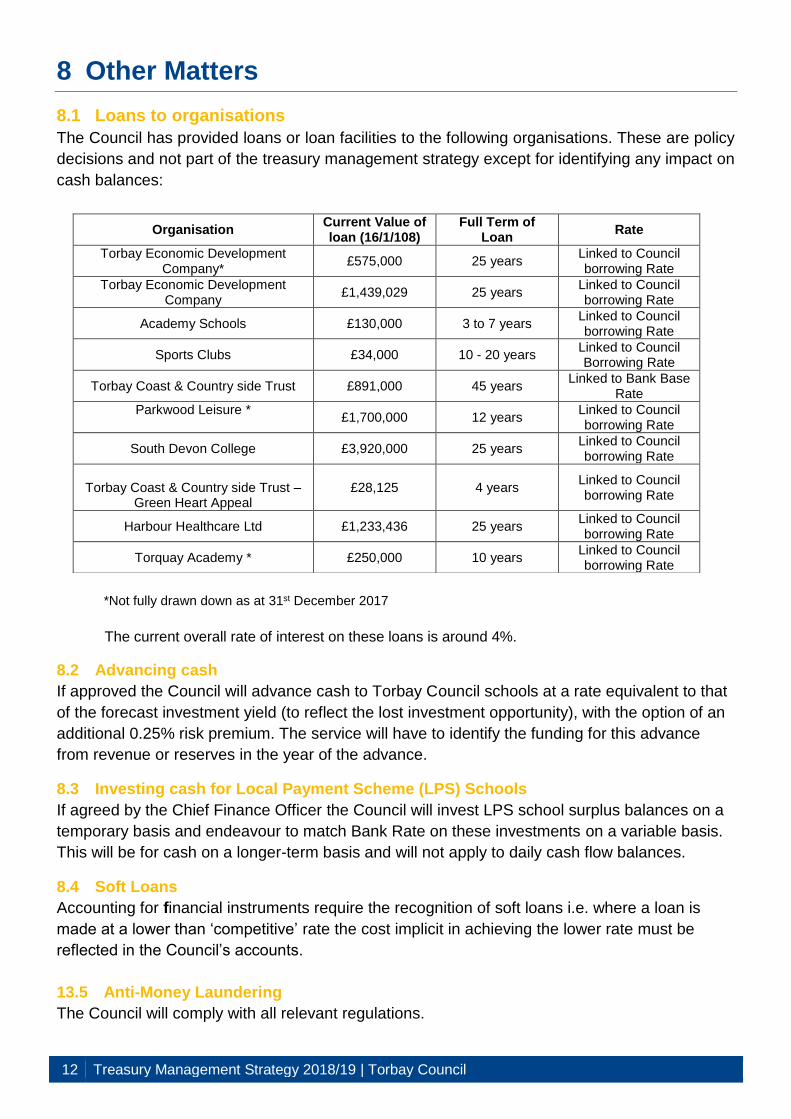
8.1 Loans to organisations
The Council has provided loans or loan facilities to the following organisations. These are policy
decisions and not part of the treasury management strategy except for identifying any impact on
cash balances:
*Not fully drawn down as at 31st December 2017
The current overall rate of interest on these loans is around 4%.
8.2 Advancing cash
If approved the Council will advance cash to Torbay Council schools at a rate equivalent to that
of the forecast investment yield (to reflect the lost investment opportunity), with the option of an
additional 0.25% risk premium. The service will have to identify the funding for this advance
from revenue or reserves in the year of the advance.
8.3 Investing cash for Local Payment Scheme (LPS) Schools
If agreed by the Chief Finance Officer the Council will invest LPS school surplus balances on a
temporary basis and endeavour to match Bank Rate on these investments on a variable basis.
This will be for cash on a longer-term basis and will not apply to daily cash flow balances.
8.4 Soft Loans
Accounting for financial instruments require the recognition of soft loans i.e. where a loan is
made at a lower than ‘competitive’ rate the cost implicit in achieving the lower rate must be
reflected in the Council’s accounts.
13.5 Anti-Money Laundering
The Council will comply with all relevant regulations.
Organisation Current Value of loan (16/1/108)
Full Term of Loan
Rate
Torbay Economic Development Company*
£575,000 25 years Linked to Council borrowing Rate
Torbay Economic Development Company
£1,439,029 25 years Linked to Council borrowing Rate
Academy Schools £130,000 3 to 7 years Linked to Council borrowing Rate
Sports Clubs £34,000 10 - 20 years Linked to Council Borrowing Rate
Torbay Coast & Country side Trust £891,000 45 years Linked to Bank Base
Rate
Parkwood Leisure *
£1,700,000 12 years Linked to Council borrowing Rate
South Devon College £3,920,000 25 years Linked to Council borrowing Rate
Torbay Coast & Country side Trust –
Green Heart Appeal £28,125 4 years
Linked to Council borrowing Rate
Harbour Healthcare Ltd £1,233,436 25 years Linked to Council borrowing Rate
Torquay Academy * £250,000 10 years Linked to Council borrowing Rate
Torbay Council | Treasury Management Strategy 2018/19 13
Appendix 1 Prudential & Treasury Management Indicators 2018/19 – 2020/21
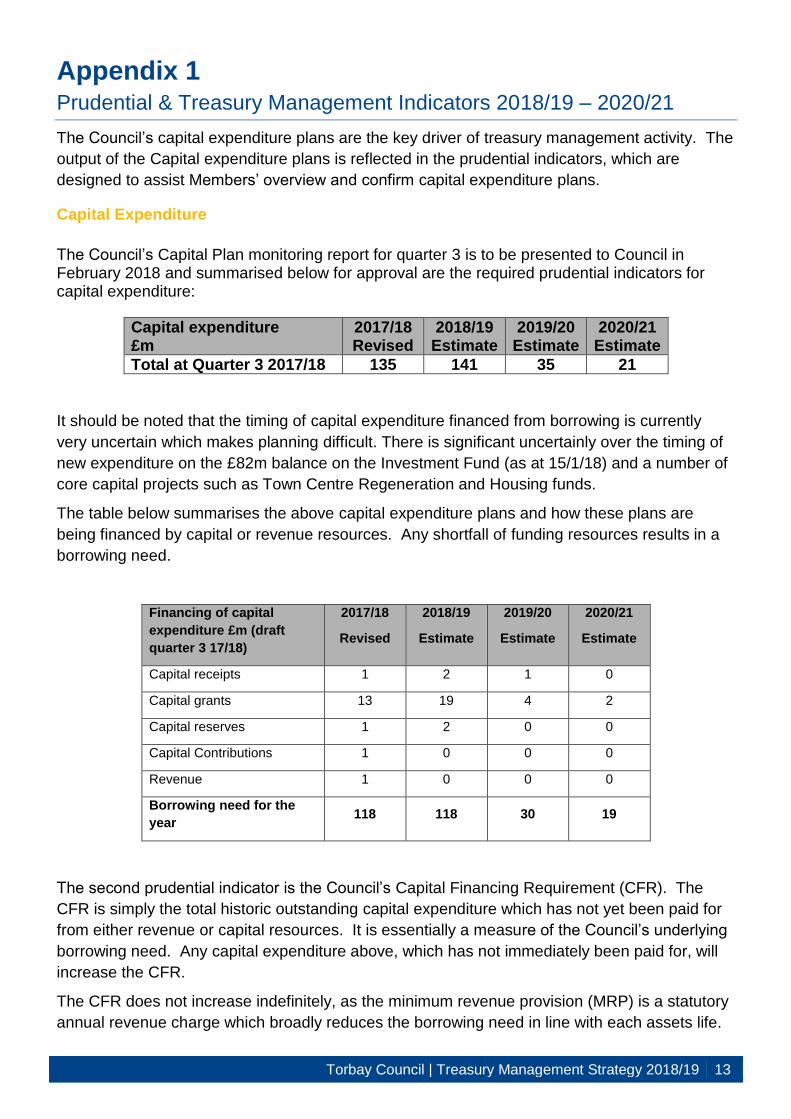
The Council’s capital expenditure plans are the key driver of treasury management activity. The
output of the Capital expenditure plans is reflected in the prudential indicators, which are
designed to assist Members’ overview and confirm capital expenditure plans.
Capital Expenditure
The Council’s Capital Plan monitoring report for quarter 3 is to be presented to Council in February 2018 and summarised below for approval are the required prudential indicators for capital expenditure:
Capital expenditure £m
2017/18 Revised
2018/19 Estimate
2019/20 Estimate
2020/21 Estimate
Total at Quarter 3 2017/18 135 141 35 21
It should be noted that the timing of capital expenditure financed from borrowing is currently
very uncertain which makes planning difficult. There is significant uncertainly over the timing of
new expenditure on the £82m balance on the Investment Fund (as at 15/1/18) and a number of
core capital projects such as Town Centre Regeneration and Housing funds.
The table below summarises the above capital expenditure plans and how these plans are
being financed by capital or revenue resources. Any shortfall of funding resources results in a
borrowing need.
Financing of capital
expenditure £m (draft
quarter 3 17/18)
2017/18
Revised
2018/19
Estimate
2019/20
Estimate
2020/21
Estimate
Capital receipts 1 2 1 0
Capital grants 13 19 4 2
Capital reserves 1 2 0 0
Capital Contributions 1 0 0 0
Revenue 1 0 0 0
Borrowing need for the
year 118 118 30 19
The second prudential indicator is the Council’s Capital Financing Requirement (CFR). The
CFR is simply the total historic outstanding capital expenditure which has not yet been paid for
from either revenue or capital resources. It is essentially a measure of the Council’s underlying
borrowing need. Any capital expenditure above, which has not immediately been paid for, will
increase the CFR.
The CFR does not increase indefinitely, as the minimum revenue provision (MRP) is a statutory
annual revenue charge which broadly reduces the borrowing need in line with each assets life.
14 Treasury Management Strategy 2018/19 | Torbay Council
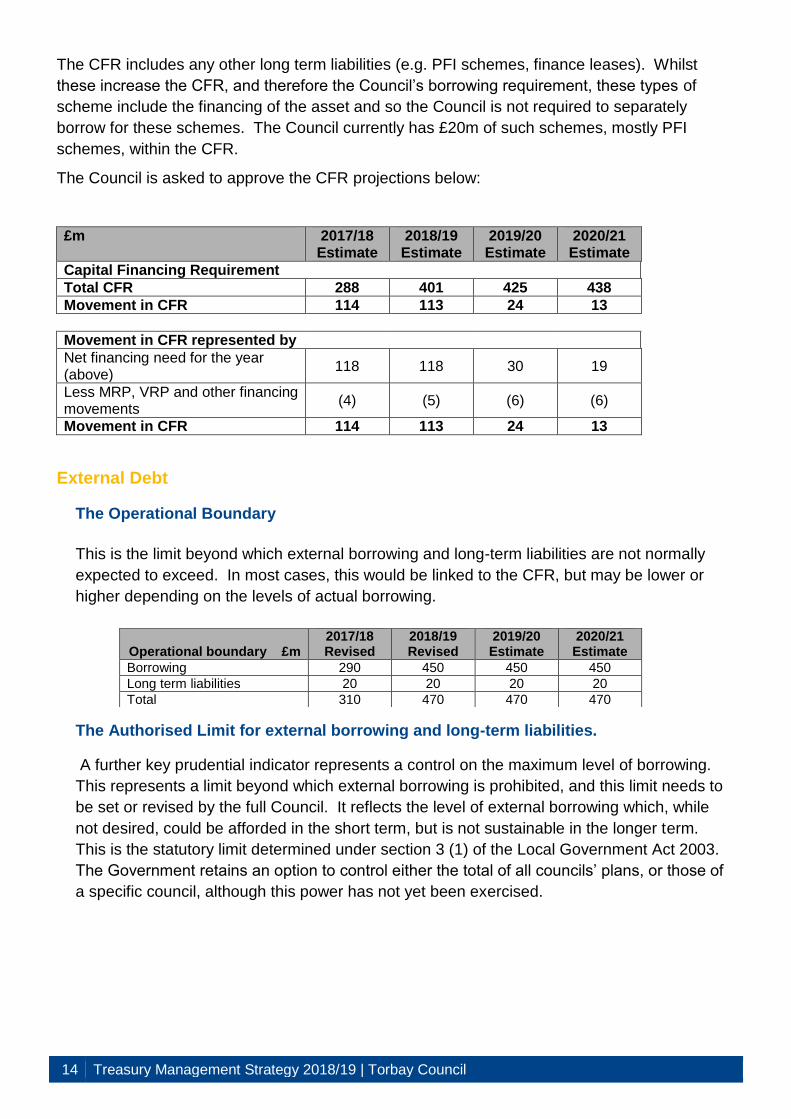
The CFR includes any other long term liabilities (e.g. PFI schemes, finance leases). Whilst
these increase the CFR, and therefore the Council’s borrowing requirement, these types of
scheme include the financing of the asset and so the Council is not required to separately
borrow for these schemes. The Council currently has £20m of such schemes, mostly PFI
schemes, within the CFR.
The Council is asked to approve the CFR projections below:
£m 2017/18 Estimate
2018/19 Estimate
2019/20 Estimate
2020/21 Estimate
Capital Financing Requirement
Total CFR 288 401 425 438
Movement in CFR 114 113 24 13
Movement in CFR represented by
Net financing need for the year (above)
118 118 30 19
Less MRP, VRP and other financing movements
(4) (5) (6) (6)
Movement in CFR 114 113 24 13
External Debt
The Operational Boundary
This is the limit beyond which external borrowing and long-term liabilities are not normally
expected to exceed. In most cases, this would be linked to the CFR, but may be lower or
higher depending on the levels of actual borrowing.
The Authorised Limit for external borrowing and long-term liabilities.
A further key prudential indicator represents a control on the maximum level of borrowing.
This represents a limit beyond which external borrowing is prohibited, and this limit needs to
be set or revised by the full Council. It reflects the level of external borrowing which, while
not desired, could be afforded in the short term, but is not sustainable in the longer term.
This is the statutory limit determined under section 3 (1) of the Local Government Act 2003.
The Government retains an option to control either the total of all councils’ plans, or those of
a specific council, although this power has not yet been exercised.
Operational boundary £m 2017/18 Revised
2018/19 Revised
2019/20 Estimate
2020/21 Estimate
Borrowing 290 450 450 450
Long term liabilities 20 20 20 20
Total 310 470 470 470

Torbay Council | Treasury Management Strategy 2018/19 15
Authorised limit £m
2017/18 Revised
2018/19 Estimate
2019/20 Estimate
2020/21 Estimate
Borrowing 310 500 500 500
Other long term liabilities 20 20 20 20
Total 330 520 520 520
A comparison of Gross Debt and the Capital Financing Requirement is also a key indicator
of prudence. This indicator is to ensure that debt does not, except in the short term,
exceed the total of the capital financing requirement in the preceding year plus estimates
of any additional capital financing requirement for the current and next two financial years.
£m 2016/17 Actual
2017/18 Revised
2018/19 Estimate
2019/20 Estimate
2020/21 Estimate
Debt at 1 April
138 153 273 273 273
Change in Debt 15
120 0 0 0
Other long-term liabilities – School PFI
7 7 6 6 6
Other long-term liabilities – EFW PFI
12 12 12 12 12
Gross Debt at 31 March
172 292 291 291 291
Capital Financing Requirement
174 288 401 425 438
(Under) / over borrowing (2) 4 (110) (134) (147)
Affordability
To assess the affordability of a council’s capital programme, the capital financing costs are compared to
it net revenue stream (i.e taxation and non-specific grant income). Financing costs include interest
payable, MRP and interest and investment income. For Torbay investment income includes income from
investment fund properties.
£m 2017/18 Revised
2018/19 Estimate
2019/20 Estimate
2020/21 Estimate
Net Revenue Stream
£110m £110m £110m £110m
Interest Paid & MRP 9 as at 15/1/18)
£11m £14m £14m £14m
Interest paid & MRP on new debt
0 0 £5m £6m
Interest Received
(£1m) (£1m) (£1m) (£1m)
Sub Total
£10m £13m £18m £19m
Percentage of Financing Costs to Net Revenue Stream
9% 12% 16% 17%

16 Treasury Management Strategy 2018/19 | Torbay Council
Appendix 2 Policy on Minimum Revenue Provision for 2018/19
The Minimum Revenue Provision is a statutory charge that the Council is required to make from its revenue budget. This provision enables the Council to generate cash resources for the repayment of borrowing. The basis for the calculation of the provision is prescribed by legislation (Local Authorities (Capital Finance and Accounting (England) (Amendment) Regulations 2012, which states that Councils are required to “determine for the current financial year an amount of MRP that it considers to be prudent” and prepare an annual statement on their MRP calculation to their full Council. One of the aims of this legislation is to ensure that the repayment of principal owed for Capital expenditure is charged on a prudent basis. Central Government guidance says:
“the broad aim of prudent provision is to ensure that debt is repaid over a period that is either reasonably commensurate with that over which the Capital expenditure provides benefits, or, in the case of borrowing supported by Government Revenue Support Grant, reasonably commensurate with the period implicit in the determination of that grant.”
For Supported Borrowing, (borrowing funded by central government), the Council will charge MRP at 2% of the balance as at 31 March after the deduction of the value of adjustment A (a set value in 2004), fixed at the same cash value as that of the whole debt is repaid after 50 years.
The Council will charge a VRP (voluntary revenue provision) for the supported borrowing within the adjustment A value that is outstanding as at 31 March relating to transferred debt from Devon County Council fixed at the same cash value as that of the whole debt is repaid after 50 years (which is similar to the supported borrowing calculation).
For capital expenditure funded from unsupported borrowing, less any repayment to date, the Council will make a provision based on the cumulative expenditure incurred on each asset (including investment fund properties) in the previous financial years using a prudent asset life, which reflects the estimated usable life of that asset. (See table below). The MRP for each asset will be calculated on the asset life method using an annuity calculation. An adjustment to the MRP calculation will be made where there is expenditure in the previous financial year, but the asset is not yet operational. MRP will be calculated on the total expenditure on that asset in the year after the asset becomes operational or when there is an income stream in relation to that asset. The Council will continue to charge services for their use of unsupported borrowing using a prudent asset life (or a shorter period) on an annuity calculation (or a straight line basis if no MRP on the asset). Where possible the same asset life and borrowing interest rate will be used for both the charge to services and the calculation of the MRP.
To mitigate any negative impact from the changes in accounting for leases and PFI schemes the Council will include in the annual MRP charge an amount equal to the amount that has been taken to the balance sheet to reduce the balance sheet liability for a PFI scheme or a finance

Torbay Council | Treasury Management Strategy 2018/19 17
lease. The calculation will be based on the annuity method using the Internal Rate of Return (IRR) implicit in the PFI or lease agreement.
Where loans are given for capital purposes they come within the scope of the prudential controls established by the Local Government Act 2003 and the Local Authorities (LINK Finance and Accounting) (England) Regulations 2008.
If a loan agreement does not include contractual commitments that the funds be put towards capital expenditure no MRP will be made, if however capital contract commitments are included then an MRP will be made on a prudent basis using Asset Life Method linked to the life of the asset being funded. The Capital Financing Requirement (CFR) will increase by the amount of the loan. Once the funds are returned to the local authority, the returned funds are classed as a capital receipt with those receipts being earmarked specifically to that loan, and the CFR and loan will reduce accordingly. If the expectation is that funds will be repaid in full at some point in the future, there is no requirement to set aside prudent provision to repay the debt liability in the interim period, so there is no MRP application. The position of each loan will be reviewed on an annual basis by Chief Finance Officer.
Where expenditure is on an investment fund property a MRP may not be applied where there is a clear decision or realistic expectation that an asset purchased as an investment property will be sold in the future where the capital receipts from that sale will be set aside to enable repayment of the borrowing associated with the asset. These assets will be reviewed each year to asses any reduction in value including acquisition costs. If any reduction in value has occurred then an MRP will be charged to recover the loss in the medium term, such as over five to ten years.
Where relevant, the suggested asset lives for certain types of capitalised expenditure as detailed in the MRP guidance issued by DCLG will be used. Each asset life will be considered in relation the asset being constructed by the Chief Finance Officer; however as a guide the following are typical asset lives that will be used.
Asset Type Asset Life
Freehold Land (speciifed in DCLG statutory gudiance) 50 years
Buildings 40 years
Investment Properties 40 years
Software 10 years
Vehicles & Equipment 7 years
Highway Network 40 years
Structural Enhancements 25 years
Infrastructure 40 years
For capital expenditure where land and buildings are not separately identified a blended asset
life can be used (e.g. an assumption that 30% of the value is land results in an asset life of 43
years).

18 Treasury Management Strategy 2018/19 | Torbay Council
Appendix 3 Economic Summary (Link Asset Services – January 2018)
As expected, the Monetary Policy Committee (MPC) delivered a 0.25% increase in Bank Rate
at its meeting on 2 November. This removed the emergency cut in August 2016 after the EU
referendum. The MPC also gave forward guidance that they expected to increase Bank rate
only twice more by 0.25% by 2020 to end at 1.00%. The Link Asset Services forecast as above
includes increases in Bank Rate of 0.25% in November 2018, November 2019 and August
2020.
The overall longer run trend is for gilt yields and PWLB rates to rise, albeit gently. It has long
been expected, that at some point, there would be a more protracted move from bonds to
equities after a historic long-term trend, over about the last 25 years, of falling bond yields. The
action of central banks since the financial crash of 2008, in implementing substantial
Quantitative Easing, added further impetus to this downward trend in bond yields and rising
bond prices. Quantitative Easing has also directly led to a rise in equity values as investors
searched for higher returns and took on riskier assets. The sharp rise in bond yields since the
US Presidential election in November 2016 has called into question whether the previous trend
may go into reverse, especially now the Fed has taken the lead in reversing monetary policy by
starting, in October 2017, a policy of not fully reinvesting proceeds from bonds that it holds
when they mature.
Until 2015, monetary policy was focused on providing stimulus to economic growth but has
since started to refocus on countering the threat of rising inflationary pressures as stronger
economic growth becomes more firmly established. The Fed has started raising interest rates
and this trend is expected to continue during 2018 and 2019. These increases will make
holding US bonds much less attractive and cause their prices to fall, and therefore bond yields
to rise. Rising bond yields in the US are likely to exert some upward pressure on bond yields in
the UK and other developed economies. However, the degree of that upward pressure is likely
to be dampened by how strong or weak the prospects for economic growth and rising inflation
are in each country, and on the degree of progress towards the reversal of monetary policy
away from quantitative easing and other credit stimulus measures.
From time to time, gilt yields – and therefore PWLB rates - can be subject to exceptional levels
of volatility due to geo-political, sovereign debt crisis and emerging market developments. Such
volatility could occur at any time during the forecast period.
Economic and interest rate forecasting remains difficult with so many external influences
weighing on the UK. The above forecasts (and MPC decisions) will be liable to further
amendment depending on how economic data and developments in financial markets transpire
over the next year. Geopolitical developments, especially in the EU, could also have a major
impact. Forecasts for average investment earnings beyond the three-year time horizon will be
heavily dependent on economic and political developments.
The overall balance of risks to economic recovery in the UK is probably to the downside,
particularly with the current level of uncertainty over the final terms of Brexit.
Downside risks to current forecasts for UK gilt yields and PWLB rates currently include:

Torbay Council | Treasury Management Strategy 2018/19 19
The Bank of England takes action too quickly over the next three years to raise
Bank Rate and causes UK economic growth, and increases in inflation, to be
weaker than we currently anticipate.
Geopolitical risks, especially North Korea, but also in Europe and the Middle East,
which could lead to increasing safe haven flows.
A resurgence of the Eurozone sovereign debt crisis, possibly Italy, due to its high
level of government debt, low rate of economic growth and vulnerable banking
system.
Weak capitalisation of some European banks.
Germany is still without an effective government after the inconclusive result of the
general election in October. In addition, Italy is to hold a general election on 4 March
and the anti EU populist Five Star party is currently in the lead in the polls, although it is
unlikely to get a working majority on its own. Both situations could pose major
challenges to the overall leadership and direction of the EU as a whole and of the
individual respective countries. Hungary will hold a general election in April 2018.
The result of the October 2017 Austrian general election has now resulted in a
strongly anti-immigrant coalition government. In addition, the Czech ANO party
became the largest party in the October 2017 general election on a platform of
being strongly against EU migrant quotas and refugee policies. Both developments
could provide major impetus to other, particularly former Communist bloc countries,
to coalesce to create a major block to progress on EU integration and centralisation
of EU policy. This, in turn, could spill over into impacting the Euro, EU financial
policy and financial markets.
Rising protectionism under President Trump
A sharp Chinese downturn and its impact on emerging market countries
The potential for upside risks to current forecasts for UK gilt yields and PWLB rates, especially
for longer term PWLB rates include: -
The Bank of England is too slow in its pace and strength of increases in Bank Rate
and, therefore, allows inflation pressures to build up too strongly within the UK
economy, which then necessitates a later rapid series of increases in Bank Rate
faster than we currently expect.
UK inflation returning to sustained significantly higher levels causing an increase in
the inflation premium inherent to gilt yields.
The Fed causing a sudden shock in financial markets through misjudging the pace
and strength of increases in its Fed. Funds Rate and in the pace and strength of
reversal of Quantitative Easing, which then leads to a fundamental reassessment by
investors of the relative risks of holding bonds, as opposed to equities. This could
lead to a major flight from bonds to equities and a sharp increase in bond yields in
the US, which could then spill over into impacting bond yields around the world.

20 Treasury Management Strategy 2018/19 | Torbay Council
Appendix 4 Creditworthiness Policy This Council applies the creditworthiness service provided by Link Asset Services. This service employs a sophisticated modelling approach utilising credit ratings from the three main credit rating agencies - Fitch, Moody’s and Standard and Poor’s. The credit ratings of counterparties are supplemented with the following overlays:
credit watches and credit outlooks from credit rating agencies;
CDS spreads to give early warning of likely changes in credit ratings;
sovereign ratings to select counterparties from only the most creditworthy countries.
This modelling approach combines credit ratings, credit Watches and credit Outlooks in a weighted scoring system which is then combined with an overlay of CDS spreads for which the end product is a series of colour coded bands, illustrated below, which indicate the relative creditworthiness of counterparties. The Chief Finance Officer applies and reviews suitable financial and durational bands to each of these bands.
Y Pi1 Pi2 P B O R G N/C
1 1.25 1.5 2 3 4 5 6 7
up to 5yrs up to 5yrs up to 5yrs up to 2yrs up to 2yrs up to 1yr
up to
6mths
up to
100days no colour
The Link Asset Services’ creditworthiness service uses a wider array of information than just primary ratings. Furthermore, by using a risk weighted scoring system, it does not give undue preponderance to just one agency’s ratings. All credit ratings will be monitored on a monthly basis and for each investment transaction. The Council is alerted to changes to ratings of all three agencies through its use of the LINK Asset Services’ creditworthiness service.
if a downgrade results in the counterparty / investment scheme no longer meeting the Council’s minimum criteria, its further use as a new investment will be withdrawn immediately.
in addition to the use of credit ratings the Council will be advised of information in movements in credit default swap spreads against the iTraxx benchmark and other market data on a daily basis via its Passport website, provided exclusively to it by LINK Asset Services. Extreme market movements may result in downgrade of an institution or removal from the Council’s lending list.
Sole reliance will not be placed on the use of this external service. In addition the CFO will also use market data and market information, information on any external support for banks to help support its decision making process.
The Council has determined that it will only use approved counterparties from countries with a minimum sovereign credit rating of AA+ and also have banks operating in sterling markets. The exception to this is the United Kingdom which has been exempted from the rating criteria to ensure cash services can continue to operate following a downgrade to AA.

Torbay Council | Treasury Management Strategy 2018/19 21
The list of countries that qualify using this credit criteria as at the date of this report (based on
the lowest available rating) are shown below and this list will be added to, or deducted from, by
officers should ratings change in accordance with this policy.
AAA AA+
Australia Netherlands
Hong Kong Canada Norway Finland
Hong Kong Denmark Singapore Hong Kong
Germany Sweden U.S.A.
Luxembourg Switzerland
Exempted from Sovereign Rating Criteria
United Kingdom

22 Treasury Management Strategy 2018/19 | Torbay Council
Appendix 5 Approved Investment Instruments: Specified and Non-Specified
The criteria, time limits and monetary limits applying to institutions or investment vehicles are:
Specified Investments
All such investments will be sterling denominated, with maturities up to maximum of 1 year, meeting
the minimum ‘high’ rating criteria where applicable.
Investment Type * Minimum ‘High’ Credit Criteria
Debt Management Agency Deposit Facility --
Term deposits – local authorities LAs and other public bodies classified
as colour band “Yellow”
Term deposits – banks and building societies Creditworthiness system colour band
“Green” and above
UK part nationalised banks Creditworthiness system colour band
blue
Banks part nationalised by high credit rated
(sovereign rating) countries – non UK Sovereign rating AA+
Collective Investment Schemes structured as Open Ended Investment Companies (OEICs): -
1. Government Liquidity Funds * MMF rating AAA
2. Money Market Funds (CNAV) * MMF rating AAA
3a. Money Market Funds (LVNAV)
3b. Money Market Funds (VNAV)
4. Ultra-Short Dated Bond Funds with a
credit score of 1.25 * MMF/bond fund rating AAA
5. Ultra-Short Dated Bond Funds with a
credit score of 1.5 * MMF/bond fund rating AAA
6. Bond Funds * bond fund rating AAA
7. Gilt Funds * bond fund rating AAA
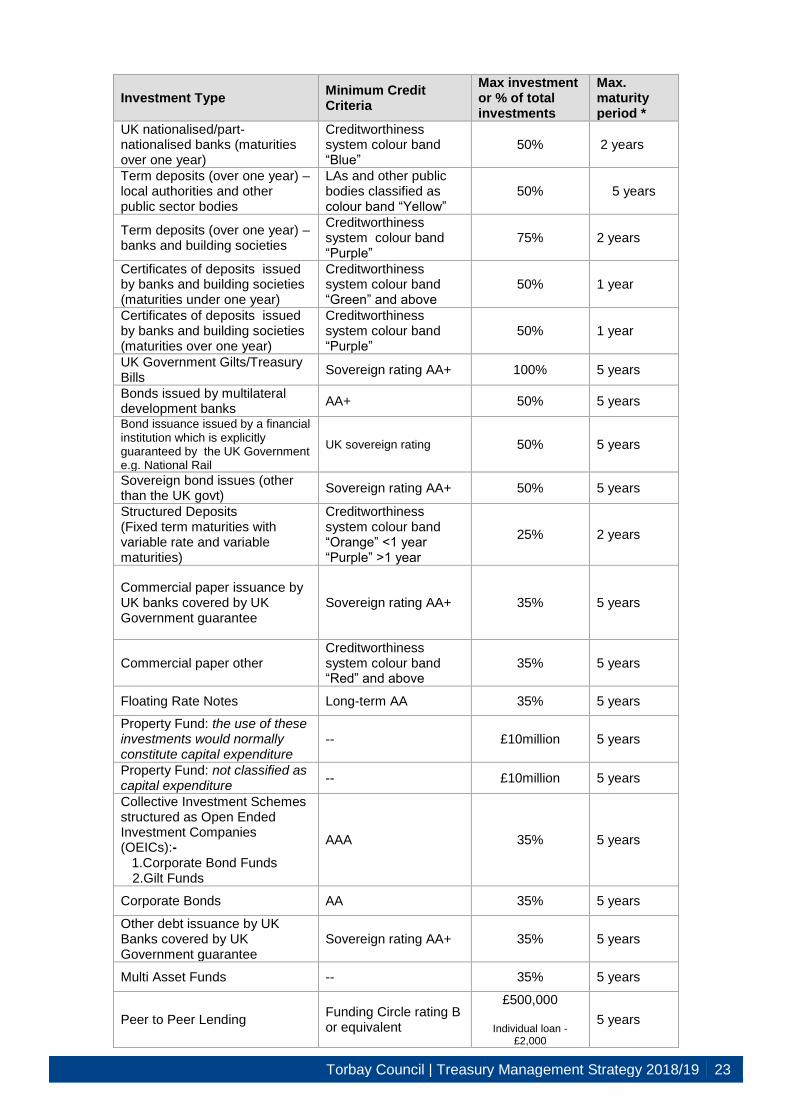
Non-Specified Investments
These are any investments which do not meet the Specified Investment criteria. A variety of investment
instruments will be used, subject to the credit quality of the institution, and depending on the type of
investment made it will fall into one of the above categories.
The maturity limits recomended will not be exceeded. Under the delegated powers the Chief Finance
Officer can set limits that are lower based on the latest economic conditions and credit ratings.
Torbay Council | Treasury Management Strategy 2018/19 23
Investment Type Minimum Credit Criteria
Max investment or % of total investments
Max. maturity period *
UK nationalised/part-nationalised banks (maturities over one year)
Creditworthiness system colour band “Blue”
50% 2 years
Term deposits (over one year) – local authorities and other public sector bodies
LAs and other public bodies classified as colour band “Yellow”
50% 5 years
Term deposits (over one year) – banks and building societies
Creditworthiness system colour band “Purple”
75% 2 years
Certificates of deposits issued by banks and building societies (maturities under one year)
Creditworthiness system colour band “Green” and above
50% 1 year
Certificates of deposits issued by banks and building societies (maturities over one year)
Creditworthiness system colour band “Purple”
50% 1 year
UK Government Gilts/Treasury Bills
Sovereign rating AA+ 100% 5 years
Bonds issued by multilateral development banks
AA+ 50% 5 years
Bond issuance issued by a financial institution which is explicitly guaranteed by the UK Government e.g. National Rail
UK sovereign rating 50% 5 years
Sovereign bond issues (other than the UK govt)
Sovereign rating AA+ 50% 5 years
Structured Deposits (Fixed term maturities with variable rate and variable maturities)
Creditworthiness system colour band “Orange” <1 year “Purple” >1 year
25% 2 years
Commercial paper issuance by UK banks covered by UK Government guarantee
Sovereign rating AA+ 35% 5 years
Commercial paper other Creditworthiness system colour band “Red” and above
35% 5 years
Floating Rate Notes Long-term AA 35% 5 years
Property Fund: the use of these investments would normally constitute capital expenditure
-- £10million 5 years
Property Fund: not classified as capital expenditure
-- £10million 5 years
Collective Investment Schemes structured as Open Ended Investment Companies (OEICs):- 1.Corporate Bond Funds
2.Gilt Funds
AAA 35% 5 years
Corporate Bonds AA 35% 5 years
Other debt issuance by UK Banks covered by UK Government guarantee
Sovereign rating AA+ 35% 5 years
Multi Asset Funds -- 35% 5 years
Peer to Peer Lending Funding Circle rating B or equivalent
£500,000
Individual loan - £2,000
5 years

24 Treasury Management Strategy 2018/19 | Torbay Council