treatment of surface water by autonomous solar-powered
TRANSCRIPT
An-Najah National University Faculty of Graduate Studies
Treatment of Surface Water by Autonomous Solar-Powered Membrane Cells
By Raed Waked Assad Al-Qutub
Supervisor Dr. Abdelrahim Abusafa
Submitted in Partial Fulfillment of the Requirements for the Degree of Master in Clean Energy and Energy Conservation Engineering, Faculty of Graduate Studies, at An-Najah National University, Nablus, Palestine.
2010

iii
DEDICATION
To my father Spirit ..
To my mother, who has raised me to be I am today... .
To my brothers and sister who have support me all the way
since the beginning of my studies ..
To my future wife
To the memory of my dearest friends ..
TO ALL I LOVE
I dedicate this work

iv
ACKNOWLEDGMENT
I would like to take the opportunity to thank all people who spent their time
and shared their knowledge for helping me to complete my thesis with the
best possible result.
To begin with, my special thanks to Dr. Abdelrahim Abusafa, Professor of
chemical engineering, my supervisor, who meticulously and with great care
and attention to detail advised and motivated me to produce the final
product.
My thanks also go to the staff of Clean Energy and Conservation Strategy
Engineering Program in An-Najah National University, especially Dr. Imad
Ibrik, the director of Energy Research Center for his help and advice.
Lastly, but not the least, I would like to thank my mother, for their never-
ending love and support in all my efforts, my brothers and my sister for
their love and support throughout the years, and my friends for there useful
help. To all of you, thank you so much for all support you have given me
during this research.

v
:
TREATMENT OF SURFACE WATER BY AUTONOMOUS SOLAR-POWERED MEMBRANE CELLS
.
Declaration
The work provided in this thesis, unless otherwise referenced, is the
researcher's own work, and has not been submitted elsewhere for any other
degree or qualification.
: Student's name:
: Signature:
: Date:

vi
Abbreviations Air Mass
AM
Alternating Current
AC
Anno Domini
A.D
Annual Fixed Charges
fixedA
Average Concentration Factor
ACF
Capital Cost
CC
Colony Forming Unit
cfu
Current Maximum Power Point
mppI
Direct Current
DC
Electro Dialysis
ED
Fecal Coliform
FC
Kilowatt Hour
kWh
Kirchoff s Current Law
KCL
Microfiltration
MF
Middle East and North Africa Countries
Million Cubic Meter
MENA
MCM
Multieffect Boiling
MEB
Multistage Flash
MSF
Nanofiltration
NF
Nephelometric Turbidity Units
NTU
Open Circuit Voltage
ocV
Operating and Maintenance
O&M
Parts Per Million
PPM
Peak Sun Hours
PSH
Photovoltaic
PV
Reverse Osmosis
RO
Short Circuit Current
scI
Silicon
Si
Standard Test Conditions
STC
Thin film Composite
TFC
Total Dissolved Solids
TDS
Ultrafiltation
UF
United Nation
UN
Vapor Compression
VC
Voltage Maximum Power Point
mpppV
Watt Peak
PW
World Health Organization
WHO

vii
TABLE OF CONTENTS
No. Content Page
Abbreviations vi
Table of Contents vii
List of Tables x
List of Figures xi
Abstract xiii CHAPTER ONE: INTRODUCTION 1 1.1 Scope 2 1.2 Water Treatment Systems and Photovoltaic Power 2 1.3 Energy Storage Alternatives
3 1.4 Water Resources in Palestine Availability and
Consumption 4
1.4.1 Groundwater 4 1.4.2 Springs and Wells 5 1.5 Water and Energy Crisis in Palestine 6 1.6 Water Resources and their Crisis in Nablus, Palestine 8 1.7 Research Aims 11 CHAPTER TWO: WATER TREATMENT METHODS 12 2.1 Needs for Water Treatment 13 2.2 History of Water Treatment 13 2.3 Classification of Water Treatment Processes 14 2.3.1 Distillation Processes 16 2.3.1.1
Vapor Compression Distillation (VC) 16 2.3.1.2
Multistage Flash Distillation (MSF) 19 2.3.1.3
Multieffect Boiling Distillation (MEP) 19 2.3.2 Membrane Processes 19 2.3.2.1
Microfiltration membrane 20 2.3.2.2
Ultrafiltration Membrane 21 2.3.2.3
Nanofiltration Membrane 21 2.3.2.4
Reverse Osmosis (RO) Membrane 31 2.3.2.5
Electro Dialysis (ED) 23 CHAPTER THREE: REVESE OSMOSIS PROCESS 25 3.1 Introduction 26 3.2 Process Description and Terminology 27 3.2.1 Booster (Diaphragm) Pump 27 3.2.2 Pretreatment Filters 28 3.2.3 Membrane Processes Technology 28 3.2.3.1
Spiral-Wound Module 29 3.2.3.2
Hollow Fine Fiber Module 29 3.2.3.3
Tubular Module 31

viii
No. Content Page 3.2.3.4
Plate and Frame Module 32
3.3 Basic Transport Equations in Reverse Osmosis 34 3.3.1 Osmosis Pressure 34 3.3.2 Water Flux 35 3.3.3 Concentration Flux 36 3.3.4 Salt Rejection 37 3.3.5 Recovery 38 3.4 Description of Variables Effects 38 CHAPTER FOUR: SOLAR ENERGY AND PHOTOVOLTAIC CELL SIZING 42
4.1 Solar Radiation 43 4.2 Photovoltaic Module 44 4.2.1 PV Operating Principle 46 4.2.2 Standard Test Conditions and I-V Curve 50 4.2.3 Effect of Solar Radiation on PV Performance 50 4.2.4 Effect of Temperature on PV Performance 52 4.3 Sizing of System Components 53 CHAPTER FIVE: EXPERIMENTAL WORK 56 5 EXPERIMENTAL WORK 57 CHAPTER SIX: RESULTS AND DISCUSSION 63 6.1 Effect of Solar Radiation 64
6.2 Effect of Pump Pressure on the Permeate Water Flow Rate
67
6.3 Effect of Feed Water Temperature on Permeate Flow Rate
70
6.4 Effect of Feed Water Salinity on Flow Rate of Permeate Water
72
6.5 Effect of Recovery on Permeate Water Quality 74 CHAPTER SEVEN: ECONOMIC EVALUATION OF SMALL RO UNIT POWERED BY PV SYSTEM 75
7.1 Cost Analysis 76 7.1.1 Capital Cost 78 7.1.2 Annual Operating Costs 78 7.1.2.1
Fixed Charges 79 7.1.2.2
Operating and Maintenance (O&M) Costs 80 7.1.2.3
Membrane Replacement 80 7.2 Life Cycle Cost 81 CHAPTER EIGHT: CONCLUSIONS AND RECOMENDATIONS 85
8.1 Conclusions 86

ix
No. Content Page 8.2 Recommendations 88
REFERENCES 89
x
LIST OF TABLES
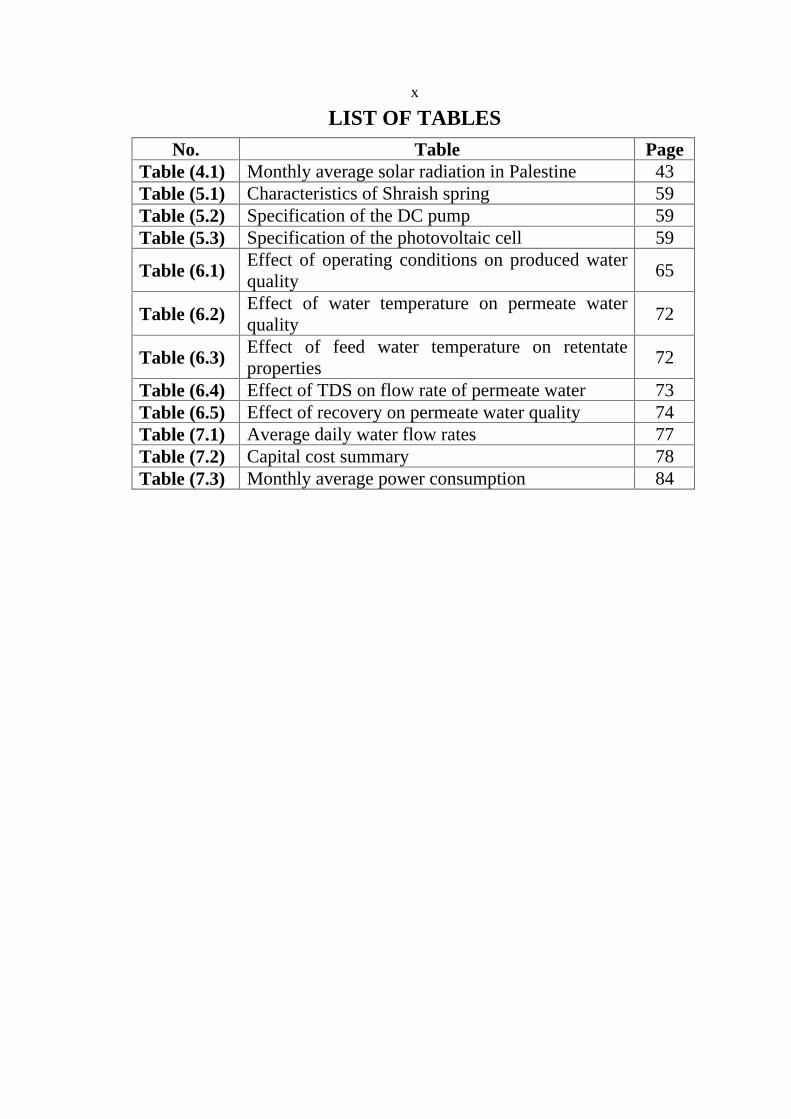
No. Table Page Table (4.1) Monthly average solar radiation in Palestine 43 Table (5.1) Characteristics of Shraish spring 59 Table (5.2) Specification of the DC pump 59 Table (5.3) Specification of the photovoltaic cell 59
Table (6.1) Effect of operating conditions on produced water quality
65
Table (6.2) Effect of water temperature on permeate water quality
72
Table (6.3) Effect of feed water temperature on retentate properties
72
Table (6.4) Effect of TDS on flow rate of permeate water 73 Table (6.5) Effect of recovery on permeate water quality 74 Table (7.1) Average daily water flow rates 77 Table (7.2) Capital cost summary 78 Table (7.3) Monthly average power consumption 84
xi
LIST OF FIGURES
No. Figure Page
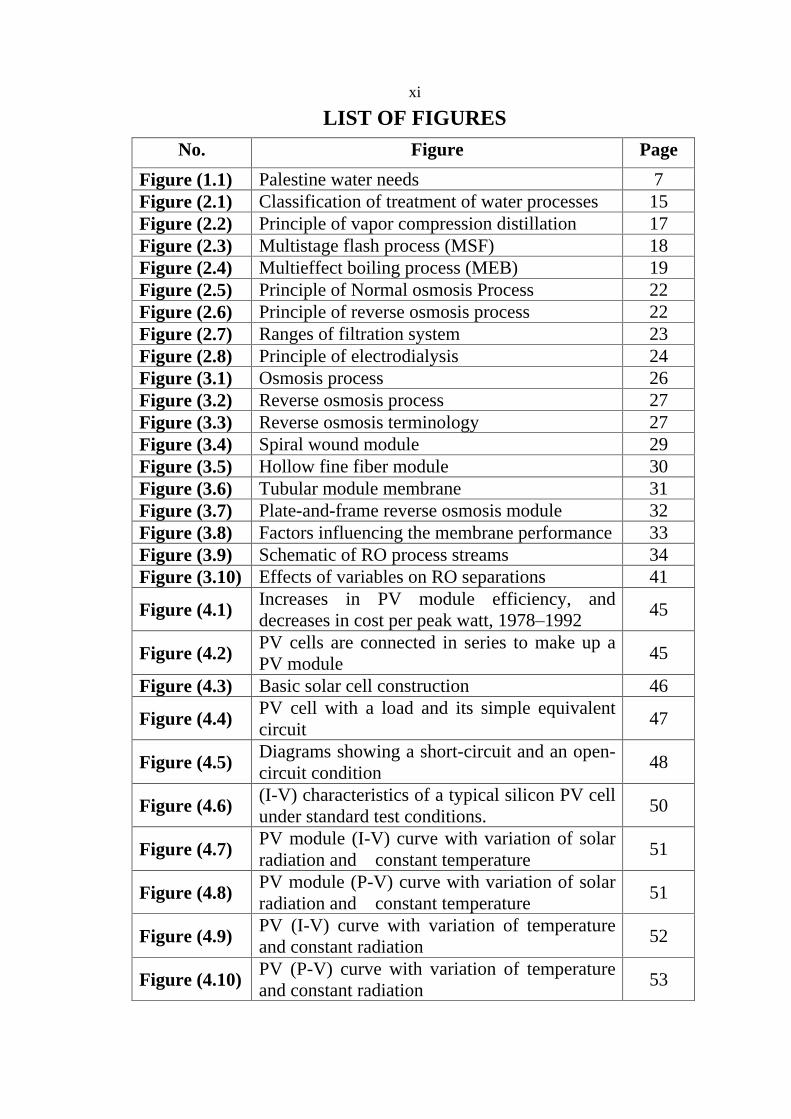
Figure (1.1) Palestine water needs 7 Figure (2.1) Classification of treatment of water processes 15 Figure (2.2) Principle of vapor compression distillation 17 Figure (2.3) Multistage flash process (MSF) 18 Figure (2.4) Multieffect boiling process (MEB) 19 Figure (2.5) Principle of Normal osmosis Process 22 Figure (2.6) Principle of reverse osmosis process 22 Figure (2.7) Ranges of filtration system 23 Figure (2.8) Principle of electrodialysis 24 Figure (3.1) Osmosis process 26 Figure (3.2) Reverse osmosis process 27 Figure (3.3) Reverse osmosis terminology 27 Figure (3.4) Spiral wound module 29 Figure (3.5) Hollow fine fiber module 30 Figure (3.6) Tubular module membrane 31 Figure (3.7) Plate-and-frame reverse osmosis module 32 Figure (3.8) Factors influencing the membrane performance 33 Figure (3.9) Schematic of RO process streams 34 Figure (3.10) Effects of variables on RO separations 41
Figure (4.1) Increases in PV module efficiency, and decreases in cost per peak watt, 1978 1992
45
Figure (4.2) PV cells are connected in series to make up a PV module
45
Figure (4.3) Basic solar cell construction 46
Figure (4.4) PV cell with a load and its simple equivalent circuit
47
Figure (4.5) Diagrams showing a short-circuit and an open-circuit condition
48
Figure (4.6) (I-V) characteristics of a typical silicon PV cell under standard test conditions.
50
Figure (4.7) PV module (I-V) curve with variation of solar radiation and constant temperature
51
Figure (4.8) PV module (P-V) curve with variation of solar radiation and constant temperature
51
Figure (4.9) PV (I-V) curve with variation of temperature and constant radiation
52
Figure (4.10) PV (P-V) curve with variation of temperature and constant radiation
53

xii
No. Figure Page
Figure (5.1) Assembly diagram of the PV-RO system 58
Figure (6.1) Effect of solar radiation on power input to the pump
66
Figure (6.2) Effect of power input to the pump on permeate flowrate
66
Figure (6.3) Relationship between the power input to the pump and pump pressure
67
Figure (6.4) Effect of membrane Pressure on permeate flowrate
68
Figure (6.5) Effect of permeate flowrate on permeate pH 69
Figure (6.6) Effect of flow rate of permeate water on K+
concentration 69
Figure (6.7) Effect of flow rate of permeate water on total dissolved solids
69
Figure (6.8) Effect of flow rate of permeate water on turbidity
70
Figure (6.9) Effect of temperature on water permeate flowrate
71
Figure (6.10) Effect of total dissolved solids (TDS) of feed water on flow rate of permeate water at constant power and feed pressure.
73
Figure (7.1) Cash flow of unite 82

xiii
Treatment of Surface Water by Autonomous Solar-Powered Membrane Cells
By Raed Waked Assad Al-Qutub
Supervisor Dr. Abdelrahim Abusafa
Abstract
In addition to shortage of fresh water resources, Palestine is suffering
from shortages in recoverable commercial energy sources such as crude oil
and natural gas. The limited energy sources in Palestine makes renewable
energy options such as solar power very attractive, especially for remote
areas. This will be extremely important for small-scale applications. Due to
prevailing tough conditions, such as low water quality and shortage in
supplies, there is a large demand for small water treatment units to obtain
drinkable water for life support. In this thesis, an experimental study was
conducted to investigate the potential to develop a small water treatment
unit using photovoltaic powered reverse osmosis system in Palestine. A
testing rig was built, where a reverse osmosis (RO) water treatment system
driven by photovoltaic power is used. The RO unit consists of a five-
micron sediment filter that is made of polypropylene, two active carbon
filters with 1 2 micrometer hole diameter, and one polyamide TFC
membrane. The system is mechanically powered, One PV arrays panel
(55 pW ) which tilted a 45 to the south directly coupling to a DC motor
(Diaphragm), that can give pressure up to 1.2 bar and average flow rate
34.68 L/d by using water from Shraish spring located in Nablus city in
West Bank .
xiv
The system was operated at variable flow, enabling it to make
efficient use of the naturally varying solar resource, with no need of
batteries. Different operating conditions of solar radiation, pump pressure,
feed water temperature, total dissolved solid, trans-membrane pressure, and
flow rates were studied. In order to study the affect on permeate flow rate
and water quality.
It was found that increasing the solar radiation, pump pressure, and
feed water temperature has enhanced the permeate flux. Increasing the TDS
has reduced the permeate flux, and the water quality was within the
international standard to be safe drinking water, on the other hand, A
pronounced effect on the permeate water quality occurred when the
recovery increased, the fecal was observed for the first time when the
recovery changed .
Based on the calculations, the estimated cost of water produced by
the system is $17/m³.The Price of water produced from a solar-powered
system for water treatment can not be economically viable, only in remote
areas and far from conventional energy sources or during catastrophes
where drinkable water is not available.

1
CHAPTER ONE
INTRODUCTION
2
Chapter One
Introduction
1.1 Scope
Water resources are essential for satisfying human needs, protecting
health, and ensuring food production, energy and the restoration of
ecosystems, as well as for social and economic development and for
sustainable development [1]. However, according to UN World Water
Development Report in 2003, it has been estimated that two billion people
are affected by water shortages in over forty countries, and 1.1 billion do
not have sufficient drinking water [2]. There is a great and urgent need to
supply environmentally sound technology for the provision of drinking
water.
This chapter describes the water deficit and scarcity in many areas of
the world, such as the Middle East and North Africa countries (MENA) and
the need for water treatment, which provides the motivation for this
research.
1.2 Water Treatment Systems and Photovoltaic Power
A water treatment system needs a source of power to operate. In
general, AC powered system is economic and takes minimum maintenance
when AC power is available from the nearby power grid. However, in
many rural areas, water sources are spread over many miles of land and
power lines are scarce. Installation of a new transmission line and a
transformer to the location is often prohibitively expensive.
3
Today, many stand-alone type water treatment systems use diesel
engines. However, they have some major disadvantages, such as: they
require frequent site visits for refueling and maintenance, and furthermore
diesel fuel is often expensive and not readily available in rural areas of
many developing countries.
The consumption of fossil fuels also has an environmental impact, in
particular the release of carbon dioxide (CO 2 ) into the atmosphere.
CO 2 emissions can be greatly reduced through the application of renewable
energy technologies, which are already cost competitive with fossil fuels in
many situations. Good examples include large-scale grid-connected wind
turbines, solar water heating, and off-grid stand-alone PV systems [3]. The
use of renewable energy for water treatment systems is, therefore, a very
attractive proposition.
1.3 Energy Storage Alternatives
Needless to say, photovoltaic are able to produce electricity only
when the sunlight is available, therefore stand-alone systems obviously
need some sort of backup energy storage which makes them available
through the night or bad weather conditions.
Among many possible storage technologies, the lead-acid battery
continues to be the workhorse of many PV systems because it is relatively
inexpensive and widely available. In addition to energy storage, the battery
also has ability to provide surges of current that are much higher than the
4
instantaneous current available from the array, as well as the inherent and
automatic property controlling the output voltage of the array so that loads
receive voltages within their own range of acceptability [4].
The type of lead-acid battery suitable for PV systems is a deep-cycle
battery [5], which is different from one used for automobiles, and it is more
expensive and not widely available.
Battery lifetime in PV systems is typically three to eight years, but
this reduces to typically two to six years in hot climate since high ambient
temperature dramatically increases the rate of internal corrosion. Batteries
also require regular maintenance and will degrade very rapidly if the
electrolyte is not topped up and the charge is not maintained. They reduce
the efficiency of the overall system due to power loss during charge and
discharge. Typical battery efficiency is around 85% but could go below
75% in hot climate [3]. From all those reasons, experienced PV system
designers avoid batteries whenever possible.
1.4 Water Resources in Palestine Availability and Consumption
The Israelis and the Palestinians share two interrelated water
systems:
1.4.1Groundwater
The Mountain Aquifer traverses the border between the West Bank
and Israel, while the surface system - the Jordan Basin - also belongs to
Jordan, Syria and Lebanon. The Mountain Aquifer extends for over 130

5
km, from Mount Carmel in the north to the Negev in the south, and is 35
km wide, from the Jordan Valley in the east to the Mediterranean Sea in the
west [6].
It is typically divided into three sub-aquifers. The primary one, due
to the high quality of its water, is the Western Aquifer. Most of its recharge
area lies in the West Bank, while the entire storage area lies in Israel and
95% of its water is used by Israel.
The second one, the Northern Aquifer, has both its recharge and
storage areas essentially located within the West Bank. However, Israel
extracts about 70% of the water [6].
Finally, the Eastern Aquifer, which is entirely within the West Bank,
has 37% of its water consumed by Israel - mostly by settlers [6].
1.4.2 Springs and Wells
The geographical distribution of springs indicates that 90% of
springs are located in north and middle of Palestine. In addition, plenty of
rich springs of fresh water are found in the north, lower numbers of weak
springs are found in the middle, and rare springs with saline water are
found in the south.
The number of measurable springs in the West Bank is 146 and the
number of non measurable springs, hardly reached or low discharge is 163.
6
The average annual flow is around 100 MCM. The amount of fresh
water is 55 MCM, used mainly for irrigation. The rest (45MCM) is
brackish water [7].
There are 561 wells; 519 Palestinian wells and 42 wells under Israeli
control. Out of Palestinian wells, there are 18 new wells and 148 wells out
of order. Out of the working wells, 308 wells are used for irrigation
(55.4%) and the rest (44.6 %) are used for domestic purposes [10].
Regarding the quality of water, in general, the concentration of
chloride ions in water for all wells is acceptable according to the
specification proposed by WHO, which should be less than 250 mg/l, while
only 70% of wells producing water with acceptable concentration of
Nitrate (less than 50 mg/l) according to the specification proposed by WHO
[10].
1.5 Water and Energy Crisis in Palestine
Palestine is dry lands; it does not contain a lot of water sources
which is not enough with ever increasing population over the years as
shown in figure 1.1 and with the presence of the Israeli occupation and
drained of water and energy resources over the years of occupation, and as
is known the Palestinians do not have control the sources of water, in
particular springs, which is considered a key determinant of economic and
social development, as it is not available for this country.
The geological factor plays a significant role in natural water
pollution. The domestic and industrial wastewater and the use of fertilizers

7
and pesticides in agricultural activities could cause the pollution of water.
In regard to the water quality issue, the Palestinians are facing two major
problems: the high salinity and the high concentration rate of nitrate [7].
The major causes for salinization are over-pumping of the wells,
seawater intrusion and geological factors.
The main sources of nitrate pollution are fertilizers, wastewater and
cesspits. The high nitrate concentration in drinking water affects infants
and causes Blue Baby Syndrome.
Many of the surface water in Palestine suffer from Fecal, K+ and not
suitable for drinking.
Palestine suffers from continuous water shortage, whether for drinking
or irrigation purposes.
Various alternatives are being considered to alleviate this problem
including water treatment.
Figure (1.1): Palestine water needs

8
The use of solar energy for water treatment has been the subject of
this research and many experiments on this issue have been conducted.
Because Palestine possesses a high potential for photovoltaic (PV)
applications due to the high average annual daily solar radiation, which
exceeds 5 kWh/m².day and the Israeli occupations, which has stifled
development in all fields related to infrastructure, is another factor that
makes PV applications viable.
In addition, Palestine lacks conventional energy resources such as oil
and gas, and therefore must import all its energy from Israel at a relatively
high cost. Consequently, utilization of PV technologies for treatment of
surface water would save hard currency and preserve the environment.
1.6 Water Resources and their Crisis in Nablus, Palestine
a) Water Resources in Nablus
The main sources of water in Nablus district are surface and
groundwater:
Surface water
There are 2 sources of surface water in Nablus governorate these are
flood water and Jordan River bordering, Bardala, Ein El Bayda, Fasayil and
Jiftlik. The source of floods is rainfall on Nablus highlands where runoff
occurred through the main streams either to the east or to the west. The
amounts of floods were not exactly measured in the area. Before 1967, the
9
farmers of Bardala and Ein El Bayda were using Jordan River to irrigate
their farms [8].
Springs
There are 48 springs with a discharge flow exceeding 0.1 Liter/sec,
as measured by the West Bank Water Department of which 29 springs are
measured and observed on a monthly basis [8].
There are five drinking water springs utilized by the Nablus
municipality:
1. Dafna Spring
2. Ra s Al Ain spring
3. Ayn al Asal spring.
4. Al Qaryon spring.
5. Bayt Al Ma Spring.
Wells
There are 79 Palestinian wells in Nablus governorate used for
different purposes, (ARIJ Database), including 4 municipal wells used
domestic purposes and 75 Palestinian privately wells which are used for
irrigation purposes [8].
As for the drinking water artesian wells operated by the municipality
they are:
10
1. Odala well
2. Al Badhan well
3. Al Far a well
4. Deir Sharaf well
b) Water Crisis in Nablus
The water quality from the wells and springs of the northern Jordan
valley of Nablus/Tubas area, are not well suitable for all of the crops
planted in the area. Tests of the special wells and springs used for domestic
purposes show good water quality with respect to drinking standards.
However, the water quality drops from the west to the east of the area.
The Badan and Fara spring systems are of good water quality in the
upstream areas, but the downstream at the conjunction between wadi El
Fara and wadi El Badan, the water is mixed with the untreated wastewater
from the sewerage of Nablus city, thus subjecting the water stream to
pollution and the degree of contamination based on fecal coliforms was
64.4% in rain fed cisterns and 56.8% in the springs [8].
Another reason due to population growth following the improvement
of health and social conditions and the enlargement of city limits to include
the refugee camps of Blata and Asker and the town of Rafidia, the
available water resources did not meet the population needs. These realities

11
prompted Nablus City to explore new resources that would satisfy the
increasing needs [9].
1.7 Research Aims
This research investigates the following:
1. Quantities and problems of contaminated water and water sources in
Palestine.
2. Water treatment methods and the energy consumption.
3. Application of solar energy in springs and underground water
treatment.
4. Building an integrated system consisting of suitable membrane that
can be powered by solar energy.
5. Determination of the quality of surface water treatment by
autonomous solar-powered membrane cells under Palestinian weather
and environmental conditions.
12
CHAPTER TWO
WATER TREATMENT METHODS
13
Chapter Two
Water Treatment Methods
2. Water Treatment Processes
This chapter introduces treatment of surface water processes starting
with the history of treatment and its needs and moving on to the
classifications of treatment of surface water processes.
2.1 Needs for Water Treatment
Water is an important resource for use of mankind and it is a
resource for Life.It is important for agricultural and industrial growth, as
well as for supporting growing populations who require a safe drinking
water supply.
Natural resources cannot satisfy the growing demand for water with
industrial development, together with the increasing worldwide demand for
supplies of safe drinking water.
This has forced mankind to search for another source of water. In
addition, the rapid reduction of subterranean aquifers and the increasing
salinity of these non-renewable sources will continue to exacerbate the
international water shortage problems in many areas of the world.
2.2 History of Water Treatment
Processes of water treatment has been practiced in the form of
distillation process for over 2000 years, it is not until the eighteen century

14
A.D, for people to recognize that the distillation process could be enhanced
by cooling the condensing surface.
In the eighteenth century A.D, Jaber Ibn Hayyan an Arabic scientist
wrote about the foundations of the treatment process using distillation.
The thermal desalination process for water distillation was the
technology employed in the first major treatment plants in the 1950s which
were predominantly in the Middle East region.
Membrane technologies were developed in the 1960s and 1970s and
by the late 1980s, reverse Osmosis desalination technology made up 40%
of desalination plants worldwide. This has now increased to levels
approaching 60% [13].
Large improvements in membranes have caused the increased use of
reverse osmosis, which have led to greater efficiencies and reduced energy
consumption. Such advances have also resulted in electro dialysis now
being significantly more expensive than reverse osmosis technology, By
contrast, the distillation method uses high energy consumption to heat the
water. This major drawback means thermal plants now have higher capital
and operating costs than reverse osmosis technology.
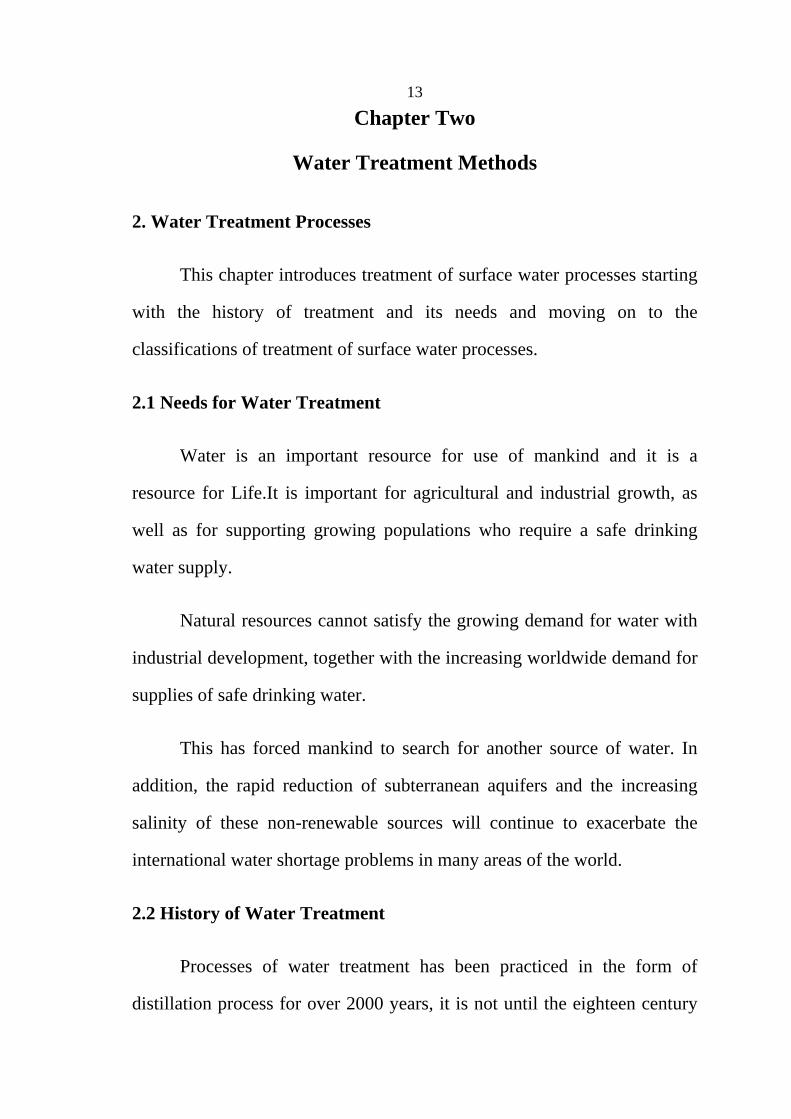
2.3 Classification of Water Treatment Processes
Many methods have been proposed for water treatment processes, as
can be seen the major processes in figure 2.1,
15
1. Processes in which treatment taking place involves phase change.
Multistage flash (MSF).
Multieffect boiling (MEB).
Vapor compression (VC).
2. Processes in which treatment takes place without any phase change.
These include
The following two main methods:
Reverse Osmosis (RO).
Electrodialysis (ED).
Figure (2.1): Classification of treatment of water processes
Distillation Membrane
Reverse Osmosis (RO)
Electrodialysis (ED)
Vapor Compression (VC)
Mutistage Flash (MSF
Multieffect flash (ME)
Treatment Processes

16
2.3.1 Distillation Processes
2.3.1.1Vapor Compression Distillation (VC)
It is a system that treats surface water. The System combines the
benefits of distillation with those of vapor compression to greatly lower the
cost of distillation for removal of water or concentration of other
ingredients. It can be used for a broad range of applications and provides
substantial economic and operational benefits to the user. Depending on
local energy cost and the volume of liquids being processed. Vapor
Compression is a prepackaged closed loop distillation system designed to
treat a wide variety of water and process water streams through the use of
advanced vapor compression technology.
The Vapor Compression Distillation process as follows:
1. The water entering the system is preheated, and gross solids removed.
2. The water is circulated through a specially designed plate and frame
heat exchanger where the water is boiled into vapor. A mixture of water
and vapor exit the heat exchanger and enter the separator.
3. The compressor draws the vapor from the separator and compresses it to
about 0.35 bar, thereby increasing its temperature. The superheated
vapor is then pumped into the condenser side of the heat exchanger
where it is used to boil additional water in the evaporator side. As the
hot vapor releases its latent heat, it condenses into distilled water, which
is then discharged from the system.

17
4. As additional water is evaporated during the process, the remaining
water becomes more concentrated. When the desired level of
concentrate is reached, the concentrate is discharged, and more feed
stock is added automatically to the system. The system treats industrial
process and waste-water streams. It combines the benefits of distillation
with those of vapor compression; the system has a wide range of
applications and provides substantial economic and operational benefits
to the user. Figure 2.2 illustrates the principle of vapor compression
distillation.
The vapor-compression process consumes a small amount of energy
and has a low operating cost. However, its capacity is limited, and the
quality of water produced and maintenance costs do not match those by
other distillation processes [11].
Figure (2.2): Principle of vapor compression distillation
18
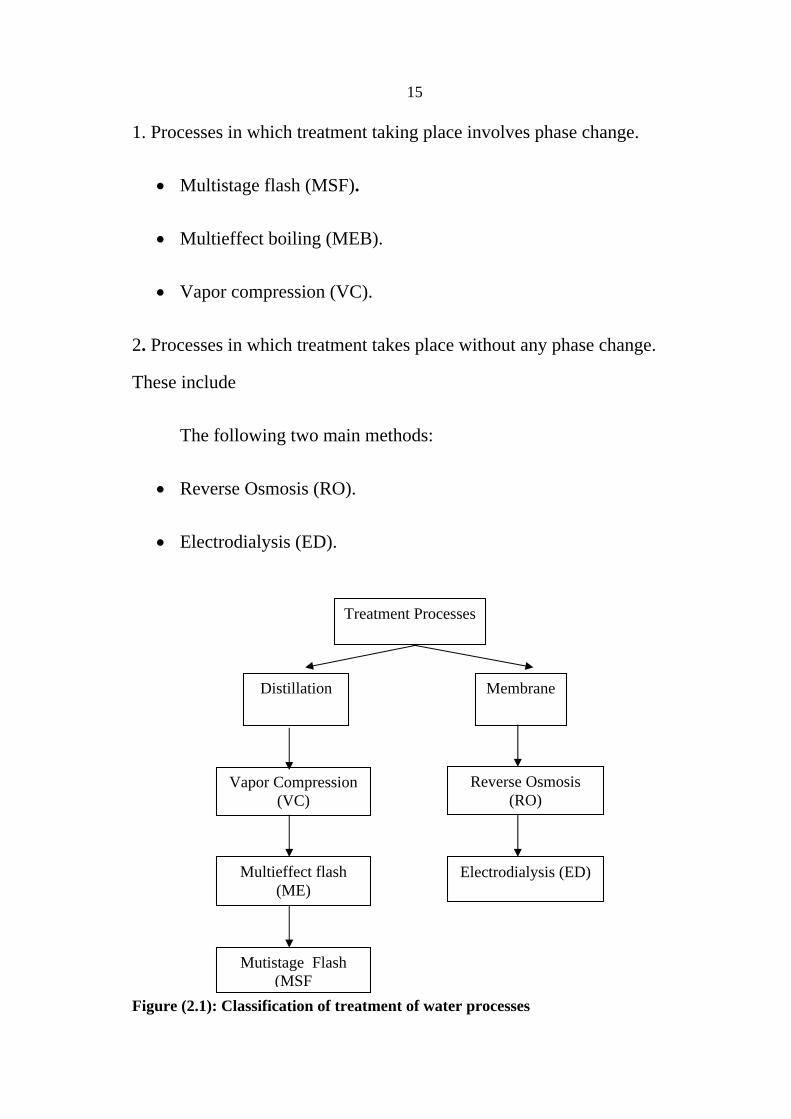
2.3.1.2 Multistage Flash Distillation (MSF)
In Multi Stage Flash evaporation, the water is heated and
evaporated. The pure water is then obtained by condensing the vapour.
The water is heated in a vessel both the temperature and pressure
increase, the heated water passes to another chamber at a lower pressure
which cause vapour to be formed, the vapour is led off and condensed to
pure water using the cold sea water which feeds the first heating stage.
The concentrated brine is then passed to a second chamber at a still
lower pressure and more water evaporates and the vapour is condensed as
before.
The process is repeated through a series of vessels or chambers until
atmospheric pressure is reached. Multistage flash evaporation is considered
to be the most reliable, and is probably the most widely used. The principle
is illustrated in Fig 2.3 [12].
Figure (2.3): Multistage flash process (MSF)
19
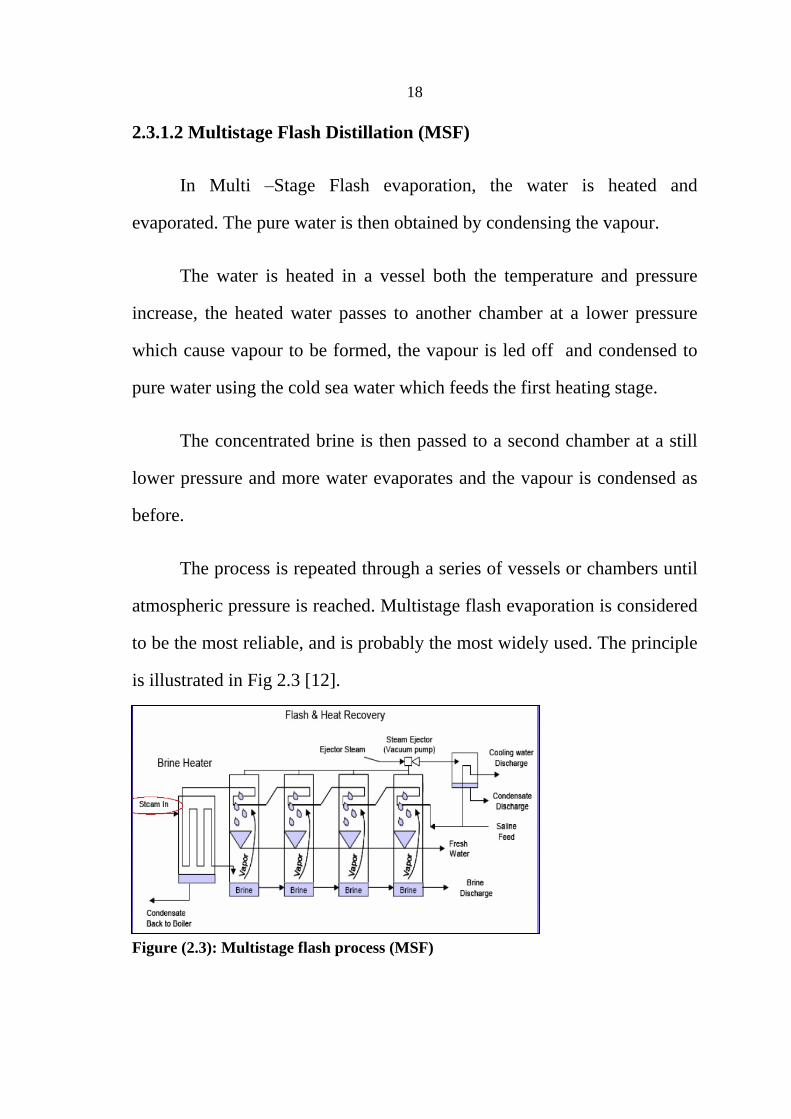
2.3.1.3 Multieffect Boiling Distillation (MEB)
Multieffect distillation (MEB) is in principle similar to multi stage
flash evaporation, except that steam is used to heat up the water in the first
stage and the resulting vapour is used in subsequent stages to evaporate the
water, and the water is used to cool and condense the vapour in each
successive stage to that the temperature gradually falls across each stage of
the process. The principle is illustrated in figure 2.4[12].
Figure (2.4): Multi effect boiling process (MEB)
2.3.2 Membrane Processes
The membrane performance in terms of the fluxes and selectivity are
mainly dependent on the nature of the elements contained in the two phases
and the driving forces applied.
This processes use relatively permeable membrane to move either
water or salt to induce two zones of differing concentrations to produce
fresh water.
20
The separation takes place at ambient temperature, without phase
change, which offers energetic advantages over distillation, and the
separation takes place without the accumulation of products inside the
membranes. This separation does not require the addition of chemical
additives.
Membrane process types
The main membrane processes used in water treatment are:
1. Microfiltration (MF).
2. Ultrafiltration (UF).
3. Nanofiltration (NF).
4. Reverse Osmosis (RO).
5. Electrodialysis (ED).
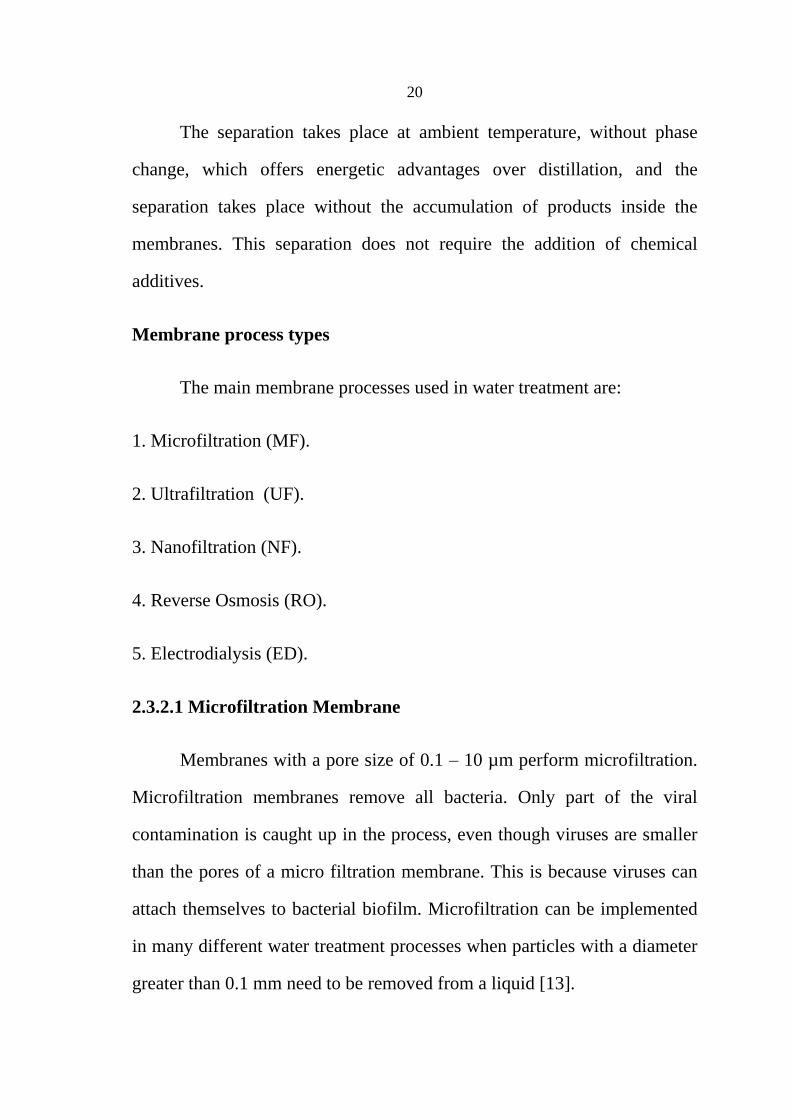
2.3.2.1 Microfiltration Membrane
Membranes with a pore size of 0.1
10 µm perform microfiltration.
Microfiltration membranes remove all bacteria. Only part of the viral
contamination is caught up in the process, even though viruses are smaller
than the pores of a micro filtration membrane. This is because viruses can
attach themselves to bacterial biofilm. Microfiltration can be implemented
in many different water treatment processes when particles with a diameter
greater than 0.1 mm need to be removed from a liquid [13].

21
2.3.2.2 Ultrafiltration Membrane
The pores of ultrafiltration membranes can remove particles of 0.001
0.1 µm from fluids. Ultrafiltration is a selective fractionation process
utilizing pressures up to 145 psi (10 bars). It concentrates suspended solids
and solutes of molecular weight greater than 1,000. The permeate contains
low-molecular-weight organic solutes and salts. UF is widely used in the
fractionation of milk and whey, and also finds application in protein
fractionation [13].
2.3.2.3 Nanofiltration Membrane
Nanofiltration is a special process selected when RO and UF are not
the ideal choice for separation. It is use partially permeable membranes to
preferentially separate different fluids or ions, and will remove particles
from approximately 0.0005 to 0.005 microns in size. Nanofiltration
membrane can perform separation applications that are not otherwise
economically feasible, such as demineralization, color removal, and
desalination. In concentration of organic solutes, suspended solids, and
polyvalent ions, the permeate contains monovalent ions and low-molecular-
weight organic solutions like alcohol[14].
2.3.2.4 Reverse Osmosis (RO) Membrane
Osmosis is a physical force. It is the natural tendency of water with a
low concentration of dissolved particles to move across a semi-permeable
membrane to an area of water with a high concentration of dissolved
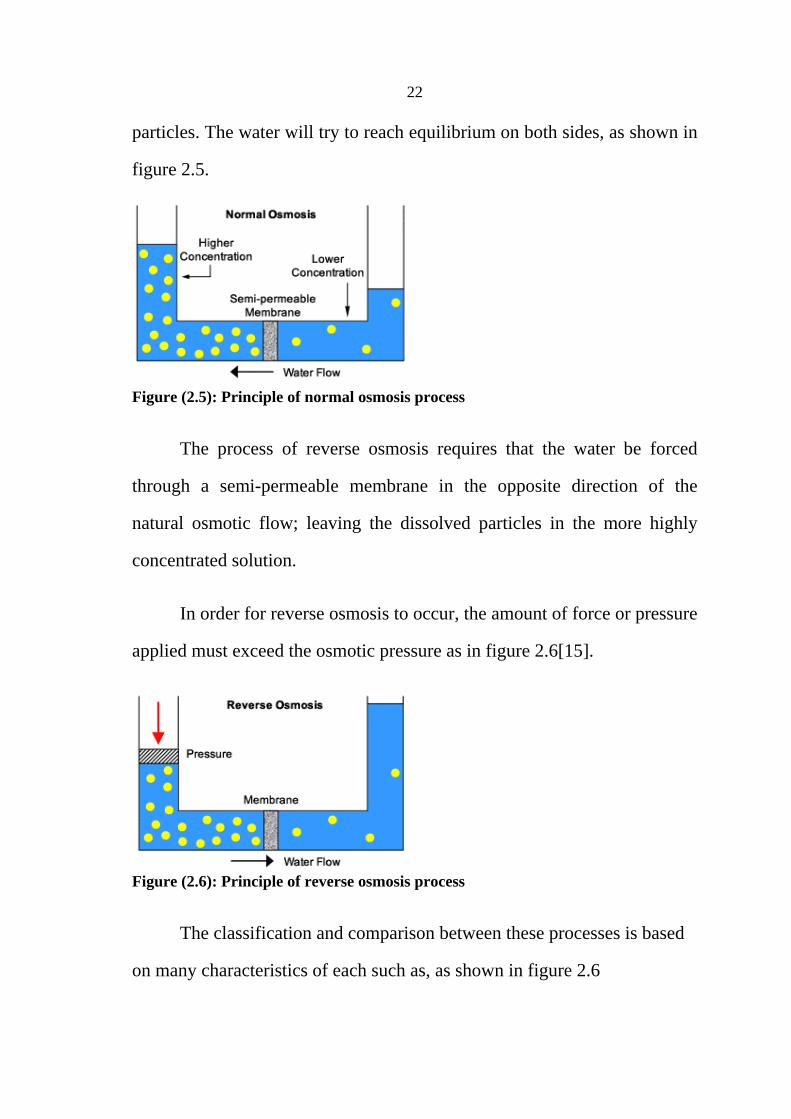
22
particles. The water will try to reach equilibrium on both sides, as shown in
figure 2.5.
Figure (2.5): Principle of normal osmosis process
The process of reverse osmosis requires that the water be forced
through a semi-permeable membrane in the opposite direction of the
natural osmotic flow; leaving the dissolved particles in the more highly
concentrated solution.
In order for reverse osmosis to occur, the amount of force or pressure
applied must exceed the osmotic pressure as in figure 2.6[15].
Figure (2.6): Principle of reverse osmosis process
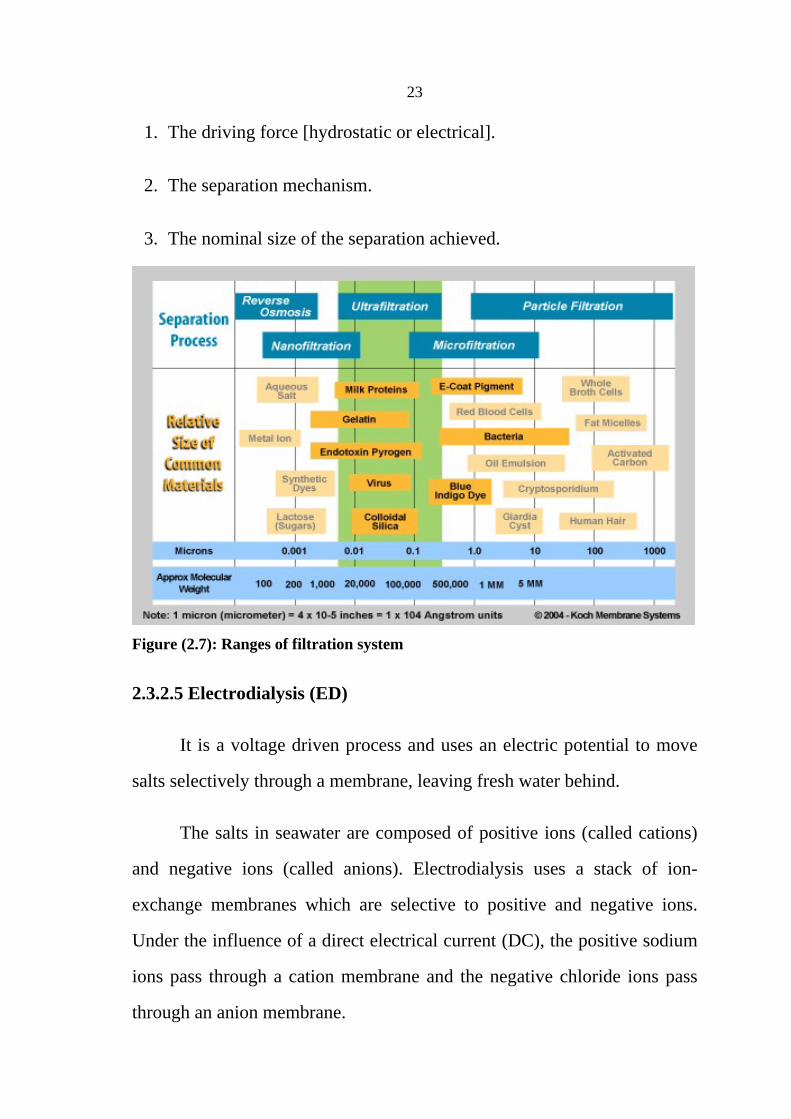
The classification and comparison between these processes is based
on many characteristics of each such as, as shown in figure 2.6
23
1. The driving force [hydrostatic or electrical].
2. The separation mechanism.
3. The nominal size of the separation achieved.
Figure (2.7): Ranges of filtration system
2.3.2.5 Electrodialysis (ED)
It is a voltage driven process and uses an electric potential to move
salts selectively through a membrane, leaving fresh water behind.
The salts in seawater are composed of positive ions (called cations)
and negative ions (called anions). Electrodialysis uses a stack of ion-
exchange membranes which are selective to positive and negative ions.
Under the influence of a direct electrical current (DC), the positive sodium
ions pass through a cation membrane and the negative chloride ions pass
through an anion membrane.

24
The incoming saline water is thus converted into two streams, one of
concentrated brine and one of desalinated (fresh water) [16].
This illustrated in Figure 2.7 Industrial electrodialysis plants consist
of stacks of hundreds of membranes.
Figure (2.8): Principle of electrodialysis

25
CHAPTER THREE
REVERSE OSMOSIS PROCESS

26
Chapter Three
Reverse Osmosis Process
3.1 Introduction
To understand how reverse osmosis purifies water; you must first
understand the process of osmosis.
a) Principles of Osmosis
Osmosis is the process in which water moves from a higher
concentration to a lower concentration. A semi permeable membrane has
nothing to do with the definition of osmosis. A membrane is not needed to
actually do osmosis but osmosis can occur in the presence of a membrane
as shown in figure 3.1.
Figure (3.1): Osmosis process
b) Principle of Reverse Osmosis
The process of reverse osmosis requires that the water be forced
through a semi-permeable membrane in the opposite direction of the
natural osmotic flow; leaving the dissolved particles in the more highly

27
concentrated solution. In order for reverse osmosis to occur, the amount of
force or pressure applied must exceed the osmotic pressure as shown in
figure 3.2.
Figure (3.2): Reverse osmosis process
3.2 Process Description and Terminology
In practice, reverse osmosis is applied as a cross flow filtration
process. The simplified process is shown in Figure 3.3.
Figure (3.3): Reverse osmosis terminology
3.2.1 Booster (Diaphragm) Pump
The pump supplies the pressure needed to push water through the
membrane, even as the membrane rejects the passage of salt through it.
The pressure required depends on the concentration and temperature of the
feed water. Osmotic pressure increases with increasing concentration, so

28
that the operating pressure must exceed the osmotic pressure corresponding
to the concentration of the rejected brine at the membrane outlet.
3.2.2 Pretreatment Filters
The Feed water was treated from replaceable pre filter sediment-
carbon cartridges.
5 Micron filter, removes sediment, clay, silt and particulate matter to 5
micron range.
Carbon filter removes chlorine, harmful chemicals, synthetic detergents,
as well as other organic contaminants.
Compacted carbon block, where a combination of mechanical filtration
and physical/chemical adsorption takes place to reduce or eliminate a
wide range of contaminants.
3.2.3 Membrane Processes Technology
Reverse Osmosis Membrane Modules are commercially available in
four configurations:
1. Spiral-Wound Module.
2. Hollow Fine Fiber Module.
3. Tubular Module.
4. Plate-and-Frame Module.

29
3.2.3.1 Spiral-Wound Module
It consists of two or more leaves (envelopes). Each leaf has two flat
sheets of semi permeable membrane separated and supported by a porous
backing material as shown in figure 3.4.
It is sealed on three sides and the fourth open side is attached to a
perforated pipe.
A flexible feed spacer is added and the flat sheets are rolled into tight
circular configuration.
The term spiral is derived from the fact that the flow in the rolled up
arrangement of membranes and support sheets follows a spiral flow pattern.
The feed water can be applied to the inside of the fiber (inside out flow), or
the outside of the fiber (outside-in flow) [17].
Figure (3.4): Spiral wound module
3.2.3.2 Hollow Fine Fiber Module
In hollow fiber modules hundreds to thousands of hollow fibers are
bundled together to form a module. The entire assembly is inserted into a
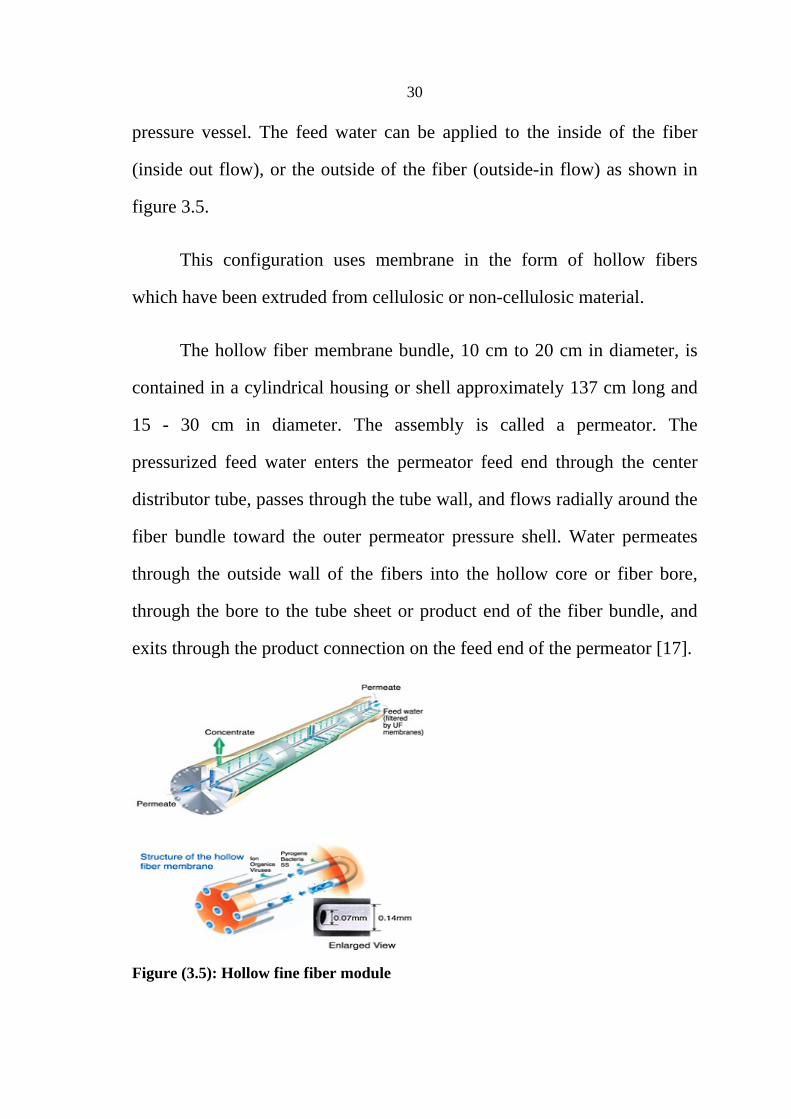
30
pressure vessel. The feed water can be applied to the inside of the fiber
(inside out flow), or the outside of the fiber (outside-in flow) as shown in
figure 3.5.
This configuration uses membrane in the form of hollow fibers
which have been extruded from cellulosic or non-cellulosic material.
The hollow fiber membrane bundle, 10 cm to 20 cm in diameter, is
contained in a cylindrical housing or shell approximately 137 cm long and
15 - 30 cm in diameter. The assembly is called a permeator. The
pressurized feed water enters the permeator feed end through the center
distributor tube, passes through the tube wall, and flows radially around the
fiber bundle toward the outer permeator pressure shell. Water permeates
through the outside wall of the fibers into the hollow core or fiber bore,
through the bore to the tube sheet or product end of the fiber bundle, and
exits through the product connection on the feed end of the permeator [17].
Figure (3.5): Hollow fine fiber module
31
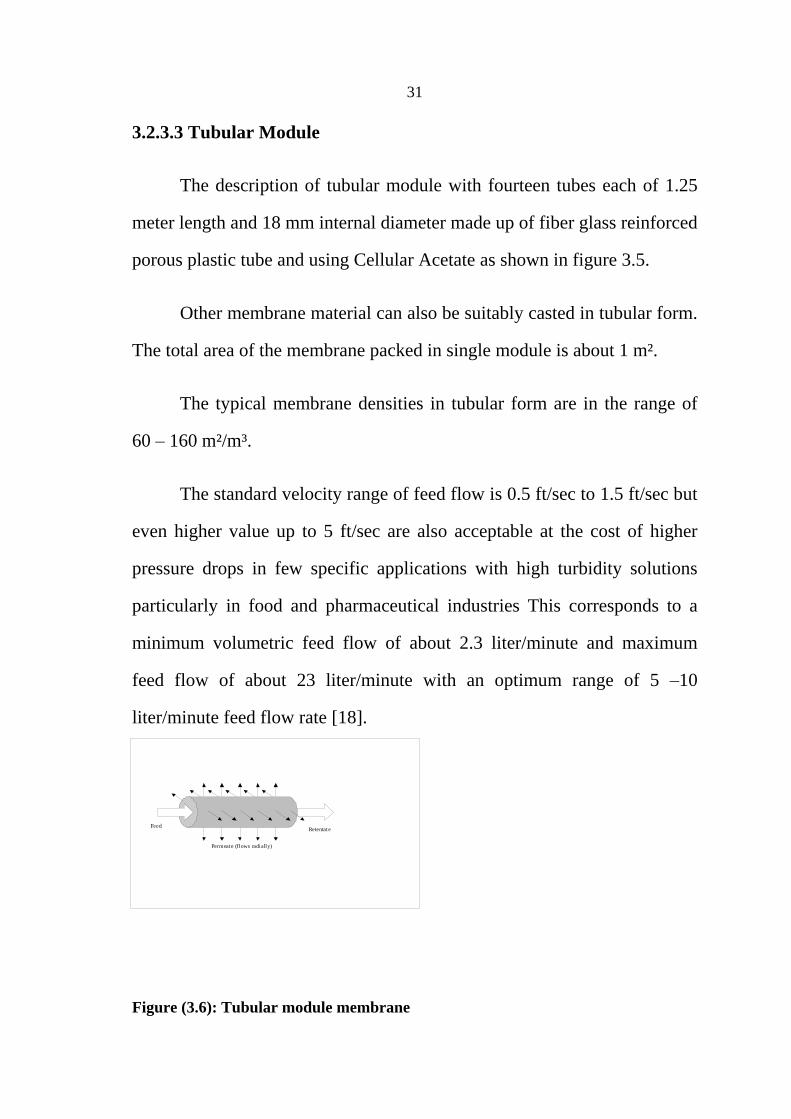
3.2.3.3 Tubular Module
The description of tubular module with fourteen tubes each of 1.25
meter length and 18 mm internal diameter made up of fiber glass reinforced
porous plastic tube and using Cellular Acetate as shown in figure 3.5.
Other membrane material can also be suitably casted in tubular form.
The total area of the membrane packed in single module is about 1 m².
The typical membrane densities in tubular form are in the range of
60
160 m²/m³.
The standard velocity range of feed flow is 0.5 ft/sec to 1.5 ft/sec but
even higher value up to 5 ft/sec are also acceptable at the cost of higher
pressure drops in few specific applications with high turbidity solutions
particularly in food and pharmaceutical industries This corresponds to a
minimum volumetric feed flow of about 2.3 liter/minute and maximum
feed flow of about 23 liter/minute with an optimum range of 5 10
liter/minute feed flow rate [18].
Figure (3.6): Tubular module membrane
FeedRetentate
Permeate (flows radially)
32
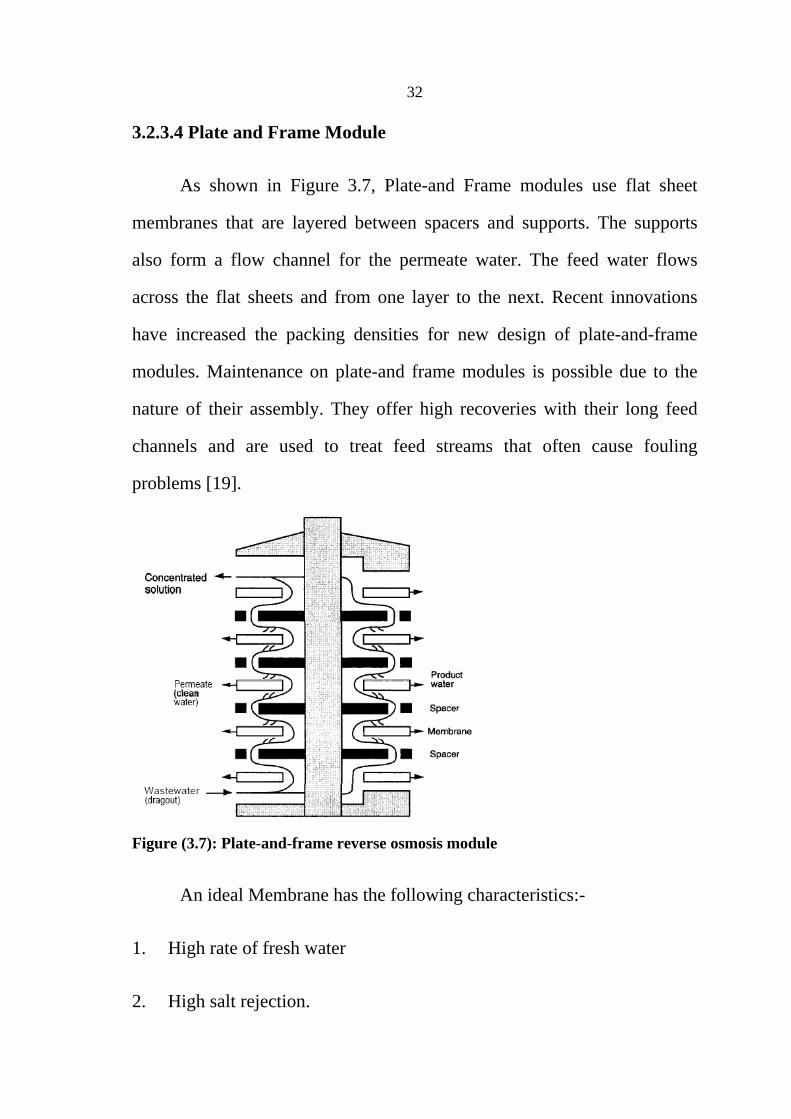
3.2.3.4 Plate and Frame Module
As shown in Figure 3.7, Plate-and Frame modules use flat sheet
membranes that are layered between spacers and supports. The supports
also form a flow channel for the permeate water. The feed water flows
across the flat sheets and from one layer to the next. Recent innovations
have increased the packing densities for new design of plate-and-frame
modules. Maintenance on plate-and frame modules is possible due to the
nature of their assembly. They offer high recoveries with their long feed
channels and are used to treat feed streams that often cause fouling
problems [19].
Figure (3.7): Plate-and-frame reverse osmosis module
An ideal Membrane has the following characteristics:-
1. High rate of fresh water
2. High salt rejection.
33
3. Resistant to high temperature.
4. Resist the presence of excess chlorine less part per million.
5. Resistant to all kind of fouling (inorganic, organic, colloidal, and
microbiological Fouling).
6. It is not sensitive to attack bacteria.
7. It is not sensitive to the possibility of collapse with the high
temperature and lack of discipline pH.
8. Chemically, physically, and thermally stable in saline water.
9. Long and reliable life.
10. Inexpensive.
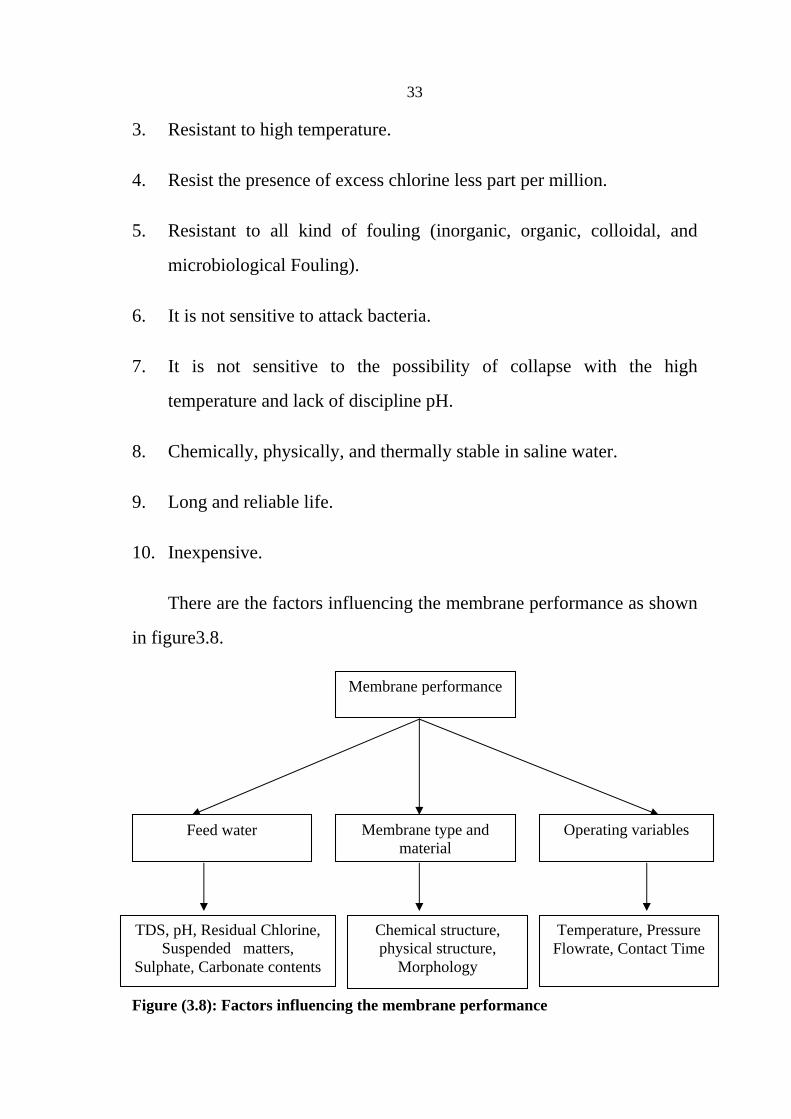
There are the factors influencing the membrane performance as shown
in figure3.8.
Figure (3.8): Factors influencing the membrane performance
Membrane performance
Operating variables
Membrane type and material
Feed water
TDS, pH, Residual Chlorine, Suspended matters,
Sulphate, Carbonate contents
Chemical structure, physical structure,
Morphology
Temperature, Pressure Flowrate, Contact Time
34
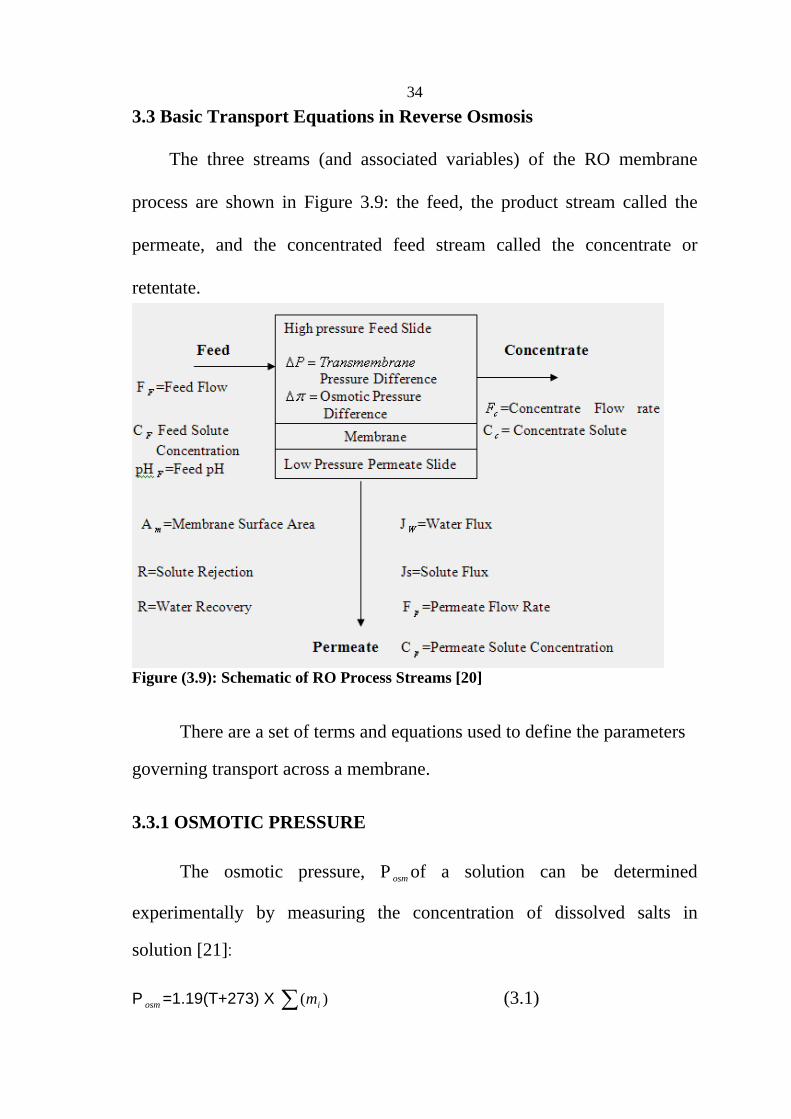
3.3 Basic Transport Equations in Reverse Osmosis
The three streams (and associated variables) of the RO membrane
process are shown in Figure 3.9: the feed, the product stream called the
permeate, and the concentrated feed stream called the concentrate or
retentate.
Figure (3.9): Schematic of RO Process Streams [20]
There are a set of terms and equations used to define the parameters
governing transport across a membrane.
3.3.1 OSMOTIC PRESSURE
The osmotic pressure, P osm of a solution can be determined
experimentally by measuring the concentration of dissolved salts in
solution [21]:
P osm =1.19(T+273) X )( im (3.1)
35
osmP = osmotic pressure (in psi).
T = temperature (in °C).
)( im = sum of molal concentration of all constituents in a solution.
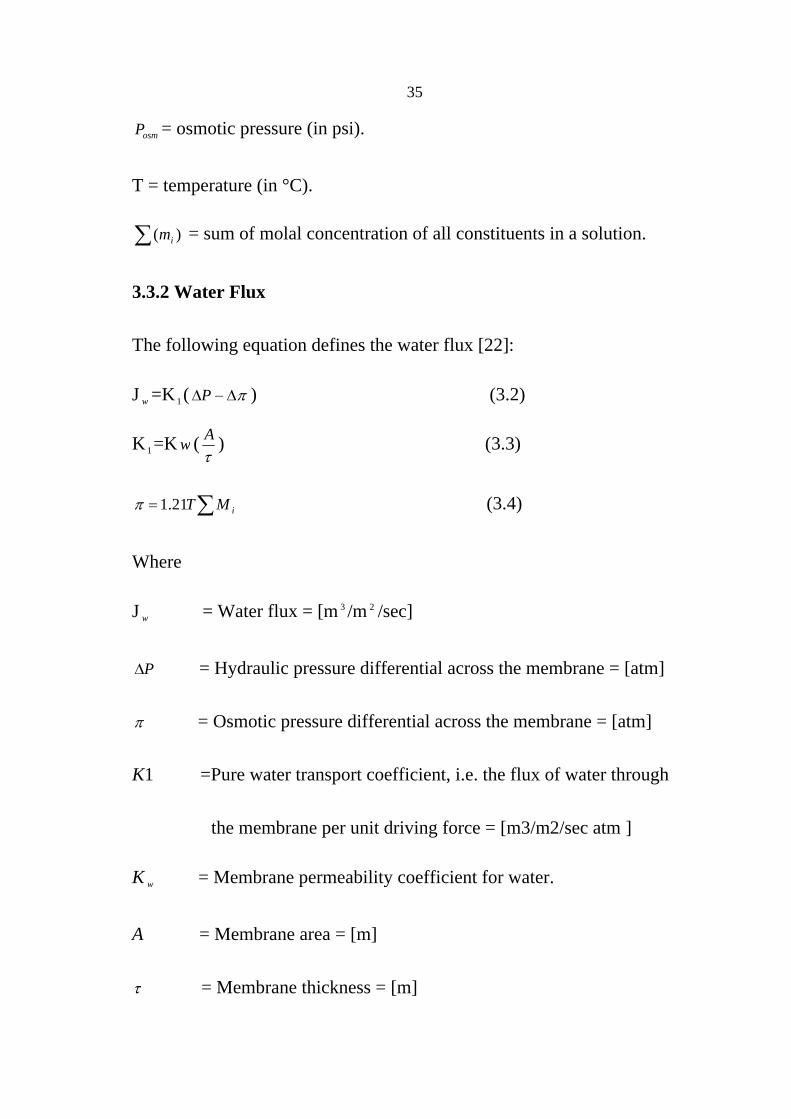
3.3.2 Water Flux
The following equation defines the water flux [22]:
J w =K1 ( P ) (3.2)
K1 =K w ( A ) (3.3)
iMT21.1 (3.4)
Where
J w = Water flux = [m 3 /m 2 /sec]
P = Hydraulic pressure differential across the membrane = [atm]
= Osmotic pressure differential across the membrane = [atm]
K1 =Pure water transport coefficient, i.e. the flux of water through
the membrane per unit driving force = [m3/m2/sec atm ]
K w = Membrane permeability coefficient for water.
A = Membrane area = [m]
= Membrane thickness = [m]

36
T = Feed water temperature =[K]
M i = Molality of the i th ionic or nonionic materials.
It depends on the membrane properties, temperature of the system
and the chemical composition of the salt solution.
3.3.3 Concentration Flux
The salt flux is an indicator for the membrane effectiveness in
removing salts from water.
The salt flux is a function of the system temperature and the salt
composition [22].
F c =K 2 (C F C c ) (3.5)
Where
F c = Concentrate Flow Rate = [Kg/m2/sec]
K 2 =Salt transport coefficient = [m/sec]
C F = Feed Solute Concentration= [Kg/m3]
C c = Product Solute Concentration = [Kg/m3]
As water flows through the membrane and salts are rejected by the
membrane, a boundary layer is formed near the membrane surface in which
the salt concentration exceeds the salt concentration in the bulk solution.
This increase of salt concentration is called concentration polarization.
37
The effects of concentration polarization are as follows:
1. Greater osmotic pressure at the membrane surface than in the bulk
feed solution, P osm , and reduced Net Driving Pressure differential
across the membrane ( P - P osm ).
2. Reduced water flow across membrane (Q w ).
3. Increased salt flow across membrane (Q S ).
4. Increased probability of exceeding solubility of sparingly soluble salts
at the membrane surface, and the distinct possibility of precipitation
causing membrane scaling.
3.3.4 Salt Rejection
Salt rejection expresses the effectiveness of a membrane to remove
salts from the water.
It can be calculated from the following equation [22]:
% Salt rejection= (1- trationFeedConcen
ntrationoductConcePr ) X100% (3.6)
% Salt rejection = (1- CF
CP ) X100%.
The salt passage depends on the feedwater temperature and
composition, operating pressure, membrane type and material, and
pretreatment.
Salt passage and bundle pressure drop are the two indicators of
membrane fouling.
38
3.3.5 Recovery
The recovery rate for an RO system is [22]:
Recovery =F
P
F
F (3.7)
F P = Permeate Flow Rate [m³/day]
F F = Feed Flow Rate [m³/day]
The recovery rate affects salt passage and product flow.
As the recovery rate increases, the salt concentration on the feed-
brine side of the membrane increases, which causes an increase in salt flow
rate across the membrane.
A higher salt concentration in the feed-brine solution increases the
osmotic pressure, reducing the net driving pressure and consequently
reducing the product water flow rate.
3.4 Description of Variable Effects
Factors affecting RO membrane separations include: feed variables
such as solute concentration, temperature, pH, and pretreatment
requirements; membrane variables such as polymer type, module geometry,
and module arrangement; and process variables such as feed flow rate,
operating pressure, operating time, and water recovery.
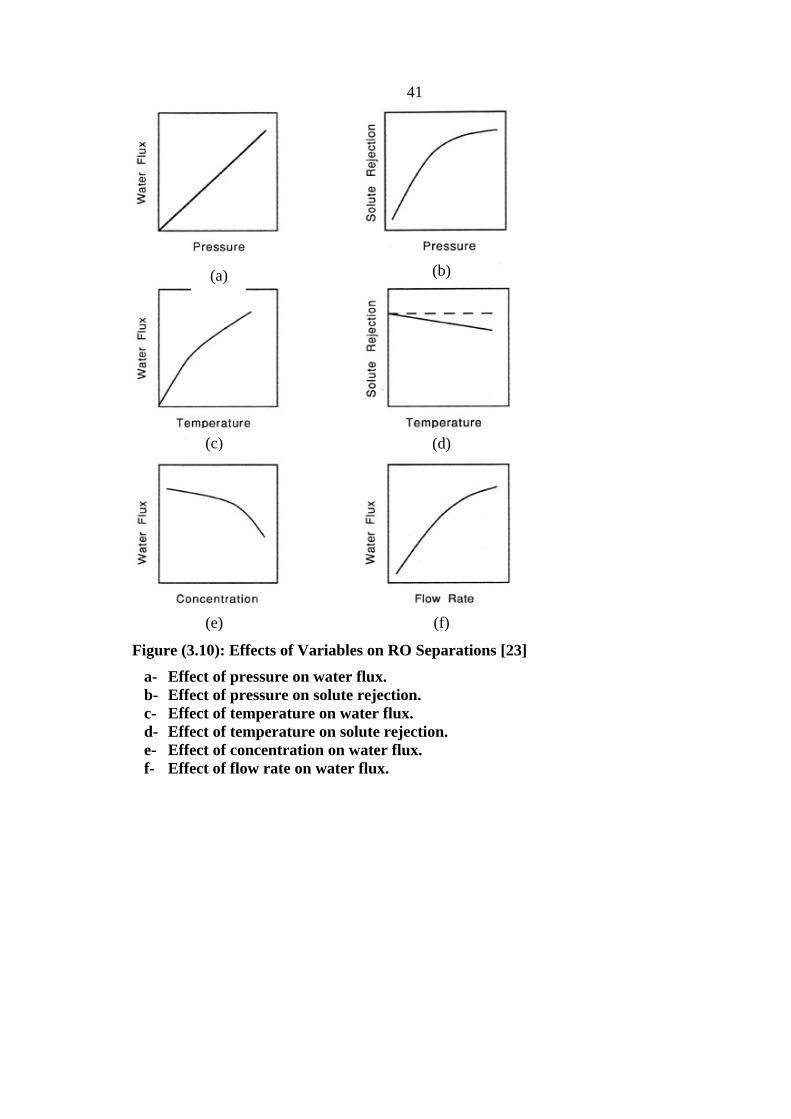
Water flux is shown to increase linearly with applied pressure.
This behavior is predicted by most of the RO transport models.
39
Water flux also increases with temperature, as would be expected,
since the water diffusivity in the membrane increases and the water
viscosity in the membrane decreases with temperature; the increase in
water flux can usually be described by an Arrhenius temperature
dependence of the water permeability constant or by water viscosity
changes [23].
In addition, water flux is greater at higher feed flow rates (high feed
velocities over the membrane surface) since this minimizes concentration
polarization.
Water flux decreases with increasing feed solute concentration since
the higher concentrations result in larger osmotic pressures (and so a
smaller driving force across the membrane). This behavior is also predicted
by most of the transport models. Water flux can also gradually decrease
over operating time (measured in days or months of operation) because of
compaction (mechanical compression) or other physical or chemical
changes in membrane structure[23].
Solute rejection usually increases with pressure since water flux
through the membrane increases while solute flux is essentially unchanged
when pressure is increased; however, rejection of some organics with
strong solute-membrane interactions decreases with pressure.
Rejection of solute remains constant or decreases with increasing
temperature depending on the relative increases of water and solute
diffusivities in the membrane.

40
For most simple inorganic systems (such as NaCl, Na2SO4) feed pH
does not significantly affect water or solute fluxes. However, for ionizable
organics, rejection is a strong function of feed pH: the organic is usually
much more highly rejected when it is ionized.
Feed water quality is also important since particulates, colloids, or
precipitates present in the feed can cause fouling of a membrane by
depositing on its surface, resulting in a substantially reduced water flux.
Bacteriological growth can also occur in RO membrane modules, forming
bacterial layers that decrease water flux and, in some cases, degrade the
membrane polymer.
Selected generalized curves illustrating the effects of some of these
variables are shown in Figure 3.10 for non interacting solutes [23].
41
Figure (3.10): Effects of Variables on RO Separations [23]
a- Effect of pressure on water flux. b- Effect of pressure on solute rejection. c- Effect of temperature on water flux. d- Effect of temperature on solute rejection. e- Effect of concentration on water flux. f- Effect of flow rate on water flux.
(a)
(b)
(c)
(d)
(e)
(f)

42
CHAPTER FOUR
SOLAR ENERGY AND PHOTOVOLTAIC
CELL SIZING
43
Chapter Four
Solar Energy and Photovoltaic Cell Sizing
This chapter describes PV cell operation and the design and the
operation of photovoltaic system.
4.1 Solar Radiation
For PV system, solar radiation is the most important data for
preliminary design and sizing of a PV power system.
Palestine has one of the highest solar potentials of all the countries of
the world.
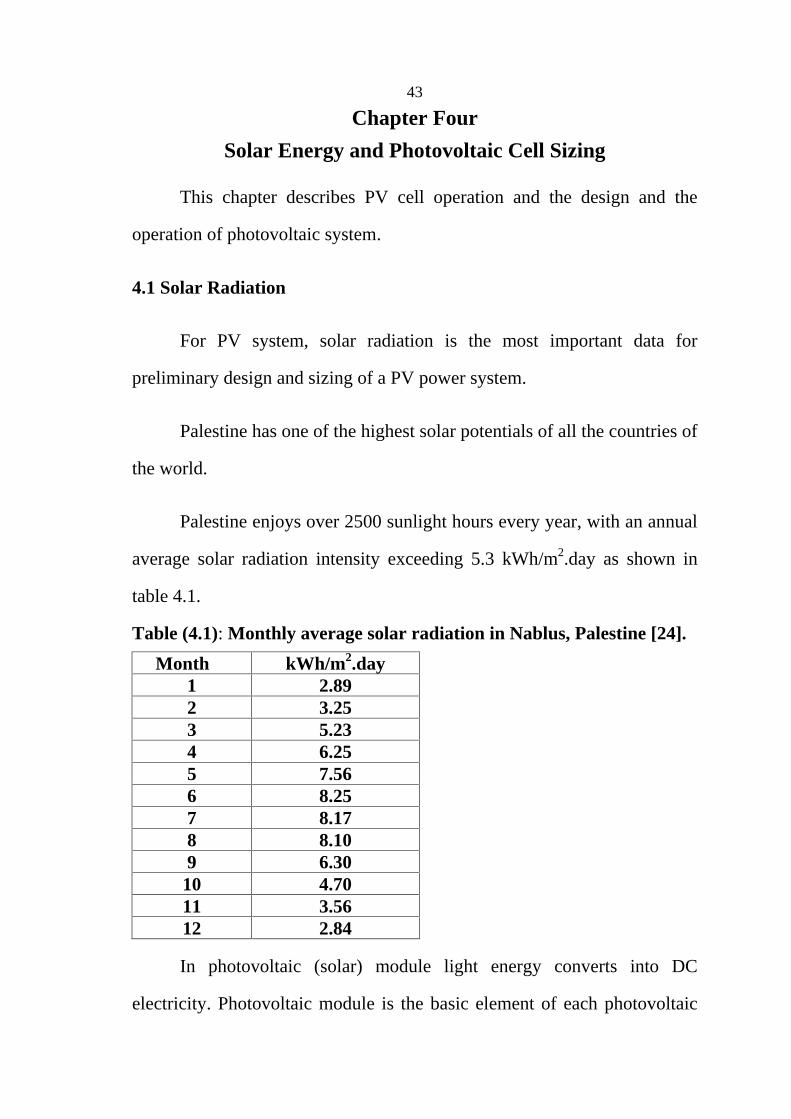
Palestine enjoys over 2500 sunlight hours every year, with an annual
average solar radiation intensity exceeding 5.3 kWh/m2.day as shown in
table 4.1.
Table (4.1): Monthly average solar radiation in Nablus, Palestine [24].
Month kWh/m2.day 1 2.89 2 3.25 3 5.23 4 6.25 5 7.56 6 8.25 7 8.17 8 8.10 9 6.30 10 4.70 11 3.56 12 2.84
In photovoltaic (solar) module light energy converts into DC
electricity. Photovoltaic module is the basic element of each photovoltaic

44
system. Physical phenomenon allowing light-electricity conversion -
photovoltaic effect, was discovered in 1839 by the French physicist
Alexander Edmond Becquerel. Experimenting with metal electrodes and
electrolyte he discovered that conductance rises with illumination. Bell
laboratories produced the first solar cell in 1954, the efficiency of this cell
was about 5 %, and cost was not a major issue, because the first cells were
designed for space applications [25].
In the following years solar cell efficiency increased while the cost
has decreased significantly as shown in figure 4.1.
4.2 Photovoltaic Module
A single PV cell produces an output voltage less than 1V, about 0.6V
for crystalline silicon (Si) cells, thus a number of PV cells are connected in
series to achieve a desired output voltage. When series-connected cells are
placed in a frame, it is called as a module.
Most of commercially available PV modules with crystalline-Si cells
have either 36 or 72 series-connected cells. A 36-cell module provides a
voltage suitable for charging a 12V battery, and similarly a 72-cell module
is appropriate for a 24V battery. This is because most of PV systems used
to have backup batteries, however today many PV systems do not use
batteries; for example, grid-tied systems. Furthermore, the advent of high
efficiency DC-DC converters has alleviated the need for modules with
specific voltages. When the PV cells are wired together in series, the

45
current output is the same as the single cell, but the voltage output is the
sum of each cell voltage, as shown in Figure 4.2.
Figure (4.1): Increases in PV module efficiency, and decreases in cost per peak watt, 1978 1992 [26].
Figure (4.2): PV cells are connected in series to make up a PV module
Also, multiple modules can be wired together in series or parallel to
deliver the voltage and current level needed. The group of modules is
called an array.

46
4.2.1 PV Operating Principle
A PV cell is made of at least two layers of semiconductor material.
One layer has a positive charge, the other negative.
The photovoltaic effect is the basic physical process through which a
PV cell converts sunlight into electricity. Sunlight is composed of photons,
or particles of solar energy. These photons contain various amounts of
energy corresponding to the different wavelengths of the solar spectrum.
When photons strike a PV cell, they may be reflected or absorbed, or they
may pass right through. Only the absorbed photons generate electricity.
When this happens, the energy of the photon is transferred to an electron in
an atom of the cell (which is actually a semiconductor). With its newfound
energy, the electron is able to escape from its normal position associated
with that atom to become part of the current in an electrical circuit. By
leaving this position, the electron causes a "hole" to form. Special electrical
properties of the PV cell a built-in electric field provide the voltage
needed to drive the current through an external load (such as a light bulb)
as shown in figure 4.3.
Figure (4.3): Basic solar cell construction
47
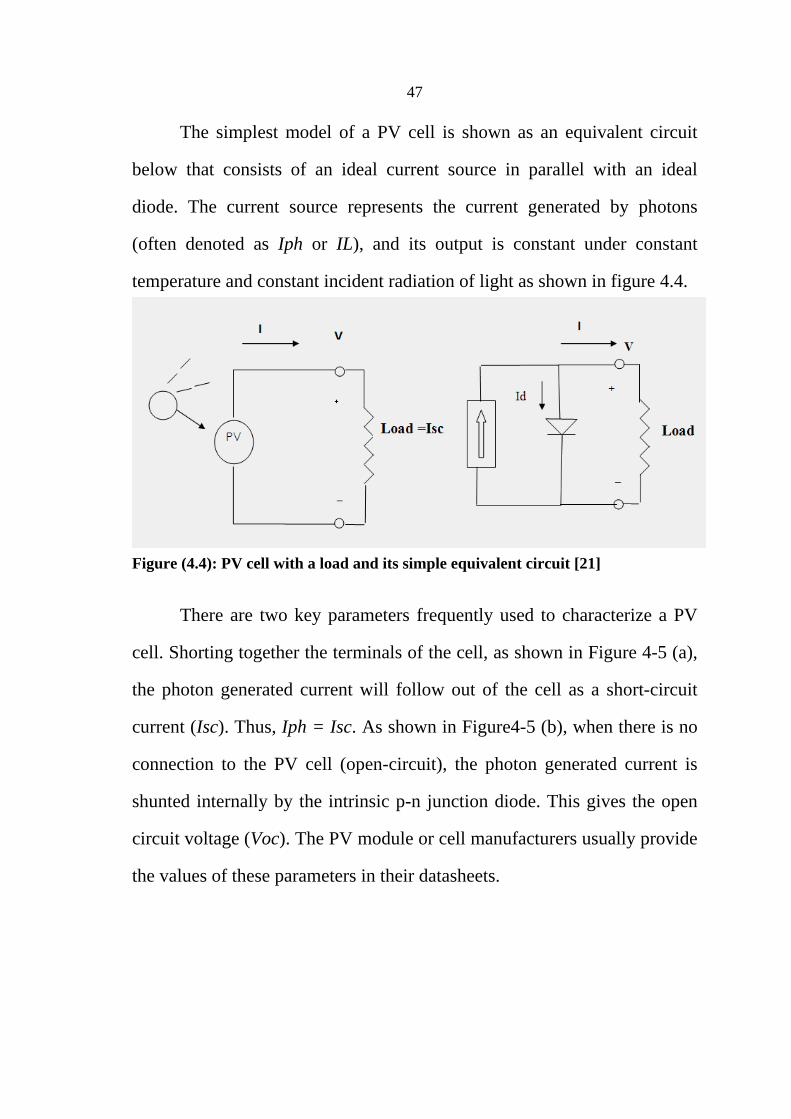
The simplest model of a PV cell is shown as an equivalent circuit
below that consists of an ideal current source in parallel with an ideal
diode. The current source represents the current generated by photons
(often denoted as Iph or IL), and its output is constant under constant
temperature and constant incident radiation of light as shown in figure 4.4.
Figure (4.4): PV cell with a load and its simple equivalent circuit [21]
There are two key parameters frequently used to characterize a PV
cell. Shorting together the terminals of the cell, as shown in Figure 4-5 (a),
the photon generated current will follow out of the cell as a short-circuit
current (Isc). Thus, Iph = Isc. As shown in Figure4-5 (b), when there is no
connection to the PV cell (open-circuit), the photon generated current is
shunted internally by the intrinsic p-n junction diode. This gives the open
circuit voltage (Voc). The PV module or cell manufacturers usually provide
the values of these parameters in their datasheets.
48
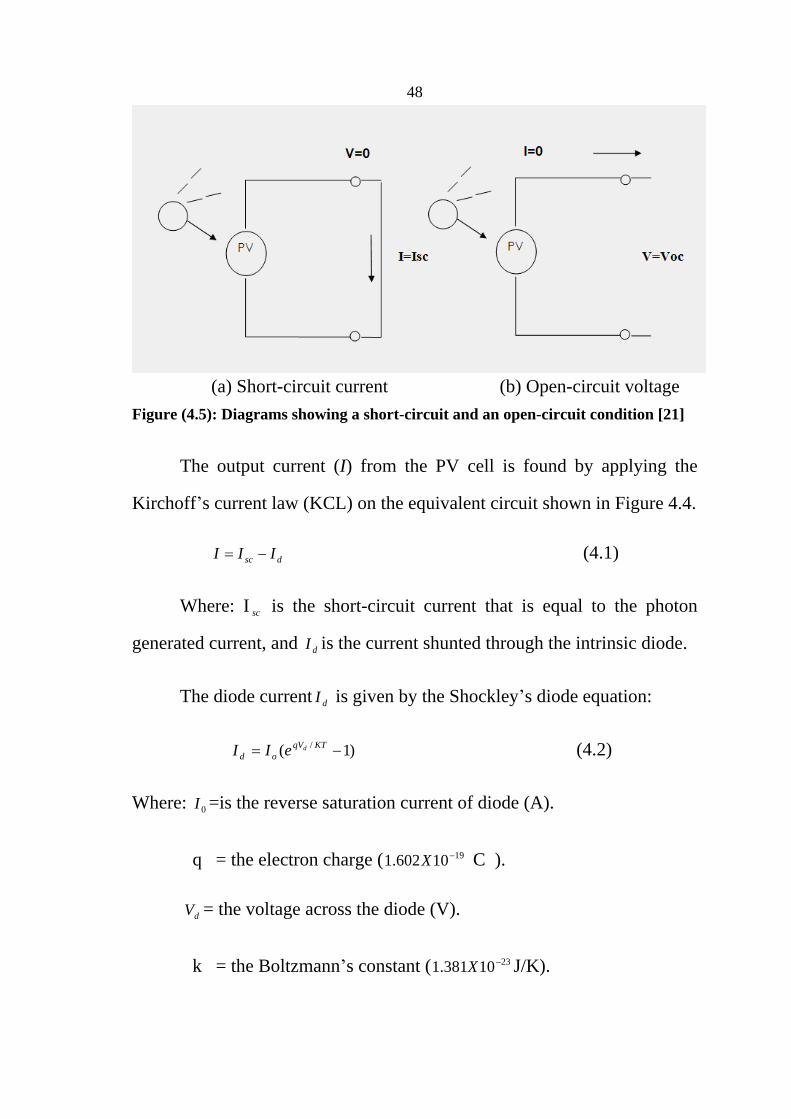
(a) Short-circuit current (b) Open-circuit voltage
Figure (4.5): Diagrams showing a short-circuit and an open-circuit condition [21]
The output current (I) from the PV cell is found by applying the
Kirchoff s current law (KCL) on the equivalent circuit shown in Figure 4.4.
dsc III (4.1)
Where: I sc is the short-circuit current that is equal to the photon
generated current, and dI is the current shunted through the intrinsic diode.
The diode current dI is given by the Shockley s diode equation:
)1( / KTqVod
deII (4.2)
Where: 0I =is the reverse saturation current of diode (A).
q = the electron charge ( 1910602.1 X C ).
dV = the voltage across the diode (V).
k = the Boltzmann s constant ( 2310381.1 X J/K).
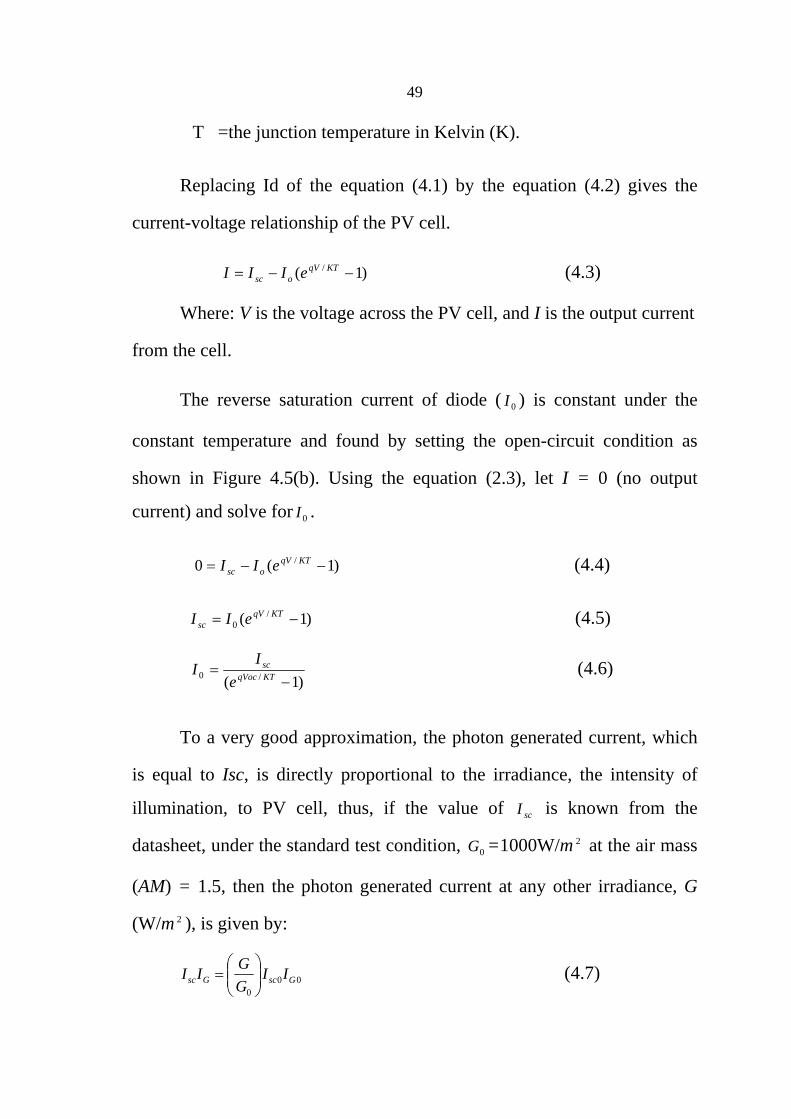
49
T =the junction temperature in Kelvin (K).
Replacing Id of the equation (4.1) by the equation (4.2) gives the
current-voltage relationship of the PV cell.
)1( / KTqVosc eIII (4.3)
Where: V is the voltage across the PV cell, and I is the output current
from the cell.
The reverse saturation current of diode ( 0I ) is constant under the
constant temperature and found by setting the open-circuit condition as
shown in Figure 4.5(b). Using the equation (2.3), let I = 0 (no output
current) and solve for 0I .
)1(0 / KTqVosc eII (4.4)
)1( /0
KTqVsc eII (4.5)
)1( /0 KTqVoc
sc
e
II (4.6)
To a very good approximation, the photon generated current, which
is equal to Isc, is directly proportional to the irradiance, the intensity of
illumination, to PV cell, thus, if the value of scI is known from the
datasheet, under the standard test condition, 0G =1000W/m 2 at the air mass
(AM) = 1.5, then the photon generated current at any other irradiance, G
(W/m 2 ), is given by:
000
GscGsc IIG
GII (4.7)
50
4.2.2 Standard Test Conditions and I-V Curve
The rated power of a solar cell or a module is basically reported in
peak watts [ PW ] and measured under internationally specified test
conditions, namely Standard Test Conditions (STC), which refers to global
radiation 1000 W/m² incident perpendicularly on the cell or the module,
cell temperature 25 °C and AM 1.5 (AM: air mass).
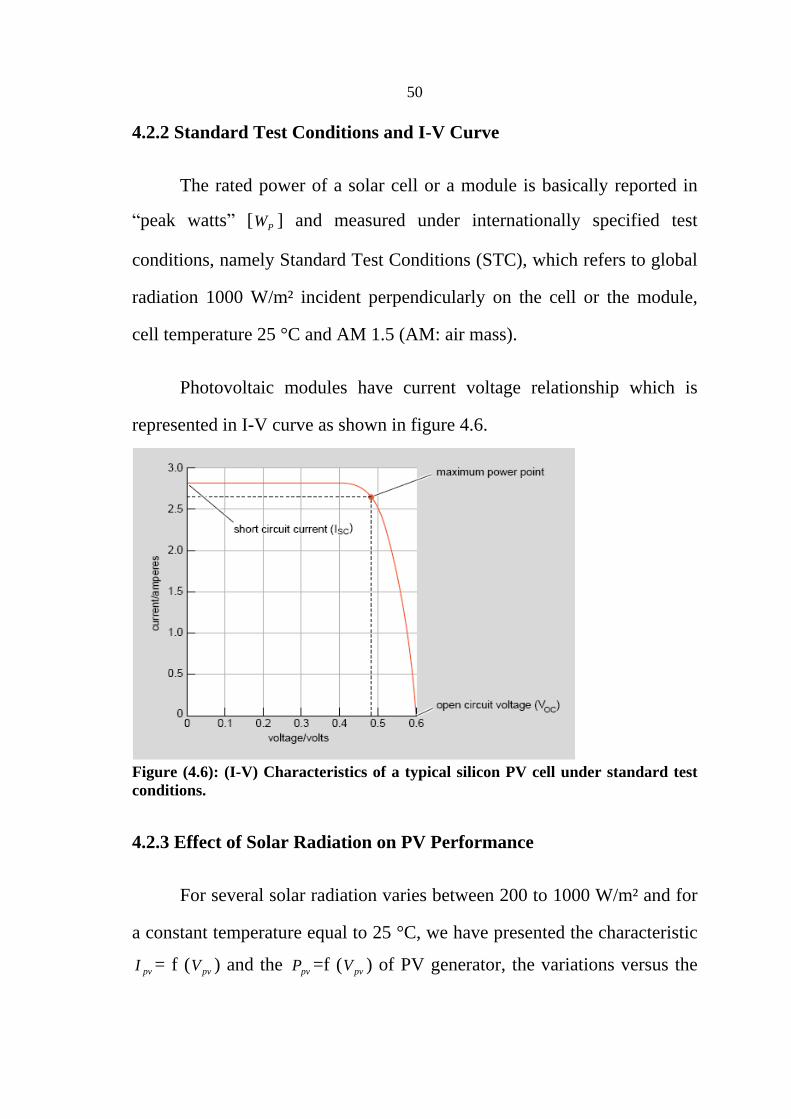
Photovoltaic modules have current voltage relationship which is
represented in I-V curve as shown in figure 4.6.
Figure (4.6): (I-V) Characteristics of a typical silicon PV cell under standard test conditions.
4.2.3 Effect of Solar Radiation on PV Performance
For several solar radiation varies between 200 to 1000 W/m² and for
a constant temperature equal to 25 °C, we have presented the characteristic
pvI = f ( pvV ) and the pvP =f ( pvV ) of PV generator, the variations versus the
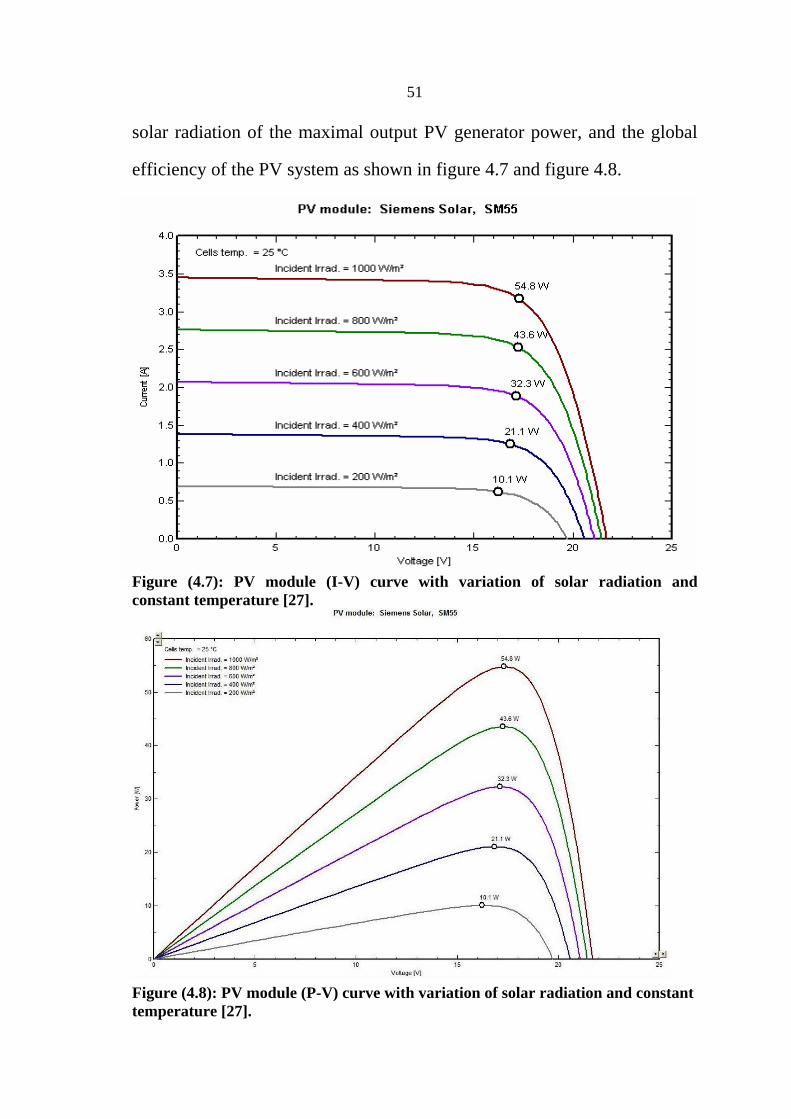
51
solar radiation of the maximal output PV generator power, and the global
efficiency of the PV system as shown in figure 4.7 and figure 4.8.
Figure (4.7): PV module (I-V) curve with variation of solar radiation and constant temperature [27].
Figure (4.8): PV module (P-V) curve with variation of solar radiation and constant temperature [27].
52
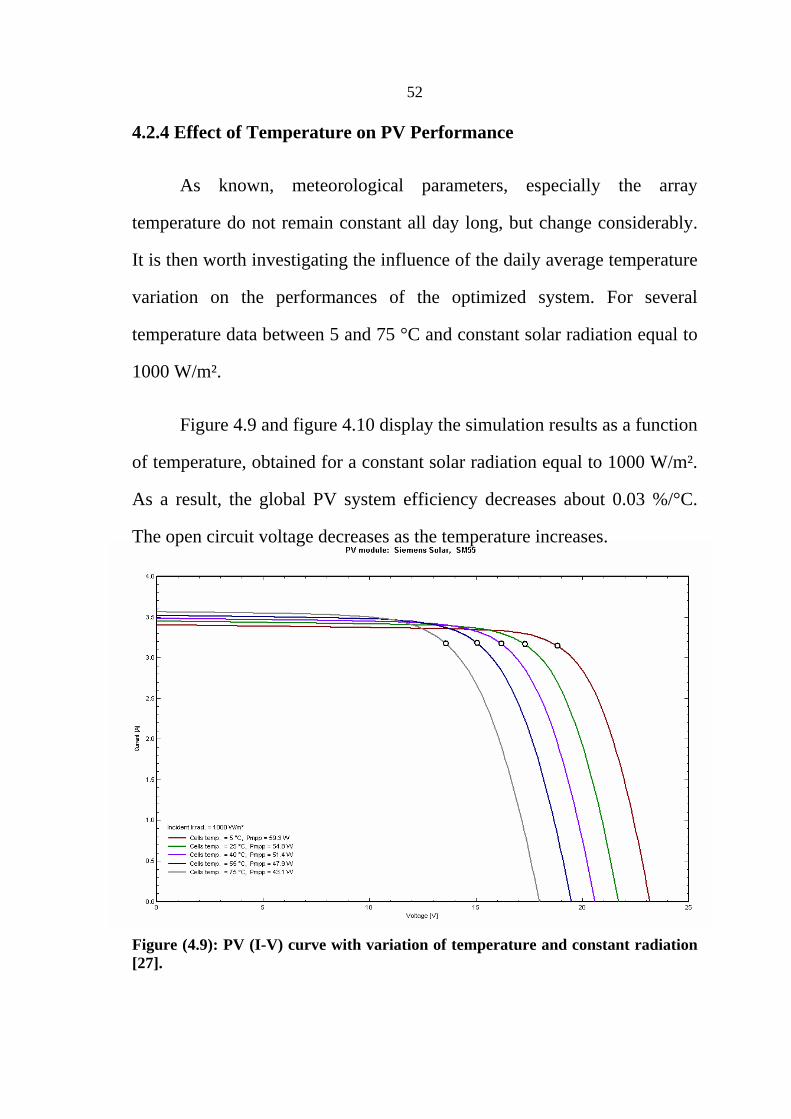
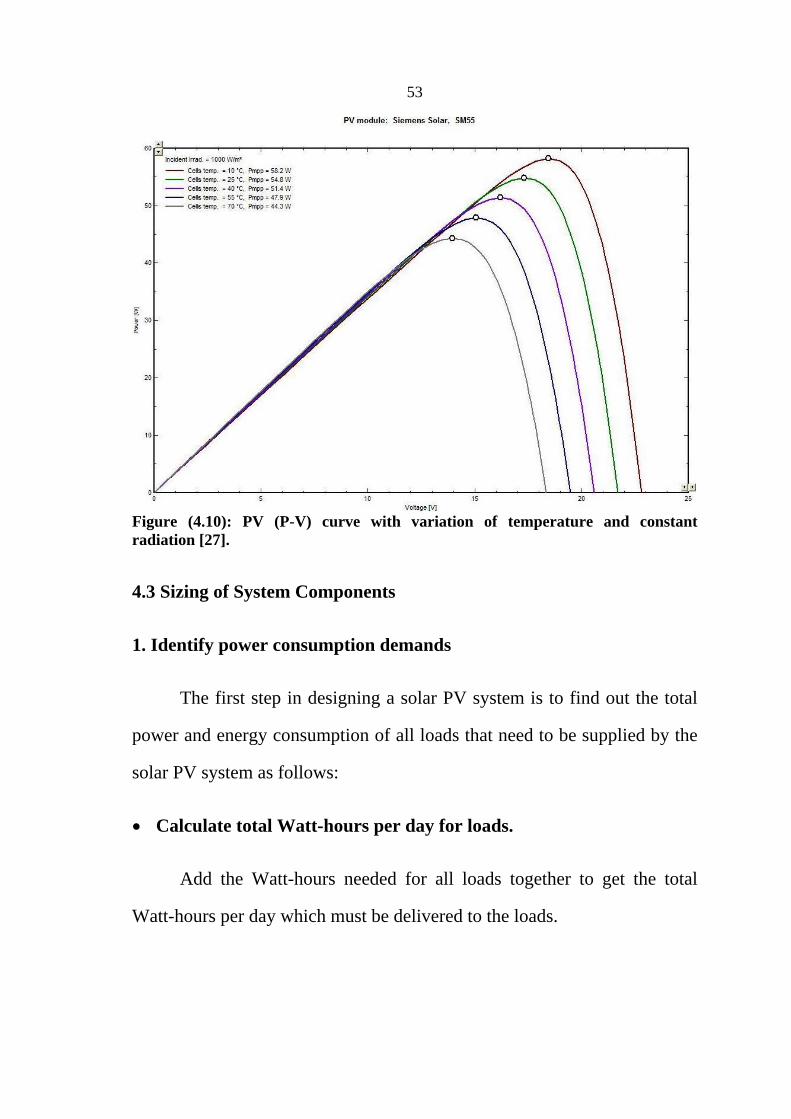
4.2.4 Effect of Temperature on PV Performance
As known, meteorological parameters, especially the array
temperature do not remain constant all day long, but change considerably.
It is then worth investigating the influence of the daily average temperature
variation on the performances of the optimized system. For several
temperature data between 5 and 75 °C and constant solar radiation equal to
1000 W/m².
Figure 4.9 and figure 4.10 display the simulation results as a function
of temperature, obtained for a constant solar radiation equal to 1000 W/m².
As a result, the global PV system efficiency decreases about 0.03 %/°C.
The open circuit voltage decreases as the temperature increases.
Figure (4.9): PV (I-V) curve with variation of temperature and constant radiation [27].
53
Figure (4.10): PV (P-V) curve with variation of temperature and constant radiation [27].
4.3 Sizing of System Components
1. Identify power consumption demands
The first step in designing a solar PV system is to find out the total
power and energy consumption of all loads that need to be supplied by the
solar PV system as follows:
Calculate total Watt-hours per day for loads.
Add the Watt-hours needed for all loads together to get the total
Watt-hours per day which must be delivered to the loads.

54
Calculate total Watt-hours per day needed from the PV modules.
Multiply the total loads Watt-hours per day times 1.3 (the energy lost
in the system) to get the total Watt-hours per day which must be provided
by the panels.
2. Size the PV modules
Different size of PV modules will produce different amount of
power. To find out the sizing of PV module, the total peak watt produced
needs. The peak watt ( PW ) produced depends on size of the PV module and
climate of site location. We have to consider panel generation factor
which is different in each site location. To determine the sizing of PV
modules, calculate as follows:
Calculate the total Watt-peak rating needed for PV modules
Divide the total Watt-hours per day needed from the PV modules by
panel generation factor to get the total Watt-peak rating needed for the
PV panels needed to operate the loads.
Calculate the number of PV panels for the system
Divide total watt-peak rating needed by the rated output Watt-peak
of the PV modules available to you. Increase any fractional part of result to
the next highest full number and that will be the number of PV modules
required.
Result of the calculation is the minimum number of PV panels. If
more PV modules are installed, the system will perform better.
55
If fewer PV modules are used, the system may not work at all during
cloudy periods [28].
Another method to calculate the sizing of PV Panel, by using the
peak power of the PV generator to cover the total load demand is obtained
as in equation (4.8).
FRv
lpv XS
XPSHX
EP (4.8)
Where lE is the daily energy consumption in kWh, PSH is the peak
sun hours (PSH= 5.4); R , v
are the efficiencies of charge regulator and
inverter respectively ( R = 0.92, v =0.9) and fS is the safety factor for
compensation of resistive losses and PV-cell temperature losses fS =1.15
[29].

56
CHAPTER FIVE
EXPERIMENTAL WORKS
57
Chapter Five
Experimental Work
The water treatment by membrane separation is widely used all over
the world.
The reverse osmosis is the most used in membrane technology.
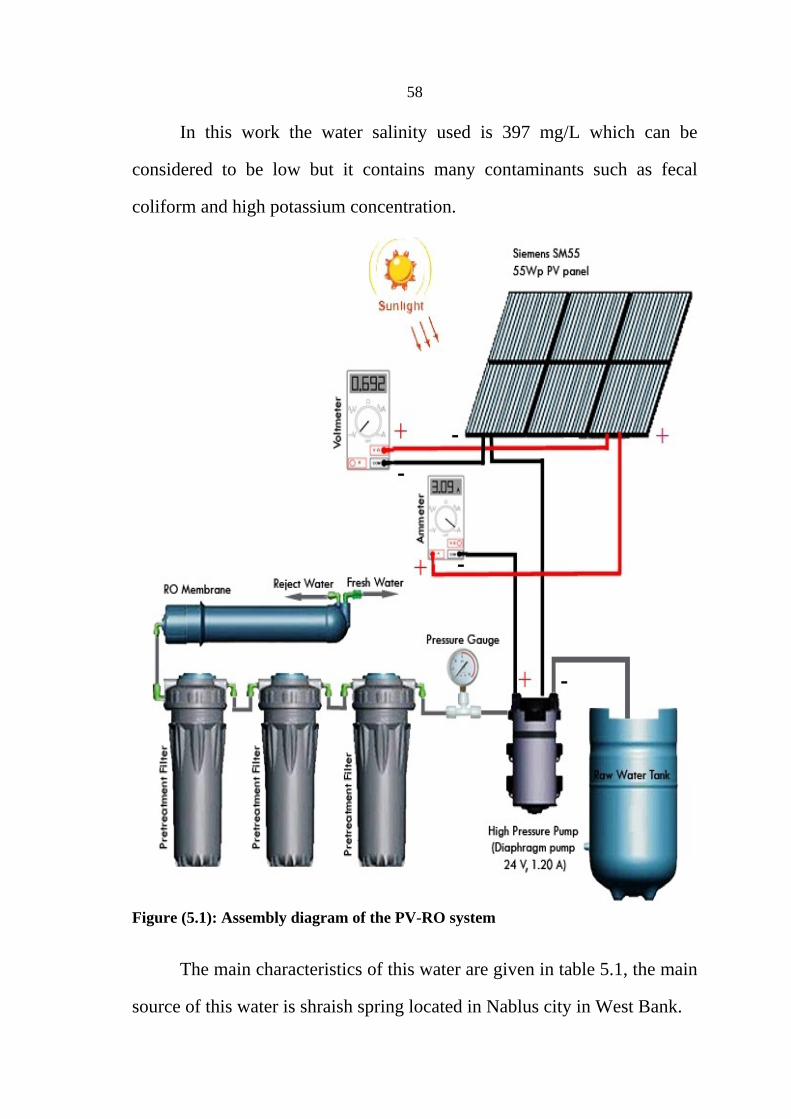
The working principle of a reverse osmosis method setup used in this
work is described in figure 5.1.
On a sunny day, the photovoltaic Panel Siemens (SM55), which
converts solar radiation energy to electricity, was connected parallel into
Booster DC Pump to operate it, without the need of using any inverter or
converter; it is used to increase the feed water pressure. The feed water is
mechanically pre-filtered to remove particulates and sediments or chemical
that may clog the RO membranes.
The pressurized feed water enters the reverse osmosis membrane at a
certain pressure to allow water molecules to pass through the membrane
but prevent passage of salts and other contaminants.
Many experiments were carried out to examine the effect of solar
radiation, pressure, permeate flow rate, retentate flow rate, TDS, pH, and
feed water temperature on the performance of the system.
A high pressure pump is used to drive water to the RO unit, the
power and pressure of such pumps should be selected according to the
treated water salinity and other characteristics.
58
In this work the water salinity used is 397 mg/L which can be
considered to be low but it contains many contaminants such as fecal
coliform and high potassium concentration.
Figure (5.1): Assembly diagram of the PV-RO system
The main characteristics of this water are given in table 5.1, the main
source of this water is shraish spring located in Nablus city in West Bank.
59
Table (5.1): Characteristics of shraish spring
pH TDS
(mg/L)
Fecal
(cfu/100ml)
Turbidity
(NTU)
K
(mg/L)
7.62 397 600 0.26 30
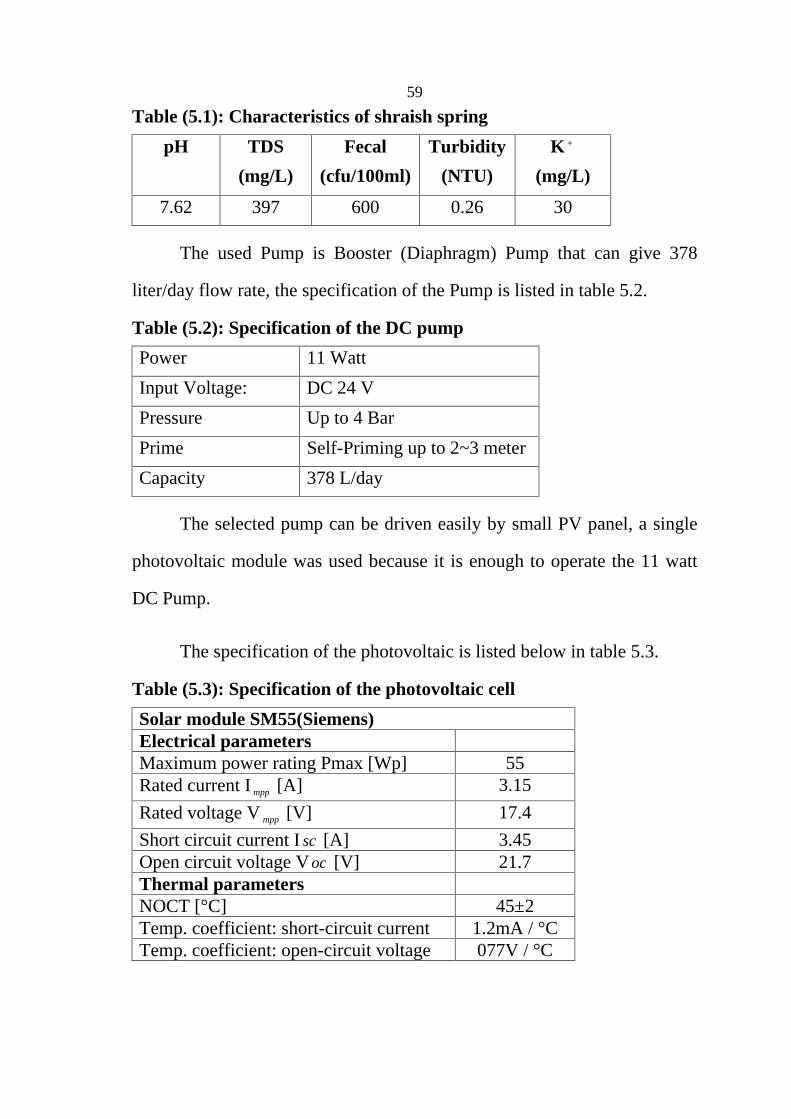
The used Pump is Booster (Diaphragm) Pump that can give 378
liter/day flow rate, the specification of the Pump is listed in table 5.2.
Table (5.2): Specification of the DC pump
Power 11 Watt
Input Voltage: DC 24 V
Pressure Up to 4 Bar
Prime Self-Priming up to 2~3 meter
Capacity 378 L/day
The selected pump can be driven easily by small PV panel, a single
photovoltaic module was used because it is enough to operate the 11 watt
DC Pump.
The specification of the photovoltaic is listed below in table 5.3.
Table (5.3): Specification of the photovoltaic cell
Solar module SM55(Siemens) Electrical parameters Maximum power rating Pmax [Wp] 55 Rated current I mpp [A] 3.15
Rated voltage V mpp [V] 17.4
Short circuit current I sc [A] 3.45 Open circuit voltage V oc [V] 21.7 Thermal parameters NOCT [°C] 45±2 Temp. coefficient: short-circuit current 1.2mA / °C Temp. coefficient: open-circuit voltage 077V / °C

60
The Feed water was treated from replaceable prefilter sediment-
carbon cartridges.
The water first passes through the first filter; 5 micron filter, removes
sediment, clay, silt and particulate matter to 5 micron range.
The second carbon filter removes chlorine, harmful chemicals, syn-
thetic detergents, as well as other organic contaminants.
The third filter compacted carbon block, where a combination of
mechanical filtration and physical/chemical adsorption takes place to
reduce or eliminate a wide range of contaminants.
The reverse osmosis membrane was made with a polyamide thin film
composite membrane in spiral wound configuration with flow rate of 150
liter per day, which is not chlorine tolerant, it is separates up to +99% of
most remaining unwanted impurities from water, including bacteria,
chlorine, virus, hardness trihalomethanes, E.coli, giardia, cryptosporidium,
nitrates, fluoride, heavy metals, inorganic minerals, and makes water safe
for drinking.
Many experiments were conducted to study the affect of operating
parameters on the membrane performance; of these parameters the
following were investigated.
1. Effect of Solar Radiation
The solar radiation is an important parameters that affects the system
performance.
61
The power generated in the solar panels is directly affected by the
solar radiation.
The power input to the pump is significantly affected the pressure
and this affect the flow rate of water and the separation process.
To study the effect of solar radiation, the system was operated under
different solar radiation values on different day times.
All other parameter such as input water quality were kept constant.
2. Effect of Retentate Flow Rate
In order to see the effect of recovery (flow rate of permeate to input
flow rate ratio).
The system was modified by fixing an adjustable valve. The value
was set to different opening ratios while keeping other factors constant.
3. Effect of Feed Water Temperature
The system was modified by adding a water heat exchanger to heat
water before entering the reverse osmosis membrane, the experiments were
carried out at different input temperatures of 33, 25, 38, 40, and 44C .
All other parameters were kept constant during these experiments.
4. Effect of Feed Water Salinity
The input water salinity is one of the most important parameters that
may affect the water treatment processes, as known the higher the water
salinity, the higher the osmotic pressure..

62
The working pressure should be adjusted to a suitable value to
overcome the osmotic pressure, since the working pressure is dependent on
the solar radiation, it is expected that either the flow rate or permeate water
quality could be affected.
The input water salinity was adjusted by adding NaCl to produce
solution concentrations of 500, 650 and 800 ppm. All other parameter were
kept constant.

63
CHAPTER SIX
RESULTS AND DISCUSSION

64
Chapter SIX
Results and Discussion
The experimental results were measured by using many appropriate
devices such as: ammeter and voltmeter to measure the current and voltage
through the pump that helps to calculate the photovoltaic panels output
power, pressure gauge to measure the pressure output from the DC pump.
The water quality was analyzed using conductivity meter (Dist 1, HANNA
H198301), pH meter (pH 211, microprocessor based, Bench pH/mV/C
meters), Turbidity meter (Cole Palmer, model 8391-45) and each sample is
tested for Fecal Coliform (FC) as follows:
1. Filter 250 ml of bottled water or 100 ml of Water using membrane
filteration technique.
2. Place filter on m-FC broth (1-7 ml) for FC at 44-50 °C.
3. Incubate FC for 18-24 hours.
4. Count the number of colony forming units and report per 100 ml.
6.1 Effect of Solar Radiation
In order to study the effect of solar radiation on the system
performance, the system was operated under different solar radiation, this
was performed by selecting different times during the day, as known, the
maximum solar radiation can be obtained around 13:00 PM, the initial
salinity of inlet water was fixed at 397mg/L as can seen in table 6.1.

65
As can be seen in figure 6.1 there is almost a direct proportional
relationship between the power input to the pump and the solar radiation.
The system was operated in a sunny day in June 2009 at 9:00 AM
when the solar radiation was (478.75) W/m2. At this value of radiance the
PV panel provides electrical current directly to the high pressure pump,
whose speed increases as the power from the PV panel increases.
The permeate flow followed the behavior of the feed flow and
reached to 7.5 L/h. The total amount of permeate produced was around 44
L with 8 h of operation as shown in figure 6.2.
Table (6.1): Effect of operating conditions on produced water quality
Dat
e
Tim
e
Sola
r ra
diat
ion
W/m
² [30
]
Pow
er
(W)
Flo
w r
ate
of
perm
eate
(L
/h)
Pre
ssur
e (
Bar
)
pH
TD
S
(mg/
L)
Fec
al
(cfu
/100
ml)
Tur
bidi
ty
(NT
U)
K+
mg/
L
2/6/2009 09:00 478.75
3.6 4.1 0.63 7.8 71 0 NA
5
2/6/2009 10:00 636.75
4.9 4.3 0.71 7.6 58 0 NA
5.3
2/6/2009 10:30 748.75
7.4 4.8 0.84 6.5 28 0 0.22
6
03/06/2009
12:00 790.25 8.1 5.4 0.92 7.2 33 0 NA
8.8
03/06/2009
13:00 815.25
10.7 7.5 1.20 7.5 54 0 0.16
9.3
03/06/2009
14:00 805.75
10.2 7.1 0.95 6.9 32 0 0.19
NA
03/06/2009
15:00 790.25 8.2 5.6 0.88 7.2 33 0 NA
NA

66
0
1
2
3
4
5
6
7
8
3 5 7 9 11
Power(W)
Per
mea
te f
low
rat
e (
L/h
)
Figure (6.1): Effect of solar radiation on power input to the pump
The pressure output of the pump exit is directly proportional to the
power input to the pump (as shown in figure 6.3) and as indicated earlier
the power received from the solar panel is also directly proportional to the
solar irradiation.
Figure (6.2): Effect of power input to the pump on permeate flowrate

67
Figure (6.3): Relationship between the power input to the pump and pump pressure
As a result, one can conclude that The PV panel provides electrical
current directly to the high pressure pump whose speed increases as the
power from the PV panel increases.
6.2 Effect of Pump Pressure on the Permeate Water Flow rate
The membrane tube was used to study the effect of Pump Pressure
on the permeate flow rate. The results are shown in Figures 6.4.
The permeate flow rate of water through the membrane is directly
proportional to the pressure drop across the membrane input and output.
Since the pressure at the product side is constant, and then the water flux is
directly related to the feed pressure which in line with the theoretical case
as shown in figure (3.10) a.
When the feed pressure increased from 0.63 bar to 1.2 bar, the
permeate production increased by 83%. The permeate flow was around 7.5

68
L/h. The total amount of permeate collected in that day was around 60 L.
The permeate salinity and salt rejection were 54 mg/L and 86.4%,
respectively.
At low operating pressure, less water permeates the membrane. At
higher operating pressures more water permeates from the membrane
which affects water quality such that: pH, TDS decrease and K ,turbidity
increases when the flow rate of permeate water increased as can seen in
figure 6.5, figure 6.6, figure 6.7 and figure 6.8 respectively. In most cases,
the water pH was within the international standard which is between 6.5
and 8. [31]. These changes could be a result of water content variation.
Figure (6.4): Effect of membrane Pressure on permeate flowrate

69
0
10
20
30
40
50
60
70
80
4 4.5 5 5.5 6 6.5 7 7.5 8
Flow rate of permeate water (L/h)
Tota
l dis
solv
ed s
olids(
mg/L
)
6.4
6.6
6.8
7
7.2
7.4
7.6
7.8
8
3 4 5 6 7 8
Permeate Flow rate (L/h)
pH
4
5
6
7
8
9
10
4 4.5 5 5.5 6 6.5 7 7.5 8
Permeate Flow rate (L/h)
K+
(m
g/L
)
Figure (6.5): Effect of permeate flow rate on permeate pH
Figure (6.6): Effect of flow rate of permeate water on K+ concentration
Figure (6.7): Effect of flow rate of permeate water on total dissolved solids

70
0
0.05
0.1
0.15
0.2
0.25
4.00 4.50 5.00 5.50 6.00 6.50 7.00 7.50 8.00
Permeate flow rate (L/h)
Tu
rbid
ity
Figure (6.8): Effect of flow rate of permeate water on turbidity
6.3 Effect of Feed Water Temperature on Permeate Flow rate
Membrane productivity is very sensitive to changes in feed water
temperature. As water temperature increases, water flux increases almost
linearly primarily due to the higher diffusion rate of water through the
membrane as elucidated in Figure 6.9 which in line with theoretical case as
shown in figure (3.10) c.
The main reason for this trend is the reduction in viscosity with
temperature increase. As viscosity decrease the mass transfer through the
membrane surface is enhanced. Moreover the diffusion coefficient also
increases with temperature [23].
Increased feed water temperature also results in lower salt rejection
or higher salt passage. This is due to a higher diffusion rate for salt (salt
flux) through the membrane. The opposite happens when the feed water
temperature decreases; it can be calculated from the following equation:

71
0
2
4
6
8
10
12
14
16
30 32 34 36 38 40 42 44
Water Tempreture(C)
Per
mea
te fl
ow
rat
e (L
/h)
% Salt rejection = (1- FeedTDS
oductTDSPr ) X100% (6.1)
The percentage salt rejection decreased from 87.9% to 87.1% when
the feed temperature increased from 33°C to 44°C.
Figure (6.9): Effect of temperature on water permeate flow rate
In addition, the effect of feed water temperature on product quality is
generally very small. For instance, the TDS increased from 48 to 51mg/L
when the feed water temperature increased from 33 to 44 C, respectively.
On the other hand, the permeate flow rate increased from 8.6 to 15 L/h for
the same operating temperature. Higher temperature may not give similar
results since the membrane operating temperature is recommended to be
less than 50 C.
The used temperature range was found to have no effect on fecal
permeability as can see in table 6.2. As expected and as can be seen in table
6.3, the retentate water quality changes consistently with the permeate
water quality.

72
Table (6.2): Effect of water temperature on permeate water quality
Feed Water Temp
( C) Permeate Quality
33 35 38 40 44
Flow rate (L/h) 8.6 10.0 10.8 12.0 15.0
pH 6.1 7.3 6.3 5.9 6.7
TDS (mg/L) 48 50 49 50 51
Fecal (cfu/100ml) 0 0 0 0 0
Turbidity (NTU) 0.15 0.14 - - -
K (mg/L) 7.1 7.5 8.4 8.4 8.3
Table (6.3): Effect of feed water temperature on retentate properties
Feed Water Temp ( C) Retentate Quality
33 35 38 40 44
Flow rate (L/h) 27 28.56 27.6 27.6 30
pH 7.28 8.01 7.32 7.13 7.3
TDS (mg/L) 474 477 470 491 493
Fecal (cfu/100ml ) 80 70 - - -
Turbidity (NTU) 0.146 0.144 - - -
K (mg/L) 39.5 38 44 44.5 45
6.4. Effect of Feed water Salinity on Flowrate Salinity of Permeate
Water
Reverse osmosis membrane is highly effective in removing low total
dissolved solids (TDS) from water at low pressures. Higher salinity
requires very high pressure since the osmotic pressure of water increase
almost linearly with increasing salt content. The osmotic pressure , is
given by van't Hoff formula, which is identical to the pressure formula of
an ideal gas: = cRT, where c is the molar concentration of the solute, R =
0.082 (liter.bar) / (deg.mol), is the gas constant, and T is the temperature on
the absolute temperature scale (Kelvin). The osmotic pressure does not

73
0
20
40
60
80
100
120
140
0 2 4 6 8 10 12
Permeate flow rate (L/h)
Tota
l Dis
solv
ed solid(m
g/l)
depend on the solute type, or its molecular size, but only on its molar
concentration. As a result, higher operating pressures are needed to
overcome the osmotic pressure. If low pressure pump is used, generally
very low recovery can be achieved. Figure 6.10 shows the rapid decrease in
permeate flowrate when the feed water contains high salt concentration. As
a result, the obtained permeate concentration also increase which in line
with theoretical case as shown ij figure (2.10) e. As shown in table 6.4, the
permeate water salinity increased from 72 to 127 mg/L when the feed
salinity increased from 495 to 811mg/L, respectively.
Figure (6.10): Effect of total dissolved solids (TDS) of feed water on flowrate of permeate water at constant power and feed pressure.
Table (6.4): Effect of TDS on flow rate of permeate water
Feed Water TDS(mg/l)
Permeate Quality 495 652 811
Permeate flow rate (L/h) 10 6 1.87
TDS (mg/L) 55 72 127
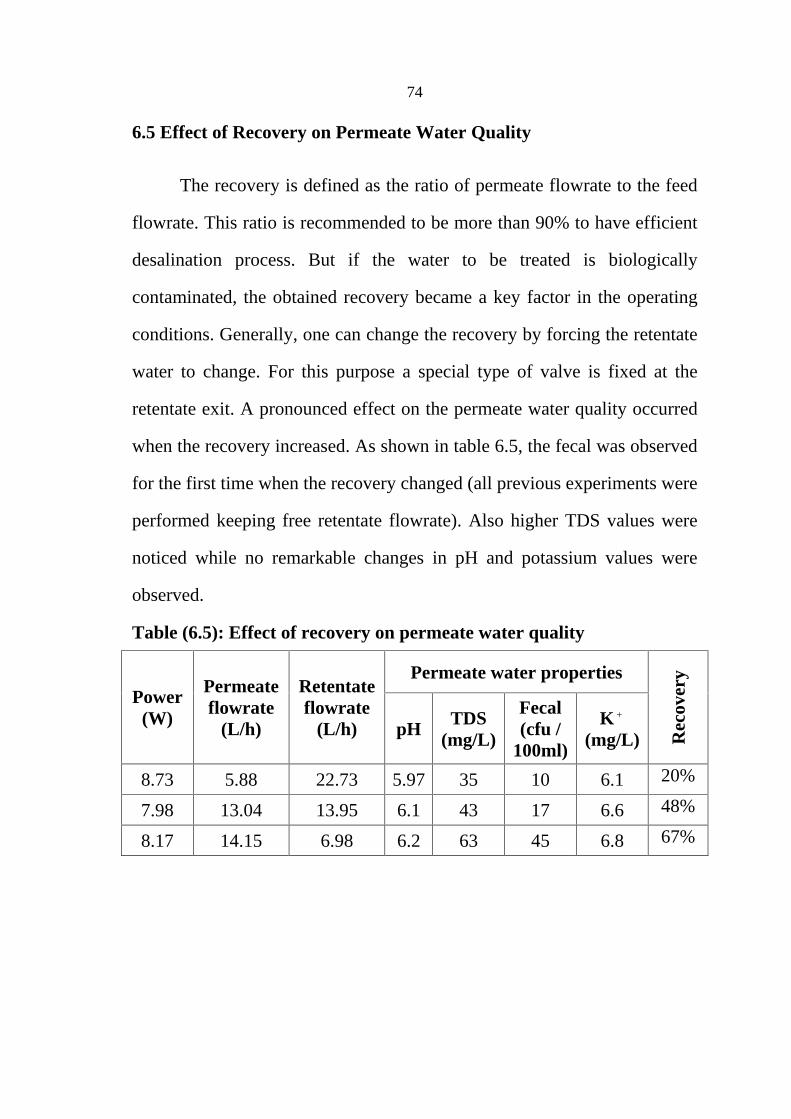
74
6.5 Effect of Recovery on Permeate Water Quality
The recovery is defined as the ratio of permeate flowrate to the feed
flowrate. This ratio is recommended to be more than 90% to have efficient
desalination process. But if the water to be treated is biologically
contaminated, the obtained recovery became a key factor in the operating
conditions. Generally, one can change the recovery by forcing the retentate
water to change. For this purpose a special type of valve is fixed at the
retentate exit. A pronounced effect on the permeate water quality occurred
when the recovery increased. As shown in table 6.5, the fecal was observed
for the first time when the recovery changed (all previous experiments were
performed keeping free retentate flowrate). Also higher TDS values were
noticed while no remarkable changes in pH and potassium values were
observed.
Table (6.5): Effect of recovery on permeate water quality
Permeate water properties Power
(W)
Permeate flowrate
(L/h)
Retentate flowrate
(L/h) pH TDS
(mg/L)
Fecal (cfu /
100ml)
K
(mg/L)
Rec
over
y
8.73 5.88 22.73 5.97
35 10 6.1 20%
7.98 13.04 13.95 6.1 43 17 6.6 48%
8.17 14.15 6.98 6.2 63 45 6.8 67%

75
CHAPTER SEVEN
ECONOMIC EVALUATION OF SMALL RO UNIT POWERED BY PV SYSTEM
76
CHAPTER SEVEN
ECONOMIC EVALUATION OF SMALL RO UNIT POWERED BY PV SYSTEM
7.1 Cost Analysis
It is one of the most important steps in solar-powered water
treatment system planning. The photovoltaic energy system differ from
conventional energy systems in that they have high initial cost and low
operating costs.
The product cost is strongly correlated with unit capacity, quality of
feed water, pretreatment, types of water treatment technology, site
condition, costs of land and additional costs.
So the average daily water flow rate can be calculated as the
following:
During June, the average flow rate 44.32 L/day, (day= 8hours) and
the monthly average solar radiation was 8.25 kWh/m².day.
According to other months, the average water flow rates were
calculated corresponding to the monthly average solar radiation as shown
in table 7.1.
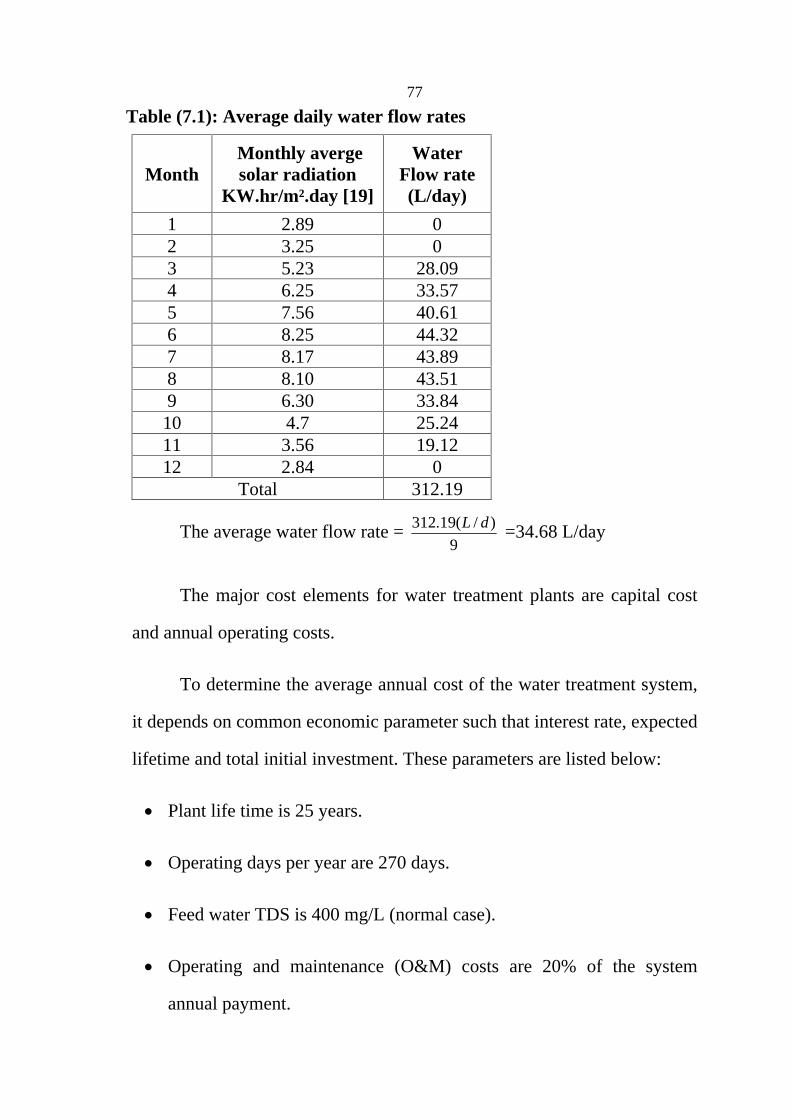
77
Table (7.1): Average daily water flow rates
Month
Monthly averge solar radiation
KW.hr/m².day [19]
Water Flow rate (L/day)
1 2.89 0 2 3.25 0 3 5.23 28.09 4 6.25 33.57 5 7.56 40.61 6 8.25 44.32 7 8.17 43.89 8 8.10 43.51 9 6.30 33.84 10 4.7 25.24 11 3.56 19.12 12 2.84 0
Total 312.19
The average water flow rate = 9
)/(19.312 dL =34.68 L/day
The major cost elements for water treatment plants are capital cost
and annual operating costs.
To determine the average annual cost of the water treatment system,
it depends on common economic parameter such that interest rate, expected
lifetime and total initial investment. These parameters are listed below:
Plant life time is 25 years.
Operating days per year are 270 days.
Feed water TDS is 400 mg/L (normal case).
Operating and maintenance (O&M) costs are 20% of the system
annual payment.

78
Annual rate of membrane replacement is 20%.
Interest rate is 10%.
Plant availability (f) is 74%.
Capacity(M)=35 L/day
Salvage value of the units will be zero.
7.1.1 Capital Cost
The total capital cost of PV module = 55Watt X 7.27 $/Watt.
=400$
A detailed cost analysis of the system has been completed and is
summarized below in table 7.1.
Table (7.2): Capital cost summary
Item Cost
PV module (Siemens SM55, 55Wp) 400$
Reverse Osmosis Membrane 100$
Booster Pump (12VDC) 150$
3 stages pretreatment filters, accessories 100$
Total 750$
7.1.2 Annual Operating Costs
Annual operating cost covers all expenses after commissioning and
during the actual operation

79
1)1.01(
)1.01(1.025
25
a
7.1.2.1 Fixed Charges
To determine the fixed charge value of the capital costs, these costs
are multiplied by an amortization factor (a)
The fixed charges factor is a function of the interest rate(i) which is
value 10% of the capital and the numbers of years over which the
investment is recovered which is value 25 years. The fixed charges factor
can be calculated using the following relationship [32].
1)1(
)1(n
n
i
iia
(7.1)
Where i is the interest rate of the amortized investment (%) and n is
the period of repayment of capital expenditures (life time).
1)1(
)1(n
n
i
iia
10.11ya
Annual fixed charges ( fixedA ):
fixedA = (a) X (CC) (7.2)
fixedA = 0.11 1y X750$ =82.5$/year

80
7.1.2.2 Operating and Maintenance (O&M) Costs
This includes the operation and maintenance staff cost, cost of
spares, etc. This cost shall be expressed on a yearly basis for each item for
all the commercial operation period. The annual O&M costs are estimated
at 20% of the plant annual payment [33].
Annual operating and maintenance costs (AO&M)
moA & = (20%) X ( fixedA ) (7.3)
moA & = (20%) X (82.5) $/year=16.5$/year
7.1.2.3. Membrane Replacement
The success of an RO system depends upon membrane life and
performance Membranes lose performance and are replaced due to raw
water quality, the deposition of unwanted materials on the surface. In
addition, a decrease in membrane performance may be due to other
factors, i.e., degradation by chemical (oxidation, hydrolysis).
Replacement rate may vary between 5% 20% per year [32].
Annual membrane replacement costs ( treplacemenA ):
treplacemenA = (20%) X (Membrane Cost) (7.4)
treplacemenA = (20%) X100$=20$/Year
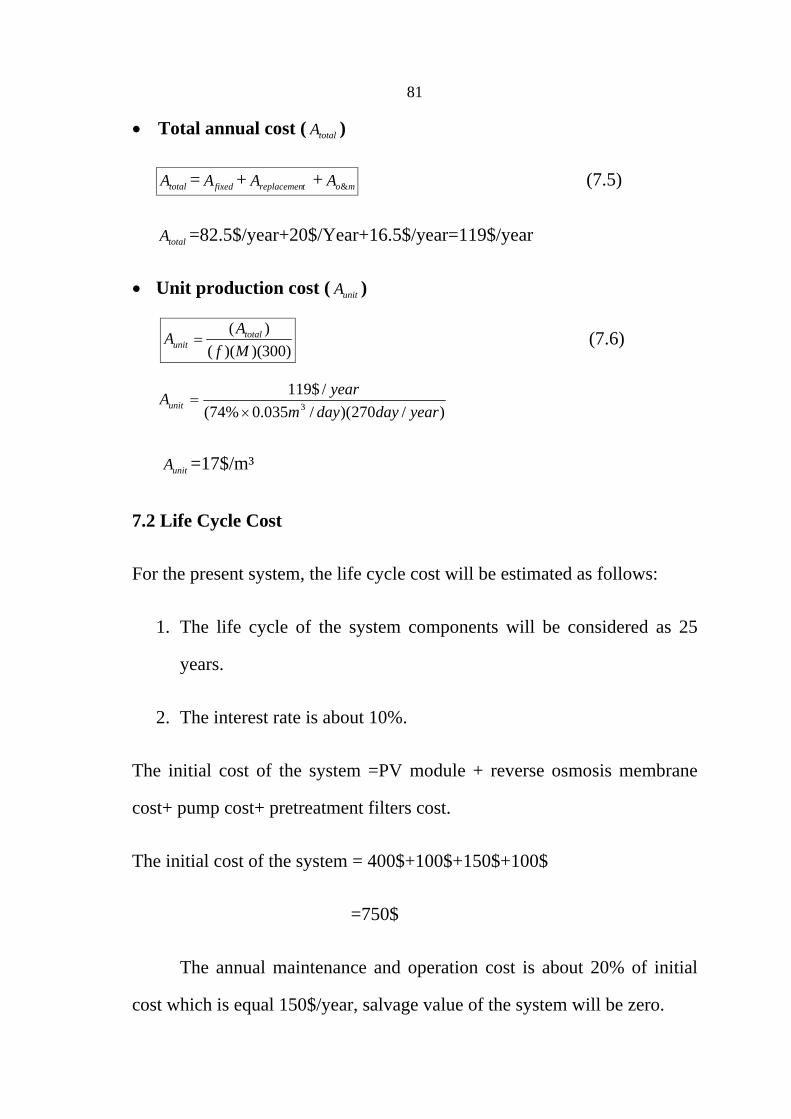
81
Total annual cost ( totalA )
totalA = fixedA + treplacemenA + moA & (7.5)
totalA =82.5$/year+20$/Year+16.5$/year=119$/year
Unit production cost ( unitA )
)300)()((
)(
Mf
AA total
unit (7.6)
)/270)(/035.0%74(
/$1193 yeardaydaym
yearAunit
unitA =17$/m³
7.2 Life Cycle Cost
For the present system, the life cycle cost will be estimated as follows:
1. The life cycle of the system components will be considered as 25
years.
2. The interest rate is about 10%.
The initial cost of the system =PV module + reverse osmosis membrane
cost+ pump cost+ pretreatment filters cost.
The initial cost of the system = 400$+100$+150$+100$
=750$
The annual maintenance and operation cost is about 20% of initial
cost which is equal 150$/year, salvage value of the system will be zero.

82
The life cycle cost of unit is obtained by drawing cash flow as in
figure (7.1)
0 1 2 3 4 5 6 7 8 9 10 11 12 13 14 15 16 17 18 19 20 21 22 23 24 25
150$
750 $
Figure (7.1): Cash flow of units
To calculate the equivalent uniform annual series A of cash flow in
figure(7.1) which include randomly placed single amounts and uniform
series amounts, the most important fact to remember is to first convert
everything to a present worth or future worth. Then the equivalent uniform
series is obtained with appropriate A/P or A/F factors [34].
The life cycle cost of the system = initial cost of the system + present
worth of maintenance and operation present worth of salvage value.
The life cycle cost of the system = 750$ + 150 (P/A ni, ) - 0
P = An
n
ii
i
)1(
1)1( i 0 (7.7)
P = A (9.077)
(P/A ni, )=9.077
PW= 750$ + 150 X 9.077
= 2111.55 $.
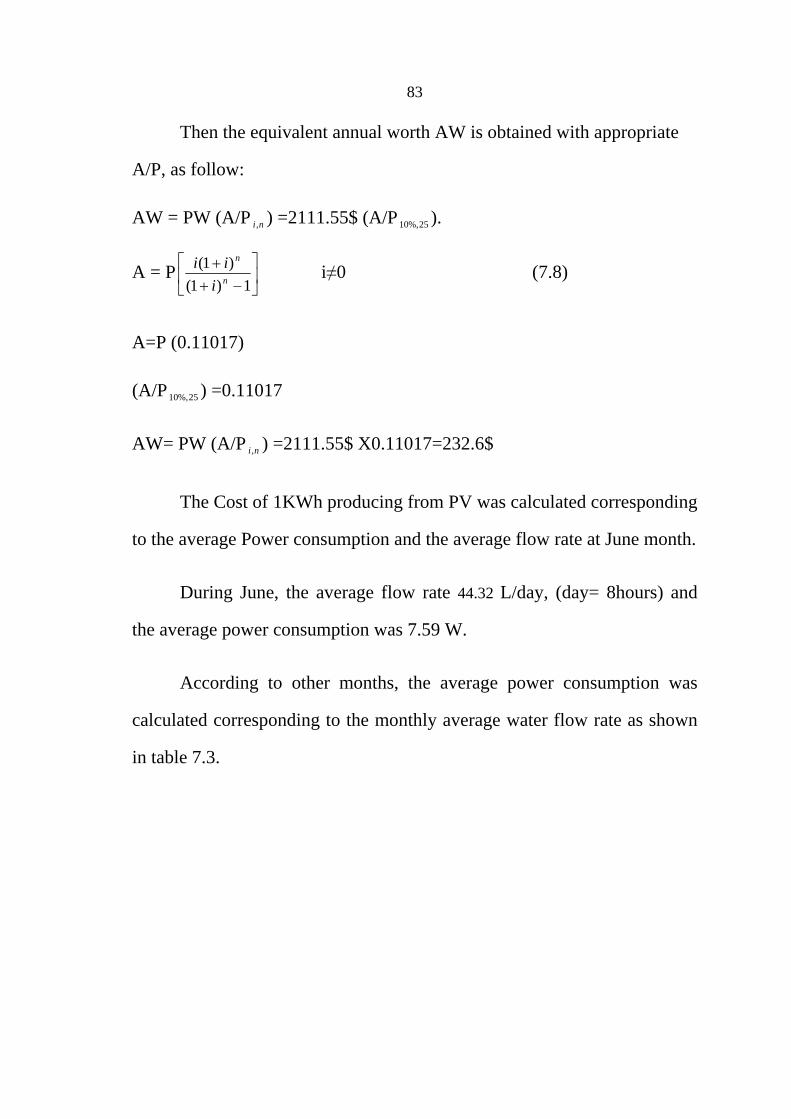
83
Then the equivalent annual worth AW is obtained with appropriate
A/P, as follow:
AW = PW (A/P ni, ) =2111.55$ (A/P 25%,10 ).
A = P1)1(
)1(n
n
i
ii i 0 (7.8)
A=P (0.11017)
(A/P 25%,10 ) =0.11017
AW= PW (A/P ni, ) =2111.55$ X0.11017=232.6$
The Cost of 1KWh producing from PV was calculated corresponding
to the average Power consumption and the average flow rate at June month.
During June, the average flow rate 44.32 L/day, (day= 8hours) and
the average power consumption was 7.59 W.
According to other months, the average power consumption was
calculated corresponding to the monthly average water flow rate as shown
in table 7.3.
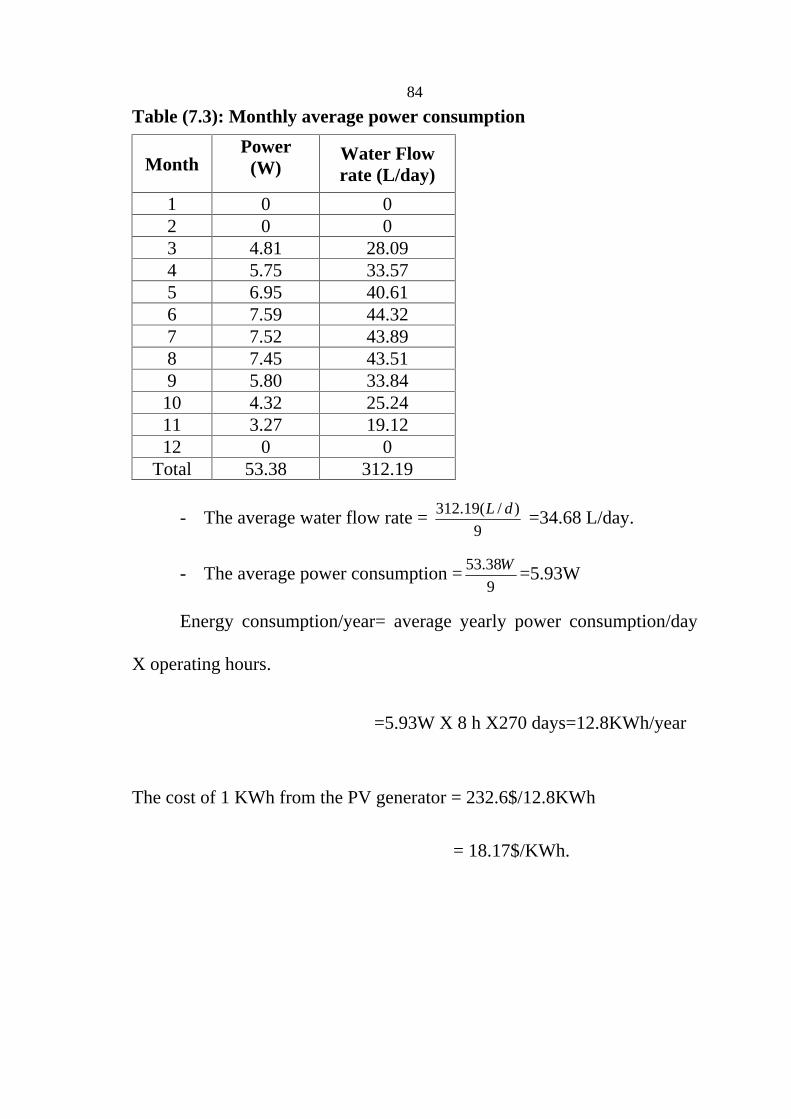
84
Table (7.3): Monthly average power consumption
Month
Power
(W) Water Flow rate (L/day)
1 0 0 2 0 0 3 4.81 28.09 4 5.75 33.57 5 6.95 40.61 6 7.59 44.32 7 7.52 43.89 8 7.45 43.51 9 5.80 33.84 10 4.32 25.24 11 3.27 19.12 12 0 0
Total 53.38 312.19
- The average water flow rate = 9
)/(19.312 dL =34.68 L/day.
- The average power consumption =9
38.53 W =5.93W
Energy consumption/year= average yearly power consumption/day
X operating hours.
=5.93W X 8 h X270 days=12.8KWh/year
The cost of 1 KWh from the PV generator = 232.6$/12.8KWh
= 18.17$/KWh.

85
CHAPTER EIGHT
CONCLUSIONS AND RECOMMENDATIONS

86
Chapter Eight
Conclusions and Recommendations
8.1. Conclusions
The looming water crises in Palestine can be significantly reduced by
the exploitation of the abundant brackish and surface water resources
such as Wadi Fara'a Stream which is a natural catchment of a great
value due to its abundant water resources represented by four groups of
springs that irrigate large areas of agricultural lands.
Palestine has very rich solar radiation intensity. The average annual
daily solar radiation ranges 5 kWh/m2.day which provides the optimal
option to generate the energy demand for small water treatment units in
remote areas.
The combination between renewable energies specially (photovoltaic
cells) and RO Water Treatment Processes very suitable in Palestine for
remote sites lacking of electric grids where water scarcity is a big problem
and, at the same time, the solar energy potential is high.
The pressure output of the pump exit is directly proportional to the
power input to the pump and the power received from the solar panel is
also directly proportional to the solar irradiation.
The rate of production of fresh water by using a photovoltaic-powered
household RO unit without storage batteries under different operating
conditions, varied throughout the day according to the available solar
power.

87
The effect of operating parameters on the reverse osmosis membrane
performance was investigated. It was found that increasing the solar
radiation, pump pressure, and feed water temperature has enhanced the
permeate flux. Increasing the TDS, on the other hand, has reduced the
permeate flux, and the water quality was within the international
standard to be safe drinking water.
The effect on product quality is generally a very small change compared
to the Change observed in productivity when the feed temperature
increased from 33°C to 44°C.
Reverse osmosis membrane is highly effective in removing low total
dissolved solids (TDS) from water at low pressures.
Economically, it was found that although the energy is free, the water
production cost from the PV RO unit is $17/m3 which is still expensive
and can not be economically viable, only in remote areas and far from
conventional energy sources compared to water produced from plants
that run on grid electricity.
It is not economical or practical to provide all energy with PV modules
because the solar radiation in the main three winter months is low.
Large number of PV modules would be in this case required to meet
load requirements for 24h/day. This issue will increase the initial
investment cost and will increase the waste or dumped energy in
summer where the solar radiation is high.

88
One source of renewable energy was not economically viable and could
be used as another source assistant as hybrid system which is
economical and available for 24h/day along the year.
8.2. Recommendations
It is recommended that future work be focused on another Power source
as a wind turbine and can be utilized in such sites where the annual
average wind speed exceeds 5 m/s.
Other sources of water with different characteristics can be also tested.
The effect of fecal concentration can be investigated by changing the
source of water.
Different membrane arrangement such series and parallel configurations
can be also tested to see the effect of recovery.
Design of solar heaters that can heat the feed water prior to membrane
treatment is highly recommended.
89
References
[1] United Nations Environment programme Water Policy and Strategy
of UNEP (viewed on, .
http://www.unep.org/Themes/freshwater/Documents/Water_and_Citie
s Final.pdf), April 2009.
[2] The UN World Water Development Report,"Water in a changing
World" (viewed on www.unesco.org/water/wwap/wwdr3), May 2009.
[3] Thompson, Marry A," Reverse-Osmosis Desalination of Seawater
Powered by Photovoltaic without Batteries", Doctoral Thesis, Lough
borough University, 2003.
[4] Masters G M,"Renewable and Efficient Electric Power Systems",
John Wiley & Sons Ltd, 2004.
[5] Messenger R & Jerry V, "Photovoltaic Systems Engineering", 2nd
Edition CRC Press, 2003.
[6] http://www.palestinemonitor.org/spip/spip.php?article14, May 2009.
[7] Fawzi Naji, Water Crisis in Palestine", (viewed on www.passia.org),
April 2010.
[8] The Applied Research Institute Jerusalem, "Section 3. Current Water
Supply Situation in the West Bank ", Jerusalem, Palestine, October
2006.

90
[9] Muyasar L. Menawee "Microbial Water Quality in Nablus District",
Master Thesis, An-Najah National University, 2004.
[10] Palestinian Water Authority, Water Database (springs and Wells
Data), Ramallah, Palestine (2007).
[11] http://reaquatec.com/technology.html, April 2009.
[12] Allen H., the listons,"Desalination of Water Supply", Bucks SL7 IFD,
U.K, February 2006.
[13]http://www.lenntech.com/microfiltration-and-ultrafiltration.htm, March
2008 .
[14] http://www.ecotechnology.ltd.uk/ecomem/memb5e.htm, August 2008.
[15] http://www.watertiger.net/RO/how_ro_works.htm, June 2009.
[16] http://www.lenntech.com/electrodialysis.htm, June 2009.
[17] Norman N. Li, Anthony G. Fane, W.S Wiston Ho "Advanced
Membrane Technology and Application", Takeshi Matsuura, 2008.
[18] Tiwari, S.A., Bhattacharyya, K.P., Goswami, D., Srivastava V.K., and
Hanra, M.S., "Hydrodynamic Conderation Of Reverse Membrane
Modules & their Merits and Demerits with respect to their
applications", BARC Newsletter, Issue No. 249.
[19] U.S Environmental Protection Agency, Capsule Report, Reverse
Osmosis Process, September 1996.
91
[20] Michael E. Williams, "A Brief Review of Reverse Osmosis
Membrane Technology " , EET Corporation and Williams
Engineering Services Company, 2003.
[21] MIZU TEC, Global Water Technolog," Terms and Equations of
Reverse Osmosis (viewed on http://www.mizutec.com), April 2010.
[22] Khawla A. Al-Shayji, "Modeling, Simulation, and Optimization of
Large-Scale Commercial Desalination Plants", Blacksburg,
Virginia, April 1998.
[23] Michael E. Williams, "A Review of Reverse Osmosis Membrane
Technology " , EET Corporation and Williams Engineering Services
Company, 2003.
[24] Energy Research center (ERC),"Metrological measurements in West
Bank\ Nablus", An-Najah National University, (2005).
[25] Quaschning V., "Understanding Renewable energy systems", earth
scan publishing, UK London, (2005).
[26] Godfrey B., Solar photovoltaics , the Scholar programme for
Photovoltaics in the UK, (2000).
[27] Software package PVSYST V4.0 developed by Center for the Study of
Energy Problems, university of Geneva
[28] Chokechai Chongsiriratanaku, "how to design Solar PV system"
viewed on, .
(http://www.leonics.com/support/article2_12j/articles2_12j_en.php).

92
[29] Mahmoud, Marwan M, "Techno-economic feasibility of energy
supply of remote villages in Palestine by PV-systems diesel
generators and electric grid": Renewable and Sustainable Energy
reviews 10 (2006) 128-138.
[30] Photovoltaic Geographical Information System (PVGIS) developed by
joint Research Centre Institute for Energy, Renewable Energy Unit,
European Comission , (2007).
[31] http://www.water-research.net/ph.htm, February 2009.
[32] El-Dessouky H., and Ettouney, H., "Fundamentals of Salt-water
Desalination", Elsevier, Amsterdam, 2002.
[33] Helal, A.M., Al-Malek S.A., and Al-Katheeri, "E.S., Economic
feasibility of alternative designs of a PV-RO desalination unit for
remote areas in the United Arab Emirates", Desalination, 221
(2008) 1 16.
[34] Leland, P.E., Anthony Tarquin, P.E., Engineering Economy, MC
Graw-Hill companies, fourth edition, 1998.

.
.
2010

.
.
.
) 5(
1-2
55
45
1.2
34.68 /.
.

.
.
$17/.
.

This document was created with Win2PDF available at http://www.win2pdf.com.The unregistered version of Win2PDF is for evaluation or non-commercial use only.This page will not be added after purchasing Win2PDF.