treatment of surface water with hydraulically cleaned re
TRANSCRIPT

Treatment of surface water with hydraulically cleaned re-
verse osmosis modules
Bachelor's thesis
Environmental technology
Visamäki 17 November 2009
Heidi Hyppönen

BACHELOR'S THESIS
Environmental technology Visamäki, Hämeenlinna Title Treatment of surface water with hydraulically cleaned re-
verse osmosis modules Author Heidi Hyppönen Supervised by Harri Mattila Approved on _____._____________.20______ Approved by

ABSTRACT
HÄMEENLINNA Degree programme in Environmental technology Author Heidi Hyppönen Year 2009
Subject of Bachelor’s thesis Treatment of surface water with hydraulically cleaned
reverse osmosis modules ABSTRACT
This thesis is part of AiRO-project which is performed in co-operation with Vitens, KWR Watercycle Research Institute, Hatenboer-Water and Evides. The commissioning organization of this thesis was Vitens. The ob-jective of the AiRo -project is to study a method to clean vertically posi-tioned spiral-wound reverse osmosis membranes hydraulically with a mix-ture of air and water. The objective of this thesis was to study if it is pos-sible to treat surface water with hydraulically cleaned membranes and how much pretreatment is required for stable operation. The first part of the thesis is theoretical framework about membrane tech-niques based on a literature survey. The second part of the thesis is re-search carried out with a reverse osmosis pilot installation. To study the performance of a hydraulically cleaned reverse osmosis module six short-term experiments were performed with different cleaning frequencies and different pretreatment filter pore sizes. It was found out that treatment of surface water is possible with hydraulically cleaned reverse osmosis mod-ules and hydraulic cleaning is an effective way to clean reverse osmosis modules. After air-water cleaning a reduction was observed in transmem-brane pressure and an increase in permeability. Under a high particle load the feed channel pressure drop was reduced efficiently with hydraulic cleaning. According to this study extensive pretreatment is not needed but less pretreatment requires shorter hydraulic cleaning frequency. Also rins-ing water quality was studied and it was found out that after 5 minutes of air-water cleaning the rinsing water quality did not compare to the feed water quality. Further research with long-term experiments is suggested to study the pretreatment requirements and performance of hydraulically cleaned reverse osmosis membrane treating surface water, and air-water cleaning time when surface water is used as rinsing water.
Keywords Reverse osmosis membranes, hydraulic cleaning, fouling. Pages 60 p. + appendices 17 p.

TIIVISTELMÄ
HÄMEENLINNA Ympäristöteknologian koulutusohjelma Tekijä Heidi Hyppönen Vuosi 2009 Työn nimi Pintaveden käsittely hydraulisesti puhdistetuilla käänteisos-
moosikalvoilla TIIVISTELMÄ
Tämä opinnäytetyö on osa AiRO-projektia, jonka yhteistyötahot ovat Vi-tens, Vitens, KWR Watercycle Research Institute, Hatenboer-Water ja Evides. Opinnäytetyön toimeksiantajana toimi Vitens. AiRO-projektin ta-voitteena on tutkia pystysuoraan asennettujen spiraalikierteisten kään-teisosmoosikalvojen puhdistusta hydraulisesti veden ja ilman avulla. Opinnäytetyön tavoitteena oli tutkia onko pintaveden käsittely mahdollista hydraulisesti puhdistetuilla käänteisosmoosikalvoilla ja kuinka laaja esikä-sittely tarvitaan tasaiseen prosessiin. Työn ensimmäisessä osassa on perehdytty yleisesti kalvotekniikkaan käyt-täen lähteinä erilaisia julkaisuja. Työn toinen osa on tutkimus, joka suori-tettiin käänteisosmoosipilottilaitteistolla. Hydraulisesti puhdistettavan käänteisosmoosimoduulin suorituskykyä arvioitiin kuudella lyhytkestoi-sella kokeella, joissa puhdistusväliä ja esikäsittelysuodattimien silmäko-koa muutettiin. Todettiin, että pintaveden käsittely on mahdollista hyd-raulisesti puhdistetuilla käänteisosmoosikalvoilla, ja että hydraulinen puh-distus on tehokas menetelmä käänteisosmoosimoduulin puhdistukseen. Ilma-vesi-puhdistuksen jälkeen havaittiin palautuminen paine-erossa kal-von läpi sekä läpäisevyyden kasvu. Suuren partikkeli kuorman aikana syöttökanavan painepudotus palautui tehokkaasti hydraulisen puhdistuk-sen ansiosta. Tämän tutkimuksen mukaan laajaa esikäsittelyä ei tarvita, mutta suppea esikäsittely vaatii lyhyemmän puhdistusvälin. Myös huuhte-luvedenlaatua tutkittiin ja havaittiin, että viiden minuutin huuhtelun jäl-keen huuhteluvedenlaatu ei vastannut syöttövedenlaatua. Pitkän aikavälin tutkimuksia ehdotetaan esikäsittely tarpeen määritykseen, pintavettä käsit-televän käänteisosmoosilaitteiston suorituskyvyn määrittämiseksi, sekä huuhteluajan määritykseen, kun huuhteluvetenä käytetään pintavettä.
Avainsanat Käänteisosmoosikalvot, hydraulinen puhdistus, tukkeutuminen. Sivut 60 s. + liitteet 17 s.

NOMENCLATURE AWC Abbreviation for air-water cleaning. Cleaning of membrane with mixture of air and water. Concentrate Waste stream with retained components. Also called reten-
tate or brine. Feed Water to be treated which enters the membrane system. In
cross-flow filtration equal to concentrate + permeate. Flow Volume of feed water entering the membrane system, L/h or
m3/h. Flux Permeate flow through membrane, L/h m2. Fouling Clogging of membrane resulting in performance loss. MF Abbreviation for microfiltration. NF Abbreviation for nanofiltration. Osmotic pressure Minimum pressure which prevents the movement of solvent
to the concentrated solution. Permeate Water stream which passes through the membrane. Pressure drop Pressure difference between feed channel and concentrate
channel of membrane. Retentate Another word for concentrate. Retention A percentage of material that is removed. RO Abbreviation for reverse osmosis. Specific flux Flux through membrane divided by transmembrane pressure,
L/m2*h*bar. Transmembrane pressure (TMP) The driving force for membrane filtration. The pressure dif-
ference between feed channel and permeate channel. UF Abbreviation for ultrafiltration.

CONTENTS
1 INTRODUCTION....................................................................................................... 1
2 MEMBRANES............................................................................................................ 2
2.1 Classification of membranes ............................................................................... 2
3 MICROFILTRATION AND ULTRAFILTRATION................................................. 4
3.1 Membrane structure and material........................................................................ 4 3.2 Module configuration.......................................................................................... 4 3.3 Process description.............................................................................................. 6 3.4 Filtration mechanism........................................................................................... 6 3.5 Applications ........................................................................................................ 7
4 REVERSE OSMOSIS ................................................................................................. 8
4.1 Diffusion.............................................................................................................. 8 4.2 Membrane material ............................................................................................. 9 4.3 Membrane configuration ..................................................................................... 9
4.3.1 Spiral-wound membrane element............................................................ 9 4.3.2 Module configuration ............................................................................11
4.4 Process description............................................................................................ 12 4.4.1 Air-water cleaning ................................................................................. 13
4.5 Pretreatment ...................................................................................................... 14 4.5.1 Conventional pretreatment .................................................................... 14 4.5.2 Membrane pretreatment......................................................................... 14 4.5.3 Post-treatment........................................................................................ 15
4.6 Filtration and rejection mechanisms ................................................................. 15 4.7 Applications ...................................................................................................... 16
4.7.1 Desalination........................................................................................... 16 4.7.2 Natural organic material ........................................................................16 4.7.3 Specific contaminants............................................................................ 16 4.7.4 Organic contaminants ............................................................................17
5 MEMBRANE FOULING ......................................................................................... 17
5.1 Particulate fouling ............................................................................................. 17 5.2 Organic fouling ................................................................................................. 18 5.3 Scaling............................................................................................................... 18 5.4 Biofouling.......................................................................................................... 19
6 CALCULATIONS .................................................................................................... 20
6.1 Rejection............................................................................................................ 20 6.2 Recovery............................................................................................................ 21 6.3 Water flux.......................................................................................................... 21
6.3.1 Water flux through reverse osmosis membranes................................... 22 6.3.2 Water flux through micro- and ultrafiltration membrane...................... 23
6.4 Solute flux through membrane.......................................................................... 24 6.5 Silt density index............................................................................................... 24

7 MATERIALS AND METHODS .............................................................................. 25
7.1 Materials............................................................................................................ 25 7.2 The pilot set-up.................................................................................................. 26 7.3 Methods............................................................................................................. 29
7.3.1 Air-water cleaning frequency experiments............................................ 29 7.3.2 Reference experiments .......................................................................... 30
7.4 Parameters ......................................................................................................... 30
8 RESULTS AND DISCUSSION................................................................................ 31
8.1 Feed water quality ............................................................................................. 31 8.2 Permeate quality................................................................................................ 35 8.3 Air-water cleaning experiments ........................................................................ 35
8.3.1 The effect of air-water cleaning on feed channel pressure drop............ 35 8.3.2 The effect of air-water cleaning on transmembrane pressure................ 41 8.3.3 The effect of air-water cleaning on membrane permeability ................ 45
8.4 Reference experiments ...................................................................................... 49 8.5 Rinsing water..................................................................................................... 54
9 CONCLUSIONS ....................................................................................................... 56
SOURCES ...................................................................................................................... 58
APPENDIX 1 Canal Potmarge and intake point. APPENDIX 2 Laboratory results. APPENDIX 3 Turbidity during experiments 1-4 and reference experiments
1-2. APPENDIX 4 Particles during experiments 1-4 and reference experiments
1-2. APPENDIX 5 Retention during experiments 1-4 and reference experiments
1-2. APPENDIX 6 Permeate flux during experiments 1-4 and reference experi-
ments 1-2. APPENDIX 7 Locations of cooperation partners.

Treatment of surface water with hydraulically cleaned reverse osmosis modules
1
1 INTRODUCTION
The application of membrane techniques in water treatment and wastewa-ter treatment is growing. Membrane processes have become better func-tioning and more cost effective than they were a few years ago. Now they are an efficient and reliable way to treat water. (Liikanen 2007, 7.) Due to population growth and increasing demand for water, new methods to cre-ate clean water have to be found. Conventional sources for fresh water such as rivers, lakes, and groundwater are overused or misused. Desalina-tion of salty water and water reuse offer one solution for water shortage. (Greenlee, Lawler, Freeman, Marrot & Moulin, 2009, 2318.) Reverse os-mosis and nanofiltration are established processes for desalination of sea water and brackish water (Liikanen 2007, 7). Not only have the water re-sources become scarce but also the requirements for water quality have tightened. Reverse osmosis and nanofiltration are the finest membranes and they can separate substances from water until ion-level. These mem-branes are applied in water treatment, desalination of seawater and brack-ish water, in recovery of wastewater, and production of water for industry (Van der Kooij, Hijnen & Cornelissen 2009, 19). Membrane processes have one disadvantage. Particles and biomass can accumulate on the membrane and spacer mesh and cause fouling leading to decrease of productivity or increase in pressure drop across the feed channel. Because of this extensive pretreatment is needed and membranes have to be cleaned frequently. Other filtration processes like sand filtra-tion, microfiltration and ultrafiltration, can be cleaned hydraulically and backwashed. Reverse osmosis and nanofiltration processes have not been cleaned hydraulically. (Crittenden, Trussel, Hand, Howe & Tcho-banoglous 2005, 959, 964, 1435.) This thesis is part of AiRO -project which is performed in co-operation with Vitens (The Netherlands), KWR Watercycle Research Institute (The Netherlands), Hatenboer-Water (The Netherlands) and Evides (The Netherlands). The objective of the AiRo -project is to study a method to clean vertically positioned spiral-wound re-verse osmosis membranes with a mixture of air and water. The cleaning process is similar to the one that has been used for ultrafiltration mem-branes: membrane is cleaned by injecting air and water through the bottom section of the element. The objective of this thesis is to study if it is possible to treat surface water with hydraulically cleaned membranes and how much pretreatment is re-quired for stable operation if any is required at all. The first five chapters of the thesis deal with basic information of micro- and ultrafiltration and nanofiltration and reverse osmosis processes. The sixth chapter contains calculations applying to membranes. The materials, methods, results and conclusions of the research are in the chapters 7-9.

Treatment of surface water with hydraulically cleaned reverse osmosis modules
2
2 MEMBRANES
Membrane filtration is a separation technique of which the principle is shown in figure 1. A membrane is a thin layer of material which works as a barrier to certain particles, molecules or substances. It is semipermeable which means that some components can permeate through it and some components are retained by the membrane. As a result of a membrane fil-tration the feed water separates into two streams: the product stream, also called permeate, which contains the permeable components and the waste stream, called concentrate or retentate, which contains the impermeable components. The goal of membrane filtration is to produce a product stream from which the targeted compounds are removed. (Crittenden, Trussel, Hand, Howe & Tchobanoglous 2005, 956-957.) This chapter pre-sents the classification of membranes.
FIGURE 1 The principle of membrane process (Crittenden, Trussel, Hand, Howe &
Tchobanoglous 2005, 956.)
2.1 Classification of membranes
The currently used membrane processes for water treatment are microfil-tration (MF), ultrafiltration (UF), nanofiltration (NF), and reverse osmosis (RO). In all these processes the driving force is the pressure difference be-tween the feed water channel and the permeate channel, also called as transmembrane pressure. The transmembrane pressure is effected by os-motic pressure. The basic difference between membranes is the presence and absence of pores. Membranes can be classified into two processes: micro- and ultrafiltration (MF and UF) and nanofiltration and reverse os-mosis (NF and RO). (Crittenden, Trussel, Hand, Howe & Tchobanoglous 2005, 956-957, 964.) Figure 2 shows the classification of membranes.

Treatment of surface water with hydraulically cleaned reverse osmosis modules
3
The differences between MF/UF and NF/RO processes are noticeable. The basic difference is that MF/UF are porous membranes and NF/RO are considered not to have pores. MF/UF is mainly used for particle removal and NF/RO achieves much bigger variety of removed substances includ-ing dissolved solutes. Because the size of rejected particles is different the applications of MF/UF and NF/RO differ too. MF/UF is used for removal of particles and micro-organisms and NF/RO is used for seawater and brackish water desalination, softening, natural organic matter removal or removal of toxic compounds or specific contaminants. Consequently the typical source water for reverse osmosis and nanofiltration is seawater or brackish water and for micro- and ultrafiltration it is surface water but also NF/RO membranes are used for surface water. MF/UF are porous so the flux through membrane is higher and applied pressure is lower than in NF/RO. The main separation method for MF/UF is straining, in other words separation by particle size. In NF/RO separation is based on differ-ences in solubility or diffusivity. Membranes are used for many purposes in variety of fields and industries and the difference between membrane filtration and reverse osmosis as used in water treatment might not be correct for other industries. (Critten-den, Trussel, Hand, Howe & Tchobanoglous 2005, 956-958, 1430.) In this thesis membranes are observed only from the water treatment sector’s point of view.
FIGURE 2 The classification of membrane processes (Crittenden, Trussel, Hand,
Howe & Tchobanoglous 2005, 957).

Treatment of surface water with hydraulically cleaned reverse osmosis modules
4
3 MICROFILTRATION AND ULTRAFILTRATION
Microfiltration and ultrafiltration are used mainly for particle removal. In early days of membrane filtration the application of MF/UF were limited, consisting only of MF/UF membrane process and disinfection. This treat-ment was used for waters which needed only particle removal and disin-fection. Now micro- and ultrafiltation is combined with other processes and it can be used for different source waters. (Crittenden, Trussel, Hand, Howe & Tchobanoglous 2005, 1011.) MF/UF is also used as pretreatment for nanofiltration and reverse osmosis processes (Liikanen 2007, 8). In this chapter the focus is on microfiltration and ultrafiltration and their structure and material, module configuration, process description, filtration mecha-nisms, and application.
3.1 Membrane structure and material
In water treatment membrane filtration is often performed through hollow fiber membranes. Hollow fibers are very thin tubes. Their outside diameter ranges from 0,5 to 2 mm and the wall thickness ranges from 0,07 to 0,6 mm. There are also other configurations such as flat sheet, tubular, or spi-ral-wound membranes. The configuration of membrane defines its packing density. The benefit of membranes is that they have a big surface area per volume of equipment so they are compact. They need less space than tra-ditional water treatment processes. For example with hollow fibers 1 m² of footprint may contain as much as 100 m² of membrane area. (Crittenden, Trussel, Hand, Howe & Tchobanoglous 2005, 964, 966.) The type of material used for membrane is important. It has strong effect on membrane performance. An ideal membrane has many characteristics: it should be able to produce high flux through membrane without fouling, it should be physically durable, chemically durable and stable, non-degradable, and cheap. Many different materials are used for membranes. Most common materials used for water treatment are polypropylene (PP), polyvinylidene fluoride (PVDF), polysulfone (PS), polyethersulfone (PES), and cellulose acetate (CA). These materials are used in water treatment but different kinds of materials are used for other industries for example ceramic materials. (Crittenden, Trussel, Hand, Howe & Tcho-banoglous 2005, 980-981, 983-984.)
3.2 Module configuration
Membrane modules are made by putting thousands of hollow fibers into a module. One module can contain 8 to 700 m2 of membrane area. These modules are set up either in pressure-vessel systems or submerged sys-tems. In pressure-vessel systems membranes are put into a pressure-vessel shell and shells are arranged in skids or racks. One skid or rack can con-

Treatment of surface water with hydraulically cleaned reverse osmosis modules
5
tain from 2 to 300 pressure-vessel modules depending on production re-quirements. To generate driving force, transmembrane pressure, feed wa-ter is pumped with high pressure to the feed side of membrane while per-meate side stays at atmospheric pressure. Due to the pressure difference between the feed and permeate, water is transported through the mem-brane. (Crittenden, Trussel, Hand, Howe & Tchobanoglous 2005, 966-968.) Figure 3 shows a typical pressure-vessel configuration.
FIGURE 3 A pressure-vessel system mounted on rack (Shubham Inc.).
In submerged systems modules are placed in an open feed tank. Driving force is created by applying a negative pressure on the permeate side of the membrane. These systems are also called sometimes vacuum-based systems. (Crittenden, Trussel, Hand, Howe & Tchobanoglous 2005, 966-969.) A submerged module is shown in picture 4. Both systems have advantages. Submerged systems are in larger modules than pressure-vessel systems but they need less valves and piping. In pres-sure-vessels each module has to be piped separately for permeate and feed water. Submerged systems operate with individual tanks which can be op-erated separately so during cleaning or maintenance the whole production does not have to be stopped. (Crittenden, Trussel, Hand, Howe & Tcho-banoglous 2005, 967, 969, 971.)

Treatment of surface water with hydraulically cleaned reverse osmosis modules
6
FIGURE 4 Picture of submerged module for wastewater treatment (Koch membrane systems 2008).
3.3 Process description
The water that passes through membrane becomes the product water, per-meate, and the retained water on the feed side is called concentrate or re-tentate. Since the membrane pores are too small to allow the solids in the feed to go through the membrane, the solids will accumulate on the mem-brane over time. This causes the transmembrane pressure to increase or the flux to decline. To prevent the pressure from becoming too high mem-brane plants operate with backwash and filtration cycles. During the backwash air and/or water is pumped from the permeate side to the feed side of the module. Backwash removes the accumulated material from the membrane surface. After backwashing the filtration process starts again. (Crittenden, Trussel, Hand, Howe & Tchobanoglous 2005, 964.) However, backwash does not remove all substances from the surface and so gradually more and more material is present on the membrane. This re-sults in a loss in the membrane performance which is also called fouling. To remove fouling membranes are cleaned with chemicals. Cleaning is carried out by soaking the membranes into a washing solution containing surfactants, acids or bases. Membranes are cleaned regularly but the wash-ing frequency depends on feed water quality, the process settings and membrane material. It ranges from few days to months. Even with chemi-cal cleaning membranes have a limited life-time. Chemical cleaning and accumulation of material make the membrane fragile and it starts to de-grade so finally membrane has to be replaced. (Crittenden, Trussel, Hand, Howe & Tchobanoglous 2005, 964-966.)
3.4 Filtration mechanism
The main filtration mechanism for membrane filtration is sieving but sepa-ration occurs also through adsorption and cake formation. The principle of

Treatment of surface water with hydraulically cleaned reverse osmosis modules
7
sieving is that particles big enough do not pass the membrane pores and they are retained on the surface. Cake is formed on the surface when big-ger particles are first strained on the surface and block the way from smaller ones that could pass the membrane pores. Adsorption occurs when small material enters the pores and is adsorbed on the pore walls. (Critten-den, Trussel, Hand, Howe & Tchobanoglous 2005, 984.)
3.5 Applications
Micro- and ultrafiltration are mainly a particle and micro-organism re-moval processes. Even though for viruses the rejection is not complete, MF and UF provide good hygiene quality of water regarding bacteria, pro-tozoa and algae. In drinking water treatment membrane filtration can re-place coagulation-settling, sand filtration and disinfection processes and MF/UF can be used as pretreatment for nanofiltration and reverse osmosis. Possible source waters for MF/UF can be fresh surface water, waste water, or ground water. When no other demand for water quality is present than particulate removal, pretreatment for membrane filtration is minimal. To prevent clogging of fiber tubes and damaging fiber material, the feed wa-ter will be prefiltered with cartridge filters or microscreens. Because parti-cles are removed by physically straining them, chemical addition like co-agulation is not mandatory. This saves costs for treatment plants with re-spect to chemical handling because changes in feed water quality do not effect on membrane filtration as much as conventional treatment. (Critten-den, Trussel, Hand, Howe & Tchobanoglous 2005, 975, 1020. Liikanen 2007, 8.) Micro- and ultrafiltration are also used to remove more challenging com-ponents from the feed water for example organic material or taste and odour. For organic matter micro- and ultrafiltration by themselves are usu-ally not sufficient. Removal of organics with micro- or ultrafiltration is limited to 10-30 % depending on membrane and source water. With tighter ultrafiltration membranes the removal of organic matter may be 60-70 %. Organic matter removal can be improved by using coagulant pre-treatment or powdered activated carbon-membrane reactors. In submerged systems the coagulant or activated carbon can be added to the feed tank. In pressure-vessel systems coagulation and activated carbon can be added straight into the feed water before membrane modules. (Crittenden, Trus-sel, Hand, Howe & Tchobanoglous 2005, 1011-1013. Liikanen 2007, 8-9.) In post-treatment pH is adjusted and disinfectant is usually added to pre-vent microbial growth in the distribution system (Crittenden, Trussel, Hand, Howe & Tchobanoglous 2005, 1021-1022. Liikanen 2007, 8).

Treatment of surface water with hydraulically cleaned reverse osmosis modules
8
4 REVERSE OSMOSIS
Reverse osmosis membranes are the finest membranes. They are applied in water treatment, in desalination of sea or brackish water, for waste wa-ter reclamation and for water production for industry (Van der Kooij, Hi-jnen & Cornelissen 2009, 19). This chapter deals with reverse osmosis in-cluding nanofiltration and reverse osmosis describing diffusion, membrane material, membrane configuration, process description, pretreatment, fil-tration and rejection mechanisms, and applications.
4.1 Diffusion
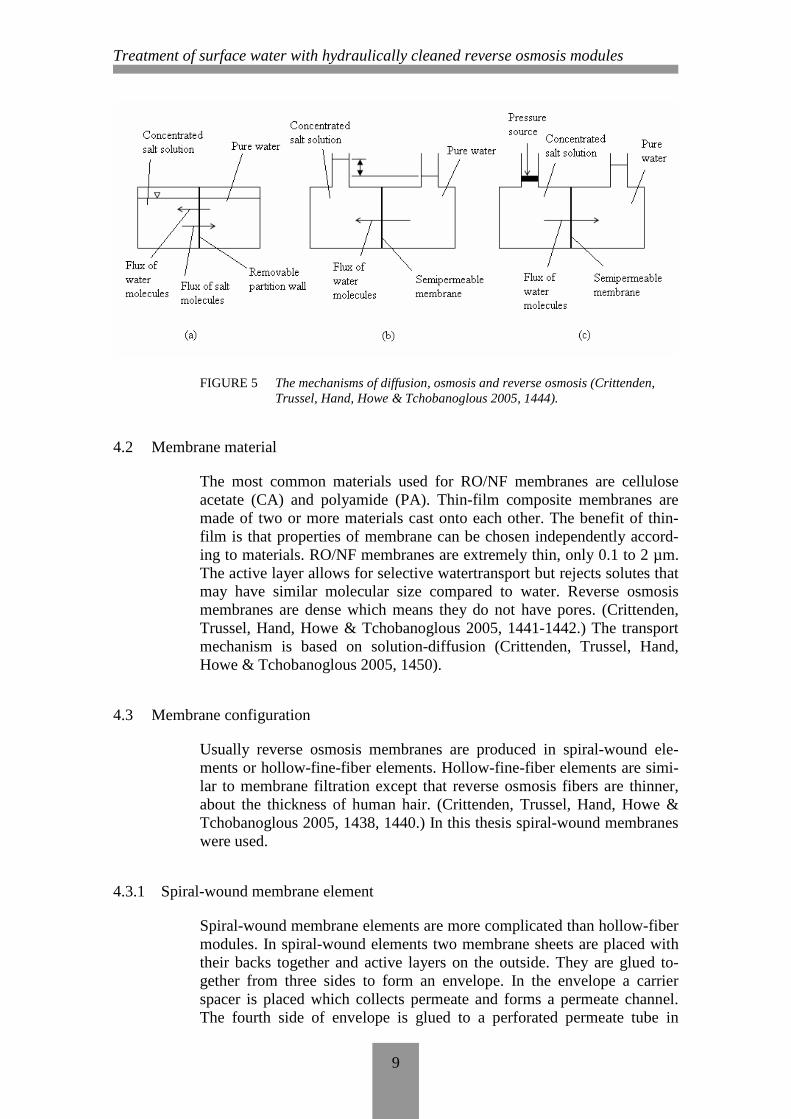
Reverse osmosis is based on diffusion. Osmosis is diffusion through a semi-permeable membrane. Figure 5 shows the differences between diffu-sion, osmosis and reverse osmosis. In figure 5a a wall separates two liq-uids. One liquid is pure water and the other one is a solution of a salt in water. When the wall is removed the water mass is in an unbalanced state and it will go back into an equilibrium state. Salt molecules start to move to pure water side on the right and water molecules will move to the left side. The movement of salt molecules from high concentration to low con-centration is called diffusion. If there is a semi-permeable membrane between solutions as in figure 5b, only the water molecules can move. The membrane prevents the move-ment of salt ions. The balance is regained by water flowing to the left side. As a result, the water level on the concentrated side rises. The flow of wa-ter from low concentration to high concentration through a semi-permeable membrane is called osmosis. In figure 5c the concentrated side is pressurized and the water molecules are forced to permeate through the membrane to the pure water side. The flow of water from a high concen-tration to a low concentration through semi-permeable membrane by ap-plying an external force is called reverse osmosis. Between two solutions with different concentrations a difference in os-motic pressure exists. The osmotic pressure is the minimum pressure which prevents the movement of water molecules to the concentrated solu-tion. To make reverse osmosis possible the external pressure has to exceed osmotic pressure. When osmotic pressure and external pressure are equal, no water is flowing. When external pressure exceeds the osmotic pressure, the water starts to flow from left to right. (Crittenden, Trussel, Hand, Howe & Tchobanoglous 2005, 1444-1445, 1448, 1450.)
Treatment of surface water with hydraulically cleaned reverse osmosis modules
9
FIGURE 5 The mechanisms of diffusion, osmosis and reverse osmosis (Crittenden, Trussel, Hand, Howe & Tchobanoglous 2005, 1444).
4.2 Membrane material
The most common materials used for RO/NF membranes are cellulose acetate (CA) and polyamide (PA). Thin-film composite membranes are made of two or more materials cast onto each other. The benefit of thin-film is that properties of membrane can be chosen independently accord-ing to materials. RO/NF membranes are extremely thin, only 0.1 to 2 µm. The active layer allows for selective watertransport but rejects solutes that may have similar molecular size compared to water. Reverse osmosis membranes are dense which means they do not have pores. (Crittenden, Trussel, Hand, Howe & Tchobanoglous 2005, 1441-1442.) The transport mechanism is based on solution-diffusion (Crittenden, Trussel, Hand, Howe & Tchobanoglous 2005, 1450).
4.3 Membrane configuration
Usually reverse osmosis membranes are produced in spiral-wound ele-ments or hollow-fine-fiber elements. Hollow-fine-fiber elements are simi-lar to membrane filtration except that reverse osmosis fibers are thinner, about the thickness of human hair. (Crittenden, Trussel, Hand, Howe & Tchobanoglous 2005, 1438, 1440.) In this thesis spiral-wound membranes were used.
4.3.1 Spiral-wound membrane element
Spiral-wound membrane elements are more complicated than hollow-fiber modules. In spiral-wound elements two membrane sheets are placed with their backs together and active layers on the outside. They are glued to-gether from three sides to form an envelope. In the envelope a carrier spacer is placed which collects permeate and forms a permeate channel. The fourth side of envelope is glued to a perforated permeate tube in

Treatment of surface water with hydraulically cleaned reverse osmosis modules
10
which permeate is collected. Between envelopes are feed spacers that separate the envelopes from each other and create a feed channel and give rise to turbulent flow of the feed water. Envelopes are wound around per-meate tube. During operation feed water enters the feed channel and part of the water penetrates through the membrane and spirals its way to the permeation tube. Part of the water exits on the other end of module as concentrate and continues to the next element. (Crittenden, Trussel, Hand, Howe & Tchobanoglous 2005, 1438-1440. Van der Kooij, Hijnen & Cor-nelissen 2009, 21.) Figure 6 shows the construction of spiral-wound mem-brane and figure 7 demonstrates the cross-cut of spiral-wound membrane. Spiral-wound membranes operate with cross-flow filtration in which the feed flow is parallel to the membrane surface and permeate flow is per-pendicular to membrane. Spiral-wound elements are available in different diameters. The most common diameter is about 20 cm (8’’) with length of 1 m. This kind of element with 24 envelopes of 0.75 cm width and 1 m length has membrane area of 36 m². (Van der Kooij, Hijnen & Cornelissen 2009, 30.)
FIGURE 6 Spiral-wound reverse osmosis membrane element (Hallsby 2006).

Treatment of surface water with hydraulically cleaned reverse osmosis modules
11
FIGURE 7 A cross-cut of spiral-wound membrane (Hallsby 2006).
4.3.2 Module configuration
Spiral-wound elements are usually arranged in pressure vessels containing six to eight element in series (Van der Kooij, Hijnen & Cornelissen 2009, 21). An example of these pressure vessels is shown in figure 8. Elements in a pressure vessel are connected together so that the permeate tubes are attached. From the first membrane element the concentrate continues to the feed channel of the next element and so on until the concentrate has flowed through all the elements and exits the vessel. When the water flows through the feed channel to the next element, it generates a pressure drop. (Crittenden, Trussel, Hand, Howe & Tchobanoglous 2005, 1440.) As foul-ing develops the pressure drop will increase (Van der Kooij, Hijnen & Cornelissen 2009, 27).
FIGURE 8 Reverse osmosis pressure-vessels in water treatment plant in USA (Comp-ton engineering 2007).

Treatment of surface water with hydraulically cleaned reverse osmosis modules
12
4.4 Process description
Reverse osmosis process is similar to other membrane processes. Water enters the system from other end and the stream divides into permeate and concentrate streams. The driving force in reverse osmosis is the pressure difference between applied and osmotic pressure differentials as presented in formula 1 (Crittenden, Trussel, Hand, Howe & Tchobanoglous 2005, 1454). FORMULA 1 Reverse osmosis driving force for water flux through membrane (Critten-
den, Trussel, Hand, Howe & Tchobanoglous 2005, 1454).
)()( PFPFNET PPPP πππ −−−=∆−∆=∆
in which,
NETP∆ = net transmembrane pressure, bars
P∆ = pressure difference, bars π∆ = osmotic pressure difference, bars
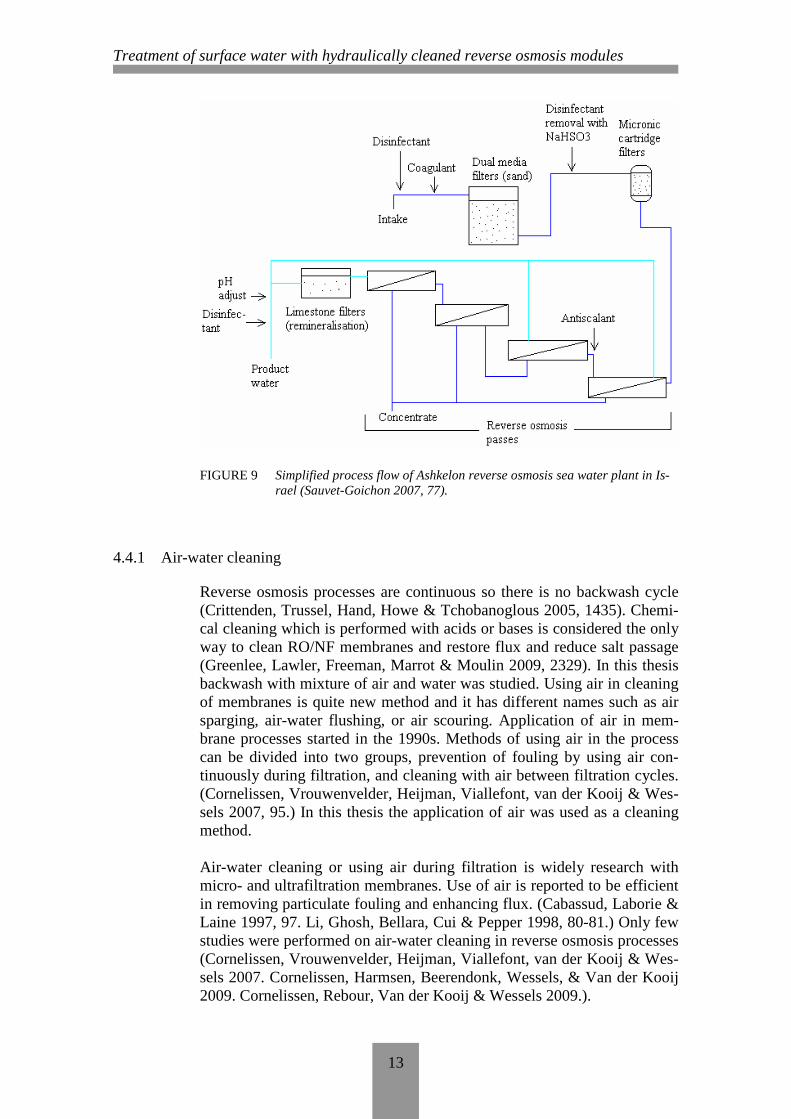
The subscripts p and f refer to permeate and feed, respectively. Reverse osmosis membranes are operated in pressure vessels. A group of pressure vessels operated parallel is called a stage. From a stage either the concentrate or permeate can be directed to next stage. If the concentrate is directed to the next stage it increases the recovery and it’s called a multi-stage system. If the permeate is fed to next stage it’s called a two-pass sys-tem. This will increase the permeate quality. (Crittenden, Trussel, Hand, Howe & Tchobanoglous 2005, 1435-1436.) For sea water desalination re-verse osmosis plant operates with one- or two-pass systems. These days many plants are using only one-pass but the number of passes depends on production water quality standards. Some plants might even have to use four-passes. (Greenlee, Lawler, Freeman, Marrot & Moulin 2009, 2331.) Figure 9 shows the flow diagram of Ashkelon reverse osmosis sea water plant in Israel which uses four-pass system. It’s the largest reverse osmosis desalination plant in the world with 330000 m3 of drinking water per day. (Sauvet-Goichon 2007, 75.) The use of staging differs with brackish and sea water. Brackish water uses stage system in which the concentrate is feed water to the next stage but sea water uses permeate as feed to the next pass (Greenlee, Lawler, Freeman, Marrot & Moulin 2009, 2331, 2335). The next section describes the air-water cleaning of NF/RO membranes.
Treatment of surface water with hydraulically cleaned reverse osmosis modules
13
FIGURE 9 Simplified process flow of Ashkelon reverse osmosis sea water plant in Is-
rael (Sauvet-Goichon 2007, 77).
4.4.1 Air-water cleaning
Reverse osmosis processes are continuous so there is no backwash cycle (Crittenden, Trussel, Hand, Howe & Tchobanoglous 2005, 1435). Chemi-cal cleaning which is performed with acids or bases is considered the only way to clean RO/NF membranes and restore flux and reduce salt passage (Greenlee, Lawler, Freeman, Marrot & Moulin 2009, 2329). In this thesis backwash with mixture of air and water was studied. Using air in cleaning of membranes is quite new method and it has different names such as air sparging, air-water flushing, or air scouring. Application of air in mem-brane processes started in the 1990s. Methods of using air in the process can be divided into two groups, prevention of fouling by using air con-tinuously during filtration, and cleaning with air between filtration cycles. (Cornelissen, Vrouwenvelder, Heijman, Viallefont, van der Kooij & Wes-sels 2007, 95.) In this thesis the application of air was used as a cleaning method. Air-water cleaning or using air during filtration is widely research with micro- and ultrafiltration membranes. Use of air is reported to be efficient in removing particulate fouling and enhancing flux. (Cabassud, Laborie & Laine 1997, 97. Li, Ghosh, Bellara, Cui & Pepper 1998, 80-81.) Only few studies were performed on air-water cleaning in reverse osmosis processes (Cornelissen, Vrouwenvelder, Heijman, Viallefont, van der Kooij & Wes-sels 2007. Cornelissen, Harmsen, Beerendonk, Wessels, & Van der Kooij 2009. Cornelissen, Rebour, Van der Kooij & Wessels 2009.).

Treatment of surface water with hydraulically cleaned reverse osmosis modules
14
4.5 Pretreatment
Pretreatment is required basically in all reverse osmosis systems (Critten-den, Trussel, Hand, Howe & Tchobanoglous 2005, 1436). The goal for pretreatment is to prevent fouling on the membrane (Greenlee, Lawler, Freeman, Marrot & Moulin 2009, 2329). The next sections describe meth-ods for pretreatment and post-treatment.
4.5.1 Conventional pretreatment
Conventional pretreatment for sea and brackish water usually consists of chemical addition, disinfection, media filtration and cartridge filtration. The extent of pretreatment depends on source water. Chemical addition depends on the source water quality. Coagulant dosing is added if water will be filtered with media filtration like sand filtration. Disinfection is used to prevent biofouling. Not all the membrane materials tolerate disin-fection chemicals so the chemical has to be removed before membrane for example with activated carbon or sodium bisulfite. Scaling control is be-fore or after cartridge filtration. Scaling control consists of pH adjustment and/or antiscalant dosing. This is done to prevent precipitation of salts on the membrane. During operation the concentrate side becomes more con-centrated with salt and the salt concentration can become higher than the salt’s solubility. Then the salts may start to precipitate and damage the membrane. With pH adjustment the goal is to change the solubility of salts and antiscalants prevent the precipitate formation or crystallization. pH ad-justment is done with acid at the same time with coagulant dosing. Car-tridge filtration is the last pretreatment step and it is applied to remove the larger particles that passed media filtration. (Crittenden, Trussel, Hand, Howe & Tchobanoglous 2005, 1436-1437. Van der Kooij, Hijnen & Cor-nelissen 2009, 22. Greenlee, Lawler, Freeman, Marrot & Moulin 2009, 2329-2330.) The flow diagram of Ashkelon reverse osmosis sea water plant in figure 9 shows a conventional pretreatment process. When reverse osmosis is used for surface water, biofiltration (sand) with coagulation is commonly used as part of pretreatment. Variable combina-tions of ozonation, sedimentation and activated carbon filtration with biofiltration are used in pretreatment process. (Van der Kooij, Hijnen & Cornelissen 2009, 46-47.)
4.5.2 Membrane pretreatment
A new method for pretreatment is the use of micro- or ultrafiltration. They give defined protection against particles. Membrane filtration has the ad-vantage of non-chemical treatment and it can replace the granular filtration of conventional pretreatment which needs chemical dosing. Micro- and ul-trafiltration membranes have also backwash possibility. They are more flexible to changes in feed water quality than conventional pretreatment methods. Because of the good rejection of micro- and ultrafiltration, re-verse osmosis membranes age slower. (Greenlee, Lawler, Freeman, Mar-

Treatment of surface water with hydraulically cleaned reverse osmosis modules
15
rot & Moulin 2009, 2330-2331.) Recent studies show that ultrafiltration has become the most tested and studied membrane filtration pretreatment (Van Hoof, Minnery, Mack 2001, 164-166. Halper, McArdle & Antrim 2005). The disadvantage of pretreatment with membrane filtration is foul-ing of the pretreatment membranes themselves. Fouling can be reduced by the use of inline coagulation. Coagulant can not be applied at the same time with antiscaling agent. Coagulant and antiscaling chemical form to-gether a complex which is a very difficult foulant. (Greenlee, Lawler, Freeman, Marrot & Moulin 2009, 2330-2331.) Ultrafiltration has yet an-other disadvantage. According to studies, ultrafiltration results in a very good rejection of particles but it does not remove material that causes bio-fouling. (Van der Kooij, Hijnen & Cornelissen 2009, 46, 49. Vrouwen-velder, van Paassen, van Agtmaal, van Loosdrecht, Kruithof 2009, 41-42).
4.5.3 Post-treatment
Post-treatment for product water is simple. It consists of pH adjustment, possible removal of gases, and remineralization. Depending on salt con-centration the permeate might be blended with another water to increase or decrease the salinity. Hardness will be increased to achieve the typical taste of drinking water. Alkalinity and pH are also adjusted to prevent cor-rosion. Dissolved gases permeate well through membrane and if the source water contains hydrogen sulphide it will be stripped. Also disinfec-tant is added to prevent microbial growth in distribution network. (Crit-tenden, Trussel, Hand, Howe & Tchobanoglous 2005, 1437-1438. Green-lee, Lawler, Freeman, Marrot & Moulin 2009, 2336-2337.)
4.6 Filtration and rejection mechanisms
With nonporous reverse osmosis membranes the flux through membrane is different than in MF/UF. First the water is adsorbed on the membrane surface, then it diffuses through membrane and desorbs on the permeate side. This model is called solution-diffusion model. With nanofiltration membranes the flux is a combination of diffusion and the same pore flow-method as in micro-, and ultrafiltration. (Crittenden, Trussel, Hand, Howe & Tchobanoglous 2005, 1450-1451. Greenlee, Lawler, Freeman, Marrot & Moulin 2009, 2322-2323.) Although the newest studies present, that flux through nanofiltration membranes is more controlled by diffusion (Greenlee, Lawler, Freeman, Marrot & Moulin 2009, 2322). Rejection can occur in different ways. Most common mechanisms are electrostatic rejection at the membrane surface, solubility and diffusivity through membrane or straining. Nanofiltration and reverse osmosis mem-branes are often negatively charged so negatively charged ions may be re-jected based on electrostatic repulsion and positively charged ions may be rejected to sustain electroneutrality in the feed and permeate side. Polar and hydrogen-bondable functional groups in membrane increase the solu-bility of polar compounds, such as water, and develop larger flux of water through the membrane. Large molecules have lower diffusivity through

Treatment of surface water with hydraulically cleaned reverse osmosis modules
16
membrane or they are not able to pass the membrane at all. (Crittenden, Trussel, Hand, Howe & Tchobanoglous 2005, 1453.)
4.7 Applications
Reverse osmosis processes are used for many different applications be-cause of their tight membrane and ability to reject various compounds. Next sections deal with applications of reverse osmosis and nanofiltration membranes including desalination, natural organic material removal, spe-cific contaminant removal and organic contaminant removal.
4.7.1 Desalination
The main application for reverse osmosis is desalination of sea water or removal of dissolved solids. Total dissolved solids means the sum of ions in the solution (Crittenden, Trussel, Hand, Howe & Tchobanoglous 2005, 18, 77). Different types of membranes are used for different product water. To produce demineralised water high rejection type reverse osmosis membrane is used. If the product water is normal drinking water then more loose type of reverse osmosis or nanofiltration membrane is used. (Van der Kooij, Hijnen & Cornelissen 2009, 24.) Even though other tech-niques for desalination exist reverse osmosis seems to be the main tech-nique in the future (Greenlee, Lawler, Freeman, Marrot & Moulin 2009, 2322).
4.7.2 Natural organic material
Other application is removal of natural organic material (NOM). When NOM gets contact with disinfectants, harmful disinfection by-products (DBP) are formed. Generally NOM is easier to remove from water than by-products. Colour removal has been very effective with nanofiltration and colour is usually caused by organic material. This makes nanofiltra-tion effective process to control disinfection by-products. Nanofiltration has been also used for softening in USA for three decades. (Crittenden, Trussel, Hand, Howe & Tchobanoglous 2005, 1433. Liikanen 2007, 8. Van der Kooij, Hijnen & Cornelissen 2009, 24.)
4.7.3 Specific contaminants
Reverse osmosis can also remove specific contaminants. One common ap-plication is nitrate removal from ground water. With reverse osmosis membrane the rejection can be between 73-93 %. With nanofiltration the rejection is not so good so they are not usually used for this application. Reverse osmosis is also used for fluoride and arsenic removal. (Van der Kooij, Hijnen & Cornelissen 2009, 24.) In Finland at the water treatment plant in Laitila reverse osmosis is used for fluoride removal from ground water. Reverse osmosis reduces the fluoride concentration by more than 95 %. At the same time it reduces the aluminum concentration to approv-

Treatment of surface water with hydraulically cleaned reverse osmosis modules
17
able level. Because the rejection of fluoride is so high, the targeted level is reached easily by mixing the reverse osmosis water with pre-treated water. (Liikanen 2007, 8.)
4.7.4 Organic contaminants
Reverse osmosis is able to remove organic contaminants such as pesti-cides, pharmaceutically active compounds and personal care products. Re-tention of these contaminants depends on solute properties, membrane properties and operating conditions. Generally these compounds are re-moved very well with both nanofiltration and reverse osmosis. (Van der Kooij, Hijnen & Cornelissen 2009, 25.) However, use of reverse osmosis to remove specific contaminants is not very cost effective because other cheaper techniques exist and disposal of concentrate might be challenging (Crittenden, Trussel, Hand, Howe & Tchobanoglous 2005, 1433).
5 MEMBRANE FOULING
Fouling is the most important issue for membrane applications. It causes flux decline and shortens the membrane life. Fouling can be categorized by different characters: mechanism, reversibility and foulants. (Crittenden, Trussel, Hand, Howe & Tchobanoglous 2005, 993, 994.) Surface fouling and fouling in pores are the two fouling mechanisms that are commonly detected. Fouling causes water flux decline, increase of transmembrane pressure drop and feed channel pressure drop, and salt passage through NF/RO membranes. (Greenlee, Lawler, Freeman, Marrot & Moulin 2009, 2327). Permanent loss of performance after cleaning is called irreversible fouling. Reversible fouling is fouling that could be removed by backwash-ing or cleaning. (Crittenden, Trussel, Hand, Howe & Tchobanoglous 2005, 994.) The next sections describe four common types of fouling: particulate fouling, organic fouling, scaling, and biofouling.
5.1 Particulate fouling
Source water for reverse osmosis is often sea water or brackish water and compared to fresh surface waters sea water has less particle content. How-ever sea water treatment plants that treat water from open water intake are typically fouled by particles and organic matter. Particle fouling is caused by sand, sludge, silicates, salt precipitates and remains of micro-organisms. Particle fouling causes cake formation on the membrane and plugging in the feed channel or piping. From micro- and ultrafiltration membranes particle fouling is easy to remove with backwash but NF/RO processes do not have a backwash cycle. Big part of particles exits the membrane in the concentrate because of turbulence flow in the membrane elements. If the load of particles is too big or there is not enough turbu-lence, particles will start accumulating which results in salt passage through NF/RO membrane, pressure drop over membrane elements and a decrease in water flux. Ultrafiltration and microfiltration as a pre-

Treatment of surface water with hydraulically cleaned reverse osmosis modules
18
treatment for reverse osmosis give excellent particle removal. (Crittenden, Trussel, Hand, Howe & Tchobanoglous 2005, 1468. Greenlee, Lawler, Freeman, Marrot & Moulin 2009, 2327-2328. Van der Kooij, Hijnen & Cornelissen 2009, 26.)
5.2 Organic fouling
Natural organic matter is a term often used when describing organic mate-rial. Natural organic matter (NOM) is a term used to characterize a com-plex group of organic chemicals originating from biological activity in wa-ter bodies such as metabolic activity of algae or micro-organisms. It can also be washed from land into water. It is composed of biological matter, reaction products between NOM molecules or reaction products between NOM molecules and inorganic components. This makes it very complex mixture of different chemical features. (Crittenden, Trussel, Hand, Howe & Tchobanoglous 2005, 81-82.) NOM consists of particles, biological ma-terial and dissolved organic compounds. It can be partly removed by backwashing from MF/UF membranes (Crittenden, Trussel, Hand, Howe & Tchobanoglous 2005, 998, 1000-1001). Also coagulation and activated carbon treatment as part of MF/UF can help to reduce organic content and thus decrease fouling. In NF/RO processes NOM precipitates and adsorbs on the membrane sur-face and causes decrease in water flux (Van der Kooij, Hijnen & Cornelis-sen 2009, 27). Organic fouling can be reduced by pretreatment with biofil-tration or very tight ultrafiltration membranes are also able to reduce the organic load (Liikanen 2007, 8. Mosqueda-Jimenez, Huck 2009, 65).
5.3 Scaling
Scaling is fouling by inorganic substances. Scaling occurs when the con-centration of salts exceeds the solubility and they start to precipitate. They crystallize on the membrane surface. Micro- and ultrafiltration membranes allow salts to permeate through the membrane so the salt concentration will not rise on the membrane surface. Scaling is mainly a problem of NF/RO membrane processes. Scaling on membrane is shown in figure 10. In sea and brackish water there are lots of inorganic ions. The main ions are calcium, magnesium and barium. Concentration polarization is a phe-nomenon which occurs when dissolved ions accumulate in a thin layer of the feed water. It is the ratio of salt concentration at the membrane surface and in the bulk solution. Concentration polarization decreases water flux through membrane and increases salt transport through membrane. It leads also to scaling. Water flux declines because higher concentration on the membrane surface causes higher osmotic pressure which leads to the over-all pressure difference decrease. Salt transport increases due to increase in concentration and decrease in water flux. Scaling is prevented by using an-tiscalants which increase the threshold of concentration when the ions start to crystallize and disturb the formation of crystal structure. (Crittenden, Trussel, Hand, Howe & Tchobanoglous 2005, 1462, 1470. Greenlee,

Treatment of surface water with hydraulically cleaned reverse osmosis modules
19
Lawler, Freeman, Marrot & Moulin 2009, 2323, 2327-2328. Van der Kooij, Hijnen & Cornelissen 2009, 26.)
FIGURE 10 Scaling of spiral-wound membrane (WaterForum Online 2005).
5.4 Biofouling
Biofouling is accumulation and attachment of micro-organisms on mem-brane surface where they form a biofilm. Biofouling is troublesome be-cause it can not be controlled by reducing microbes in the feed water. If there is any microbe left, it will multiply as long as nutrients are available. (Crittenden, Trussel, Hand, Howe & Tchobanoglous 2005, 1001. Flem-ming 1997, 382.) Part of NOM can be used by micro-organisms as nutri-ent. Assimilable organic carbon (AOC) is ready to use energy source for microbes and if it’s available in big concentrations that means that mi-crobes have a lot of potential to grow. So the biofouling potential can be derived from nutrient concentration in the system. (Van der Kooij, Hijnen & Cornelissen 2009, 27, 45-46.) A biofilm is formed always when micro-organisms have a surface to at-tach. Micro-organisms can attach to the membrane and they are difficult to remove during backwash. On the membrane they start to excrete gel-like extracellular material that protects them from cleaning and results in addi-tional fouling. The possibilities to prevent biofouling are disinfection, bio-cide dosing and nutrient reduction by biofiltration. Disinfection kills mi-cro-organisms but if the dead biomass is not removed a new biofilm will grow on it fast using the biodegradable compounds from the dead mass. According to studies limiting nutrient concentration is an effective way to control biofouling (Griebe, Flemming 1998, 156. Hu, Song, Ong, Phua, Ng 2005, 128, 132). Biofilm forms in phases. It occurs when the biofilm growth exceeds the threshold of interference. Because it’s impossible to kill all the micro-organisms from the system, the other option is to live with biofilm formation as long as it does not lead to biofouling. The

Treatment of surface water with hydraulically cleaned reverse osmosis modules
20
threshold of interference is the limit below which the biofilm does not in-terfere with membrane performance. (Flemming 1997, 383, 387-388. Griebe, Flemming 1998, 156. Hu, Song, Ong, Phua, Ng 2005, 128, 132. Van der Kooij, Hijnen & Cornelissen 2009, 27.) Biofouling results mainly in pressure drop increase but it can also decrease the permeate flux and salt rejection on NF/RO membrane. (Crittenden, Trussel, Hand, Howe & Tchobanoglous 2005, 84. Flemming 1997, 383, 387-388. Hu, Song, Ong, Phua, Ng 2005, 128, 132. Van der Kooij, Hijnen & Cornelissen 2009, 27.) Figure 11 shows biofouling on the surface of au-topsied reverse osmosis membrane. Even though biofouling has been no-ticed and studied a few decades, it still remains a difficult problem that is hard to control (Van der Kooij, Hijnen & Cornelissen 2009, 29).
FIGURE 11 Biofouling on spiral-wound reverse osmosis membrane (WaterForum Online 2008).
6 CALCULATIONS
This chapter presents some of the basic equations for calculating rejection, recovery and water flux, solute flux and silt density index for micro- and ultrafiltration and nanofiltration and reverse osmosis processes.
6.1 Rejection
The extent to which material that is retained by a membrane is called re-jection. Rejection can be calculated for specific components or using an overall property, such as turbidity. For example salt rejection is one of the performance indicators for reverse osmosis. (Crittenden, Trussel, Hand, Howe & Tchobanoglous 2005, 984. Greenlee, Lawler, Freeman, Marrot & Moulin 2009, 2323-2324.) Formula 2 shows the equation for rejection. The equation is used in all types of membrane filtration.

Treatment of surface water with hydraulically cleaned reverse osmosis modules
21
FORMULA 2 Equation for calculating rejection for membrane filtration (Crittenden, Trussel, Hand, Howe & Tchobanoglous 2005, 984, 1443).
F
P
C
CR −=1
in which, R= rejection, dimensionless
PC = permeate concentration, mole/L or mg/L
FC = feed concentration, mole/L or mg/L
6.2 Recovery
Recovery is the fraction of the feed water that becomes permeate. The equation shown in formula 3 applies only for nanofiltration/reverse osmo-sis membranes. (Crittenden, Trussel, Hand, Howe & Tchobanoglous 2005, 1455.) FORMULA 3 Equation for recovery for reverse osmosis and nanofiltration membranes
(Crittenden, Trussel, Hand, Howe & Tchobanoglous 2005, 1455).
F
Pw Q
QR =
in which,
wR = recovery, dimensionless
PQ = permeate flow, m3/s
FQ = feed flow, m3/s For MF/UF recovery is typically very high, 95-98 % and it is the ratio of net water production to gross water production as shown in formula 4. The equation is only valid for dead-end filtration (Crittenden, Trussel, Hand, Howe & Tchobanoglous 2005, 1011.) FORMULA 4 Equation for recovery for micro- and ultrafiltration (Crittenden, Trussel,
Hand, Howe & Tchobanoglous 2005, 1011).
F
BWFw V
VVR
−=
in which,
wR = recovery, dimensionless
FV = volume of water fed to the membrane, m3
BWV = volume of water used during backwash, m3
6.3 Water flux
Water flux calculation differs for the different types of membrane filtra-tion because with nanofiltration and reverse osmosis the osmotic pressure

Treatment of surface water with hydraulically cleaned reverse osmosis modules
22
affects the flux. The next sections show water flux calculations for NF/RO and MF/UF.
6.3.1 Water flux through reverse osmosis membranes
The water flux through reverse osmosis or nanofiltration membrane is driving force times mass transfer coefficient. The water flux through re-verse osmosis membrane is described in formula 5. FORMULA 5 Equation for water flux through reverse osmosis and nanofiltration mem-
branes (Crittenden, Trussel, Hand, Howe & Tchobanoglous 2005, 1454).
)( π∆−∆= PkJ WW
in which,
WJ = volumetric flux of water, L/m2*h
Wk = mass transfer coefficient for water flux (MTC), L/m2 *h*bar
P∆ = transmembrane pressure difference between feed and permeate, bars π∆ = osmotic pressure difference between feed and permeate, bars
Mass transfer coefficients are given by the membrane manufacturers or calculated from clean water flux experiments. Osmotic pressure is calcu-lated by the van’t Hoff equation which is similar to ideal gas law (pV=nRT). It’s derived from ideally diluted solution which is not usually the case in reverse osmosis systems. So a coefficient has to be added to account for diluteness and behaviour of solutions. Osmotic pressure de-pends on the concentration of water in the system and dissociation of sol-utes in the water. When these factors are taken into account and included in the van’t Hoff equation, we can calculate the osmotic pressure equa-tion, shown in formula 6. (Crittenden, Trussel, Hand, Howe & Tcho-banoglous 2005, 1446, 1455.) FORMULA 6 Equation of osmotic pressure (Crittenden, Trussel, Hand, Howe & Tcho-
banoglous 2005, 1446).
CRTiφπ = in which, π = osmotic pressure i = number of ions when solute is dissociated φ = osmotic coefficient, unitless C = concentration of all solutes, moles/L R= universal gas constant, 0,083145 L * bar/moles * K T = temperature, K To be able to evaluate the performance loss caused by fouling or mem-brane aging, the flux has to be corrected for temperature. Temperature ef-fects water viscosity and correction factors for temperature are given by membrane manufacturers. If these factors are not available the flux can be corrected with factor shown in formula 7.

Treatment of surface water with hydraulically cleaned reverse osmosis modules
23
FORMULA 7 Equation for temperature correction factor (Crittenden, Trussel, Hand, Howe & Tchobanoglous 2005, 1456).
25)03,1( −= TTCF
in which, TCF= temperature correction factor T= feed water temperature, oC
6.3.2 Water flux through micro- and ultrafiltration membrane
The water flux equation for micro- and ultrafiltration membranes is shown in formula 8 , which is derived from Darcy’s law. FORMULA 8 Equation for water flux in micro- and ultrafiltration (Crittenden, Trussel,
Hand, Howe & Tchobanoglous 2005, 990).
M
PJ
µκ∆=
in which, J = water flux through membrane, L/m2 *h or m/s
P∆ = differential pressure between feed and permeate side (transmem-brane pressure), bar or Pa µ = viscosity of water, kg/m * s
Mκ = membrane resistant coefficient, 1/m In some climates the temperature difference between winter and summer can be more 20 oC which means that at summer flux can be much higher than at winter. Temperature variations can be adjusted by calculating equivalent flux at standard temperature. Formula 9 is often used for that. FORMULA 9 Equation for correcting temperature for water flux in micro- and ultrafil-
tration (Crittenden, Trussel, Hand, Howe & Tchobanoglous 2005, 992).
MS TTMS JJ −= )03.1(
in which, =SJ water flux in standard temperature (20 oC), L/m2 *h
MJ = water flux at measured temperature, L/m2 *h TS = measured temperature, oC TM = standard temperature, oC With standard temperature 20oC formula 9 is accurate within 5 % for wa-ters with temperature range 1-28oC. Because flux is also dependent on pressure the normalized pressure is calculated as shown in formula 10. It’s called specific flux. (Crittenden, Trussel, Hand, Howe & Tchobanoglous 2005, 992.)

Treatment of surface water with hydraulically cleaned reverse osmosis modules
24
FORMULA 10 Equation for specific flux for micro- and ultrafiltration (Crittenden, Trus-sel, Hand, Howe & Tchobanoglous 2005, 992).
P
JJ S
CSP c
∆=
20,
in which,
CSP cJ20,
= specific flux at 20oC, L/m2 *h*bar
=SJ water flux at standard temperature (20 oC), L/m2 *h
P∆ = differential pressure between feed and permeate side (transmem-brane pressure), bar The effect of fouling on water flux can be defined by calculating the per-cent loss of specific flux.
6.4 Solute flux through membrane
The solute flux through membrane can also be presented as performance measure. The solute flow is only calculated for reverse osmosis and nano-filtration membranes. (Greenlee, Lawler, Freeman, Marrot & Moulin 2009, 2323.) The equation is shown in formula 11. FORMULA 11 Equation for solute flux through reverse osmosis or nanofiltration mem-
branes (Crittenden, Trussel, Hand, Howe & Tchobanoglous 2005, 1454).
)()( permeatefeedSSS CCkCkJ −=∆=
in which,
SJ = flux of solute, mg/m2 h
Sk = mass transfer coefficient for solute flux, L/m2 *h or m/h
feedC = concentration in the feed solution, mole/L or mg/L
permeateC = concentration in the permeate solution, mole/L or mg/L
The mass transfer coefficient is given by manufacturers (Crittenden, Trus-sel, Hand, Howe & Tchobanoglous 2005, 1455).
6.5 Silt density index
The fouling potential of water can be described with SDI. Silt density in-dex is a timed filtration test performed with 0,45 µm filter in constant 2,07 bar pressure. The standard time of the test is 15 minutes and the filtration continues all this time. First the duration time of collecting 500 ml of per-meate is measured. After collecting 500 ml of permeate the filtration con-tinues without measuring the volume. When 15 minutes have passed from the beginning of the test another 500 ml sample is filtered and the time to filter that sample is measured. From these filtering times the SDI is calcu-lated as shown in formula 12. (Crittenden, Trussel, Hand, Howe & Tcho-banoglous 2005, 1469. Greenlee, Lawler, Freeman, Marrot & Moulin 2009, 2327.)

Treatment of surface water with hydraulically cleaned reverse osmosis modules
25
FORMULA 12 Equation for calculating SDI (Crittenden, Trussel, Hand, Howe & Tcho-
banoglous 2005, 1469).
t
t
t
SDI
)1(%1002
1−⋅=
in which,
1t = time required to filter the first 500 ml sample, min
2t = time required to filter the final sample after 15 min filtration, min t = the time from the beginning of the test to the beginning of final sample filtration, (15) min An SDI value of 3 or less is preferred for feed water for reverse osmosis. Values of 4-5 are also tolerated and they are usually achieved with con-ventional pretreatment. (Greenlee, Lawler, Freeman, Marrot & Moulin 2009, 2327.)
7 MATERIALS AND METHODS
This thesis discusses the treatment of surface water with reverse osmosis membranes that were cleaned with a mixture of air and water, and the minimum pretreatment that is required to achieve stable operation. The re-search objective was to find out what the optimum air-water cleaning fre-quency is for the installation and how much pretreatment is required to successfully operate the pilot. This chapter describes materials, the pilot set-up, methods and measured parameters.
7.1 Materials
This thesis was part of AiRO-project which is performed by Vitens (Leeuwarden, the Netherlands), KWR Watercycle Research Institute (Nieuwegein, the Netherlands), Evides (Rotterdam, the Netherlands), and Hatenboer-Water (Schiedam, the Netherlands). The locations of coopera-tion partners are shown in appendix 7. The research was performed with pilot installation and surface water from canal Potmarge. The pilot was provided and built by KWR. The pilot was equipped with a Hydranautics reverse osmosis element type ESPA2-4040. The technical data of the module is given in table 1 and a picture of the membrane is shown in fig-ure 12.

Treatment of surface water with hydraulically cleaned reverse osmosis modules
26
TABLE 1 Technical data of the reverse osmosis membrane (Membranes.com. 2009). Membrane element Hydranautics ESPA2-4040 Membrane diameter 10 cm Membrane length 1 m Material Thin-film composite polyamide Membrane area 7,90 m2 Average salt rejection 99,6 % Minimum salt rejection 99,4 % Permeate flow 3000 L/h Maximum feed flow 3600 L/h Maximum operating temperature 45 oC Maximum applied pressure 41,6 bar Feed water pH range 3,0-10,0
FIGURE 12 Reverse osmosis membrane type used in the experiments.
7.2 The pilot set-up
The installation was situated in Leeuwarden in Greunsweg in one of Vit-ens’ water distribution stations. The feed water was surface water pumped from Potmarge canal with a submerged pump. The pump was in a metal basket which sieved the biggest particles (leaves, fishes, and rocks) from the water. Photos of canal Potmarge and the intake point are in appendix 1. The water was pumped to the feed water tank of 1 m3 and was pre-treated by a cartridge filter with a pore size of 100 µm. The feed tank was covered with black plastic to prevent the algae blooming and equipped

Treatment of surface water with hydraulically cleaned reverse osmosis modules
27
with a level switch ASV-Stübbe NIS 1 to prevent the tank from overflow-ing. From the feed tank the water flew gravitationally to the installation. The installation was equipped with a low pressure pump (DP pumps DPVE 2-20) supplying the feed water to three cartridge filters placed in parallel. Only two of the cartridge filters were in use at the same time. Third one was only used when the filters had to be changed. After the car-tridge filters there was a high pressure pump (Grundfos CRNE 3-23) that provided the flow to the module. The installation was operated with 1500 L/h feed flow at 10 % recovery. The feed flow was kept constant at 1500 L/h with 150 L/h permeate flow resulting in a recovery of 10 %. Because there was no feed water flow me-ter in the installation the concentrate flow and permeate flow were ad-justed to 1350 L/h and 150 L/h respectively. The membrane was vertically positioned and the flow of feed water was from the top of the module to the bottom. The permeate was collected from the top of the membrane. The concentrate exited from the bottom of the membrane. There were three sample points in the installation: after the cartridge filters, in the permeate line and in the concentrate line. There were two flow meters and both of them were manually read. The concentrate flow meter had a range of 300-3000 L/h and the permeate flow meter had a range of 25-250 L/h. There were four pressure measuring points: before and after cartridge fil-ters, after the second pump in feed line, and after membrane in concentrate line. Pressure drop between feed channel and concentrate channel was measured as an indicator of fouling. In all experiments this pressure drop was measured manually every 15 minutes by a single pressure sensor and an array of valves. The result was read from the display of pressure trans-mitter (Endress-Hauser Cerabar S, PMC71). A compressor supplied the air for the air-water cleaning. The air pressure was measured with a manometer after the compressor. The air flow was measured with a flow meter after the compressor. When air-water cleaning was applied the flow of water was stopped and the flow direction changed to from bottom to top. Air was then added into the water stream. The air-water cleaning was applied for 5 minutes with air pressure of 6 bars and air flow of 3000 L/h. The water flow during the cleaning was 1500 L/h so the air/water ratio was 2:1. When stopping air-water cleaning the air flow was turned off but water was left to flow through membrane for 3 minutes. This was done to remove the remaining air from the system. A schematic picture of installation is shown in figure 13 and a picture of the pilot is shown in figure 14.

Treatment of surface water with hydraulically cleaned reverse osmosis modules
28
FIGURE 13 A schematic picture of the pilot installation.
FIGURE 14 The pilot installation for the experiments.

Treatment of surface water with hydraulically cleaned reverse osmosis modules
29
7.3 Methods
Four experiments were conducted to determine the required air-water fre-quency for stable operation and to study the pretreatment requirements. In addition two reference experiments were performed. The next sections de-scribe methods for air-water cleaning experiments and reference experi-ments.
7.3.1 Air-water cleaning frequency experiments
The pilot had not been used for surface water before so in the first four experiments the cleaning frequency was studied as well as the pretreat-ment requirements. Conditions during the experiments are given in table 2. In the first experiment air-water cleaning was applied after every seven hours of operation. The size of the cartridge filters before the module were 5 µm. Experiment 2 was also performed with air-water cleaning frequency of seven hours. The cartridge filter size was 20 µm. Experiment 3 was per-formed without cartridge filters before the module and with a cleaning frequency of 14,5 hours and experiment 4 also without cartridge filters with a cleaning frequency of 24 hours. Temperature, conductivity, turbidity and particle amounts were measured every 30 minutes. Experiments consisted of four runs. Each run lasted 7,5 hours, since the pilot was running only during working hours so the total running time for each experiment was 30 hours. TABLE 2 Conditions of air-water cleaning frequency experiments.
Experiment Run Run time Filter size Feed flow Recovery AWC frequency 1 1 7,5 h 5 µm 1500 L/h 10 % 7 h
2 7,5 h 5 µm 1500 L/h 10 % 7 h 3 7,5 h 5 µm 1500 L/h 10 % 7 h 4 7,5 h 5 µm 1500 L/h 10 % 7 h
2 1 7,5 h 20 µm 1500 L/h 10 % 7 h 2 7,5 h 20 µm 1500 L/h 10 % 7 h 3 7,5 h 20 µm 1500 L/h 10 % 7 h 4 7,5 h 20 µm 1500 L/h 10 % 7 h
3 1 7,5 h No filters 1500 L/h 10 % 2 7,5 h No filters 1500 L/h 10 % 14,5 h 3 7,5 h No filters 1500 L/h 10 % 4 7,5 h No filters 1500 L/h 10 % 14,5 h
4 1 7,5 h No filters 1500 L/h 10 % 2 7,5 h No filters 1500 L/h 10 % 3 7,5 h No filters 1500 L/h 10 % 4 7,5 h No filters 1500 L/h 10 % 24 h

Treatment of surface water with hydraulically cleaned reverse osmosis modules
30
7.3.2 Reference experiments
Reference experiments were performed with a membrane of the same type as the one used in experiments 1-4. No air-water cleaning was applied. The objective was to see how fast a new membrane fouls without air-water cleaning. The conditions during reference experiments are in table 3. Two reference experiments were conducted. The first experiment was carried out with a cartridge filter of size 5 µm and the second with a cartridge fil-ter size of 20 µm. TABLE 3 Conditions of reference experiments.
Experiment Run Run time Filter size Feed flow Recovery AWC frequency 1 1 7,5 h 5 µm 1500 L/h 10 % no AWC
2 7,5 h 5 µm 1500 L/h 10 % no AWC 3 7,5 h 5 µm 1500 L/h 10 % no AWC 4 7,5 h 5 µm 1500 L/h 10 % no AWC
2 1 7,5 h 20 µm 1500 L/h 10 % no AWC 2 7,5 h 20 µm 1500 L/h 10 % no AWC 3 7,5 h 20 µm 1500 L/h 10 % no AWC 4 7,5 h 20 µm 1500 L/h 10 % no AWC
7.4 Parameters
To determine the performance of the membrane and the efficiency of air-water cleaning several parameters were measured during tests. Table 4 shows the parameters which were measured on-site and parameters which were analyzed in laboratory. Samples for on-site analyses were taken every 30 minutes from the feed water tank, after pretreatment filters and permeate. Samples for laboratory analyses were taken once during each experiment, except during the first air-water cleaning experiment no sam-ples were taken and the results of the fourth experiment were lost in the laboratory.

Treatment of surface water with hydraulically cleaned reverse osmosis modules
31
TABLE 4 Measured parameters during the experiments.
Laboratory analyses On-site analyses pH Turbidity TOC and DOC Temperature Color Conductivity Suspended solids Particle count Colony forming units UV extinction Hardness Alkalinity Ions: Ca2+ Fe2+ Mg2+ Mn2+ Na+ K+ Cl-
Turbidity measurements were performed with a Hach 2100P Turbidime-ter, temperature and conductivity were measured with a WTW Multi 340i, and particle counts were measured with a Met One laser particle counter. The particle counter measured particles of sizes 2, 5, 10, 15, 20 and 30 µm.
8 RESULTS AND DISCUSSION
8.1 Feed water quality
The feed water was analyzed in the laboratory and on-site. Samples were taken both from the feed tank water and from the sample point after the pretreatment steps just before membrane. The results of laboratory analy-sis in appendix 2 show that water from both of these sample points was low quality water. The lab results were not available of the first and fourth experiment but as can be seen the quality did not change a lot between the experiments. The colour remained high (50-70 mg Pt/Co/l) and TOC was also high (~15 mg/l). The UV extinction was very high which showed that the water contained a lot of organic matter. The water had a high biofoul-ing potential since there were a lot of colony forming units during the first experiments. In all experiments the feed water turbidity was high which could also be observed visually as can be seen in figure 15. The quality of feed tank wa-ter and water after pretreatment was almost the same during the experi-ments 1-4. During the first four experiments the feed water turbidity re-mained quite stable between 8 to 12 NTU as shown in appendix 3. Spikes in the feed tank turbidity are probably caused by the level switch which

Treatment of surface water with hydraulically cleaned reverse osmosis modules
32
turned the pump off and let the water stand in the pipe and the pump turned on right before the sample was taken.
FIGURE 15 Samples of feed tank, after pretreatment, permeate and concentrate water. The turbidity depended on the particle amount of the smallest particles (2, 5 and 10 µm) as can be seen in figure 16. The total particle amounts varied between 15000 and 30000 particles per ml during the first four experi-ments. Particle amounts are shown in appendix 4. On rainy days the parti-cle count rose only a bit to almost 30000 particles per ml while it was oth-erwise around 25000 particles in ml. In the period of the experiments there were only three to four rainy days. In experiment 1 in runs 3 and 4 it was raining almost the whole day. During the first reference experiment the first three runs it was raining during the night and also in the first run of reference experiment 2. During experiment 2 in run 2 the weather was hot. This resulted in a decrease in particle count. When the cartridge filter size was changed or taken completely away dur-ing the first four experiments the particle amounts increased only for about 2000 particles per ml and turbidity remained approximately the same in the first four experiments. Figure 17 shows the ratio of 2 µm particles compared to the total particle amount. Over 40 % of total particles were 2 µm so it could be that the filter size of 5 µm was too large pore size to af-fect the particle amount. About 98 % of the total particle amount was composed of small particles (2, 5 10 µm) as can be seen in figure 18. In experiments 1, 3 and 4 the ratio of small particles was close to each other. In experiments 1 and 2 the filter sizes were 5 and 20 µm respectively but the ratio of small particles in experiment 2 was smaller than in experiment 1. The reason for this is perhaps the hot weather during experiment 2 which reduced the total particle amount and because of that the ratio of small particles seems smaller. In reference experiments the small particle amounts are vice versa. This could be because the total particle load was higher during the reference experiments and the effect of 5 µm filter on the small particle amount showed more clearly which can also be seen in figure 17. During the second reference experiment and cartridge filters

Treatment of surface water with hydraulically cleaned reverse osmosis modules
33
were effectively filtering the large particles. This was detected when the filters had to be changed in the middle of the experiment.
FIGURE 16 Turbidity compared to the total particle amount of 2, 5, 10 µm particles in
the reference experiment 1 in the sample after pretreatment.
FIGURE 17 Amount of 2 µm particles from total particle amount in pretreated water in
all experiments.

Treatment of surface water with hydraulically cleaned reverse osmosis modules
34
FIGURE 18 The amount of small (2, 5, 10 µm) particles from total particle amount in
pretreated water in all experiments. During the reference experiments the turbidity and particle count of the pretreated water diverged from the feed tank turbidity and particle count measured in the feed tank. The turbidity and particles in the feed water af-ter pretreatment began to rise. The turbidity reached almost 20 NTU while the water in the feed tank had turbidity of 10 NTU. The particle count in the pretreated water in the first reference experiment was over 35000 par-ticles per ml while in the feed tank the count was below 30000 particles per ml. At the end of the first reference experiment one of the large supply tanks at the distribution station was emptied for maintenance work and the outlet was next to the pump in the canal. This caused material on the bottom of the canal to rise and mix in the water which led to sudden fouling of the feed tank filter and also a lot of small pieces of plants and sand flushed to the cartridge filters in the installation. This can be seen as a big spike in the turbidity and particle counts. At this point the pilot was turned off for 45 minutes until the flow of supply tank decreased. Turbidity and the par-ticle count in feed tank water and especially in the water after the pre-treatment remained high during the second reference experiment but the values were lower than in the reference experiment 1. Appendix 2 table 11 shows that during the reference experiment 2 in the sample after the pre-treatment had an extremely high colour value. The colour in the feed tank sample was normal. However, all the other parameters which could affect the colour, such as TOC/DOC, iron or magnesium, were normal levels. Only turbidity was high too. This indicates that between the feed tank and after pretreatment was a particle source that was polluting the water. Probably during the draining of the supply tank a lot of particles deposited in the bottom of the feed tank and they were flushed to the installation dur-ing the last reference experiment or deposit of particles were somewhere else in tubing between the feed tank and installation.

Treatment of surface water with hydraulically cleaned reverse osmosis modules
35
8.2 Permeate quality
Permeate quality was stable and high throughout the experiments. Reten-tion based on conductivity was around 99,1 % (appendix 5) in all experi-ments and turbidity mainly between 0,15 and 0,20 NTU (appendix 3). Small changes in retention between experiments are caused by lower feed water conductivity and spikes are due to one unit change in permeate con-ductivity. In the first reference experiment the retention started high which is normal for a new membrane but towards the end of experiment it de-creased to 98,9 %. At the beginning of the second reference experiment it was back to 99,1 %. Laboratory analysis in appendix 2 shows that perme-ate quality was very high during all the experiments. Salts were removed almost completely (over 98 %) and also other contaminants were removed with high retention (96-99 %). The results prove that during the experi-ments the membrane was not damaged by the air-water cleaning.
8.3 Air-water cleaning experiments
In these experiments the objective was to study the optimum air-water cleaning frequency and pretreatment requirements. The next sections de-scribe the effect of AWC on pressure drop, transmembrane pressure and membrane permeability.
8.3.1 The effect of air-water cleaning on feed channel pressure drop
The air-water cleaning was applied on the membrane to observe its effect to control membrane fouling. Cornelissen, Vrouwenvelder, Heijman, Vi-allefont, Van der Kooij & Wessels (2007) found dramatic improvement in fouling control when AWC was used. The mixture of air and water re-moved fouling from the membrane and the feed spacer. The feed channel pressure drop increases due to fouling so pressure drop was observed to detect the effect of AWC. The feed channel pressure drop, the pressure difference between feed and concentrate lines, was developing slowly during the first four experiments considering the low feed water quality. In the first test AWC was applied after every seven hours of operation. Figure 19 shows the feed channel pressure drop during first experiment. Arrows show the cleaning times. No decrease in feed channel pressure drop was observed after cleaning but this could be due to minimal fouling. The feed channel pressure drop in-creased only 0,02 bars (9,5 %) during the first test which showed that there was only slight fouling. During the experiment the pressure drop re-mained stable between 0,21 and 0,23 bar which could be due to AWC.

Treatment of surface water with hydraulically cleaned reverse osmosis modules
36
FIGURE 19 Feed channel pressure drop during experiment 1 (filter size 5 µm). Arrows
indicate AWC times when the cleaning was applied for 5 minutes. Before the first experiment the pilot was operated for 26 hours with 5 µm cartridge filters and different feed flows and recoveries. During this period membrane was cleaned sporadically eight times. The feed channel pres-sure drop increased 10 % during that time. After the first experiment the increase in feed channel pressure drop was 15 % compared to the initial value of clean membrane. This indicated slight fouling. The total operating time after the first experiment was 56 hours. Considering the quality of feed water, fouling was developing slower than expected. The second experiment was not showing faster fouling despite the larger pore size filters. The particle count during this experiment was also lower due to a very warm day in run 2. The feed channel pressure drop increased as much as in the first experiment, 0,02 bars (9 %). The total increase compared to initial pressure drop was 20 % after 86 hours (3,5 days) of operation. The pressure drop recovered 0,01 bars after the three first clean-ings but the fourth cleaning did not show any effect on the pressure drop as can be seen in figure 20. The cleaning frequency was the same as in the first experiment which may have kept the pressure drop from increasing but at the same time the particle load was also smaller than in experiment 1 which could slow down the fouling. So low particle load and short cleaning frequency together might have caused the slower fouling.

Treatment of surface water with hydraulically cleaned reverse osmosis modules
37
FIGURE 20 Feed channel pressure drop during experiment 2 (filter size 20 µm). Ar-
rows indicate the AWC times when the cleaning was applied for 5 minutes. In the third experiment the cartridge filters were removed and cleaning frequency was longer. As can be seen in figure 21 the membrane was cleaned only twice during the third experiment. The feed channel pressure drop increased 0,03 bars (12,5 %) during this experiment. The total in-crease compared to the initial value was 35 % which showed that the membrane was getting more fouled. The particle count was the same as in the experiment 1 which indicated that longer cleaning frequency caused the faster fouling.
FIGURE 21 Feed channel pressure drop during experiment 3 (no filters). Arrows indi-
cate the AWC times when the cleaning was applied for 5 minutes. In the fourth experiment the objective was to study the decrease in feed channel pressure drop after air-water cleaning. In the experiment the membrane was cleaned only once after 24 hours of operation. As can be seen in figure 22 the pressure drop was reduced from by 0,01 bar to 0,29 bars. A complete recovery of the feed channel pressure drop was not

Treatment of surface water with hydraulically cleaned reverse osmosis modules
38
achieved. The membrane was cleaned three times and after each cleaning step the pressure drop was determined and when no recovery in pressure drop was detected the membrane was cleaned again. The details of each cleaning are in table 5.The third cleaning was applied with an air/water ra-tio of 3/1 with air flow of 3000 L/h and water flow of 1000 L/h. After this last AWC the pressure drop reduced 0,01 bars and because it seemed that a higher recovery could not be reached the cleaning was stopped. The ini-tially used air/water ratio of 2/1 was chosen according to previous studies but further studies should be made with different air/water ratios. Cor-nelissen, Rebour, van der Kooij & Wessels (2009) found that turbulence increased in experiments performed with membrane fouling simulator (MFS) when the air/water ratio was higher. Turbulence prevents particles to accumulate on membrane and thereby prevents fouling so higher turbu-lence during AWC should be more effective (Van der Kooij, Hijnen & Cornelissen 2009, 26). During experiment 4 the pressure drop increased 0,03 bars (11 %) which was as much as in experiment 3. Shorter cleaning frequency than in the experiment 3 did not lead to faster fouling. After the fourth experiment the total increase in pressure drop was 50 %. Fouling was attached strongly to the membrane which indicated that fouling might be mainly biofouling. Also the slow development suggests to biofouling. Vrouwenvelder, Graf von der Schulenburg, Kruithof, Johns & van Loosdrect (2009) found that biofouling is a feed spacer problem so the fouling was attached also on spacer. When the spacer gets fouled it affects mainly feed channel pres-sure drop because the resistance in the flow channel increases. Spacer fouling also causes development of flow channels when parts of the spacer mesh becomes clogged and the flow of water goes around the clogged parts. (Vrouwenvelder, Graf von der Schulenburg, Kruithof, Johns & van Loosdrect 2009, 589-590.) This might also affect the flow of AWC and in-terfere the cleaning flow distribution.
FIGURE 22 Feed channel pressure drop during experiment 4 (no filters).Arrows indi-
cate AWC times when the duration were 5 min, 10 min, and 5 min respec-tively.

Treatment of surface water with hydraulically cleaned reverse osmosis modules
39
TABLE 5 Air-water cleanings in experiment 4. Cleaning Water flow Air flow Air-water cleaning time
1 1500 L/h 3000 L/h 5 min 2 1500 L/h 3000 L/h 10 min 3 1000 L/h 3000 L/h 5 min
Figure 23 shows the fouling rate of the air-water cleaning experiments. The fouling rate of two preliminary runs before the experiments is added in the figure. During those runs the feed flow and recovery were the same as in the air-water cleaning experiments. As can be seen in figure 23 the fouling rate increased significantly between preliminary runs and the first air-water cleaning experiment. During the preliminary runs the membrane was cleaned four times sporadically during 14 hours of operation. So the longer cleaning frequency in the experiment 1 compared to preliminary runs had a strong effect on the fouling rate which indicates that shorter cleaning frequency keeps the fouling rate lower. There was an increase be-tween fouling rates of the experiments 1 and 2 which shows that the foul-ing was actually developing faster in experiment 2 than in experiment 1. The difference between fouling rates in experiments 2 and 3 was almost the same as between experiments 1 and 2. After 100 hours of operation when the filters were removed the fouling rate increased substantially. So without filters the cleaning frequency should be shorter than 14,5 hours which was used in experiment 3. According to the fouling rate it could be that during continuous run the module would have to be cleaned a few times a day.
FIGURE 23 Fouling rate of air-water cleaning experiments. The particle count during the experiment 3 was not differing much from the experiment 1 which indicates the same particle load in those two ex-periments. Cornelissen, Rebour, van der Kooij & Wessels (2009) found that daily AWC was more efficient than weekly AWC. According to pre-vious studies, experiments 1, 2 and 3, and the fouling rate between pre-liminary runs and experiment 1, it seems that shorter AWC frequency

Treatment of surface water with hydraulically cleaned reverse osmosis modules
40
slowed the fouling down. The results from the experiment 4 unfortunately did not support this conclusion since the longer AWC frequency did not lead to faster fouling. But the particle counts were a bit lower than in the experiments 1 and 3. Laboratory results were not available from the ex-periment 4 but judging from other laboratory results it can be assumed that the feed water quality should have been quite similar during the fourth ex-periment. The small difference between fouling rates of the experiments 3 and 4 could be due to lower particle load during the experiment 4. The effect of AWC was hard to detect from feed channel pressure drop measurements because a clear reduction in pressure drop could not be reached. The total net operating time at the end of the experiment 4 was 6 days. During this time the pressure drop increased 50 %. Figure 24 shows the increasing of pressure drop during the experiments. The two prelimi-nary runs are included in the graph the same way as in the fouling rate graph. At the beginning from 15 to 75 hours of operation the pressure drop increase was steady since the fouling rate was low. Between 80 and 100 hours of operation the pressure drop increased substantially which was due to higher fouling rate. Also between 100 and 140 hours of operation the pressure drop made a steep increase. This also suggests significant differ-ence between the experiments with cartridge filters and without cartridge filters combined with longer AWC frequency. The exponential increase reminds of biofilm development (Flemming 1997, 383). This could also suggest that the fouling was mainly biofouling. But it has to be taken into account that the membrane carried a historical fouling from one experi-ment to another and that could interfere the experiments.
FIGURE 24 Feed channel pressure drop during air-water cleaning experiments. In the previous study the effect of AWC to control biofouling was studied and an increase of 50 % in feed channel pressure drop was found after 16 weeks of operation on a reverse osmosis membrane which was cleaned daily by AWC (Cornelissen, Vrouwenvelder, Heijman, Viallefont, Van der Kooij & Wessels 2007, 98). In that study feed water was tap water fil-tered with 1 µm cartridge filters to prevent heavy particle load and dosed

Treatment of surface water with hydraulically cleaned reverse osmosis modules
41
with sodium acetate to increase the biofouling potential. The surface water used in this study had more fouling potential than the feed water used in the study of Cornelissen, Vrouwenvelder, Heijman, Viallefont, Van der Kooij & Wessels (2007) since the feed channel pressure drop increased in shorter period of time to the same value. Faster fouling in this study could also be due to the combination of particle and biofouling which is ex-pected to influence each other (Cornelissen, Viallefont, Beerendonk & Wessels 2009, 9). Long-term experiments are necessary to study the per-formance of hydraulically cleaned RO membrane fed with surface water. Long-term experiments will also show what effect changes in the surface water quality will have on the performance of a hydraulically cleaned membrane.
8.3.2 The effect of air-water cleaning on transmembrane pressure
Transmembrane pressure is the pressure difference between feed and per-meate side of the membrane. In reverse osmosis process permeate is near the atmospheric pressure so the TMP was calculated with feed pressure and assuming that the permeate side is in the atmospheric pressure of 100 kPa. The transmembrane pressure increased during the experiments. It started from 650 kPa in experiment 1. Already in the first experiment it rose to 680 kPa as can be seen in figure 25. The average transmembrane pressure during experiment 1 was 660 kPa. The increase in transmembrane pres-sure showed that the membrane was fouling. A sudden increase happened after 15 hours at the beginning of third run and also at the beginning of fourth run. These increases could indicate a strong fouling. The feed chan-nel pressure drop increased 0,01 bar at the beginning of the third run which correlates with transmembrane pressure but no increase in the feed channel pressure drop was observed at the beginning of fourth run. The pressure dropped suddenly during the third run after 20 hours which was due to the clogged feed tank filter which stopped the installation. When the pilot was started again the pressure was lower. So the pressure might also change due to start-ups.

Treatment of surface water with hydraulically cleaned reverse osmosis modules
42
FIGURE 25 Transmembrane pressure during experiment 1. Arrows indicate the AWC
times. Only a slight effect of AWC was detected in the feed channel pressure drop but the transmembrane pressure decreased after AWC. As can be seen in figure 25 the transmembrane pressure during the experiment 1 de-creased slightly after each AWC. This shows that the membrane was cleaned during AWC. During the experiment 2 it showed clearly that the transmembrane pressure dropped after each air-water cleaning as can be seen in figure 26. This much clearer drop also showed that in the experi-ment 1 fouling had not developed so much that the air-water cleaning could show a noticeable decrease in the TMP or feed channel pressure drop. In the second experiment the transmembrane pressure increased from 620 to 720 kPa which is a remarkable increase. The increasing com-pares to feed channel pressure drop which was also steadily increasing for 0,01 bar after 15 hours of operation. The average transmembrane pressure was 675 kPa which indicates that average TMP increased 15 kPa from ex-periment 1. The AWC applied at the end of the first run reduced the TMP for 60 kPa. The transmembrane pressure at the second run was lower than in the first run. Either the AWC at the end of the first run cleaned the membrane very well and the pressure remained low or the start-up af-fected the TMP. The next three AWCs reduced the TMP to value of 645 kPa which showed that AWC was effectively cleaning the membrane.

Treatment of surface water with hydraulically cleaned reverse osmosis modules
43
FIGURE 26 Transmembrane pressure during experiment 2. Arrows indicate AWC
times. Also during experiment 3 the transmembrane pressure increased. As can be seen in figure 27 it reached 750 kPa while the TMP at the beginning of the experiment 3 was 690 kPa. TMP increased 30 kPa between runs 1 and 2, and 3 and 4. The same steps were found on the feed channel pressure drop as the pressure increased 0,01 bar. The average transmembrane pres-sure was 720 kPa which indicates a 45 kPa increase of average TMP from the experiment 2. The average increase can be compared to faster fouling which could be seen also in the feed channel pressure drop. It can be clearly seen that transmembrane pressure decreases after every AWC but when the next run is started it has risen again. When pilot was started in the morning, brown dirty water could be seen in the concentrate flow meter. The start up flushed away removable fouling that developed during the night when the pilot was standing still. The “stair” looking in-crease could also be irreversible fouling that developed during the night. Between the experiments was weekend while the pilot was not running. After each experiment clean tap water was fed to the pilot and left in the tubing to prevent extensive microbial growth during the weekend. At the end of the first experiment the transmembrane pressure was 680 kPa as can be seen in figure 25. The second experiment also started with a trans-membrane pressure of 680 kPa as can be seen in figure 26. So no fouling effect was found after weekend. This could indicate that the “stair” effect was biofouling. The same end and start-up pressures were also found be-tween experiments 3 and 4. With continuous run the “stairs” could be avoided. It disturbed the analy-sis of the results because a definite reason for the effect can not be pre-sented.

Treatment of surface water with hydraulically cleaned reverse osmosis modules
44
FIGURE 27 Transmembrane pressure during experiment 3. Arrows indicate AWC
times. In the experiment 4 the average TMP was 740 kPa which indicates a 20 kPa increase compared to the experiment 3. As was detected from the feed channel pressure drop the average transmembrane pressure also showed minor fouling compared to the experiment 3. During the fourth experiment TMP was more stable. The high point of almost 800 kPa could be due to the feed channel pressure drop increase of 0,01 bar. The same increase in the feed channel pressure drop happened after 28 hours which reduced the flux and the feed pressure had to be adjusted. This is shown in figure 28 as an increase in TMP. The air-water cleaning after 24 hours of operation re-duced the transmembrane pressure. It can be concluded that the trans-membrane pressure indicated the efficiency of AWC clearer than pressure drop in the feed channel and AWC reduced the transmembrane pressure.
FIGURE 28 Transmembrane pressure during experiment 4. Arrows indicate AWC
times.

Treatment of surface water with hydraulically cleaned reverse osmosis modules
45
Biofouling is mainly a feed spacer problem (Vrouwenvelder, Graf von der Schulenburg, Kruithof, Johns & van Loosdrect 2009, 589-591). The transmembrane pressure indicates the resistance through the membrane and therefore it indicates the fouling on the membrane surface as can be seen in figure 29. A reduction in transmembrane pressure was observed af-ter air-water cleaning which indicated that AWC cleaned the membrane surface. Biofouling was attached mainly on the spacer and was not so eas-ily removed. Particles might not be deposited on the spacer but on the membrane surface. Air-water cleaning has found to be effective also on particle removal (Cornelissen, Viallefont, Beerendonk & Wessels 2009, 8). So the reduction on transmembrane pressure could indicate the re-moval of particle fouling.
FIGURE 29 Pressure drops in membrane sheets: feed channel pressure drop and
transmembrane pressure drop (Vrouwenvelder, Graf von der Schulenburg, Kruithof, Johns & van Loosdrect 2009, 584).
8.3.3 The effect of air-water cleaning on membrane permeability
Flux is related to transmembrane pressure. When fouling increases the transmembrane pressure, flux decreases. The normalized flux for tempera-ture and pressure is called mass transfer coefficient or permeability. The flux was calculated by dividing the permeate flow with membrane area as can be seen in formula 13. The flux during all the experiments can be found on appendix 6. FORMULA 13 Equation for flux.
A
QJ p=
in which, J= flux, L/h m2 Qp= permeate flow, L/h A= membrane area, m2

Treatment of surface water with hydraulically cleaned reverse osmosis modules
46
The permeability (MTC) was calculated and normalized for temperature and pressure. The calculations for MTC are shown in formulas 14-16. FORMULA 14 Equation for MTC.
sec3600⋅⋅=
P
TCFJMTC MTC
in which, MTC= mass transfer coefficient, m/s Pa J= flux, L/h m2 TCFMTC= temperature correction factor for MTC, unitless P = average feed channel pressure, Pa FORMULA 15 Equation for temperature correction factor for MTC.
))273/(1())273/(1( Re +−+= fM TTMTC eTCF
in which, TCFMTC= temperature correction factor for MTC, unitless TM= measured temperature, oC TRef= reference temperature, oC (in this 20 oC were chosen for reference temperature) FORMULA 16 Equation for average feed channel pressure.
2CF PP
P−=
in which, P = average feed channel pressure, Pa PF= feed pressure, Pa PC= concentrate pressure, Pa After air-water cleanings the permeability rose which indicates that the membrane was cleaned. The same effect was not seen on flux. Flux and permeability were both stable during the experiments. During the first ex-periment the average flux was 19,3 L/h m2. As can be seen in figure 30 the permeability was slightly decreasing which is due to increase in the trans-membrane pressure during the first experiment. This indicated fouling. The average permeability was 7,2 *10-12 m/s Pa. During the first experi-ment an increasing and decreasing can be seen during each run. An in-crease could indicate the flushing of fouling that developed between the runs and decrease a new fouling on the membrane.

Treatment of surface water with hydraulically cleaned reverse osmosis modules
47
FIGURE 30 Permeability during experiment 1. Arrows indicate AWC times. In the second experiment the average flux was 19,5 L/h m2 which is slightly higher than in the experiment 1. Small changes can be seen be-tween the runs but generally flux remained stable. The average MTC of 7,1*10-12 m/s Pa showed a slight increase. The permeability declined dur-ing the runs 2-4. The increase on TMP was observed during the runs 2-4 which correlates on permeability so the membrane was fouling. After each AWC permeability increased which indicates a cleaning of the membrane.
FIGURE 31 Permeability during experiment 2. Arrows indicate AWC times. During experiment 3 flux remained about 19 L/h m2. The average flux had decreased to 19,0 L/h m2. The permeability correlated increases and de-creases of transmembrane pressure as can be seen in figure 32. In the first run permeability was high and then in the second and third run it was quite stable and in the fourth run it declined. The changes indicate that the membrane was slowly fouling. The average MTC was 6,5*10-12 m/s Pa which indicates a small decline compared to experiment 2. The average transmembrane pressure increased 45 kPa from the experiment 2 which

Treatment of surface water with hydraulically cleaned reverse osmosis modules
48
perhaps caused the slight decrease in MTC and flux. The effect of AWC can be clearly seen on permeability.
FIGURE 32 Permeability during experiment 3. Arrows indicate AWC times. The flux was stable during the fourth experiment. It remained around 19,0 L/h m2. The average flux of 19,0 L/h m2 also proves that there was no change compared to the experiment 3. The permeability during the ex-periment 4 is shown in figure 33. The average permeability was 6,4*10-12 m/s Pa which was almost the same in the previous experiment. Compared to the transmembrane pressure which had the increase of 20 kPa from the experiment 3, the permeability showed that small increase in transmem-brane pressure was not affecting the MTC. The MTC was declining during the first three runs which indicates fouling but after the AWC it increased indicating that AWC was enhancing the normalized flux.
FIGURE 33 Permeability during experiment 4. Arrows indicate AWC times. In previous studies the effect of particle or biofouling on flux has been controversial. Some studies report the flux decline and some report no ef-

Treatment of surface water with hydraulically cleaned reverse osmosis modules
49
fect on flux (Speth, Gusses & Summers 2000, 35. Zhu & Elimelech 1997, 3656, 3658. Cornelissen, Harmsen, Beerendonk, Wessels & Van der Kooij 2009, 4. Vrouwenvelder, van Paassen, van Agtmaal, van Loosdrecht, Kruithof 2009, 41-42). In this study the transmembrane pressure increased 170 kPa (27 %) from the initial value, the flux declined ~2 L/h m2 (12 %) and permeability declined ~1,2*10-12 m/s Pa (16 %) from their initial val-ues. During experiments while the feed channel pressure drop was rising the transmembrane pressure increased too which shows a connection in fouling development. The fact that experiments were not performed on continuous runs makes the comparison difficult because the transmem-brane pressure increased step by step. The average values of flux and per-meability between experiments were not declining significantly. The de-cline of the flux and permeability from their initial values during the com-plete experiment series were 12 % and 16 % respectively, which indicates that there was a decline. It could be assumed that if the experiments had continued the flux and MTC would have continued decreasing. In transmembrane pressure the reduction after AWC can be clearly seen. Also the MTC increased after air-water cleaning. These results are in contradiction to the fact that flux is not affected by fouling. The results suggest that air-water cleaning reduces transmembrane pressure and enhances permeability.
8.4 Reference experiments
Two reference experiments were performed to see how fast fouling devel-ops on membrane which is not cleaned by AWC. The results indicated that the fouling was developing at the same rate as in the air-water cleaning experiments. During the first reference experiment the pressure drop in-creased 0,02 bars (10 %) which is as much as in the first experiment. The pressure drop of the reference experiment 1 is in figure 34.
FIGURE 34 Feed channel pressure drop during reference experiment 1 (filter size 5
µm).

Treatment of surface water with hydraulically cleaned reverse osmosis modules
50
During the second reference experiment the fouling was not faster as can be seen on figure 35. The pressure drop increased less than in the first ref-erence experiment, only 0,01 bar. The total increase compared to the ini-tial value was 15 % after 59 hours of reference experiments. After 56 hours of operation with air-water cleaning the pressure drop increase was the same. During the reference experiments the particle count and turbid-ity were higher than in the experiments 1-4. The reason for slow fouling could be that the feed water had less biofouling potential. The water tem-peratures were lower which could have reduced the biofilm formation and make the fouling develop slower. One cleaning was applied at the end of the second reference experiment and the pressure drop was recovered 0,01 bar almost to the initial value. In the experiments 1-4 the AWC was not recovering the pressure drop at all or only for short time but in the reference experiment after the AWC the feed channel pressure drop remained at 0,21 bar until the end of the ex-periment. This could indicate that most of the fouling was caused by parti-cles because also the transmembrane pressure decreased remarkably after air-water cleaning. Also the huge particle count during the draining of sup-ply tank might have caused particle fouling. This is also supported by the cartridge filters which had to be changed after two runs during the second reference experiment.
FIGURE 35 Pressure drop during reference experiment 2 (filter size 20 µm). Arrow in-
dicates the AWC. The transmembrane pressure was high during both of the reference ex-periments as can be seen in figures 36 and 37. The average pressure in the reference experiment 1 was 820 kPa and in the second reference experi-ment 845 kPa. So the increase of average transmembrane pressure be-tween the experiments was 25 kPa. A substantial decline in TMP was de-tected after AWC which proves that huge part of fouling was flushed away during the AWC.

Treatment of surface water with hydraulically cleaned reverse osmosis modules
51
The transmembrane pressure was changing through the first reference ex-periment. After the first run it decreased which could be due to rinsing of material that is added in the new membranes for safe transport. The parti-cle count was high during the third run which perhaps caused the TMP in-crease after 15 hours of operation. After the draining of the supply tank the pressure was unstable and went down. It is possible that the particles and other material that got flushed into the installation caused disturbance in the low pressure pump. During the second reference experiment the transmembrane pressure was also unstable. During the second reference experiment the TMP was decreasing but at the beginning of the fourth run it was high again. The increase could not be due to particles because the particle count was the same as during the previous run. The explanation could be the malfunction of the low pressure pump because right before the pilot was shut down after the last reference experiment the pump seemed to break down. The high transmembrane pressures could indicate that the low pressure pump was not operating properly during the refer-ence experiments or during the reference experiment 2.
FIGURE 36 Transmembrane pressure during reference experiment 1.

Treatment of surface water with hydraulically cleaned reverse osmosis modules
52
FIGURE 37 Transmembrane pressure during reference experiment 2. The flux was stable in both of the reference experiments. The average flux was 19,3 L/h m2 in the first reference experiment and 19,0 L/h m2 in the second reference experiment. At the end of both experiments the flux de-clined a bit. The permeability was low which correlates to high TMP. The average MTC on first reference experiment was 5,9*10-12 m/s Pa and 5,7*10-12 m/s Pa on the second reference experiment. So the average flux and MTC did not decline during the reference experiments. The perme-ability was low in the fourth run of the first reference experiment and at the same time TMP was high which indicates strong fouling happened be-tween runs 3 and 4. During the second reference experiment permeability had an increasing trend during three first runs which correlates the de-crease of TMP. This indicates that fouling was decreasing. At the begin-ning of the second run the MTC started with a high value but it decreased during the run. Also transmembrane pressure started low which means that fouling had decreased between the runs 1 and 2. It could be that material which was added on the membrane at the factory was flushed from mem-brane and it caused the decreasing of fouling. Another reason could be the malfunction of the low pressure pump.

Treatment of surface water with hydraulically cleaned reverse osmosis modules
53
FIGURE 38 Permeability during reference experiment 1.
FIGURE 39 Permeability during reference experiment 2. Arrow indicates AWC. The high TMP throughout the reference experiments indicates that the membrane was fouled but the feed channel pressure drop was not high. The fouling was not developing faster even though the feed water quality was worse in turbidity and particles than in the experiments 1-4. Only two reference experiments were operated and the same duration than experi-ments 1-4 would give better comparison. Also parallel modules with and without AWC would give better results. With surface water which changes according to seasons it is most effective to have parallel modules to observe the performance of air-water cleaned membrane. The reference experiments are not giving a definite comparison of air-water cleaning be-cause the changes in feed water quality and possible troubles with the equipment. Parallel experiments are needed to fully compare the perform-ance of air-water cleaning. The recovery of the pressure drop at the end of the reference experiment 2 proved that AWC is an effective way to clean reverse osmosis membranes treating surface water.

Treatment of surface water with hydraulically cleaned reverse osmosis modules
54
8.5 Rinsing water
Cleaning time was chosen according to earlier studies which revealed that the main part of the removable matter was removed during the first min-utes of AWC and that no significant removal took place after five minutes of cleaning (Cornelissen, Vrouwenvelder, Heijman, Viallefont, Van der Kooij & Wessels 2007, 97. Cornelissen, Harmsen, Beerendonk, Wessels & Van der Kooij 2009, 5). Rinsing water was collected twice during ex-periments and analyzed on-site. Figure 40 shows the rinsing water during experiment 2 in run 2 after 15 seconds, 1 minute and 5 minutes rinsing. This sample was rinsing water of 7 hours AWC frequency. Visual obser-vation showed that AWC is removing the impurities from the membrane. The on-site analysis results of rinsing water are shown in table 6. The sample after 15 seconds was too concentrated to be analyzed. In previous studies it was found that the quality of rinsing water after five minutes was almost the same as the feed water (Cornelissen, Vrouwenvelder, Heijman, Viallefont, Van der Kooij & Wessels 2007, 97. Cornelissen, Harmsen, Beerendonk, Wessels, & Van der Kooij 2009, 5). As can be seen in table 6 the turbidity was still high and the particle count was slightly higher than in the feed water. This indicates that AWC was still removing particles and biofilm from the membrane.
FIGURE 40 Rinsing water of experiment 2 run 2 (AWC frequency 7 hours) after 15
second, 1 minute and 5 minutes rinsing. TABLE 6 Rinsing water quality on experiment 2 run 2 compared to feed water qual-
ity before air-water cleaning.
Time Temperature Turbidity Conductivity Total particles/ml After 1 min rinsing 19,8 oC 29 NTU 749 µS/cm 29555 After 5 min rinsing 19,8 oC 9,51 NTU 749 µS/cm 20660 Feed water before AWC 19,9 oC 6,21 NTU 748 µS/cm 19735
The other rinsing water sample was taken during the experiment 4 when AWC frequency was 24 hours. Figure 41 and table 7 show that rinsing wa-

Treatment of surface water with hydraulically cleaned reverse osmosis modules
55
ter had deeper colour when the cleaning frequency was longer. Also “flakes” or small pieces of removed bacteria could be recognized in the 15 second rinsing water sample and also in the 1-minute sample. Comparison of feed water before AWC and the sample after 5 minutes rinsing show that particles were still being removed. These results differ from previous researches which concluded that particles are mainly removed during the first minute of AWC and mainly biomass was rinsed after 2 minutes (Cor-nelissen, Harmsen, Beerendonk, Wessels, & Van der Kooij 2009, 5). The rinsing water samples in the study of Cornelissen, Harmsen, Beerendonk, Wessels, & Van der Kooij (2009) were analyzed in a laboratory which made it possible to compare the results between many parameters. In this study rinsing water was not analyzed in a laboratory but only on-site and the comparison was based on turbidity, conductivity and particles. High turbidity after 5 minutes of rinsing showed that AWC was still removing particles. These results indicate that longer AWC frequency needs longer AWC time to wash away more impurities. Also the amount of fouling could have effect since during the second experiment the membrane was not fouled as much as at the end of the experiment 4. So the rinsing time might be derived from the quantity of fouling. The rinsing time should be studied for AWC when surface water is used for rinsing. In reverse osmosis membrane autopsies main part of the biomass is found close to the inlet of the membrane (Vrouwenvelder, Graf von der Schulen-burg, Kruithof, Johns & Van Loosdrecht 2009, 589. Cornelissen, Vrou-wenvelder, Heijman, Viallefont, Van der Kooij & Wessels 2007, 99). This is because the nutrient concentration is also high near the inlet. Particles are probably spread more throughout the membrane. In this study the membrane was positioned vertically with the water flow from top to bot-tom. The air-water cleaning was applied from bottom to top. When the cleaning is applied the biomass near the top is first flushed away but it might take more time for the particles to be removed since they are dis-tributed to a larger area. Also the spacer fouling creating flow channels causes the removal to become more difficult. In studies of Cornelissen, Harmsen, Beerendonk, Wessels, & Van der Kooij (2009) the feed water was filtered with 10 and 1 µm cartridge filters and in the study of Cor-nelissen, Vrouwenvelder, Heijman, Viallefont, Van der Kooij & Wessels (2007) the feed water was filtered with 1 µm cartridge filters. This pre-vented the high load of particles to enter the membrane and thus does not include the removal of particles in the rinsing time.
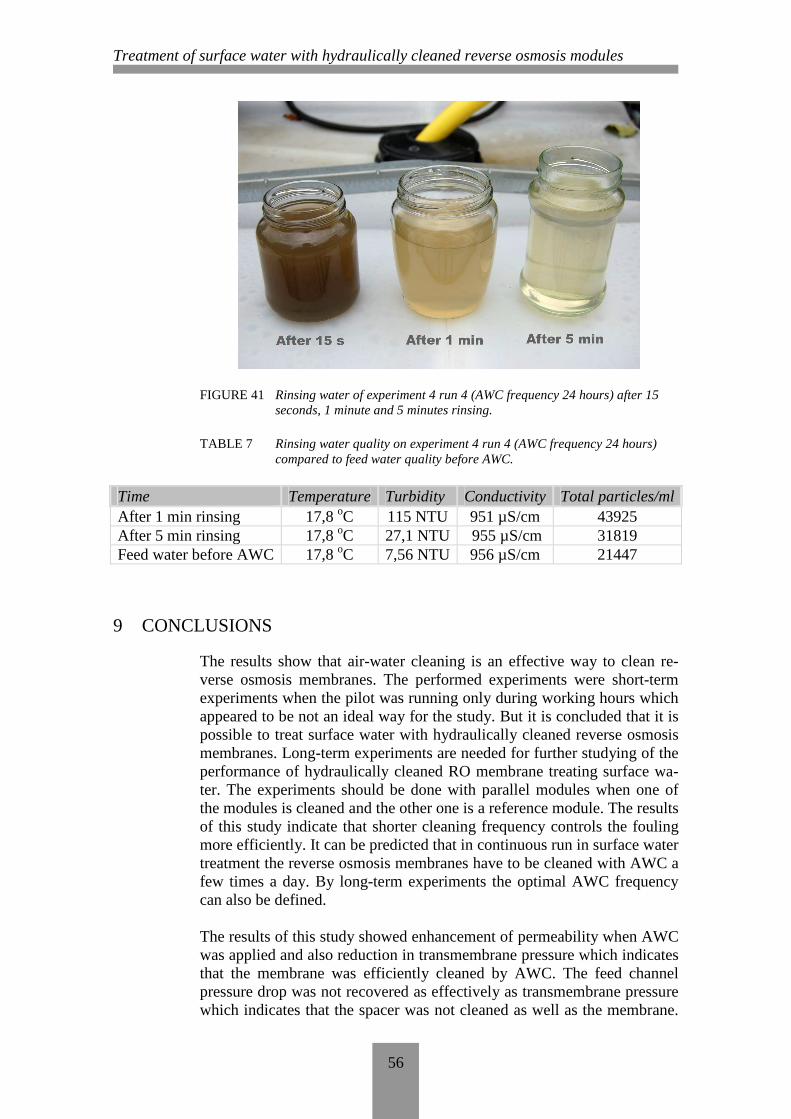
Treatment of surface water with hydraulically cleaned reverse osmosis modules
56
FIGURE 41 Rinsing water of experiment 4 run 4 (AWC frequency 24 hours) after 15
seconds, 1 minute and 5 minutes rinsing. TABLE 7 Rinsing water quality on experiment 4 run 4 (AWC frequency 24 hours)
compared to feed water quality before AWC.
Time Temperature Turbidity Conductivity Total particles/ml After 1 min rinsing 17,8 oC 115 NTU 951 µS/cm 43925 After 5 min rinsing 17,8 oC 27,1 NTU 955 µS/cm 31819 Feed water before AWC 17,8 oC 7,56 NTU 956 µS/cm 21447
9 CONCLUSIONS
The results show that air-water cleaning is an effective way to clean re-verse osmosis membranes. The performed experiments were short-term experiments when the pilot was running only during working hours which appeared to be not an ideal way for the study. But it is concluded that it is possible to treat surface water with hydraulically cleaned reverse osmosis membranes. Long-term experiments are needed for further studying of the performance of hydraulically cleaned RO membrane treating surface wa-ter. The experiments should be done with parallel modules when one of the modules is cleaned and the other one is a reference module. The results of this study indicate that shorter cleaning frequency controls the fouling more efficiently. It can be predicted that in continuous run in surface water treatment the reverse osmosis membranes have to be cleaned with AWC a few times a day. By long-term experiments the optimal AWC frequency can also be defined. The results of this study showed enhancement of permeability when AWC was applied and also reduction in transmembrane pressure which indicates that the membrane was efficiently cleaned by AWC. The feed channel pressure drop was not recovered as effectively as transmembrane pressure which indicates that the spacer was not cleaned as well as the membrane.

Treatment of surface water with hydraulically cleaned reverse osmosis modules
57
Reference experiments proved that particles were effectively removed with AWC. It was found that the air-water cleaning time should be chosen according to the fouling quantity or depending on the cleaning frequency. The foul-ing was both particle and biofouling which could have affected the rinsing time. Further study is required for rinsing time when rinsing is applied with surface water. Further studies are also suggested to study the optimal air/water ratio. These experiments showed that it is possible to treat surface water with hydraulically cleaned reverse osmosis membranes and the pretreatment do not have to be extensive. The results showed that less pretreatment re-quires short cleaning frequency. The performance of pretreatment would also be better observed with long-term experiments and it would give a better overview how often filters need to be changed. In these experiments the filters were dirty and changed after 30 hours of operation which sug-gests that during long-term operation they would have to be changed every day. In short-term experiments the coarse cartridge filter of 100 µm was enough pretreatment to prevent the severe fouling of the membrane. Based on these experiments modifications in the pilot are also suggested. Parallel modules are required and the pilot should be made more auto-matic. A data logger for pressure drop or a differential pressure transmitter and digital flow meters for feed and permeate would make the results more accurate and the pilot easier to operate. Overall further studies are required but air-water cleaning seems to be an applicable technique for treatment of surface water with reverse osmosis membranes. It is possible to control fouling with hydraulic cleaning but it seems that only air-water cleaning is not enough to clean membranes. Hy-draulic cleaning can not yet replace chemical cleaning but it is a cost-effective cleaning method and reduces the costs caused by fouling.

Treatment of surface water with hydraulically cleaned reverse osmosis modules
58
SOURCES
Cabassud C, Laborie S, Laine J.M. How slug flow can improve ultrafiltra-tion flux in organic hollow fibers. 1997. Journal of membrane science vol-ume 128 issue 1. Crittenden J.C, Trussel R.R, Hand D.W, Howe K.J, Tchobanoglous G. Water treatment: principles and design. 2005. 2nd edition. John Wiley & sons. Compton engineering, Inc. 2007. Referred 31.7.2009. http://www.comptonengineering.com/pascagoula.html Cornelissen E.R, Rebour L, Van der Kooij D, Wessels L.P. Optimization of air/water cleaning (AWC) in spiral wound elements. 2009. Desalination volume 236 issues 1-3. Cornelissen E.R, Vrouwenvelder J.S, Heijman S.G.J, Viallefont X.D, Van der Kooij D, Wessels L.P. Periodic air/water cleaning for control of bio-fouling in spiral wound membrane elements. 2007. Journal of membrane science volume 287 issue 1. Cornelissen E.R, Harmsen D, Beerendonk E.F, Wessels L.P, Van der Kooij D. Influence of permeation on air/water cleaning of spiral wound membrane NF/RO elements. 2009. 8th International Symposium on Water Supply Technology, Kobe (Japan), 10-12th June 2009. Cornelissen E.R, Viallefont X.D, Beerendonk E.F, Wessels L.P. Air/water cleaning for the control of particulate fouling. 2009. 8th International Symposium on Water Supply Technology, Kobe (Japan), 10-12th June 2009.
Flemming H. –C. Reverse osmosis membrane biofouling. 1997. Experi-mental thermal and fluid science volume 14 issue 4.
Greenlee L.F, Lawler D.F, Freeman B.D, Marrot B, Moulin P. Reverse osmosis desalination: Water resources, technology, and today’s chal-lenges. 2009. Water research volume 43 issue 9. Griebe T, Flemming H.-C. Biocide-free antifouling strategy to protect RO membranes from biofouling. 1998. Desalination volume 118 issues 1-3. Hallsby A. Keeping your membrane system running, running, running and running… 2006. Nalco membrane solutions. Referred 31.7.2009. http://www.pe.tamu.edu/gpri-new/home/BrineDesal/MembraneWkshpAug06/Hallsby8-06.pdf

Treatment of surface water with hydraulically cleaned reverse osmosis modules
59
Halper D.F, McArdle J, Antrim B. UF pretreatment for SWRO: pilot stud-ies. 2005. Desalination volume 182 issues 1-3. Hu J.Y, Song L.F, Ong S.L, Phua E.T, Ng W.J. Biofiltration pretreatment for reverse osmosis (RO) membrane in a water reclamation system. 2005. Chemosphere volume 59 issue 1. Koch membrane systems. 2008. Referred 29.7.2009. http://www.kochmembrane.com/mbr_modules.html. Li Q.Y, Ghosh R, Bellara S.R, Cui Z.F, Pepper D.S. Enhancement of ul-trafiltration by gas sparging with flat sheet membrane modules. 1998. Separation and purification technology volume 14 issues 1-3. Liikanen R. Kalvosuodatustekniikat – vaihtoehtoja veden- ja jätevedenkä-sittelyyn. 2007. Vesitalous issue 3. Mosqueda-Jimenez D.B & Huck P.M. Effect of biofiltration as pretreat-ment on the fouling of nanofiltration membranes. 2009. Desalination 245 issues 1-3. Sauvet-Goichon B. Ashkelon desalination plant – a successful challenge. 2007. Desalination 203 issues 1-3. Shubham Inc. Referred 29.7.2009. http://www.shubhamindia.com/ultra_filtration.htm Speth T.F, Gusses A.M, Summers R.S. Evaluation of nanofiltration pre-treatments for flux loss control. 2000. Desalination 130 issue 1. Van der Kooij D, Hijnen W, Cornelissen E. Biofouling of spiral-wound membranes in water treatment. 2009. KWR. BTO 2009.039. Van Hoof S.C.J.M, Minnery J.G, Mack B. Dead-end ultrafiltration as al-ternative pre-treatment to reverse osmosis in seawater desalination: a case study. 2001. Desalination volume 131 issues 1-3. Vrouwenvelder J.S, van Paassen J.A.M, van Agtmaal J.M.C, van Loos-drecht M.C.M, Kruithof J.C. A critical flux to avoid biofouling of spiral wound nanofiltration and reverse osmosis membrane: Fact or fiction? 2009. Journal of membrane science volume 326 issue 1. Vrouwenvelder J.S, Graf von der Schulenburg D.A, Kruithof J.C, Johns M.L, Van Loosdrecht M.C.M. Biofouling of spiral-wound nanofiltration and reverse osmosis membranes: a feed spacer problem. 2009. Water re-search volume 43 issue 3. WaterForum Online. 2005. Updated 6.10.2009. Referred 6.10.2009. http://www.waterforum.net/index.asp?url=/template_a2.asp&que=paginanr=2956

Treatment of surface water with hydraulically cleaned reverse osmosis modules
60
WaterForum Online. 2008. Updated 6.10.2009. Referred 6.10.2009. http://www.waterforum.net/index.asp?url=/template_a1.asp&que=paginanr=5939 Zhu X, Elimelech M. Colloidal fouling of reverse osmosis membranes: measurements and mechanisms. 1997. Environmental science and tech-nology volume 31.
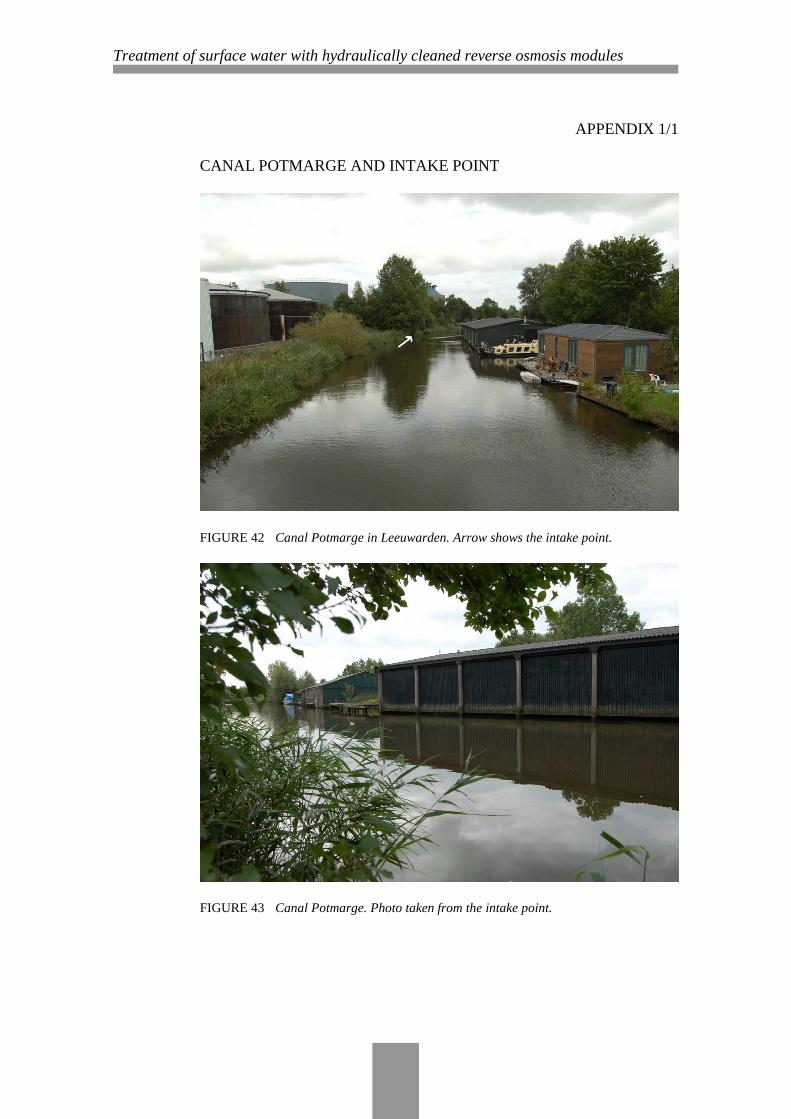
Treatment of surface water with hydraulically cleaned reverse osmosis modules
APPENDIX 1/1
CANAL POTMARGE AND INTAKE POINT
FIGURE 42 Canal Potmarge in Leeuwarden. Arrow shows the intake point.
FIGURE 43 Canal Potmarge. Photo taken from the intake point.

Treatment of surface water with hydraulically cleaned reverse osmosis modules
APPENDIX 1/2
CANAL POTMARGE AND INTAKE POINT
FIGURE 44 Intake point.

Treatment of surface water with hydraulically cleaned reverse osmosis modules
APPENDIX 2/1
LABORATORY ANALYSIS TABLE 8 Laboratory results on sample date 8.9.2009 (experiment 2).
Parameter Unit Feed tank After pretreatment Permeate pH - 7,56 7,61 5,69 Colour mg Pt/CO/l 46 49 <3 TOC mg/l 14 14 <0,5 DOC mg/l 12 13 <0,5 Suspended solids mg/l 7,8 9,3 <0,5 UV 254 1/m 37 37 <1,0 Colony forming units /ml >100000 >100000 22 Hardness mmol/l 1,53 1,57 <0,02 oD 8,5 8,8 <0,1 Ca2+ mg/l 43,0 44,3 <0,5 Fe2+ mg/l 0,248 0,276 <0,01 Mg2+ mg/l 11,0 11,2 <0,1 Mn2+ mg/l 0,064 0,049 <0,005 Na+ mg/l 110 111 1,30 K+ mg/l 10 10 0,3 Cl- mg/l 140 140 <3
TABLE 9 Laboratory results on sample date 17.9.2009 (experiment 3).
Parameter Unit Feed tank After pretreatment Permeate pH - 7,61 7,75 5,86 Colour mg Pt/CO/l 71 77 <3 TOC mg/l 14 13 <0,5 DOC mg/l 13 12 <0,5 Suspended solids mg/l 6,8 7,4 <0,5 Total dissolved solids mg/l 560 550 <5 UV 254 1/m 40 41 <0,2 Alkalinity mg/l 206 206 <10 Hardness mmol/l 1,72 1,78 <0,02 oD 9,6 10,0 <0,1 Ca2+ mg/l 47,6 49,3 <0,5 Fe2+ mg/l 0,221 0,235 <0,01 Mg2+ mg/l 12,9 13,3 <0,1 Mn2+ mg/l 0,059 0,053 <0,005 Na+ mg/l 121 124 1,50 K+ mg/l 11 11 <0,1 Cl- mg/l 160 160 <3
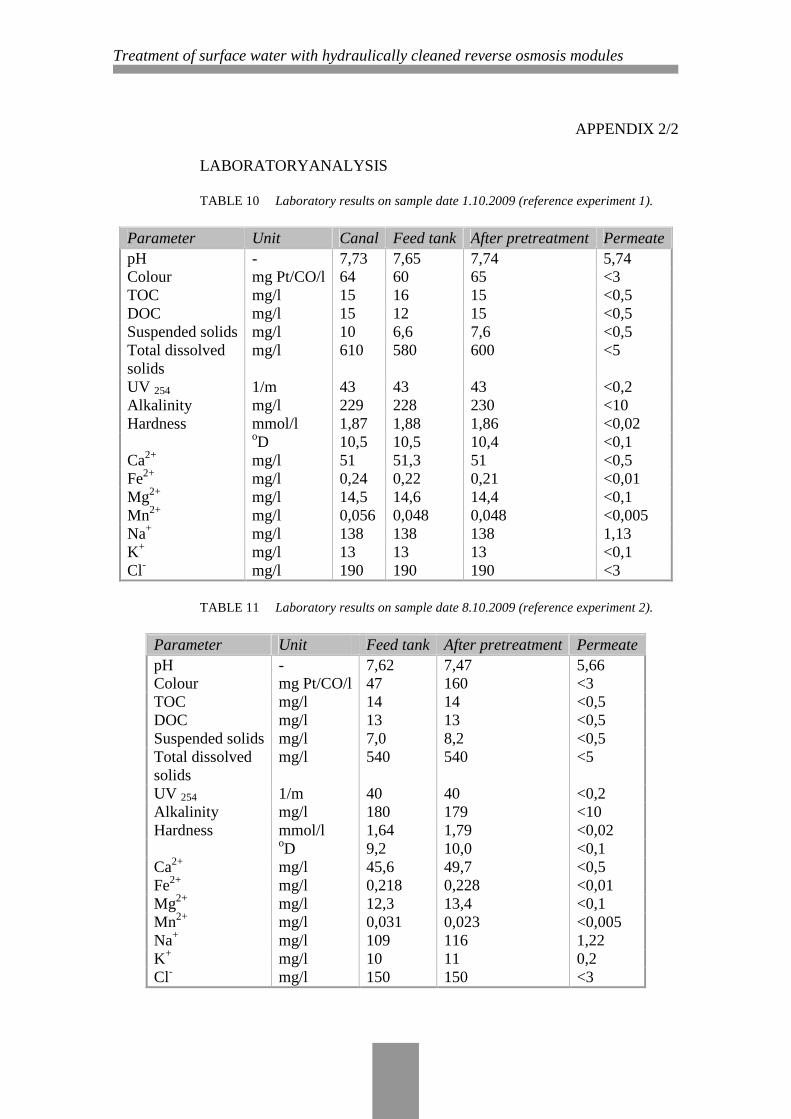
Treatment of surface water with hydraulically cleaned reverse osmosis modules
APPENDIX 2/2
LABORATORYANALYSIS TABLE 10 Laboratory results on sample date 1.10.2009 (reference experiment 1).
Parameter Unit Canal Feed tank After pretreatment Permeate pH - 7,73 7,65 7,74 5,74 Colour mg Pt/CO/l 64 60 65 <3 TOC mg/l 15 16 15 <0,5 DOC mg/l 15 12 15 <0,5 Suspended solids mg/l 10 6,6 7,6 <0,5 Total dissolved solids
mg/l 610 580 600 <5
UV 254 1/m 43 43 43 <0,2 Alkalinity mg/l 229 228 230 <10 Hardness mmol/l 1,87 1,88 1,86 <0,02 oD 10,5 10,5 10,4 <0,1 Ca2+ mg/l 51 51,3 51 <0,5 Fe2+ mg/l 0,24 0,22 0,21 <0,01 Mg2+ mg/l 14,5 14,6 14,4 <0,1 Mn2+ mg/l 0,056 0,048 0,048 <0,005 Na+ mg/l 138 138 138 1,13 K+ mg/l 13 13 13 <0,1 Cl- mg/l 190 190 190 <3
TABLE 11 Laboratory results on sample date 8.10.2009 (reference experiment 2).
Parameter Unit Feed tank After pretreatment Permeate pH - 7,62 7,47 5,66 Colour mg Pt/CO/l 47 160 <3 TOC mg/l 14 14 <0,5 DOC mg/l 13 13 <0,5 Suspended solids mg/l 7,0 8,2 <0,5 Total dissolved solids
mg/l 540 540 <5
UV 254 1/m 40 40 <0,2 Alkalinity mg/l 180 179 <10 Hardness mmol/l 1,64 1,79 <0,02 oD 9,2 10,0 <0,1 Ca2+ mg/l 45,6 49,7 <0,5 Fe2+ mg/l 0,218 0,228 <0,01 Mg2+ mg/l 12,3 13,4 <0,1 Mn2+ mg/l 0,031 0,023 <0,005 Na+ mg/l 109 116 1,22 K+ mg/l 10 11 0,2 Cl- mg/l 150 150 <3

Treatment of surface water with hydraulically cleaned reverse osmosis modules
APPENDIX 3/1
TURBIDITY DURING EXPERIMENTS 1- 4 AND REFERENCE EX-PERIMENTS 1-2.
FIGURE 45 Turbidity during experiment 1 (filter size 5 µm).
FIGURE 46 Turbidity during experiment 2 (filter size 20 µm).

Treatment of surface water with hydraulically cleaned reverse osmosis modules
APPENDIX 3/2
TURBIDITY DURING EXPERIMENTS 1-4 AND REFERENCE EX-PERIMENTS 1-2.
FIGURE 47 Turbidity during experiment 3 (no filters).
FIGURE 48 Turbidity during experiment 4 (no filters).

Treatment of surface water with hydraulically cleaned reverse osmosis modules
APPENDIX 3/3
TURBIDITY DURING EXPERIMENTS 1-4 AND REFERENCE EX-PERIMENTS 1-2.
FIGURE 49 Turbidity during reference experiment 1 (filter size5 µm).
FIGURE 50 Turbidity during reference experiment 2 (filter size 20 µm).

Treatment of surface water with hydraulically cleaned reverse osmosis modules
APPENDIX 4/1
PARTICLES DURING EXPERIMENTS 1-4 AND REFERENCE EX-PERIMENTS 1-2.
FIGURE 51 Particles during experiment 1 (filter size 5 µm).
FIGURE 52 Particles during experiment 2 (filter size 20 µm).

Treatment of surface water with hydraulically cleaned reverse osmosis modules
APPENDIX 4/2
PARTICLES DURING EXPERIMENTS 1-4 AND REFERENCE EX-PERIMENTS 1-2.
FIGURE 53 Particles during experiment 3 (no filters).
FIGURE 54 Particles during experiment 4 (no filters).

Treatment of surface water with hydraulically cleaned reverse osmosis modules
APPENDIX 4/3
PARTICLES DURING EXPERIMENTS 1-4 AND REFERENCE EX-PERIMENTS 1-2.
FIGURE 55 Particles during reference experiment 1 (filter size 5 µm).
FIGURE 56 Particles during reference experiment 2 (filter size 20 µm).

Treatment of surface water with hydraulically cleaned reverse osmosis modules
APPENDIX 5/1
RETENTION DURING EXPERIMENTS 1-4 AND REFERENCE EX-PERIMENTS 1-2.
FIGURE 57 Retention during experiment 1.
FIGURE 58 Retention during experiment 2.

Treatment of surface water with hydraulically cleaned reverse osmosis modules
APPENDIX 5/2
RETENTION DURING EXPERIMENTS 1-4 AND REFERENCE EX-PERIMENTS 1-2.
FIGURE 59 Retention during experiment 3.
FIGURE 60 Retention during experiment 4.

Treatment of surface water with hydraulically cleaned reverse osmosis modules
APPENDIX 5/3
RETENTION DURING EXPERIMENTS 1-4 AND REFERENCE EX-PERIMENTS 1-2.
FIGURE 61 Retention during reference experiment 1.
FIGURE 62 Retention during reference experiment 2.

Treatment of surface water with hydraulically cleaned reverse osmosis modules
APPENDIX 6/1
PERMEATE FLUX DURING EXPERIMENTS 1-4 AND REFERENCE EXPERIMENTS 1-2.
FIGURE 63 Permeate flux during experiment 1.
FIGURE 64 Permeate flux during experiment 2.

Treatment of surface water with hydraulically cleaned reverse osmosis modules
APPENDIX 6/2
PERMEATE FLUX DURING THE EXPERIMENTS 1-4 AND THE REFERENCE EXPERIMENTS 1-2.
FIGURE 65 Permeate flux during experiment 3.
FIGURE 66 Permeate flux during experiment 4.

Treatment of surface water with hydraulically cleaned reverse osmosis modules
APPENDIX 6/3
PERMEATE FLUX DURING THE EXPERIMENTS 1-4 AND THE REFERENCE EXPERIMENTS 1-2.
FIGURE 67 Permeate flux during reference experiment 1.
FIGURE 68 Permeate flux during reference experiment 2.

Treatment of surface water with hydraulically cleaned reverse osmosis modules
APPENDIX 7
LOCATIONS OF COOPERATION PARTNERS
FIGURE 69 Locations of cooperation partners.