treatment with microfiber cloth, ultrafiltration, and ...€¦ · ph 2.0. concentrated chemical was...
TRANSCRIPT

IWC 16-50
Treatment with Microfiber Cloth, Ultrafiltration, and Double-Pass Reverse Osmosis Allows Reuse of High-Salinity
Industrial Wastewater
DAVE HOLLAND Aqua-Aerobic Systems, Inc.
Loves Park, IL
ANTHONY ROGERS The Lubrizol Corporation
Deer Park, TX
IWC 16-50
KEYWORDS: Reuse, reclamation, microfiber, ultrafiltration, reverse-osmosis, membrane
ABSTRACT
This paper details a pilot study treating high-salinity secondary effluent from the production of specialty chemical additives. The study used pretreatment with microfiber filtration and low-pressure ultrafiltration, followed by two-pass reverse osmosis. The maximum suspended and dissolved solids were reduced from 200 to 2 mg/l and 17,000 to 22 mg/l, respectively, with relatively low feed pressure and no observed membrane fouling (pressure drop increase). In addition, total system recoveries approached 50%, which is in line with typical seawater and other high-salinity applications.

IWC 16-50
INTRODUCTION
The water shortage affecting most of the United States is forcing industries to look for ways to return more of their wastewater back to their production processes, therefore allowing them to rely less on external water sources. These wastewaters often contain high levels of dissolved material that must be removed before the stream can be reused, typically with either ion exchange (IX) or reverse osmosis (RO). Both of these processes must have relatively low levels of total suspended solids (TSS) in the influent, requiring pretreatment with some type of media and/or membrane filtration. Because IX systems use significant amounts of chemical, many facilities are gravitating to RO in order to be more environmentally-friendly. To minimize particulate and biological fouling of the RO membranes, the influent TSS must be lowered enough to achieve a 15-minute silt density index (SDI15) of less than 5%, preferably less than 3%; this is normally accomplished with a deep-bed filter or low-pressure membrane system.
The challenge for plants with high-strength wastewaters is to design a treatment system that can achieve the highest salt rejection and water recovery with minimal fouling of the pretreatment media and RO membranes. The pretreatment system is even more critical for these plants because the chance of irreversible fouling of the RO membranes is much higher. Since the early 1990s, cloth media filtration (CMF) has been used for tertiary treatment at thousands of wastewater treatment plants worldwide. At these plants, CMF has been able to handle total suspended solids (TSS) spikes up to several hundred mg/L (ppm), mostly because of a very effective cleaning apparatus, the ability of the cloth to perform like a depth filter, and an outside-in flow path that enables the filter to double as a settling basin.
Because of the success of the cloth on wastewater, testing was performed on municipal wastewater in which a filter containing microfiber cloth was placed in front of a UF membrane, resulting in stable UF operation at 30-45% higher flux than was achievable without the filter (Holland, 2013). Similar testing was also performed on seawater, where pretreatment with microfiber cloth resulted in less UF fouling, lower overall system O&M cost, and improved ability to handle variable TSS and turbidity loadings (Reid, 2015).
Guided by the findings of these tests, a pilot study was set up at the Lubrizol Corporation in Deer Park, TX to see if this same configuration would yield similar results treating chemical production wastewater containing TSS and total dissolved solids (TDS) concentrations as high as 200 and 17,000 mg/l, respectively.

IWC 16-50
METHODOLOGY
The purpose of the study was to determine the economic viability of a CMF/UF/RO system treating plant wastewater for reuse in the production of specialty chemical additives and as boiler makeup water. The specific objectives of the pilot were to: investigate performance of CMF, UF, and RO on a treated industrial wastewater, compare effluent quality of each pass of a double-pass RO, identify feasibility of reuse scenarios, and assess design optimization considerations.
TEST FACILITIES - The study was conducted on-site at Lubrizol’s Deer Park, TX facility. Set-up and commissioning took place from February 10 to February 13, 2015, and the data was collected for a period of two work-weeks from February 16 through February 27, 2015. As shown in Figure 1, effluent from the plant’s conventional activated sludge system was first pumped through a rented CMF unit containing six 5 m2 (54 ft2) disks of microfiber cloth, where nearly all of the particles larger than 5 µm (0.0002 in) were removed. Most of the CMF effluent was sent to the plant’s outfall, while a small portion of the effluent was pumped through the pilot plant, which consisted of a 300-µm (0.0118 in) strainer, 70-m2 (754 ft2) UF module, 1,000-gallon (3.8 m3) break tank, and double-pass RO containing (16) 37 m2 (400 ft2) thin-film composite elements. The first pass of the RO system consisted of (3) housings arranged in a 2-stage 2 x 1 array in series, and the second pass of the RO system consisted of (1) housing with each housing containing (4) elements.
Figure 1: Pilot System Layout
A coagulant, ferric chloride, was injected into the UF feed to bind with some of the organic material in the water, allowing it to be removed by the UF and easily backwashed off. The strainer was used to protect the UF membrane in the unlikely event that larger solids were present in the CMF effluent. The UF membrane removed nearly all particles larger than 0.02 µm (7.9 x 10⁻⁷ in). An antiscalant was injected into the RO feed to increase the solubility of
Feed Tank
Cloth Media Filter 300µm
Strainer Break Tank
UF
Double-Pass RO
Outfall
Process Water
Secondary Effluent
Outfall
Antiscalant
FeCl3

IWC 16-50
hardness and heavy metal salts, preventing premature scaling of the RO elements. The bulk of the TDS was removed by the first-pass RO elements, with the concentrated salts discharging to the plant’s outfall. Most of the remaining TDS was removed by the second pass as the first-pass permeate passed through it, with the concentrated salts recycling back to the first-pass influent.
Both filter and UF were backwashed periodically to remove accumulated solids. The filter used a 1.5 kW (2 HP) backwash pump, while the UF unit used a 1.1 kW (1.5 HP) backwash pump. In addition, the UF was cleaned daily with caustic at a pH of 12.2 followed by hydrochloric acid at pH 2.0. Concentrated chemical was injected into the backwash water, the membrane soaked in the dilute chemical for 15 minutes, and the chemical was rinsed out. All of the wastewater from the backwashes and chemical cleanings were collected in a plant sump and pumped back to the head of the treatment plant. The RO system did not require cleaning during the pilot.
During commissioning, jar tests were performed on CMF effluent samples to determine the optimum ferric chloride dose. Concentrations of 5, 10, 15, and 20 mg/l of ferric chloride (as Fe) were made up, mixed for 2 minutes, and run through a 0.45 µm (1.8 x 10⁻⁵ in) filter paper, yielding the results shown in Figure 2. As you can see, the coagulant had very little effect on the total organic carbon (TOC) of the filtered sample (equivalent to the dissolved organic carbon, DOC); since 15 mg/l Fe reduced the DOC the most, this dosage was selected for the pilot run.
Figure 2: Ferric Chloride Jar Test Results
Because DOC reduction via coagulant addition appeared minimal, jar tests were performed on CMF effluent samples to determine the benefit, if any, of adding powdered activated carbon (PAC) in lieu of coagulant. Concentrations of 10, 50, 100, 500, 1000, 1200, and 1500 mg/l of PAC (as C) were mixed with the water, then the mixture was settled for 5, 15, or 30 minutes and passed through a 0.45 µm (1.8 x 10⁻⁵ in) filter paper. The results are shown in Figure 3.

IWC 16-50
Significant DOC reduction occurred only at the higher PAC doses and settling times. It was determined that running the planned full-scale 1.0 MGD system at these high doses and times would be cost-prohibitive; therefore, ferric chloride was used during the pilot instead.
Figure 3: PAC Jar Test Results
CMF Operation The plant’s secondary effluent was pumped first into the CMF rental unit. As shown in Figure 4, this feed flowed over the influent weir, through the unit’s six 5 m2 (54 ft2) disks (shown as one yellow disk for simplification), into the hollow centertube (green), over the effluent weir, and into the discharge line. Both sides of each disk were covered with Aqua-Aerobic Systems’ OptiFiberPES-14® polyester microfiber cloth media, with a nominal removal rating of 5 μm (0.0002 inch).
During filtration, the fibers on the cloth laid down against the cloth backing, as shown in Figure 5. This resulted in a filtration depth of 3 – 5 mm (0.12 – 0.20 in), allowing the cloth to hold up to 77 kg/m2 (3.25 lbs/ft2) of solids and handle TSS spikes above 500 mg/L (ppm). The water level within the filter basin increased as solids accumulated on the cloth.

IWC 16-50
Figure 4: CMF Filtration Flow Path
Figure 5: CMF Filtration Depth
When the level increased by 0.3 m (12 in), the unit went into backwash, shown in Figure 6. During backwash, the unit’s drive motor rotated the center tube, and an electric valve opened to allow a centrifugal vacuum pump to pull filtered water from inside each disk through two backwash shoes (orange) pressed against the cloth on both sides of the disk. This high-velocity reverse flow drew the particulates from the cloth media, renewing the cleaning capacity and lowering the basin water level and media differential pressure.
During backwash, the vacuum pulled on the fibers caused them to extend fully, as shown in Figure 7, releasing the particles trapped within the fibers. The openings in the cloth backing are much larger than on other cloth filters; this resulted in a higher backwash flow, assuring that all of the solids were removed.
3-5 mm

IWC 16-50
Figure 6: CMF Backwash Flow Path
Figure 7: Cloth Fibers During Backwash
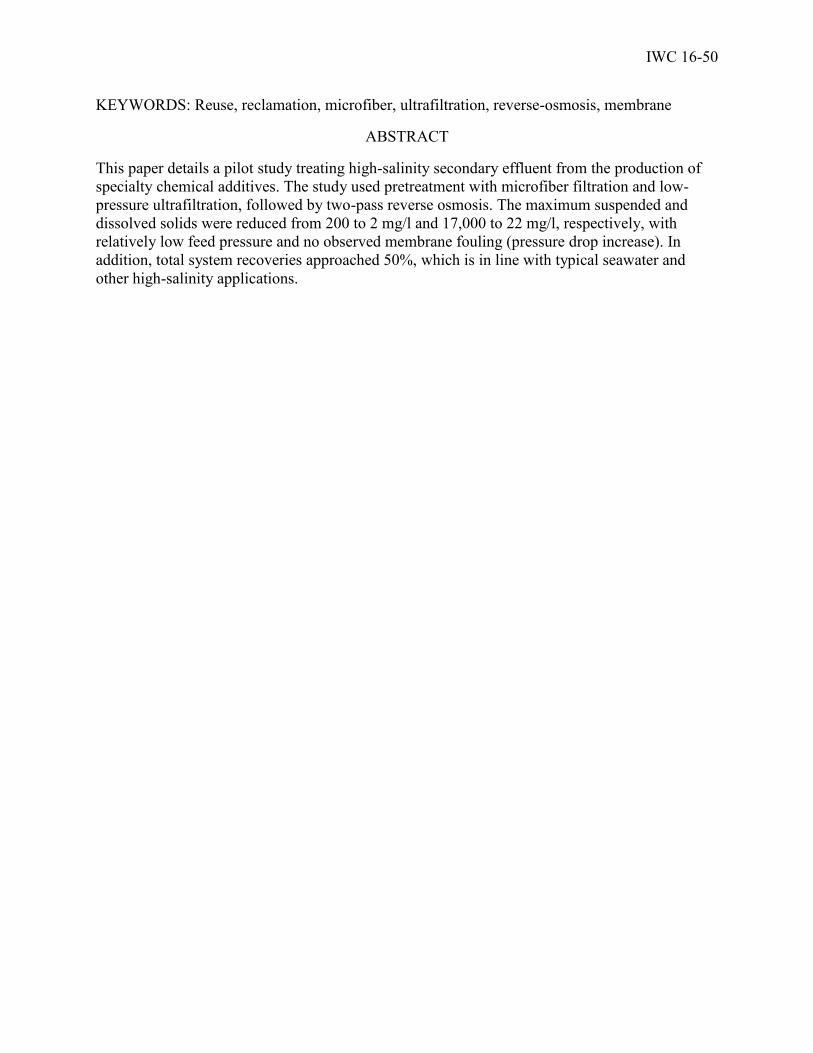
The filter’s outside-in flow path allowed heavier particles to settle to the bottom of the tank, as shown in Figure 8. To remove the accumulated solids from the tank, a second electric valve opened after every sixth backwash, allowing the vacuum pump to draw out the solids through a manifold attached to the tank floor.
IWC 16-50
Figure 8: Removal of Settled Solids
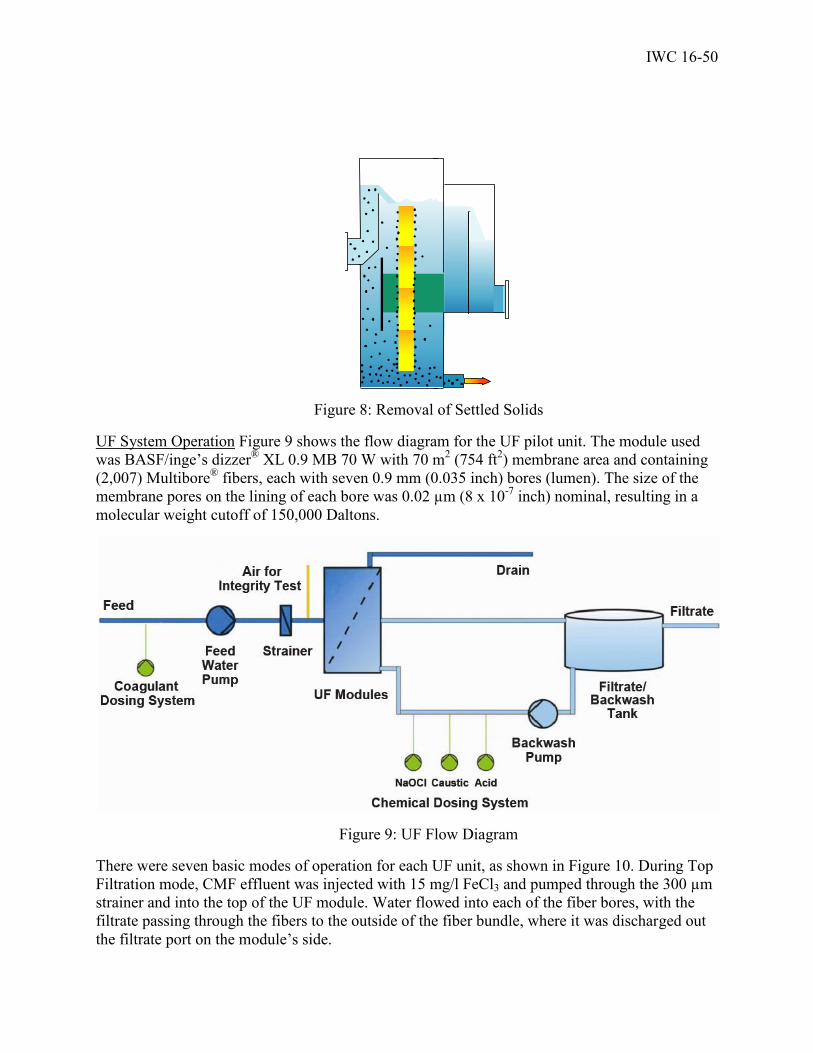
UF System Operation Figure 9 shows the flow diagram for the UF pilot unit. The module used was BASF/inge’s dizzer® XL 0.9 MB 70 W with 70 m2 (754 ft2) membrane area and containing (2,007) Multibore® fibers, each with seven 0.9 mm (0.035 inch) bores (lumen). The size of the membrane pores on the lining of each bore was 0.02 µm (8 x 10⁻⁷ inch) nominal, resulting in a molecular weight cutoff of 150,000 Daltons.
Figure 9: UF Flow Diagram
There were seven basic modes of operation for each UF unit, as shown in Figure 10. During Top Filtration mode, CMF effluent was injected with 15 mg/l FeCl3 and pumped through the 300 µm strainer and into the top of the UF module. Water flowed into each of the fiber bores, with the filtrate passing through the fibers to the outside of the fiber bundle, where it was discharged out the filtrate port on the module’s side.

IWC 16-50
Figure 10: UF Operating Modes
After 30 minutes, the UF unit went into the Top Backwash mode to remove foulants from the membrane pores and surfaces. During this mode, low-turbidity water in the filtrate/backwash tank was pumped in the reverse direction through the membrane (from outside the fibers to inside the fiber bores) and out the bottom of the module to drain.
After the 1-minute backwash, the unit went into its Bottom Filtration mode; this was the same as the Top Filtration mode, only the feed went into the bottom of the module. Then, after another 30 minutes, the unit went into its Bottom Backwash mode; this was the same as the Top Backwash mode, only the flow came out the top of the module. Following the 1-minute backwash, the unit returned to its Top Filtration mode, and the entire cycle was repeated. The feed inlet and drain outlet were alternated in this manner to more evenly deposit, and then remove, the solids over the entire membrane length.
Every 12 hours, the UF unit went into the Top Chemically-Enhanced Backwash (CEB) mode to remove any foulant not being backwashed off the membrane. This mode was the same as the Top Backwash mode, only at about half-flow, and concentrate chemical was injected into the filtrate just prior to entering the module to create the proper pH. After 40 seconds, the unit went into its Bottom CEB, which is the same as Top CEB, only the waste flow exits the top of the module. After 20 seconds, the unit went into a 15-minute soak, followed by both a Top and Bottom Backwash to rinse out the chemical. The chemical used would alternate every 12 hours
Except for Day 10, which used a 10-minute filtration time. Except for Day 10, which used a 10-minute filtration time.

IWC 16-50
between 30% hydrochloric acid (HCl) to get a 2.0 pH and 50% sodium hydroxide (NaOH) to get a 12.2 pH. When NaOH was used, it was immediately followed by HCl in order to prevent hardness precipitation that can occur at high pHs. As a result, the UF was cleaned with acid every 12 hours and with caustic every 24 hours.
Every 72 hours (3 days), a CEB with 12.5% sodium hypochlorite (NaOCl) was also performed using the same steps, only the concentrated chemical was injected into the backwash water to get a NaOCl concentration of 20 mg/l (ppm). The soak for these chlorine cleanings was only 10 minutes.
As noted above, the filtration flow through each multi-bore fiber was from inside the bores through the fiber material to the outside of the fiber. Each fiber was made of a single piece of polyethersulfone (PES) with three distinct pore sizes, as shown in Figure 11. The filtration occurred on the surface of each bore, where there was a thin layer of the smallest pore size; nearly all of the trans-membrane pressure (TMP) occurred within this layer. Once through this layer, the filtrate flowed with very little resistance through the material between and around the bores, which had the largest pore size. Finally, the filtrate exited the fiber through a thin layer of slightly smaller pores, which were still 100 times larger than the separation layer.
Figure 11: UF Fiber Cross-section with Filtration Flow Paths
RO System Operation Figure 12 shows the flow diagram for the RO pilot unit. The UF filtrate was injected with GE MDC220 antiscalant/antifoulant to maintain a concentration of 3.2 mg/l (ppm) in the RO influent. The influent was pressurized to up to 450 psig with a 75 HP multi-stage high-pressure centrifugal pump then sent through the two housings in the first stage of the first-pass, which contained Dow BW30-400 membranes. The high pressure overcame the osmotic pressure of the salts in the wastewater, driving low-TDS permeate through the RO membranes and into the first-pass product line. This resulted in increasing salt concentration as the flow moved through the housings. Concentrate (reject) from the first-stage housings passed through the single second-stage housing, which contained Hydranautics ESPA2 membranes.
0.02 µm 10 µm 2 µm
Separation Layer Spongy Support Structure
Outer Layer

IWC 16-50
The reverse osmosis process was repeated, with the reject from the second-stage housing going to the plant’s sanitary sewer, and the first-pass product going through the single housing in the second pass. Because the second-pass reject was relatively low in TDS, it was recycled back to the inlet of the first pass. The product streams from both passes were combined together and made available for reuse in the plant’s production process.
Figure 12: RO Flow Paths
Operating Settings Tables 1 and 2 list the settings that changed during each of the five trials.
Table 1: UF Daily Operating Conditions
Description Units Days 1-2
Days 3-6
Day 7
Days 8-9
Day 10
Feed Flow (GPM) 15.4 17.0 18.5 17.0 15.4 Coagulation Chambers Used No. 5 5 5 5 5 Coagulation Detention Sec. 172 157 144 157 172
RESULTS
During the pilot study, flows, pressures, turbidities (UF only), and conductivities (RO only) were monitored using the pilot instrumentation. In addition, RO samples were taken and analyzed for TDS. From this data, recovery, TMPs, permeability, (UF only), and salt rejections (RO only) were calculated. The following are the test results and calculations. UF RESULTS - The average UF recovery was 86.1%; however, this didn’t affect the overall pilot recovery as all of the UF backwash and CEB wastewater was returned to the front of the existing treatment plant to be wasted with the plant’s biological solids. The average UF filtrate turbidity was 0.041 NTU.
FEED
REJECT
RECYCLE
PERMEATE
CONCENTRATE
IWC 16-50
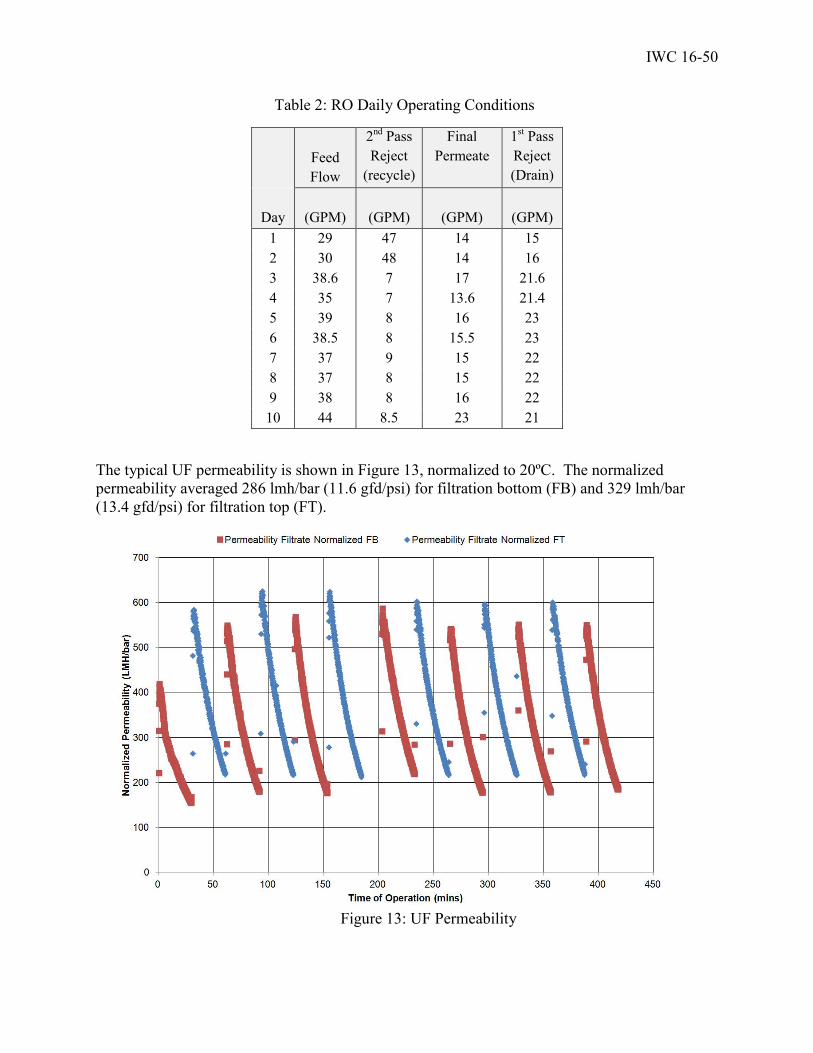
Table 2: RO Daily Operating Conditions
Feed Flow
2nd Pass Reject
(recycle)
Final Permeate
1st Pass Reject (Drain)
Day (GPM) (GPM) (GPM) (GPM) 1 29 47 14 15 2 30 48 14 16 3 38.6 7 17 21.6 4 35 7 13.6 21.4 5 39 8 16 23 6 38.5 8 15.5 23 7 37 9 15 22 8 37 8 15 22 9 38 8 16 22 10 44 8.5 23 21
The typical UF permeability is shown in Figure 13, normalized to 20ºC. The normalized permeability averaged 286 lmh/bar (11.6 gfd/psi) for filtration bottom (FB) and 329 lmh/bar (13.4 gfd/psi) for filtration top (FT).
Figure 13: UF Permeability

IWC 16-50
RO RESULTS – Figure 14 lists the TDS rejection for each RO pass and for the final permeate. The average first-pass permeate TDS was 554 mg/l (ppm), and the average second-pass permeate TDS was 14 mg/l (ppm).
Figure 14: RO TDS Rejection
Figure 15: RO Permeate Flow and Recovery

IWC 16-50
The RO permeate flows and recoveries are shown in Figure 15. As you can see, the RO achieved stable operation at a permeate flow of 15 gpm and system recovery of 40%.
Table 3 lists the RO TMPs for each of the three stages. When operating at 40% recovery during trials 3 and 4 (days 7 – 9), the TMPs actually went down. In addition, the average pressure drop through the first pass elements was only 7 psi. This data indicates that no appreciable fouling occurred during the test, even with the high influent DOC.
Table 3: RO TMPs
Transmembrane Pressure (psi)
Day 1st Pass, 1st Stage 1st Pass, 2nd Stage 2nd Pass 1 345 330 105 2 360 345 105 3 415 413 135 4 410 405 155 5 427 422 128 6 437 432 118 7 431 424 128 8 425 421 128 9 409 404 141 10 350 345 175
CONCLUSIONS
The testing results demonstrated that a CMF/UF/two-pass RO process can produce a high quality permeate from the facility’s wastewater, having very low permeate TDS concentrations of 11-22 mg/L. During the pilot evaluation, the RO permeate was produced with no observed membrane fouling, indicating economical and stable operation of a full-scale Reverse Osmosis plant is achievable. Other conclusions can be drawn from the above results: The CMF and UF provided the RO with an average turbidity of 0.042 NTU. High UF permeability (276-304 LMH/bar, 11.2-12.4 gfd/psi) means less membranes and
associated O&M costs. UF TMPs averaged 2 – 5 psi, which translates into low energy usage. ~24% TOC reduction with Ferric Chloride coagulant. High TDS rejections:
o First-Pass = 92-98% o Second-Pass = 96-99% o Total >99.8%
RO recoveries averaged 43.5%, consistent with other high-salinity RO systems. RO pressure drops averaged 7 psi through the first-pass elements. No significant increase in RO pressure drop or TMP means no appreciable fouling

IWC 16-50
REFERENCES
Holland, D., Buchta, P., and Reid, T. (2013). Evaluation of Cloth Media as Pretreatment to UF
in Waste-water Reuse. CD ROM Proceedings of the AMTA/AWWA Membrane
Technology Conference, TH-2C3.
Reid, T. and Holland, D. (2015). Depth Filtration With Microfiber Cloth Enhances Performance
of Ultrafiltration as Pretreatment to Seawater Desalination Systems. Proceedings of the
Water Environment Federation, WEFTEC 2015, 2470-2485.