treball de recerca de tercer cicle departament de medicina universitat autÒnoma … ·...
TRANSCRIPT

TREBALL DE RECERCA DE TERCER CICLE DEPARTAMENT DE MEDICINA
UNIVERSITAT AUTÒNOMA DE BARCELONA Convocatòria Setembre 2010
Títol:
Acute Damage to the Posterior Limb of the Internal Capsule
on Diffusion Tensor Tractography
as an Early Imaging Predictor of Motor Outcome after Stroke
Autor:
Josep Puig Alcàntara
Metge Especialista en Radiodiagnòstic Departament de Radiodiagnòstic
Institut de Diagnòstic per la Imatge Hospital Universitari Dr Josep Trueta
Girona
Director:
Dr. Josep Lluís Martí-Vilalta
Prof. Neurologia Universitat Autònoma de Barcelona
Director de la Unitat de Malalties Vasculars Cerebral Servei de Neurologia
Hospital de la Santa Creu i Sant Pau Barcelona
1
CERTIFICAT DEL DIRECTOR O CO-DIRECTOR DEL
TREBALL DE RECERCA
Jo, Dr. Josep Lluís Martí Vilalta, en càrrec de Professor de Neurologia de la Universitat
Autònoma de Barcelona i Director de la Unitat de Malalties Vasculars Cerebrals del
Servei de Neurologia de l'Hospital de la Santa Creu i Sant Pau de Barcelona,
FA CONSTAR,
que el treball titulat 'Acute Damage to the Posterior Limb of the Internal Capsule using Diffusion Tensor Tractography as an Early Imaging Predictor of Motor Outcome after Stroke´ ha estat realitzat sota la meva direcció pel llicenciat Josep Puig Alcántara,
trobant-se en condicions de poder ser presentat com a treball d’investigació de 12
crèdits, dins el programa de doctorat en Medicina Interna/Diagnòstic per la Imatge
(curs 2009-2010), a la convocatòria de Setembre 2010.
Barcelona, 01 de juliol de dos mil deu.
2
INDEX
Resum ................................................... 4 - 5
Introducció .............................................. 6 - 7
Material i Mètodes .................................... 7 - 11
Resultats .................................................. 9- 12
Discussió .................................................. 15 – 20
Conclusions ............................................... 20
Bibliografia ................................................ 21 – 25
Figures ....................................................... 26 – 28
Annex-Taules .............................................. 26 - 38
3

Acute Damage to the Posterior Limb of the Internal Capsule on Diffusion
Tensor Tractography as an Early Imaging Predictor of Motor Outcome
after Stroke
Abstract
Background and Purpose
Early prediction of motor outcome is of interest in stroke management. We
aimed to determine whether lesion location at DTT is predictive of motor
outcome after acute stroke and whether this information improves the predictive
accuracy of the clinical scores.
Methods
We evaluated 60 consecutive patients within 12 hours of MCA stroke onset. We
used DTT to evaluate CST involvement in the MC and PMC, CS, CR, and PLIC
and in combinations of these regions at admission, at day 3, and at day 30.
Severity of limb weakness was assessed using the m-NIHSS (5a, 5b, 6a, 6b).
We calculated volumes of infarct and FA values in the CST of the pons.
Results
Acute damage to the PLIC was the best predictor associated with poor motor
outcome, axonal damage, and clinical severity at admission (P<.001). There
was no significant correlation between acute infarct volume and motor outcome
at day 90 (P=.176, r=0.485). The sensitivity, specificity, and positive and
negative predictive values of acute CST involvement at the level of the PLIC for
4

motor outcome at day 90 were 73.7%, 100%, 100%, and 89.1%, respectively. In
the acute stage, DTT predicted motor outcome at day 90 better than the clinical
scores (R2=75.50, F=80.09, P<.001).
Conclusions
In the acute setting, DTT is promising for stroke mapping to predict motor
outcome. Acute CST damage at the level of the PLIC is a significant predictor of
unfavorable motor outcome.
Keywords
Diffusion tensor imaging, tractography, magnetic resonance imaging, stroke, outcome
Abbreviations
ANOVA=one-way analysis of variance; BI=Barthel Index; CR=corona radiate;
CS=centrum semiovale; CST=corticospinal tracts; computed tomography=CT;
DTI=diffusion tensor imaging; DTT=diffusion tensor tractography; DWI=diffusion-
weighted imaging; EPI=echoplanar imaging; FA=fractional anisotropy; FLAIR=fluid-
attenuated inversion recovery; GE=gradient-echo; IQR=interquartile range;
ICC=intraclass correlation coefficient; MRI=magnetic resonance imaging; MC=motor
cortex; MCA=middle cerebral artery; NIHSS=National Institute of Health Stroke Scale;
m-NIHSS=motor subindex scores of the NIHSS; mRS= modified Rankin Scale;
PLIC=posterior limb of the internal capsule; PMC=premotor cortex; PWI=perfusion-
weighted imaging; r=Pearson product-moment correlation coefficient; rpb=point-biserial
correlation coefficient; rFA=FA ratio; ROC=receiver operating characteristic;
ROI=region of interest; SENSE=sensitivity encoding; TR=repetition time; TE=echo
time; WD=Wallerian degeneration.
5

Introduction
Accurate early prediction of motor functional outcome in the early stage of
stroke is important for clinicians and researchers in management and
rehabilitation.1 Motor deficit after stroke is common and has a considerable
influence on quality of life.2 Several observational studies have demonstrated
that the grade of initial motor deficit is the most important determinant of motor
recovery.1-5 Other valid predictors in regression models have included infarct
site, volume of stroke, demographics, comorbidities, infarct side, and stroke
subtype.1-3,6
The CST is the main pathway that mediates voluntary movements, and
neurophysiological and structural imaging studies have evidenced that motor
outcome is heavily dependent on the integrity of the motor fibers.6-13 Thus, the
involvement of motor-related cortical regions, CR, and internal capsule
progressively decrease the probability of upper limb functional recovery.6,14
Recently, these findings were complemented by DTI studies that have
demonstrated the usefulness of DTT for predicting poor motor outcome when
infarct involves the CST.15-20 DTI enables in vivo visualization and quantification
of microstructural damage to white matter tracts.21 DTT uses data acquired
through DTI to reconstruct a three-dimensional macroscopic orientation of the
white matter fibers that enables the specific topographic relation between lesion
location and CST fibers to be evaluated.22 Decreases in FA, a DTI-derived
structural measure, have been interpreted as WD and proposed as an index of
axonal damage.23 Decreased FA in the CST correlates with motor impairment
one month after stroke.24 On the other hand, although patients with large
6

infarcts tend to have a poor outcome, functional deficits due to moderate-size
infarcts are more difficult to predict.7,25,26 One of the major reasons functional
outcome does not correlate strongly with infarct volume is that the specific site
of the lesion is not taken into account.4,9
To our knowledge, no prospective controlled studies have assessed the ability
of DTT to predict motor recovery immediately following acute MCA stroke. We
aimed 1) to evaluate whether the specific site of a lesion in the CST (primary
MC, PMC, CS, CR, PLIC, and combinations among them) at DTT predicts
axonal damage to the motor pathway and motor outcome after acute stroke,
and 2) to assess whether a model incorporating DTT information on the specific
location of the stroke and clinical scores is more accurate in predicting motor
outcome than clinical scores alone.
Subjects and Methods
Patients
The data reported were obtained from the same cohort of patients included in
our previous study relating WD and motor outcome.24 Patients included had a
first-ever MCA infarction and were admitted to our stroke unit within 12 hours of
symptom onset during a 19-month period. Patients with other lesions, cerebral
hemorrhage, significant preexisting nonischemic neurological deficit, or a history
of prior stroke that would hinder the interpretation of clinical and imaging data
were excluded. Our institutional ethics committee approved the study, and
written informed consent was obtained from all patients or from relatives.
7
Clinical Examination
A senior certified staff neurologist used the NIHSS to assess clinical deficit at
admission, at day 3, at day 30, and at day 90 from stroke onset. The m-NIHSS
subindex (5a, 5b, 6a, 6b) was used to categorize the severity of limb weakness
as grade I (total m-NIHSS score of 0), grade II (m-NIHSS, 1-4), or grade III (m-
NIHSS, 5-8). The mRS and BI were used to measure disability and dependence
in activities of daily living at day 90. Poor overall outcome was defined as
mRS>3 and/or BI<60.27 All clinical assessments were performed without
knowledge of the MRI findings. Patients were treated according to guidelines.28
MRI Protocol
All scans were performed with a whole-body 1.5-Tesla MR system (Gyroscan
Intera, Philips Medical Systems, Best, the Netherlands) with a SENSE head
coil. The routine protocol included axial trace DWI, FLAIR, T2*-weighted GE,
PWI, time-of-flight angiography, and DTI sequences. DTI was performed using
a single-shot EPI sequence with the SENSE parallel-imaging scheme
(acceleration factor 2) after contrast agent administration. Diffusion-sensitized
gradients were applied along 15 non-collinear directions with a b value of 1000
s/mm2. In addition, diffusion-weighted b0 images were obtained. Other
acquisition parameters were: TR/TE 6795/72ms, 23 x 23-cm field of view, and
112 x 112 matrix size. DTI voxel size was 2.05mm x 2.05mm x 3mm. Forty
slices covering the entire brain were obtained parallel to the bicommissural line
without interslice gaps. DTI acquisition took 3 minutes and 10 seconds.
8

Data Processing and DTI tractography
Diffusion-sensitized image sets were transferred to an offline workstation for
analysis. We used DTIweb version 2.0 (http://trueta.udg.edu/DTI/index.html) to
calculate tensor values for tractography.29 Anisotropy maps were obtained using
orientation-independent FA, and color FA maps were generated following the
standard convention (red, left-right; green, anteroposterior; and blue, superior-
inferior).
Tractography was based on a diffusion tensor deflection algorithm.30 The
threshold for stopping fiber propagation was FA<0.2 and angle<70º. The
seeding method puts randomly inside each voxel with a FA>0.4. To reconstruct
the CST, the ROIs were placed at the level of the cerebral peduncle and around
the CR in the direction-coded color axial sections. Unrelated fibers, such as
those going to the contralateral hemisphere, cerebellum, or thalamus, were
removed using specific ROIs. All ROIs were placed by two of the authors
(A.P.,G.B.); the CST depicted and the evaluation of the PMC were validated
using landmarks from neuroanatomy atlases.31
Assessment of Damage to Specific CST regions
To decide which structures were affected by infarct, the tractograms of CSTs
were superimposed on DW images, and the following specific regions were
evaluated: MC, PMC, CS, CR, PLIC, and combinations of these regions (Fig.1).
These regions were scored separately on each slice on 2 separate occasions 6
weeks apart by 1 rater (J.P.) and once by 2 raters (J.P.,S.R.); all raters were
blinded to the clinical ratings. Discordant ratings were resolved by consensus.
9

Measurement of the FA values of CSTs
FA values for each ROI on axial slices of the affected and unaffected CST at
the rostral pons were obtained by averaging all voxels of three contiguous
slices. Second, the ipsilateral-to-contralateral CST FA ratios were calculated
(rFA=FAaffected side/FAunaffected side). Two readers (J.P.,G.B.) blinded to
the clinical scores quantified FA.24
Calculation of Infarct Volume
Infarct volumes were determined offline. Two readers (J.P.,G.B.) manually
outlined the areas of abnormal hyperintensity on axial trace DW images.
Surface areas of abnormal hyperintensity were summed and multiplied by slice
thickness (6 mm) and interslice gap (1 mm) to calculate infarct volumes. The
results of the two readers were averaged.24
Statistical Analysis
To determine whether acute-stage involvement of specific CST regions and
combinations of CST regions were associated with stroke severity, clinical and
motor outcome at day 30 and at day 90, axonal damage and/or acute-phase
infarct volume, we used the chi-square test to compare categorical variables
and Student’s t test to compare quantitative variables. We used Cohen’s Kappa
coefficient to assess intraobserver and interobserver reliability. Intra- and inter-
observer agreement were classified as slight (К=0.0–0.20), fair (К=0.21–0.40),
moderate (К=0.41–0.60), substantial (К=0.61–0.80), or almost perfect (К=0.81–
1.00) according to the scale proposed by Landis and Koch.32
10

Motor outcome was first analyzed using bivariate statistics. We calculated the
correlation coefficients for lesion site and for clinical scores with motor deficit at
day 3, day 30, and day 90. Each specific CST region was coded as 0
(unaffected) or 1 (affected by infarct). The predictive data set contained both
dichotomous (involvement of specific CST region) and numerical and ratio
variables (infarct volume, rFA, m-NIHSS) for which an rpb or r was used,
respectively. Coefficients with a p-value lower than 0.05 were considered
significant.
Multiple regression analysis was used to predict motor outcome at day 90 after
stroke using a combination of motor deficit, specific CST region involved, and
imaging data. We also evaluated the additional predictive value conferred by
adding the effect of region involved to that of the motor deficit. The dependent
variable was the m-NIHSS score at day 90 after stroke, predicted from the
following combinations of independent variables: 1) the specific CST region, m-
NIHSS, and infarct volume in the first 12 hours after stroke; 2) the specific CST
region, m-NIHSS, and infarct volume at day 3; and 3) the specific CST region,
m-NIHSS, infarct volume, and rFA at day 30. To determine which combination
of independent variables yielded the best predictive model, variables were
deleted one by one from the model on the basis of the significance of their
regression coefficients and the R-square selection method. The models with the
highest R2 and all predictor variables that were significant (P<0.05) were
retained for each prediction. Only the model selected for the dataset obtained at
day 3 fulfilled the assumption of normality. All statistical analyses were
performed using Minitab version 15.1.0.0 (Minitab,State College, Pennsylvania).
11
Results
Subjects
Sixty-five consecutive patients with ischemic MCA stroke were scanned on
admission, but data from 5 patients were incomplete at day 90 due to
recurrence of stroke, death, and the presence of motion artifacts. Analyses
were therefore based on 60 subjects (37 men, 23 women; aged 68±13 years).
One patient missed the MRI study at admission but completed studies on day 3
and day 30. All patients underwent MRI and clinical assessment at day 30.
Clinical Characteristics and DTT analysis
Table 1 presents detailed clinical and MR data for all the patients. Median
NIHSS score at admission was 11 (IQR 7-17), indicating that most patients had
moderate to severe neurological deficits. All patients had started physiotherapy
within 2 weeks after the stroke. At admission, 47 (78.3%) of 60 patients
presented some motor deficits and 28 (59.6%) of these had moderate-severe
motor deficit (m-NIHSS III). At day 3, a total of 28 patients (46.7%) presented
some motor deficits and 13 (46.4%) of these were classified at m-NIHSS III.
Improvements with respect to baseline scores were observed in 67.8% of
patients at day 30 and in 85.7% at day 90, and 42.8%, and 39.2% of motor
deficits were categorized as m-NIHSS III at day 30 and day 90, respectively. BI
and mRS scores before the stroke were 100 and 0 in all patients, respectively.
The mean time for reconstructing and assessing the DTT to evaluate the
damage to CST regions was 3 minutes and 30 seconds. At admission, the CST
did not appear disrupted or displaced in any patient. Intrarater and interrater
12
agreement about the affected CST region was almost perfect (К=0.88 and
К=0.84, respectively). No CST involvement by infarct on admission was
observed in 14 (23.34%) patients; however, 5 of these had motor deficits (Table
1). On the other hand, CST involvement was observed on admission in 5
patients without motor deficits; the areas affected were the PMC (n=2), PMC
and CR (n=1), CR (n=1), and PLIC (n=1). At day 30, involvement of at least one
CST region was observed in all patients with motor deficit. Finally, PLIC
involvement in the first 12 hours was associated with unfavorable overall
outcome (mRS>3 and/or BI<60) (P<.001).
Motor outcome prediction and the involvement of the specific CST
regions
Damage to the PLIC in the first 12 hours and at day 3 after stroke correlated
with clinical severity, axonal damage expressed as decreased FA and rFA
values and motor outcome at day 30 and day 90 (P<0.001) better than damage
to any other CST region (Table 2). There was no significant correlation between
acute infarct volume and motor outcome at day 90 (P=0.176, r=0.485) (Fig. 1
and Fig. 2).
CS and/or CR involvement at day 3 was associated with motor deficit at day 30
and day 90 (P<.004) and axonal damage (P<.003) (Table 2). It is noteworthy
that, although other significant associations can be observed, combined PLIC
and CS or CR involvement at day 3 was not significant for motor outcome at
day 30 or at day 90 (P=0.157 and P=0.218 for the interaction between PLIC and
CS at day 30 and at day 90, respectively; P=0.521 and P=0.457 for the
interaction between PLIC and CR at day 30 and at day 90, respectively).
13

Therefore, the motor outcome at day 30 and at day 90 is secondary to PLIC
damage.
Damage to the PLIC in the first 12 hours yielded the highest sensitivity,
specificity, and predictive values for the prediction of motor outcome at day 90.
Interestingly, PLIC damage by acute stroke clearly distinguishes subjects
without motor deficit (m-NIHSS I) from those with motor deficit (NIHSS II and III)
and even differentiates m-NIHSS II from m-NIHSS III at day 90 (Table 3).
Correlations analysis revealed significant coefficients only between PLIC
involvement in the first 12 hours and motor outcome at day 90 (Table 4).
Damage to the CR and/or CS, m-NIHSS, and acute-stage infarct volume were
not related to motor outcome at 90 days. At day 3, PLIC damage and m-NHISS
showed the most significant correlations with motor outcome at 90 days. At day
30, PLIC damage, m-NHISS, and axonal damage showed the most significant
correlations with motor outcome at day 90. The only relation between infarct
volume and motor outcome at day 90 was a modest correlation observed at day
3.
Table 5 summarizes the best predictive models achieved at each time point.
The simplest model to predict m-NIHSS at day 90 based on the data available
in the first 12 hours consisted only of PLIC damage; PLIC damage alone
accounted for 75.5% of the variance in outcome. At day 3, regression analyses
indicated that m-NIHSS accounted for 79% of the variance in motor outcome at
day 90, and PLIC damage had a significant contribution of only 6.62%.
Regression coefficients for these assessments were positive, indicating that an
infarct affecting CST and m-NIHSS are predictive of greater motor deficit from
day 3 to 90 days after stroke. The best model for predicting motor outcome at
14

day 90 based on the assessments at day 30 included only the m-NIHSS, which
accounted for 90.10% of the variance in the measurement.
Association between the region of the CST affected in the first 3 days after
stroke and FA indexes at day 30
Our previous study demonstrated that mean FA values along the affected CST
were significantly lower than the normal contralateral side only at day 30 after
stroke onset (P<.001), and these values were lower than the corresponding FA
values obtained at admission and at day 3. Moreover, the decrease in mean FA
values correlated positively with the motor deficit at 30 days after stroke19.
Combined involvement of the PLIC and CS and/or CR at day 30 was not
significantly associated to decreased FA indexes (P=0.445 for the interaction
between PLIC and CS; P=0.830 for PLIC and CR). Hence, axonal damage
reflected as decreased FA ratio values at day 30 was also secondary to PLIC
damage. There was no association between infarct volume and WD (r=-0.221
P=0.090).
Discussion
We sought to determine whether acute stroke damage to specific CST regions
evident at DTT can predict limb motor outcome on a categorical scale based on
the m-NIHSS. We found that the involvement of the PLIC alone or in
combination with other specific CST regions in the first 12 hours after stroke
was strongly associated to severe motor deficits in the first 12 hours and poor
motor functional outcome at day 90. Although damage to the CS and CR at day
3 was also associated with poor motor outcome at day 90, PLIC damage in the
15
first 12 hours after stroke was clearly the best predictor of motor deficits and of
their severity.
Predictors of motor outcome proposed include location and extension of the
stroke specifically within the CST, grade of initial motor deficit, and infarct
volume. Our findings corroborate previous studies that found motor outcome is
strongly dependent on the integrity of the CST and that the involvement of
regions like the PLIC with more dense and organized corticofugal tract fibers is
associated with poor long-term recovery after stroke.6 Shelton et al.14 found that
the probability of recovery of upper limb movement at 2 months decreased
progressively with the involvement of the MC, CR, or internal capsule. In turn,
Schiemanck et al.6 found that infarcts involving the internal capsule, alone or in
combination with other areas, were associated with a significantly lower
probability of hand motor deficit rather than infarcts in the MC, subcortex, or CR.
We also found that axonal injury of the CST affected by the stroke (as
determined by decreased FA values in the pons) in the acute stage was only
associated with PLIC damage.
We found no correlation between infarct volume and motor outcome at day 90,
and motor deficit was present only when critical motor regions were involved,
suggesting that large lesions do not necessarily predict poor outcome. Although
subcortical strokes are normally smaller than cortical strokes, they are more
likely to involve both primary MC and PMC fibers, and patients with subcortical
infarcts have worse motor outcome than those with cortical stroke.14 These
findings may indicate that the extent of damage specifically within the CST is a
major determinant of motor deficit.
16

Previous structural imaging studies designed to predict motor recovery based
on lesion location within the CST used conventional axial MRI slices and hand-
drawn CST masks.6,8 Using T2 changes to assess lesions may not accurately
reflect specific neuronal damage, because lesions can be patchy and edema
can contribute to T2 signal hyperintensity. Conventional T2-weighted MRI
provides excellent contrast between white and gray matter, but provides no
information about fiber direction.33 In contrast, DTT clearly depicts the trajectory
of the CST, making it possible to evaluate the topography and extent of tissue
damage, particularly in acute stroke.31 We found strong interrater agreement,
indicating the reliability and validity of DTT as a lesion mapping technique for
this purpose. Recently, some DTI studies have reported that motor outcome
could be predicted using anatomic relationships between the stroke lesion and
CST damage on DTT in patients with intracerebral hemorrhage, CR and lacunar
infarcts.15-20,34 Jang et al.17 demonstrated that DTT performed at an early stage
of pontine infarct (mean DTT scanning, 15 days; range, 5-30) is useful for
predicting motor outcome. Similarly, another study reported that the degree of
CST involvement on DTT within 3 days of stroke onset was strongly correlated
with the severity of motor deficit and functional recovery at 3 months in patients
with an acute lenticulostriate infarct.19 To our knowledge, ours is the first
prospective controlled study to examine consecutive patients with DTT within
the first 12 hours after MCA stroke onset.
In the multiple regression analysis, the best model for predicting motor outcome
at day 90 in the acute stage was PLIC damage by infarct on DWI alone (not in
combination with the clinical parameters); therefore, PLIC damage could be
considered an early imaging predictor of poor motor outcome. Several studies
17

have demonstrated that the grade of initial motor deficit is the most important
determinant of motor recovery.1-5 In this respect, at day 3 we found that the
clinical assessment is the most useful predictor of motor outcome and that
adding information about PLIC damage increases the accuracy of the
prognosis. Our findings are in the line with those obtained by Feys et al.4, who
analyzed the site of the lesion on CT and MRI between 5 and 29 days after
stroke (median,10) and obtained arm motor scores 13 to 37 days after stroke
(median,22). These authors found that arm recovery at 2 months was best
predicted by a combination of the motor performance (R2=59.21) and purely
subcortical lesion location (R2=5.31) and that motor recovery at 12 months was
best predicted by clinical tests alone (R2=53.11) when clinical scores were
measured at 2 months after stroke.
Clinical assessment in the acute setting has some limitations. First, it can be
difficult to assess the grade of paresis clinically in uncooperative or severely
cognitively impaired patients, and clinical findings are occasionally inconclusive
and/or questionable with respect to motor outcome. Second, the ischemic
penumbra evidenced by perfusion-diffusion mismatch (not evaluated in the
current study) can produce symptoms that are clinically indistinguishable from
those produced by the infarct core.35 The ischemic penumbra represents
severely hypoperfused tissue around an infarct core; the neurons in the
penumbra are supposedly structurally intact but functionally inactive, so
penumbral areas are potentially salvageable.36 In our sample, the ischemic
penumbra could explain why some patients without CST involvement by infarct
presented motor deficits in the acute stage and why the initial motor deficit did
not correlate with motor outcome. Hence, if perfusion is restored to penumbral
18

areas and disturbances disappear (e.g. at day 3) and the DWI abnormality does
not involve the CST, the outcome will be good despite high m-NIHSS score on
admission.
Our results show that DTT can be useful in the clinical scenario, making it
possible to determine the damage to specific regions of motor pathways in
acute stroke patients consistently, easily, and quickly. Including DTT in acute
stroke protocols may generate valid prognostic information because motor
outcome appears strongly influenced by CST damage, in particular at the level
of the PLIC. In this scenario, DTT could improve the accuracy of prognosis and
help improve management in individual stroke patients.
Several limitations to our study should be emphasized. First, we considered
long-term clinical follow-up (90 days) because although motor recovery seems
to occur predominantly in the first few months after stroke, some patients show
considerable recovery in later phases.1 However, while several longitudinal
cohort studies and randomized controlled trials found that most of the overall
improvement in motor functions occurred within the first month after stroke,
some degree of motor recovery continued in some patients in later phases for
up to 6 months, especially in subgroups with high motor severity score on
admission (59.57% of patients with motor deficit in our cohort). Second, the aim
of this study was to design a simple and easy method to evaluate different CST
regions qualitatively (affected or not) in the acute stroke scenario; thus, we did
not consider quantitative data like the proportion of damaged fibers, etc. that
may have improved the accuracy of our predictions.10,11 Nevertheless, our
results indicate that DTT performed within hours of stroke onset is useful for
determining which patients are likely to suffer long-term motor deficits.
19

Importantly, this approach eliminates the need for more advanced
postprocessing techniques (which are more time consuming and require greater
specialization), so it can be applied more widely and benefit more patients.
Finally, DTI reflects the averaged water diffusion property within a voxel, which
is considered an indirect indicator of the axons; therefore, this approach may
oversimplify the model of the axonal structures.31
Conclusions
In summary, we conclude that DTT should be incorporated in MRI protocols for
acute stroke because determining the damage to specific regions of motor
pathways can help predict motor outcome. Our study lends support to the idea
that motor outcome is highly dependent on lesion location and the extent to
which acute stroke affects the CST. In particular, PLIC damage could be
considered an early imaging predictor of poor motor outcome. These findings
have implications for the use of lesion mapping techniques in the prognosis of
motor outcome after stroke and for establishing more effective criteria for
enrolling patients in experimental rehabilitation programs. Further research
should focus on improving the accuracy of predictions of motor outcome after
stroke based on early imaging predictors, with special attention to the
prognostic value of DTI.
20

References
1. Hendricks HT, van Limbeek J, Geurts AC, et al. Motor recovery after stroke:
a systematic review of the literature. Arch Phys Med Rehabil 2002;83:1629-37
2. Shelton FD, Volpe BT, Reding M. Motor impairment as a predictor of
functional recovery and guide to rehabilitation treatment after stroke.
Neurorehabil Neural Repair 2001;15:229-37
3. Prabhakaran S, Zarahn E, Riley C, et al. Inter-individual variability in the
capacity for motor recovery after ischemic stroke. Neurorehabil Neural Repair
2008;22:64-71
4. Feys H, Hetebrij J, Wilms G, et al. Predicting arm recovery following stroke:
value of site of lesion. Acta Neurol Scand 2000;102:371-77
5. Kwakkel G, Kollen BJ, van der Grond J, et al. Probability of regaining
dexterity in the flaccid upper limb: impact of severity of paresis and time since
onset in acute stroke. Stroke 2003;34:2181-86
6. Schiemanck SK, Kwakkel G, Post MW, et al. Impact of internal capsule
lesions on outcome of motor hand function at one year post-stroke. J Rehabil
Med 2008;40:96-101
7. Pineiro R, Pendlebury ST, Smith S, et al. Relating MRI changes to motor
deficit after ischemic stroke by segmentation of functional motor pathways.
Stroke 2000;31:672-79
8. Pendlebury ST, Blamire AM, Lee MA, et al. Axonal injury in the internal
capsule correlates with motor impairment after stroke. Stroke 1999;30:956-62
21

9. Chen CL, Tang FT, Chen HC, et al. Brain lesion size and location: effects on
motor recovery and functional outcome in stroke patients. Arch Phys Med
Rehabil 2000;81:447-52
10. Zhu LL, Lindenberg R, Alexander MP, et al. Lesion load of the corticospinal
tract predicts motor impairment in chronic stroke. Stroke 2010;41:910-15
11. Lindenberg R, Renga V, Zhu LL, et al. Structural integrity of corticospinal
motor fibers predicts motor impairment in chronic stroke. Neurology
2010;74:280-87
12. Rapisarda G, Bastings E, de Noordhout AM, et al. Can motor recovery in
stroke patients be predicted by early transcranial magnetic stimulation? Stroke
1996;27:21919-6
13. van Kuijk AA, Pasman JW, Hendricks HT, et al. Predicting hand motor
recovery in severe stroke: the role of motor evoked potentials in relation to early
clinical assessment. Neurorehabil Neural Repair 2009;23:45-51
14. Shelton FN, Reding MJ. Effect of lesion location on upper limb motor
recovery after stroke. Stroke 2001;32:107-12
15. Nelles M, Gieseke J, Flacke S, et al. Diffusion tensor pyramidal tractography
in patients with anterior choroidal artery infarcts.AJNR Am J Neuroradiol.
2008;29:488-93.
16. Lai C, Zhang SZ, Liu HM, et al. White matter tractography by diffusion
tensor imaging plays an important role in prognosis estimation of acute lacunar
infarctions. Br J Radiol.2007;80:782-9
22

17. Jang SH, Bai D, Son SM, et al. Motor outcome prediction using diffusion
tensor tractography in pontine infarct. Ann Neurol. 2008;64:460-5
18. Cho SH, Kim DG, Kim DS, et al. Motor outcome according to the integrity of
the corticospinal tract determined by diffusion tensor tractography in the early
stage of corona radiata infarct.Neurosci Lett.2007;426:123-7
19. Konishi J, Yamada K, Kizu O, et al. MR tractography for the evaluation of
functional recovery from lenticulostriate infarcts. Neurology. 2005 ;64:108-13
20. Lee JS, Han MK, Kim SH, et al. Fiber tracking by diffusion tensor imaging in
corticospinal tract stroke: Topographical correlation with clinical symptoms.
Neuroimage. 2005;26:771-6
21. Nucifora PG, Verma R, Lee SK, et al. Diffusion-tensor MR imaging and
tractography: exploring brain microstructure and connectivity.Radiology
2007;245:367-84.
22. Chung HW, Chou MC, Chen CY. Principles and limitations of computational
algorithms in clinical diffusion tensor MR tractography.AJNR Am J Neuroradiol
2010 Mar.
23. Thomalla G, Glauche V, Weiller C, et al. Time course of wallerian
degeneration after ischaemic stroke revealed by diffusion tensor imaging.J
Neurol Neurosurg Psychiatry 2005;76:266–68
24. Puig J, Pedraza S, Blasco G, et al. Wallerian degeneration in the
corticospinal tract evaluated by diffusion tensor imaging correlates with motor
deficit 30 days after middle cerebral artery ischemic stroke.AJNR Am J
Neuroradiol 2010 Mar 18
25. Brott T, Marler JR, Olinger CP, et al. Measurements of acute cerebral
23

infarction: lesion size by computed tomography. Stroke 1989;20:871-75
26. Saver JL, Johnston KC, Homer D, et al. Infarct volume as a surrogate or
auxiliary outcome measure in ischemic stroke clinical trials.The RANITTAS
Investigators. Stroke 1999;30:293-98
27. Sulter G, Steen C, De Keyser J. Use of the Barthel index and modified
Rankin scale in acute stroke trials.Stroke 1999;30:1538-41
28. European Stroke Initiative Executive Committee; EUSI Writing Committee.
Olsen TS. Langhorne P. Diener HC., et al. European Stroke Initiative
Recommendations for Stroke Management-update 2003.Cerebrovasc Dis
2003;16: 311-37
29. Prados F, Boada I, Feixas M, et al. A DTIWeb: a web-based framework for
DTI data visualization and processing. Lect Notes Comput Sci 2007;4706:727 -
40
30. Lazar M, Weinstein DM, Tsuruda KM, et al. White matter tractography using
diffusion tensor deflection. Hum Brain Mapp 2003;18:306-21
31. Wakana S, Jiang H, Nagae-Poetscher LM, et al. Fiber tract-based atlas of
human white matter anatomy.Radiology 2004;230:77-87
32. Landis JR, Koch GG. The measurement of observer agreement for
categorical data. Biometrics. 1977;33:159-74
33. Mamata H, Mamata Y, Westin CF, et al. High-resolution line scan diffusion
tensor MR imaging of white matter fiber tract anatomy. AJNR Am J Neuroradiol
34. Cho SH, Kim SH, Choi BY, et al. Motor outcome according to diffusion
24
tensor tractography findings in the early stage of intracerebral hemorrhage.
Neurosci Lett. 2007;421:142-6
35. Provenzale JM, Shah K, Patel U, et al. Systematic review of CT and MR
perfusion imaging for assessment of acute cerebrovascular disease. AJNR Am
J Neuroradiol 2008;29:1476-82
36. Schaefer PW, Ozsunar Y, He J, et al. Assessing tissue viability with MR
diffusion and perfusion imaging.AJNR Am J Neuroradiol 2003;24:436-43
25

APPENDIX
Figures and Legends
Figure 1. Specific regions evaluated to determine the integrity of the CST.
Transaxial summed volumetric high-resolution T1-weighted images, FA color-
maps, and tractograms show the origin of the CST from both the MC (asterisk
at precentral gyrus) and PMC (A). The CST involves the CS (B) and CR (C) and
finally converges at the level of the PLIC (D). The sectional levels are indicated
as red horizontal lines (upper images).
26

Figure 2. A 55-year-old man (patient 40) presented moderate right MCA territory
infarction. DTT images show infarction near the right CST at the level of the CR
and PLIC, although there is no direct involvement. At admission, ischemic
penumbra (not shown) involved part of the CST at the level of the CR and could
explain the motor deficit at this time. FA indices reveal CST axonal integrity at
the anterior part of the pons.
27

Figure 3. A 47-year-old man (patient 15) presented a mild right-sided
hemiparesis lasting 45 minutes. Note the slight hyperintensity of the left CST
involved by the infarct in the striatocapsular MCA territory due to the short time
elapsed since the onset of symptoms. The reduced brightness and decreased
FA value in the left descending CST at day 30 are regarded as WD.
28
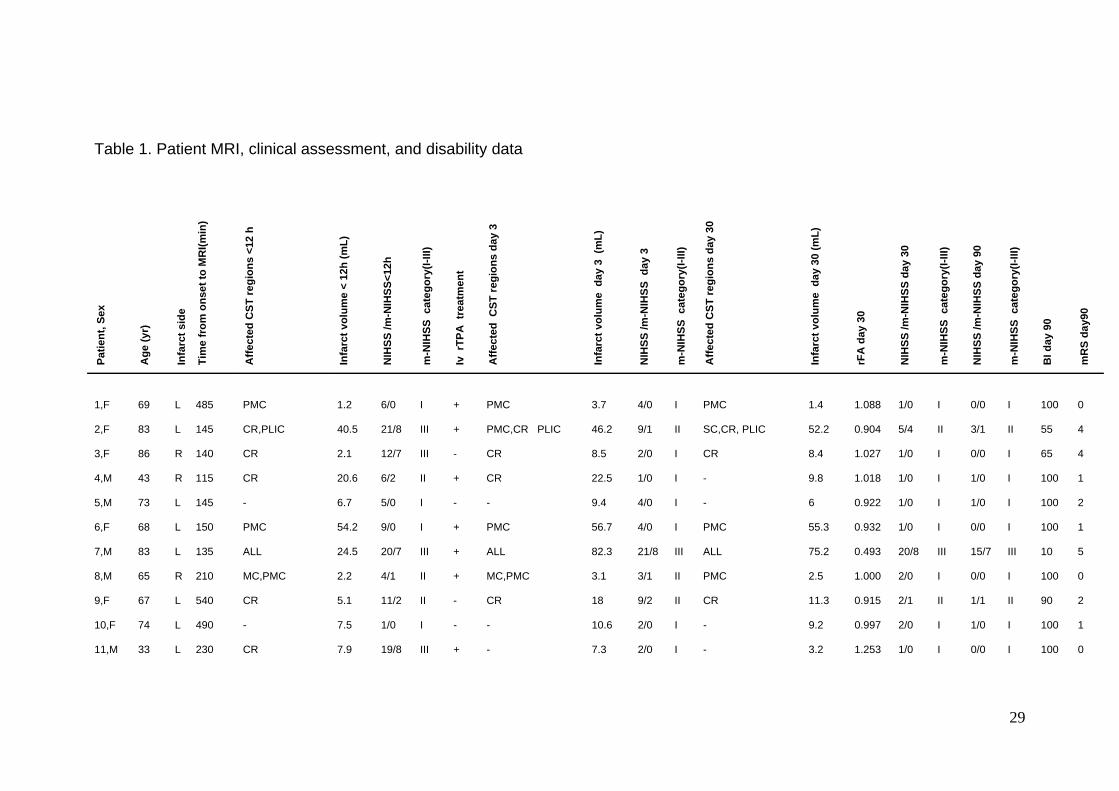
Table 1. Patient MRI, clinical assessment, and disability data
Patie
nt, S
ex
Age
(yr)
Infa
rct s
ide
Tim
e fr
om o
nset
to M
RI(m
in)
Affe
cted
CST
regi
ons
<12
h
Infa
rct v
olum
e <
12h
(mL)
NIH
SS /m
-NIH
SS<1
2h
m-N
IHSS
cat
egor
y(I-I
II)
Iv r
TPA
tre
atm
ent
Affe
cted
CST
regi
ons
day
3
Infa
rct v
olum
e d
ay 3
(m
L)
NIH
SS /m
-NIH
SS d
ay 3
m-N
IHSS
cat
egor
y(I-I
II)
Affe
cted
CST
regi
ons
day
30
Infa
rct v
olum
e d
ay 3
0 (m
L)
rFA
day
30
NIH
SS /m
-NIH
SS d
ay 3
0
m-N
IHSS
cat
egor
y(I-I
II)
NIH
SS /m
-NIH
SS d
ay 9
0
m-N
IHSS
cat
egor
y(I-I
II)
BI d
ay 9
0
mR
S da
y90
1,F
69
L
485
PMC
1.2
6/0
I
+
PMC
3.7
4/0
I
PMC
1.4
1.088
1/0
I
0/0
I
100
0
2,F 83 L 145 CR,PLIC 40.5 21/8 III + PMC,CR PLIC 46.2 9/1 II SC,CR, PLIC 52.2 0.904 5/4 II 3/1 II 55 4
3,F 86 R 140 CR 2.1 12/7 III - CR 8.5 2/0 I CR 8.4 1.027 1/0 I 0/0 I 65 4
4,M 43 R 115 CR 20.6 6/2 II + CR 22.5 1/0 I - 9.8 1.018 1/0 I 1/0 I 100 1
5,M 73 L 145 - 6.7 5/0 I - - 9.4 4/0 I - 6 0.922 1/0 I 1/0 I 100 2
6,F 68 L 150 PMC 54.2 9/0 I + PMC 56.7 4/0 I PMC 55.3 0.932 1/0 I 0/0 I 100 1
7,M 83 L 135 ALL 24.5 20/7 III + ALL 82.3 21/8 III ALL 75.2 0.493 20/8 III 15/7 III 10 5
8,M 65 R 210 MC,PMC 2.2 4/1 II + MC,PMC 3.1 3/1 II PMC 2.5 1.000 2/0 I 0/0 I 100 0
9,F 67 L 540 CR 5.1 11/2 II - CR 18 9/2 II CR 11.3 0.915 2/1 II 1/1 II 90 2
10,F 74 L 490 - 7.5 1/0 I - - 10.6 2/0 I - 9.2 0.997 2/0 I 1/0 I 100 1
11,M 33 L 230 CR 7.9 19/8 III + - 7.3 2/0 I - 3.2 1.253 1/0 I 0/0 I 100 0
29

12,M 61 L 420 CR 7.7 10/2 II - CR 10.4 2/0 I CR 8.4 1.016 1/0 I 1/0 I 100 2
13,F 84 L 470 CR 4.5 10/1 II - CR 3.8 6/0 I CR 4.1 0.978 2/0 I 1/0 I 100 1
14,M 72 L 360 - 15.5 2/0 I - - 14.5 0/0 I - 11.5 1.003 0/0 I 0/0 I 100 0
15,M 47 L 45 PLIC 1.8 10/3 I - PLIC 9 8/6 III PLIC 8.1 0.733 7/4 III 6/5 II 80 3
16,F 83 L 140 CR 11.7 11/3 II - CR 11 12/3 II CR 4.7 0.983 5/0 I 1/0 I 90 3
17,F 85 R 150 CR 4.6 15/8 III - CR 15.1 7/3 II CR 5.8 1.015 3/0 I 3/0 I 50 3
18,M 74 L 430 CR 5.2 4/0 I - CR 29.1 3/0 I CR 20.3 0.966 3/0 I 4/0 I 100 2
19, F 48 L 140 CR 12.5 20/8 III + CR 76.7 8/0 I CR 14.6 0.976 3/0 I 3/0 I 100 2
20,M 85 R 580 CR 12.2 15/8 III - CR,PLIC 26.5 7/4 II CR PLIC 11.6 0.745 4/3 II 1/1 II 100 2
21,M 73 R 90 MC,PMC SC 68.9 15/6 III + MC,PMC SC,CR 132 13/6 III MC,PMC,SC CR 116.5 0.688 10/4 II 9/2 II 15 4
22,M 70 L 380 - 2.1 11/0 I - - 13.1 6/0 I - 8.8 0.990 8/0 I 7/0 I 90 3
23,M 76 L 150 CR 25.4 20/8 III + SC,CR 60.1 13/3 II SC,CR 34.1 0.924 10/3 I 2/0 II 100 1
24,F 66 L 470 - 0.5 4/2 I - - 0.6 0/0 I - 0.3 1.069 0/0 I 0/0 I 100 0
25,M 52 L 100 CR 9.3 12/3 II + CR 10.9 12/3 II CR 4.5 0.928 5/0 I 0/0 I 100 1
26,F 56 L 240 - 32.2 7/0 I + - 41.7 3/0 I - 16.1 1.214 1/0 I 0/0 I 100 2
27,M 74 R 390 - 14.2 11/6 III + - 2/0 I - 3.7 0.990 1/0 I 1/0 I 100 2
28,M 73 L 320 - 7 19/8 III + - 6.3 1/0 I - 3.4 0.987 0/0 I 0/0 I 100 0
29,M 78 L 300 - 5.4 4/1 II - - 10 6/0 I - 2.9 0.997 1/0 I 3/0 I 100 2
30,M 81 R 350 MC,CR 35.4 9/4 II - MC,CR 37.4 1/0 I CR 9.1 1.046 0/0 I 0/0 I 100 1
31,F 83 R 420 PMC,SC CR 42.3 10/2 II - PMC,SC,CR 48.9 2/0 I PMC,SC,CR 26.1 1.086 0/0 I 0/0 I 100 2
32,M 84 L 210 MC,SC 4.3 9/2 II - MC,SC 22.9 7/1 II MC,SC,CR 11.3 1.036 4/0 I 0/0 I 100 1
33,F 69 L 450 CR 1.9 16/4 II + CR 2.2 1/0 I CR 1.8 0.995 0/0 I 0/0 I 100 1
34,F 21 R 235 CR 7 11/7 III + CR 10.2 4/2 II CR 1.4 1.165 1/0 I 0/0 I 100 2
30

35,F 73 L 240 PLIC 4.8 19/8 III + PLIC 9.3 10/7 III PLIC 3.9 0.676 11/7 III 11/7 III 30 4
36,F 42 R 310 - 4.7 12/8 III - - 8 0/0 I - 0.7 0.990 0/0 I 0/0 I 100 0
37,M 80 R 390 MC,SC,CR 42.2 13/6 III - MC,PMC,SC,CR 65.9 5/2 II MC,PMC,SC CR 58.8 0.659 9/4 II 9/4 II 25 4
38,M 58 R 530 MC,PMC,SC CR 53.9 7/1 II - MC,PMC,SC, CR 64.7 3/0 I MC,PMC,SC CR 48 0.958 2/0 I 2/0 I 100 2
39,M 61 L 280 - 5.3 5/0 I + PMC 4.3 0/0 I PMC 2.1 1.064 0/0 I 0/0 I 100 0
40,M 55 R 630 - 57.1 13/2 II + - 59.1 2/0 I - 48.8 1.001 0/0 I 0/0 I 100 0
41,M 68 R 640 PMC,CR PLIC 92.9 18/8 III - PMC,SC, CR PLIC 164 16/8 III PMC,SC,CR PLIC 120.6 0.854 13/8 III 11/7 III 10 4
42,F 67 L 435 PLIC 1.3 16/7 III - PLIC 77.9 20/8 III PLIC 59.5 0.883 13/7 III 13/7 III 35 4
43,F 63 L 340 PMC,CR 4.8 6/0 I - CR 8.9 0/0 I CR 2.8 0.724 0/0 I 0/0 I 100 0
44,F 45 R 425 PLIC 14.2 8/1 II - CR,PLIC 43 7/4 II CR,PLIC 37.2 0.920 6/3 II 5/3 II 80 3
45,M 67 R 665 PLIC 22.8 17/8 III + CR,PLIC 38 15/8 III CR,PLIC 32.3 0.659 11/7 III 11/7 III 35 4
46,F 80 R 240 PMC,PLIC 34 19/8 III + PMC,SC,CR PLIC 124 18/8 III ALL 116.9 0.767 14/8 III 15/8 III 20 5
47,M 51 R 105 PLIC 20.8 17/7 III + SC,CR,PLIC 90.8 11/6 III SC,CR,PLIC 50.3 0.595 8/5 III 8/5 III 65 3
48,M 57 L 669 MC 4.4 7/1 II + MC 7.7 2/0 I MC 4 1.062 0/0 I 0/0 I 100 0
49,M 78 L 640 PMC,CR 2.7 21/8 III - PMC,CR 5.8 0/0 I - 2.2 0.934 0/0 I 0/0 I 100 0
50,M 66 L 700 - 5 1/0 I - - 3.8 1/0 I - 3.9 0.973 0/0 I 0/0 I 100 0
51,M 67 L 560 PLIC 66.3 21/8 III + PLIC 72.7 19/8 III PLIC 65.3 0.639 16/8 III 10/6 III 30 5
52,M 67 R 432 MC SC CR 63.3 13/5 III - MC,SC,CR 84.5 9/4 II MC,SC,CR 78.1 1.001 7/2 II 3/3 II 80 3
53,M 76 R 370 MC,PMC 28.8 18/3 II + MC,PMC 30.1 7/0 I MC,PMC 26.7 1.032 7/0 I 4/0 I 90 3
54,M 79 L 390 - 3.9 6/0 I + - 6.5 0/0 I - 1.1 1.132 0/0 I 0/0 I 100 0
55,M 71 R 150 MC,SC 9.1 4/1 II - MC,SC 10.4 0/0 I MC,SC 8.9 1.067 0/0 I 0/0 I 100 0
56,F 73 R 720 CR PLIC 41 19/7 III + ALL 69.7 19/8 III ALL 75.6 0.647 12/7 III 12/7 III 15 5
57,M 73 R 450 PLIC 14.4 17/6 III + PLIC 19.6 18/8 III PLIC 11.1 0.747 10/7 III 7/7 III 50 4
31

58,M 80 L 210 MC,SC 5.4 7/5 III + MC,SC 5.4 6/4 II MC,SC 5 0.778 3/1 I 1/0 II 90 3
59,F 75 L 100 MC,SC 13.3 14/8 III + MC,SC 15.2 5/4 II SC 13.3 1.026 0/0 I 0/0 I 100 1
60,M 64 L 480 ALL 98.6 21/8 III + ALL 99.5 19/8 III ALL 92 0.702 14/8 III 14/7 III 25 5
Mean 67.9 345.4 20.2 34.6 25.5 0.926 81.4 2.1
SD 13.7 182.8 23.3 36.8 31.9 0.161 30.3 1.6
32

Table 2. Associations between the specific CST regions affected in the acute stage and stroke severity, infarct volume, FA indexes
at day 30, and motor outcome
<12 hours Day 3
Motor
deficit
day 30
Motor
deficit
day90
FA
affected
CST day30
FA ratio
affected/
unaffected
CST day30
Infarct
Volume
admission
Motor
NIHSS
admission
Total
NIHSS
admission
Motor
deficit
day30
Motor
deficit
day90
FA
affected
CST day30
FA ratio
affected/
unaffected
CST day30
Infarct
Volume
day3
Motor
NIHSS
day3
Total
NIHSS
day3
MC
0.639
0.873
0.686
0.575
0.036
0.959
0.969
0.392
0.558
0.334
0.327
0.082
0.383
0.481
PMC
0.949
0.710
0.659
0.224
0.011
0.826
0.251
0.218
0.107
0.485
0.132
0.011
0.360
0.193
CS
0.133
0.277
0.414
0.260
0.039
0.446
0.773
0.001
0.014
0.067
0.019
0.001
0.140
0.011
CR
0.914
0.941
0.155
0.974
0.069
0.054
0.013
0.039
0.031
0.763
0.028
<.001
0.125
0.054
PLIC
<.001
<.001
<.001
<.001
0.060
0.001
0.001
<.001
<.001
<.001
<.001
0.004
<.001
<.001
MC+PMC
0.339
0.231
0.684
0.209
0.016
0.659
0.192
0.161
0.095
0.128
0.058
0.016
0.245
0.153
CM+CS
0.069
0.172
0.219
0.155
0.068
0.302
0.699
0.058
0.127
0.183
0.131
0.029
0.090
0.190
33

34
CM+CR
0.191
0.123
0.628
0.277
0.005
0.493
0.305
0.031
0.014
0.227
0.063
<.001
0.145
0.161
PMC+CR
0.873
0.703
0.745
0.256
0.083
0.697
0.223
0.001
<.001
0.063
0.005
0.010
0.071
0.082
CM+PLIC
-
-
0.247
0.193
0.456
0.032
<.001
0.015
-
0.053
0.037
0.014
-
<.001
CS+CR
0.086
0.052
0.459
0.264
0.017
0.495
0.318
<.001
<.001
0.051
0.006
<.001
0.003
0.003
CS+PLIC
-
-
0.247
0.193
0.456
0.032
<.001
<.001
<.001
0.024
<.001
0.003
<.001
<.001
CR+PLIC
0.028
0.015
0.116
0.092
0.170
<.001
<.001
<.001
<.001
0.004
<.001
0.005
<.001
<.001
CS+CR+PLIC
-
-
0.247
0.193
0.456
0.032
<.001
<.001
<.001
0.024
<.001
0.003
<.001
<.001
Parameters with P value <.05 are highlighted in bold
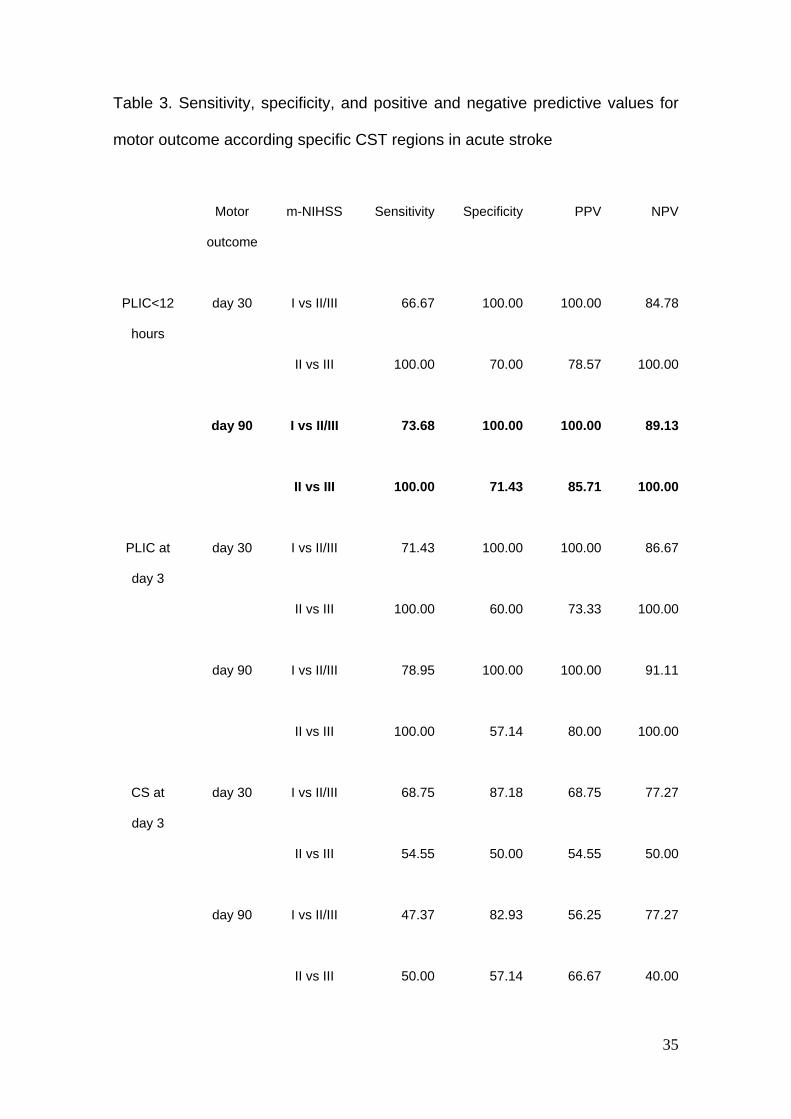
Table 3. Sensitivity, specificity, and positive and negative predictive values for
motor outcome according specific CST regions in acute stroke
Motor
outcome
m-NIHSS Sensitivity Specificity PPV NPV
PLIC<12
hours
day 30
I vs II/III
66.67
100.00
100.00
84.78
II vs III
100.00 70.00 78.57 100.00
day 90 I vs II/III 73.68 100.00 100.00 89.13
II vs III 100.00 71.43 85.71 100.00
PLIC at
day 3
day 30
I vs II/III
71.43
100.00
100.00
86.67
II vs III 100.00 60.00 73.33 100.00
day 90 I vs II/III 78.95 100.00 100.00 91.11
II vs III 100.00 57.14 80.00 100.00
CS at
day 3
day 30
I vs II/III
68.75
87.18
68.75
77.27
II vs III 54.55 50.00 54.55 50.00
day 90 I vs II/III 47.37 82.93 56.25 77.27
II vs III 50.00 57.14 66.67 40.00
35

CR at
day 3
day 30 I vs II/III 71.43 56.41 46.88 78.57
II vs III 63.64 20.00 46.67 33.33
day 90 I vs II/III 73.68 56.10 43.75 82.14
II vs III 58.33 0.00 50.00 0.00
The highest overall values for all determinations are highlighted in bold
36

Table 4. Point-biserial and correlation coefficients between m-NIHSS at day 90
and the specific CST region involved, infarct volume, and motor score
parameters in the first 12 hours, at day 3, and at day 30 after stroke
m-NIHSS day 90 m-NIHSS day 90 m-NIHSS day 90
< 12 hours Day 3 Day 30
CR rpb= -.243 - CR rpb= -.052 - CR rpb= -.139 -
PLIC rpb= .869 *** PLIC rpb= .817 *** PLIC rpb= .817 ***
SC rpb= -.143 - SC rpb= .112 - SC rpb= .058 -
m-NIHSS r= .362 - m-NIHSS r= .889 *** m-NIHSS r= .949 ***
Infarct volume r= .363 - Infarct volume r= .524 ** Infarct volume r= .545 **
rFA r= -.720 ***
*** P<.001; ** P<.01; * P<.05; - NS
37

38
Table 5. Models selected from multiple regression analyses for predicting m-
NIHSS 90 days after stroke from motor scores and specific CST regions
Predictors B t-value Added R2
Prediction of m-NIHSS at day 90 after stroke
Measurements obtained <12 hours (R2=75.50,F=80.09***)
PLIC damage 5.36 8.95*** 75.50
Constant 0.64
Measurements obtained at 72 hours (R2=85.62,F=74.39***)
m-NIHSS 0.75 5.72*** 79.00
PLIC damage 2.28 3.39** 6.62
Constant -1.58
Measurements obtained at day 30 (R2=90.10,F=236.72***)
m-NIHSS 0.96 15.39*** 90.10
Constant -0.40
B = regression coefficient; *** P<.001; ** P<.01; * P <.05.