tree farm licence #30 management plan · canadian forest products ltd. p.o. box 9000, prince george...
TRANSCRIPT
TREE FARM LICENCE #30
MANAGEMENT PLAN #10
TIMBER SUPPLY ANALYSIS
ANALYSIS REPORT
Prepared for:
Canadian Forest Products Ltd
All interested parties are invited to view and comment on the Draft Timber Supply Analysis Report for Management Plan #10, from March 13
th, 2013 through to May 13
th, 2013. Comments will be
accepted until 4:00 pm May 13th, 2013.
For further information, please contact: Sara Cotter, RPF Planning Forester, Forest Management Group Canadian Forest Products Ltd. P.O. Box 9000, Prince George BC V2L 4W2 [email protected] (250) 962-3398
Prepared by:
Resource Group Ltd. Prince George, BC
March 2013

TFL 30 Management Plan #10 – Timber Supply Analysis – Analysis Report
i
EXECUTIVE SUMMARY
The timber supply analysis in support of Management Plan #9 was completed in 2003, followed by the allowable annual cut (AAC) determination effective July 1
st, 2003 in which the AAC was set
at 330,000 m3/year.
On April 4th, 2006 under a Postponement Order (Section 8 (3.1) of the Forest Act), Canfor
provided a letter to the Chief Forester to have the next AAC determination postponed to June 12
th, 2013. The Chief Forester concluded that the factors used to assess timber supply have not
changed to the extent that they would have an impact on existing timber supply. Consequently, the next AAC determination will occur on or before June 12
th, 2013.
Canfor has initiated this timber supply analysis in support of Management Plan #10 and this document describes the results of the recently completed timber supply analysis for Tree Farm Licence (TFL) #30.
The base case harvest forecast presented demonstrates that the land base can support a harvest level of approximately 420,000 m
3/yr over the next 45 years before increasing to a sustainable
long-term harvest level of approximately 545,000 m3/yr.
The base case harvest level represents a substantial increase over the base case harvest forecast from Management Plan #9 (MP9) and the current AAC of 330,000 m
3/yr. This increase
can be attributed to the following factors:
An increase in the timber harvesting land base (THLB) of approximately 5,400 ha (4%) over the THLB from MP9.
An accumulated undercut of almost 2.5 million m3 over the last 10 years.
The MP9 base case includes a significant reduction in harvest attributable to modelling patch size objectives. This impact has been eliminated in the current analysis.
Changes to management objectives for seral stage1 and caribou corridors have allowed
for increased harvest.
Improvement in the assumptions used to generate managed stand yield estimates.
The use of a spatially explicit optimization model results in an optimized harvest schedule that is capable of minimizing the timber supply impact of harvesting constraints while ensuring that the harvest schedule is operationally feasible.
Sensitivity analysis conducted on TFL 30 seeks to quantify the degree to which uncertainty in data and assumptions might affect timber supply. Table 19 shows a summary of the harvest impacts of each scenario relative to the base case.
1 It is not clear from MP9 documentation as to whether the 2/3 draw down to the seral stage targets was
applied. We have assumed that the full seral stage targets were enforced in the MP9 base case.

TFL 30 Management Plan #10 – Timber Supply Analysis – Analysis Report
ii
Table i: Summary of Analysis Results
Scenario
Years 1 to 45 Years 46 to 250
m3/yr
% Change
m3/yr
% Change
Base Case 419,720
544,792
Evenflow 421,353 0% 421,360 -23%
Increased IHL 424,990 1% 529,105 -3%
120 m3/ha MHA 420,869 0% 545,781 0%
180 m3/ha MHA 411,028 -2% 532,344 -2%
200 m3/ha MHA 401,257 -4% 522,149 -4%
Managed Stand Yields +10% 429,700 2% 596,301 9%
Managed Stand Yields -10% 411,231 -2% 490,411 -10%
Natural Stand Yields +10% 457,164 9% 545,927 0%
Natural Stand Yields -10% 384,620 -8% 543,250 0%
Old Age @ 140 437,449 4% 547,901 1%
No Seral Draw Down 346,197 -18% 514,429 -6%
ERA (>20% old) 417,058 -1% 543,958 0%
Patch Size Targets 408,509 -3% 523,997 -4%
Relaxed Patch Size Targets 421,324 0% 538,503 -1%
OAF1 @ 0.85 416,340 -1% 520,649 -4%
Add 3.5% WTP Reduction 403,693 -4% 527,768 -3%
No Weevil Impacts 451,661 8% 541,570 -1%
No Watershed Constraints 420,661 0% 545,628 0%
Remove FSW Constraints 419,753 0% 545,508 0%

TFL 30 Management Plan #10 – Timber Supply Analysis – Analysis Report
iii
TABLE OF CONTENTS
1.0 Introduction ................................................................................................................................. 1
2.0 Land Base Description ............................................................................................................... 2
2.1 Location ........................................................................................................................... 2 2.2 Land Base Classification ................................................................................................. 2
2.2.1 Changes from the Data Package ............................................................................ 4 2.2.2 Vegetation Resource Inventory ............................................................................... 5 2.2.3 Biogeoclimatic Ecosystem Classification (BEC) ...................................................... 8 2.2.4 Site Index ................................................................................................................. 9 2.2.5 Harvest History and Age Class Distribution........................................................... 11
3.0 Base Case Timber Supply Analysis ......................................................................................... 14
3.1 Harvest Forecast ........................................................................................................... 14 3.2 Management Plan #9 Comparison ................................................................................ 15
3.2.1 Timber Harvesting Land Base ............................................................................... 16 3.2.2 Model Constraints .................................................................................................. 17 3.2.3 Managed Stand Yields........................................................................................... 17 3.2.4 Historic Harvest Levels .......................................................................................... 18 3.2.5 Forest Estate Model ............................................................................................... 19
3.3 Base Case Harvest Characteristics ............................................................................... 19 3.4 Age Class Distribution ................................................................................................... 22
4.0 Sensitivity Analysis ................................................................................................................... 24
4.1 Alternative Harvest Flow Patterns ................................................................................. 24 4.2 Minimum Harvest Age ................................................................................................... 25 4.3 Natural and Managed Stand Yields ............................................................................... 26 4.4 Old Seral Objectives ...................................................................................................... 28 4.5 Ecosystem Representation Analysis ............................................................................. 29 4.6 Patch Size Objectives .................................................................................................... 30 4.7 Wildlife Tree Patches ..................................................................................................... 32 4.8 Operational Adjustment Factor ...................................................................................... 33 4.9 Leader Weevil ................................................................................................................ 34 4.10 Watershed Objectives.................................................................................................... 35
5.0 Discussion ................................................................................................................................ 37
6.0 References ............................................................................................................................... 39
LIST OF TABLES
Table 1: Land Base Classification. ............................................................................................ 3 Table 2: Revised OAF 1 Information ......................................................................................... 5 Table 3: Inventory Analysis Results........................................................................................... 6 Table 4: Base Case Harvest Forecast ..................................................................................... 15 Table 5: Recent Harvest History .............................................................................................. 18 Table 6: Sensitivity Analyses. .................................................................................................. 24 Table 7: Alternate Harvest Flow Patterns ................................................................................ 25 Table 8: Minimum Harvest Ages .............................................................................................. 26

TFL 30 Management Plan #10 – Timber Supply Analysis – Analysis Report
iv
Table 9: Managed Stand Yields +/- 10% ................................................................................. 27 Table 10: Natural Stand Yields +/- 10% .................................................................................... 28 Table 11: Seral Stage Objectives .............................................................................................. 29 Table 12: Ecosystem Representation Objectives ...................................................................... 30 Table 13: Patch Size Objectives. ............................................................................................... 31 Table 14: Patch Size Objectives ................................................................................................ 32 Table 15: Additional 3.5% WTP Reduction ............................................................................... 33 Table 16: OAF1 @ 0.85 ............................................................................................................. 34 Table 17: Remove Leader Weevil Impacts ................................................................................ 35 Table 18: Watershed Objectives ................................................................................................ 36 Table 19: Summary of Analysis Results .................................................................................... 38
LIST OF FIGURES
Figure 1: Location of TFL 30 ....................................................................................................... 2 Figure 2: Area by Land Classification ......................................................................................... 4 Figure 3: Leading Species Summary .......................................................................................... 7 Figure 4: Adjusted Inventory Site Index Summary ..................................................................... 8 Figure 5: BEC Summary ............................................................................................................. 9 Figure 6: SIBEC Site Index Summary ...................................................................................... 10 Figure 7: Combined Site Index Summary ................................................................................. 11 Figure 8: Harvest History .......................................................................................................... 12 Figure 9: Initial Age Class Distribution ...................................................................................... 13 Figure 10: Base Case Harvest Forecast ................................................................................. 14 Figure 11: Base Case Growing Stock ..................................................................................... 15 Figure 12: Harvest Forecast – MP #9 ..................................................................................... 16 Figure 13: Base Case – Harvest from Natural and Managed Stands .................................... 20 Figure 14: Base Case – Average Harvest Age ....................................................................... 21 Figure 15: Base Case – Average Volume per Hectare Harvested ......................................... 21 Figure 16: Base Case – Annual Harvest Area ........................................................................ 22 Figure 17: Age Class Distribution – Base Case ...................................................................... 23 Figure 18: Alternative Harvest Flow Patterns ......................................................................... 25 Figure 19: Minimum Harvest Age ........................................................................................... 26 Figure 20: Managed Stand Yields +/- 10% ............................................................................. 27 Figure 21: Natural Stand Yields +/- 10% ................................................................................ 28 Figure 22: Seral Stage Objectives .......................................................................................... 29 Figure 23: Ecosystem Representation Objectives .................................................................. 30 Figure 24: Patch Size Objectives ............................................................................................ 31 Figure 25: Additional 3.5% WTP Reduction ........................................................................... 33 Figure 26: OAF1 @ 0.85 ......................................................................................................... 34 Figure 27: Remove Leader Weevil Impacts ............................................................................ 35 Figure 28: Watershed Objectives ............................................................................................ 36
ACRONYMS
AAC Allowable Annual Cut AU Analysis Unit BEC Biogeoclimatic Ecosystem Classification

TFL 30 Management Plan #10 – Timber Supply Analysis – Analysis Report
v
BEO Biodiversity Emphasis Option CFLB Crown Forested Land Base ECA Equivalent Clearcut Area ERA Ecosystem Representation Analysis FDU Forest Development Unit FPPR Forest Planning and Practices Regulations FRPA Forest and Range Practices Act FSP Forest Stewardship Plan FSW Fisheries Sensitive Watershed GWM General Wildlife Measure IHL Initial Harvest Level IWA Interior Watershed Assessment IWAP Interior Watershed Assessment Procedures LRDW Land and Resource Data Warehouse LTHL Long-Term Harvest Level M Modification VQO Classification MFLNRO Ministry of Forests, Lands and Natural Resource Operations MHA Minimum Harvest Age MOE Ministry of Environment MOF Ministry of Forests MP Management Plan MPB Mountain Pine Beetle NCD No Channel Defined NDT Natural Disturbance Type NRL Non-Recoverable Losses NSR Not Sufficiently Restocked OAF Operational Adjustment Factor OGMA Old Growth Management Areas PFI Peak Flow Index PFLB Productive Forest Land Base PSI Potential Site Index PR Partial Retention VQO Classification RESULTS Reporting Silviculture Updates and Land status Tracking System RMA Riparian Management Area RMZ Riparian Management Zone RRZ Riparian Reserve Zone SPH Stems Per Hectare TEM Terrestrial Ecosystem Mapping TFL Tree Farm Licence THLB Timber Harvesting Land Base TIPSY Table Interpolation Program for Stand Yields TSA Timber Supply Area TSM Terrain Stability Mapping VDYP Variable Density Yield Prediction Growth and Yield Model VEG Visually Effective Green-up Height VLI Visual Landscape Inventory VQO Visual Quality Objectives VRI Vegetation Resource Inventory VSU Visually Sensitive Unit WTP Wildlife Tree Patch

TFL 30 Management Plan #10 – Timber Supply Analysis – Analysis Report
1.0 INTRODUCTION
The timber supply analysis in support of Management Plan #9 (MP9) was completed in 2003, followed by the allowable annual cut (AAC) determination effective July 1
st, 2003 in which the
AAC was set at 330,000 m3/year.
On April 4th, 2006 under a Postponement Order (Section 8 (3.1) of the Forest Act), Canfor
provided a letter to the Chief Forester to have the next AAC determination postponed to June 12
th, 2013. The Chief Forester concluded that the factors used to assess timber supply have not
changed to the extent that they would have an impact on existing timber supply. Consequently, the next AAC determination will occur on June 12
th, 2013.
Canfor has initiated a timber supply analysis in support of Management Plan #10 (MP10) and this document describes the results of the recently completed timber supply analysis for Tree Farm Licence (TFL) #30.
The Tree Farm Licence #30 Management Plan #10 Data Package (Ecora, 2012) was published in July 2012 and contains a detailed description of the data and assumptions used in the timber supply analysis. This document, to be viewed in conjunction with the Data Package, provides the results of the timber supply analysis. Section 4.0 of this report presents the results of the base case analysis and Section 5.0 summarizes the results of the sensitivity analysis that has been completed.

TFL 30 Management Plan #10 – Timber Supply Analysis – Analysis Report
2.0 LAND BASE DESCRIPTION
2.1 Location
Tree Farm Licence #30 is located east of Prince George in the Prince George Forest District (Figure 1). The western boundary of the TFL is located near highway 97 at Summit Lake and stretches eastward across the western foothills of the Rocky Mountains, predominantly north of the Fraser River. The TFL covers a total of 180,347 ha and is characterized by a mixture of rolling terrain with steeper slopes towards the Rocky Mountains to the north.
Figure 1: Location of TFL 30
2.2 Land Base Classification
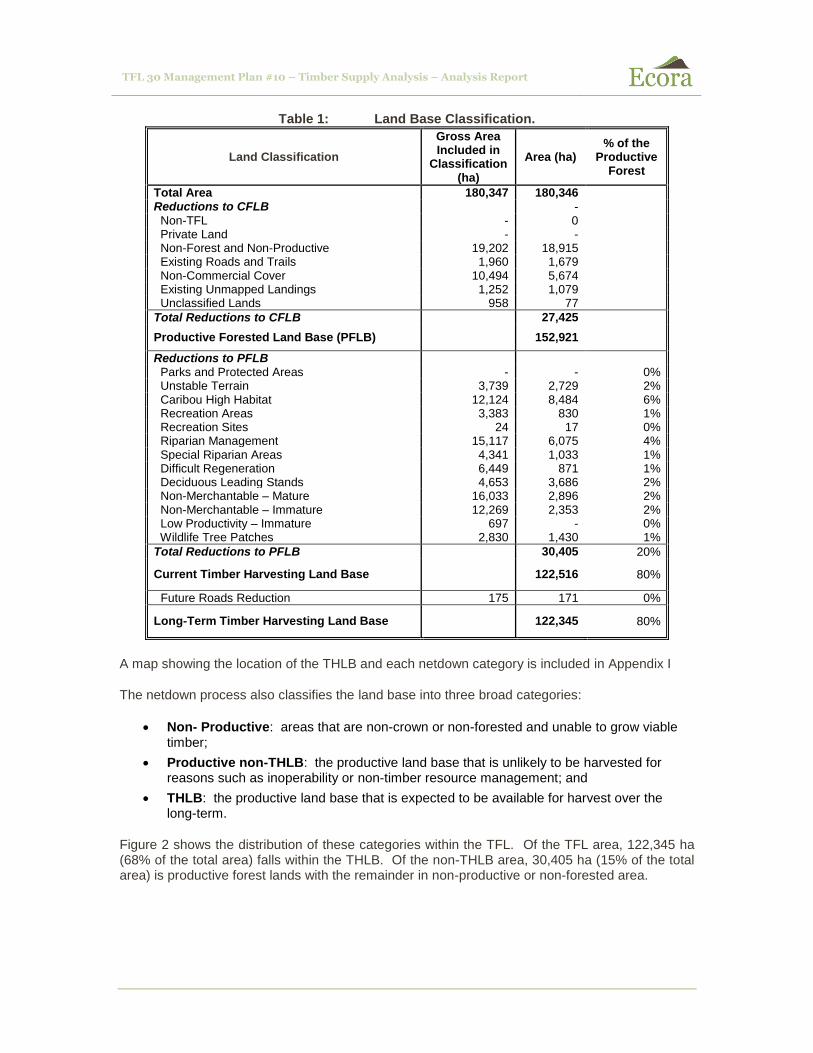
The land base classification (netdown) process starts with the gross area of the land base and removes area in a stepwise fashion according to detailed classification criteria. A complete description of the data and assumptions used in the analysis is documented in in the Data Package. Through the netdown, area is systematically removed in order to establish both the productive forest and timber harvesting land base (THLB). Table 1 shows the area removed under each netdown category as well as the current and future THLB.
TFL 30 Management Plan #10 – Timber Supply Analysis – Analysis Report
Table 1: Land Base Classification.
Land Classification
Gross Area Included in
Classification (ha)
Area (ha) % of the
Productive Forest
Total Area 180,347 180,346
Reductions to CFLB -
Non-TFL - 0
Private Land - -
Non-Forest and Non-Productive 19,202 18,915
Existing Roads and Trails 1,960 1,679
Non-Commercial Cover 10,494 5,674
Existing Unmapped Landings 1,252 1,079
Unclassified Lands 958 77
Total Reductions to CFLB 27,425
Productive Forested Land Base (PFLB) 152,921
Reductions to PFLB
Parks and Protected Areas - - 0% Unstable Terrain 3,739 2,729 2% Caribou High Habitat 12,124 8,484 6% Recreation Areas 3,383 830 1% Recreation Sites 24 17 0% Riparian Management 15,117 6,075 4% Special Riparian Areas 4,341 1,033 1% Difficult Regeneration 6,449 871 1% Deciduous Leading Stands 4,653 3,686 2% Non-Merchantable – Mature 16,033 2,896 2% Non-Merchantable – Immature 12,269 2,353 2% Low Productivity – Immature 697 - 0% Wildlife Tree Patches 2,830 1,430 1%
Total Reductions to PFLB 30,405 20%
Current Timber Harvesting Land Base 122,516 80%
Future Roads Reduction 175 171 0%
Long-Term Timber Harvesting Land Base 122,345 80%
A map showing the location of the THLB and each netdown category is included in Appendix I
The netdown process also classifies the land base into three broad categories:
Non- Productive: areas that are non-crown or non-forested and unable to grow viable timber;
Productive non-THLB: the productive land base that is unlikely to be harvested for reasons such as inoperability or non-timber resource management; and
THLB: the productive land base that is expected to be available for harvest over the long-term.
Figure 2 shows the distribution of these categories within the TFL. Of the TFL area, 122,345 ha (68% of the total area) falls within the THLB. Of the non-THLB area, 30,405 ha (15% of the total area) is productive forest lands with the remainder in non-productive or non-forested area.

TFL 30 Management Plan #10 – Timber Supply Analysis – Analysis Report
Figure 2: Area by Land Classification
2.2.1 Changes from the Data Package
There have been some minor changes to the data and assumptions described in the Data Package. The following reflects changes to netdown assumptions that affect the THLB:
As described in the Data Package, the Phase II VRI Adjustment had not been completed at the time the Data Package was published and therefore the netdown information does not reflect the adjusted inventory attributes. Table 1 shows the final THLB used in the timber supply analysis and considers the Phase II Inventory Adjustment as described below.
A new blocks layer was incorporated, updating logging disturbance to December 1st,
2012 and incorporating new planned blocks into the summer of 2014. This layer also included several older cutblocks that were not included in the initial data set.
The Data Package states that future roads will be removed once they have been harvested for the first time. Due to the relatively small area occupied by future roads, these areas (171 ha) have been netted out at the start and are not available for the initial harvest in the model.
Overall the final THLB is 526 ha larger than what was reported in the Data Package. This is due to the inclusion of additional older cutblocks as well as the impacts of the Phase II VRI adjustment on the netdown (discussed below).
In reviewing the Data Package, MFLRNO staff provided recommendations on changes to how managed stand yield curves are modelled. The Data Package (Table 27) describes the calculation of TEM-based OAF 1 values for each individual site series. These calculations results in some very high OAF values in some of the less productive site series and very low values in some of the more productive site series. In consultation with MFLNRO staff, these values have been averaged for each BEC variant as and applied to the yield tables as shown in Table 2.

TFL 30 Management Plan #10 – Timber Supply Analysis – Analysis Report
Table 2: Revised OAF 1 Information
Silviculture Era
BEC Variant
THLB Area (ha)
NP Percent
Default OAF 1
OAF 1
d1 SBSvk 246 0.054 0.075 0.87
r1 ESSFwk 708 0.101 0.075 0.82
r1 ICHvk2 1,570 0.043 0.075 0.88
r1 SBSmk1 861 0.022 0.075 0.90
r1 SBSvk 17,990 0.015 0.075 0.91
r1 SBSwk1 10,843 0.049 0.075 0.88
r2 ESSFwk 612 0.118 0.075 0.81
r2 ICHvk2 456 0.056 0.075 0.87
r2 SBSmk1 1,343 0.012 0.075 0.91
r2 SBSvk 4,407 0.019 0.075 0.91
r2 SBSwk1 3,486 0.059 0.075 0.87
Existing Managed Stands
42,522 0.032 0.075 0.89
r3 ESSFwk 4,524 0.094 0.075 0.83
r3 ICHvk2 7,810 0.037 0.075 0.89
r3 SBSmk1 5,209 0.015 0.075 0.91
r3 SBSvk 58,862 0.016 0.075 0.91
r3 SBSwk1 45,940 0.056 0.075 0.87
Future Managed Stands
122,345 0.035 0.075 0.89
In addition a sensitivity analysis using default OAF 1 values of 0.85 has been completed and is reported in Section 4.8.
The impacts of leader weevil on the plantations has been modelled through the application of additional regeneration delay values based on the estimated weevil attack percentages as shown in Section 5.4 of the Data Package. The values reported Table 26 of the Data Package represent the expected additional regeneration delay for the spruce component of each managed stand yield table. However, because TIPSY is unable to apply different regeneration delays to individual species within the same curve, these values were pro-rated by the percentage of spruce within each curve and then applied to the entire curve. This approach was reviewed with MFLRNO staff and was accepted as a reasonable approximation of weevil impacts.
2.2.2 Vegetation Resource Inventory
The Vegetation Resource Inventory (VRI) was completed in 2000 using 1995 photos. This inventory has been updated for logging disturbances to December 1
st, 2012 and has been
projected to January 1st 2013. The inventory has been adjusted according to the VRI Sample
Data Analysis Procedures and Standards (MOF, 2011) using 215 Phase II VRI plots established between 1997 and 2011. The results of the Phase II VRI analysis and adjustment are described in Tree Farm Licence #30 Management Plan #10 Inventory Analysis (Ecora, 2012).
The Phase II VRI adjustment was completed after the original data package was published. Once the Phase II VRI adjustment was complete, the netdown was re-run using the adjusted inventory attributes. Overall, the THLB increased by 298 ha as a result of the Phase II adjustment, with the non-merchantable-mature netdown decreasing by 553 ha and the non-merchantable-immature netdown increasing by 262 ha. There are some small changes in subsequent netdown steps that make up the difference in area.

TFL 30 Management Plan #10 – Timber Supply Analysis – Analysis Report
Phase II VRI Adjustment
The Phase II VRI adjustment process uses randomly located plot data to statistically adjust Phase I inventory age, height, stems per hectare, basal area and volume per hectare estimates based on Phase II ground sample data. As shown in Table 3, the adjustment decreased overall stand volumes by approximately 3.1% with significant variations between strata. Average age decreased slightly and average height increased, resulting in a higher average inventory site index. Basal area and stems per hectare decreased with variations from strata to strata.
Table 3: Inventory Analysis Results
Balsam-Immature
Balsam-Mature
Other-Immature
Other-Mature
Spruce-Immature
Spruce-Mature
Overall
N 32 37 6 13 12 115 215 Total Area 15,863 21,791 3,961 7,144 6,726 52,304 107,789
% of Land Base 15% 20% 4% 7% 6% 49%
Age (years)
n 30 35 6 12 12 103 198 Phase II Ground 114 160.1 131.8 118.9 106.9 147.9 129.4
Phase I Inventory 81 167.9 89.0 153.5 88.9 165.7 133.5 Ratio 1.4179 0.9537 1.4812 0.7746 1.2022 0.8922 0.9699
Sampling Error 20.0% 10.9% 23.4% 20.4% 15.3% 5.8% 5.6%
Height (m)
n 29 35 6 12 12 103 197 Phase II Ground 19 27.5 23.4 28.2 24.4 29.0 24.5
Phase I Inventory 15 27.9 19.5 28.8 18.5 30.2 24.1 Ratio 1.2562 0.9849 1.2022 0.9809 1.3135 0.9591 1.0156
Sampling Error 11.5% 7.0% 25.1% 15.0% 10.5% 3.8% 3.4%
Basal Area (m2/ha) @7.5 cm+ dbh
n 32 37 6 13 12 115 215 Phase II Ground 30 33.0 42.4 29.8 30.1 33.5 32.7
Phase I Inventory 24 34.4 35.2 41.5 27.8 35.7 33.6 Ratio 1.2192 0.9599 1.2069 0.7184 1.0825 0.9385 0.9725
Sampling Error 17.0% 11.9% 27.9% 23.5% 27.5% 6.7% 5.6%
Trees / ha @ 7.5cm+ dbh
n 32 37 6 13 12 115 215 Phase II Ground 1,080 517 969 452 946 574 667
Phase I Inventory 1,501 951 1,127 849 1,306 821 991 Ratio 0.7196 0.5434 0.8600 0.5329 0.7242 0.6987 0.6727
Sampling Error 22.4% 19.6% 29.4% 70.2% 33.4% 13.8% 9.6%
Unadjusted Volume / ha (m3/ha) @ 12.5 cm+ dbh (net dbw)
n 31 37 6 13 12 115 214 Phase II Ground 169 256 255 224 187 264 240
Phase I Inventory 94 251 157 301 137 306 247 Ratio 1.7407 1.0199 1.6280 0.7466 1.3646 0.8626 0.9698
Sampling Error 24.6% 13.1% 44.3% 24.7% 44.2% 8.1% 8.4%
Attribute Adjusted Volume / ha (m3/ha) @ 12.5 cm+ dbh (net dbw)
n 28 37 6 12 12 115 210 Phase II Ground 169 256.1 255.0 224.4 186.7 263.9 239.8
Phase I Inventory 144 229.7 216.1 204.7 197.2 252.9 224.1 Ratio 1.1353 1.1151 1.1799 1.0960 0.9467 1.0434 1.0697
Sampling Error 21.4% 12.8% 42.5% 24.6% 38.2% 7.9% 6.5%
Lorey Height (m)
n 31 37 6 13 12 115 214 Phase II Ground 17 22.3 20.6 25.9 19.8 23.8 21.8
Phase I Inventory 16 22.5 19.1 24.9 19.1 23.6 21.5 Ratio 1.0790 0.9920 1.0799 1.0391 1.0362 1.0057 1.0163
Sampling Error 9.8% 7.7% 30.4% 13.3% 19.8% 4.8% 3.7%

TFL 30 Management Plan #10 – Timber Supply Analysis – Analysis Report
Leading Species
Figure 3 show the productive non-THLB and THLB areas by leading species. Most of the stands within the THLB are either spruce or balsam-leading. Deciduous-leading stands have been netted out of the THLB. There are approximately 6,021 hectares of THLB in the VRI with no leading species information. All of these stands have logging history information and have been assigned to a managed stand yield curve based on the stand‟s predominant site series. Ages for these stands have been adjusted based on the logging year information.
Figure 3: Leading Species Summary
Inventory Site Index
Figure 4 shows a summary of the adjusted inventory site index for the TFL with the majority of the THLB between 15 and 18 m. Similar to the stands without a leading species, stands that were recently harvested at the time the inventory was completed do not have site index information and are identified as „NONE‟. As managed stands, these areas will utilize SIBEC site index estimates (see below).

TFL 30 Management Plan #10 – Timber Supply Analysis – Analysis Report
Figure 4: Adjusted Inventory Site Index Summary
2.2.3 Biogeoclimatic Ecosystem Classification (BEC)
The TFL is located in the western foothills of the Rocky Mountains and experiences heavy snowfall through the winter and substantial summer rain. Consequently the TFL is dominated by the very wet and wet-cool variants of the Sub Boreal Spruce (SBS) BEC zones as shown in Figure 5. Minor components of the Interior Cedar Hemlock (ICH) and Engelman Spruce Sub-Alpine Fir (ESSF) zones also exist.

TFL 30 Management Plan #10 – Timber Supply Analysis – Analysis Report
Figure 5: BEC Summary
2.2.4 Site Index
Terrestrial Ecosystem Mapping (TEM) across the TFL facilitates the use of Site Index by Biogeoclimatic Classification (SIBEC) estimates as measures of managed stand productivity. Inventory site index values are used for natural stands. Figure 6 shows the distribution of SIBEC values across the productive land base.

TFL 30 Management Plan #10 – Timber Supply Analysis – Analysis Report
Figure 6: SIBEC Site Index Summary
Figure 7 shows the combination of SIBEC site index for existing managed stands and inventory site index for natural stands. With a long history of forest management on the TFL a large percentage is considered to be managed and utilizes SIBEC values.

TFL 30 Management Plan #10 – Timber Supply Analysis – Analysis Report
Figure 7: Combined Site Index Summary
2.2.5 Harvest History and Age Class Distribution
With the success of fire suppression across the province and a lack of large natural stand replacing events on this land base, the age class distribution of the forest is largely influenced by harvest history. Figure 8 summarizes the THLB and non-THLB by the decade of harvesting activities showing a history of forest management back into the 1940s. Harvesting activity on the TFL peaked in the 1980‟s and has gradually declined over the past three decades.

TFL 30 Management Plan #10 – Timber Supply Analysis – Analysis Report
Figure 8: Harvest History
The current age class distribution of the forest is shown in Figure 9 with the area in age classes one and two largely a product of past harvesting activity. The predominance of age class eight stands demonstrates the rarity of large stand replacing events within these ecosystems. A shortage of age class nine stands in the TFL suggests that they have all been logged, they are not part of the natural range of variability for these ecosystems or, the current inventory has not adequately identify these stands. Targets for old seral retention in many of the wetter subzones (ICHvk2, ESSFwk2, and SBSvk) are based on maintaining stands older than 250 years meaning that all these targets are currently in a deficit.

TFL 30 Management Plan #10 – Timber Supply Analysis – Analysis Report
Figure 9: Initial Age Class Distribution

TFL 30 Management Plan #10 – Timber Supply Analysis – Analysis Report
3.0 BASE CASE TIMBER SUPPLY ANALYSIS
The base case represents the best representation of „current management‟ on the TFL. It contains the data and assumptions that combine to form our best estimate of timber supply on the TFL. Recognizing that uncertainty exists in both data and assumptions we undertake sensitivity analysis to attempt to quantify the impact of this uncertainty on the overall harvest level for the TFL.
This section presents the results of the base case timber supply analysis and provides background information on different aspects of the timber supply. The base case and all sensitivity analysis has been carried out using the forest estate model Patchworks. All harvest levels reported are net of non-recoverable losses. The forest estate model uses five-year planning periods over a 250-year planning horizon.
3.1 Harvest Forecast
Figure 10 shows the base case harvest forecast over the 250-year planning horizon. The harvest level starts at approximately 420,000 m
3/yr, staying at roughly the same level for 45 years before
increasing the to the long-term harvest level (LTHL) of approximately 545,000 m3/yr. Targets in
Patchworks are not generally absolute – the levels of targets such as harvest volume are allowed to vary somewhat from the target value and therefore harvest levels may vary from period to period. Therefore, harvest volumes for each scenario have been summarized as average values for the first 45 years and from year 46 to year 250. Table 4 shows the average harvest levels over these periods for the base case.
Figure 10: Base Case Harvest Forecast

TFL 30 Management Plan #10 – Timber Supply Analysis – Analysis Report
Table 4: Base Case Harvest Forecast
Years Base Case
m3/yr
1 to 45 419,720
46 to 250 544,792
Total merchantable growing stock on the THLB is shown in Figure 11. The starting growing stock of approximately 16 million m
3 decreases as the older, existing natural stand growing stock is
harvested. The growing stock reaches its lowest point at year 25. At this point much of the existing natural growing stock has been harvested and many of the future managed stands have not yet reached harvestable age. Harvesting is most constrained at this point in time and this represents the „pinch point‟ in the harvest schedule. As the more productive managed stands grow and become harvestable the growing stock begins to rise, facilitating the increase in the harvest level to the LTHL in year 46.
Figure 11: Base Case Growing Stock
3.2 Management Plan #9 Comparison
The timber supply analysis for Management Plan #9 (MP9) was completed in 2002 (McGregor Resource Analysis Group Ltd.) and produced a base case harvest level of approximately 350,000 m
3/yr for the first year (2001). The harvest level then drops to approximately 285,000 m
3/yr for
the next nine years. The harvest level then declines by approximately 10% per decade until reaching a low of approximately 194,000 m
3/yr in 2032. The harvest level then increases over
time until it reaches a long-term harvest level of approximately 509,000 m3/yr. This differs
considerably from the Management Plan #10 base case where the initial harvest level of 420,000 m
3/yr remains relatively constant for the first 45 years of the planning horizon before increasing to
the long-term level of approximately 544,000 m3/yr. These two harvest forecasts are shown in
Figure 12 and have been shifted to account for the different start date of each analysis. On

TFL 30 Management Plan #10 – Timber Supply Analysis – Analysis Report
average, the MP9 Base Case harvest level is approximately 46% lower for the first 50 years and 10% lower for the remaining 200 years.
There are number of factors contributing to the higher MP10 harvest levels. The following sections identify how differences in management policy, data and assumptions as well as analysis methodology have contributed to this increase in harvest level.
Figure 12: Harvest Forecast – MP #9
3.2.1 Timber Harvesting Land Base
Overall, the long-term THLB for the MP9 analysis is 5,393 ha (4.4%) less than this analysis. This is attributable to several small changes in data and netdown assumptions. Changes in data as well as differences in how the netdown was applied make it difficult to quantify the exact differences in each netdown category. The order in which each netdown has been applied is different and therefore the area available for a specific netdown is different.
Generally speaking the non-merchantable (or minimum economic yield) and wildlife tree patch reductions represent the largest differences in netdowns. The assumptions for the non-merchantable netdown are very similar to the MP9 analysis however, this analysis applies the netdown to the Phase II adjusted VRI whereas the MP9 analysis uses the unadjusted inventory. Furthermore, inventory volumes for this analysis were developed using VDYP version 7 while the MP9 inventory volumes came from VDYP version 6. The volume and age adjustments and the use of a different growth and yield model both have an impact on the amount of area removed under this category with approximately 12,000 ha less removed in this analysis. However, it is important to consider the fact that this netdown was applied as one of the first steps in the MP9 netdown but was applied as one of the last netdowns in MP10, contributing significantly to this difference. This significant difference impacts the area available for many of the subsequent netdown steps.

TFL 30 Management Plan #10 – Timber Supply Analysis – Analysis Report
Under MP9, Canfor was required to maintain approximately 9% of the harvest blocks in wildlife tree patches (WTP). Under its current FSP, Canfor has committed to maintaining 3.5% of the gross cutblock area in WTP (7% annual average). Consequently, less area has been removed for WTP in this analysis, contributing to the larger THLB.
3.2.2 Model Constraints
The management for non-timber objectives through constraints on harvest in the forest estate model can have a significant impact on harvest levels throughout the planning horizon. As discussed below, the impact of these constraints are generally more pronounced in simulation models versus optimization model due to the ability of optimization model to plan for “pinch points” in the harvest schedule. There are several differences in how non-timber objectives have been accounted for in this analysis versus the MP9 analysis.
Patch Size
In the MP9 analysis, the removal of patch size objectives increases the short-term harvest level by an average of 99,000 m
3/yr (38%). The MP10 Base Case harvest level does not include patch
size objectives. Comparing these two scenarios shows that the MP9 – No Patch Size scenario is on average, 94,000 m
3/yr (22%) less than the MP10 Base Case in the first 50 years and 44,000
m3/yr (8%) less for the remainder of the planning horizon.
Seral Stage
The MP9 Data Package outlines a detailed process used to identify potential old growth management areas (OGMA) on the TFL in order to fulfill old seral objectives however it does not specify whether the 2/3 draw down was used to identify OGMA or how or if these areas were incorporated into the timber supply analysis. There is no netdown specified for OGMA and therefore we must assume that harvesting was excluded from these areas. If this is the case then the application of spatial OGMA will be more restrictive than the non-spatial old seral targets used in MP9 and will contribute to the lower harvest levels. If the 2/3 draw down to seral stage target values was not used then the seral stage targets will have been significantly more constraining as is shown in our sensitivity analysis around this factor as described in Section 4.4 below.
Caribou Corridors
The MP9 Data Package specifies 20 different corridor unit / BEC subzone combinations and applies a minimum retention constraint of 70% mature (either > 100 years or > 120 years depending on BEC unit) whereas this analysis applies minimum retention targets of 20% > 100 years and maximum disturbance constraints of 20% < 3m to three different ungulate winter range (UWR) units as per UWR order #U-7-003. In is not clear whether the new caribou data represents a larger area than the MP9 analysis but the constraints used in MP9 are significantly more constraining than the MP10 UWR corridor constraints.
3.2.3 Managed Stand Yields
The following outlines some of the differences in managed stand yield assumption between MP9 and MP10 that contribute to increased MP10 harvest levels. Changes to managed stand yield assumptions do not generally affect the short-term harvest level as these stands are generally not available for harvest until several decades into the planning horizon. However, due to the long history of forest management on the TFL, many of the managed stands are currently between 20 and 30 years of age and may become harvestable in the next 30 to 50 years.

TFL 30 Management Plan #10 – Timber Supply Analysis – Analysis Report
Leader Weevil Assumptions
Management Plan #9 applied yield curve volume reductions of 6.2% for existing managed stands and 4.9% for future managed stands to approximate the impacts of White Pine Leader Weevil on spruce plantations. In reviewing these assumptions in consultation with MFLNRO staff it was determined that the application of a regeneration delay to affected stands was more appropriate than a yield curve volume reduction. Based on this, an approach was developed in consultation with MFLNRO staff to calculate the regeneration delay attributable to leader weevil impacts and apply this to the spruce component of managed stand yields impacted by weevil.
Genetic Gains
In MP9 a 17.9% genetic gain was applied to the spruce component of managed stand yields. Since then the genetic gains on spruce have improved to 28%. In MP10, a genetic gain of 19% has been applied to the spruce component of stands harvest between 1998 and 2008 and a gain of 28% has been applied to stands harvested after 2008. A small genetic gain has also been applied to pine however, the impact of this is minimal.
Fertilization
RESULTS records show that approximately 1,863 ha have been fertilized since 2006 and has been modelled accordingly in MP10 with a corresponding increase in managed stand yields. There was no fertilization applied to the MP9 analysis.
3.2.4 Historic Harvest Levels
Annual harvest levels for the last 12 years were compiled from a combination of the Harvest Billing System (HBS) and annual cut control (CC) statements as shown in Table 5. These figures are also shown in Figure 12 and demonstrate that harvest levels on the TFL since the last timber supply analysis have been substantially lower than the current AAC and lower than the projected harvest levels from the last analysis. In total there is approximately 2.5 million m
3 forecasted in
the MP9 analysis but not actually harvested (undercut). If harvested over the next 45 years this undercut volume represents an additional 55,600 m
3/yr that is available to the model and
contributes, along with the factor mentioned above, to the higher short-term harvest levels in MP10.
Table 5: Recent Harvest History
Year Harvest Volume
(m3)
Source
2001 192,311 HBS
2002 396,827 HBS
2003 300,260 HBS
2004 201,714 HBS
2005 41,506 CC Statement
2006 46,218 CC Statement
2007 152,922 CC Statement
2008 110,866 CC Statement
2009 4,324 CC Statement
2010 62,680 CC Statement
2011 54,755 CC Statement
2012 311,756 HBS
Total 1,876,139
Annual Average 156,345

TFL 30 Management Plan #10 – Timber Supply Analysis – Analysis Report
3.2.5 Forest Estate Model
According to the MP9 Analysis Report (McGregor Resource Analysis Group Ltd. 2002) the timber supply analysis was carried out using the spatial simulation model FPS / ATLAS. Because it is a spatial simulation model, harvest scheduling decisions are made on a period by period basis with little or no consideration into how decisions in one period might affect the available harvest volume in other periods. As additional constraints are applied to the model, the ability of a simulation model to maintain harvest levels is further compromised. This is exemplified in the difference between the long-run sustained yield and the actual harvest levels as shown in Figure 13 of the MP9 Analysis Report where the LTHL is almost 280,000 m
3/yr (35%) below the long-run
sustained yield (LRSY). In comparison, the LTHL for this analysis is only 208,000 m3/yr (28%)
below LRSY.
Patchworks, a spatially explicit optimization model, examines the overall impact of harvest scheduling decisions across all periods and can evaluate tradeoffs based on their effect on the overall harvest level. In doing so, the model is able to overcome temporary shortages in available volume that simulation models cannot. Because Patchworks is a fully spatial model we are able to evaluate and implement these harvest schedules on the ground.
The initial ten years of spatial harvest schedules (SHS) from this analysis have undergone a preliminary review from an operational perspective. This review has confirmed that, in a general sense, the harvest schedule is operationally feasible. Furthermore, some harvest blocks from the SHS have already been modified slightly and incorporated in the current operational plan for the TFL.
3.3 Base Case Harvest Characteristics
Figure 13 shows the distribution of the harvest volume between natural and managed stands. For the first 45 year harvesting is almost exclusively in natural stands. It quickly transitions to managed stands over the next 20 years. Some existing natural stands do not get harvested for over 100 years because they are needed to meet old seral and other non-timber objectives.

TFL 30 Management Plan #10 – Timber Supply Analysis – Analysis Report
Figure 13: Base Case – Harvest from Natural and Managed Stands
Figure 14 shows how average harvest age changes over the planning horizon. It starts at approximately 170 years of age and remains relatively constant over the next 25 years as existing natural stands are harvested. As harvest transitions into younger, more productive managed stands the average harvest age drops to between 60 and 90 years of age.

TFL 30 Management Plan #10 – Timber Supply Analysis – Analysis Report
Figure 14: Base Case – Average Harvest Age
As shown in Figure 15, average volume per hectare starts off just below 300 m3/ha. As harvest
moves into more productive managed stands, the average harvest volume per hectare increases to around 400 m
3/ha.
Figure 15: Base Case – Average Volume per Hectare Harvested

TFL 30 Management Plan #10 – Timber Supply Analysis – Analysis Report
Figure 16 shows that, in the base case, the average area harvested per year generally remains between 1,200 ha and 1,500 ha per year.
Figure 16: Base Case – Annual Harvest Area
3.4 Age Class Distribution
The age class graphs shown in Figure 17 describe the changing age class distribution of the forest over the 250-year planning horizon. Initially the age class distribution is skewed toward the oldest and youngest stands with very little area in age classes four to seven. As time progresses a more even age class distribution is created. Natural disturbances have been applied to the non-THLB portion of the land base and therefore we can see that these stands do not continually age throughout the planning horizon.

TFL 30 Management Plan #10 – Timber Supply Analysis – Analysis Report
Figure 17: Age Class Distribution – Base Case

TFL 30 Management Plan #10 – Timber Supply Analysis – Analysis Report
4.0 SENSITIVITY ANALYSIS
Sensitivity analysis provides information on the degree to which uncertainty in the base case data and assumptions might affect the proposed harvest level for the land base. The magnitude of the change in the sensitivity variable(s) reflects the degree of risk associated with a particular uncertainty – a very uncertain variable that has minimal impact on the harvest forecast represents a low risk. By developing and testing a number of sensitivity issues, it is possible to determine which variables most affect results and provide information to guide management decisions in consideration of uncertainty.
Each of the sensitivities shown in Table 6 test the impact of a specific variable (or variables) with impacts measured relative to the base case harvest forecast.
Table 6: Sensitivity Analyses.
Sensitivity Range Tested
Alternate Harvest Flow
Increase initial harvest level
No increase harvest level
Maintain initial harvest level
Minimum Harvest Age
120 m3/ha
180 m3/ha
200 m3/ha
Stand Volume Managed Stand Yield +/- 10%
Natural Stand Yields +/- 10%
Old Seral Retention
Examine impact of full old retention targets (no draw down)
Reduce old seral age from 250 years to 140.
Ecosystem Representation Analysis (ERA) Targets
Enforce draft ERA targets as defined in Canfor‟s SFM Plan for the TFL.
Patch Size Objectives Enforce as targets in the model.
Operational Adjustment Factor (OAF
Use OAF1 value of 0.85
Wildlife Tree Patches (WTP) Apply an additional 3.5% WTP reduction
Leader Weevil Remove Leader Weevil Impacts
Watershed Objectives
Remove Watershed Objectives
Remove Fisheries Sensitive Watershed (FSW) Objectives
4.1 Alternative Harvest Flow Patterns
The goal of the base case harvest forecast is to maintain a non-declining harvest level for as long as possible before increasing to a sustainable LTHL. The scenarios in Figure 18 and Table 7 show the impacts of alternate harvest flow patterns. The Evenflow scenario maintains the same harvest level over the 250-year planning horizon. As discussed above, the harvest pinch point
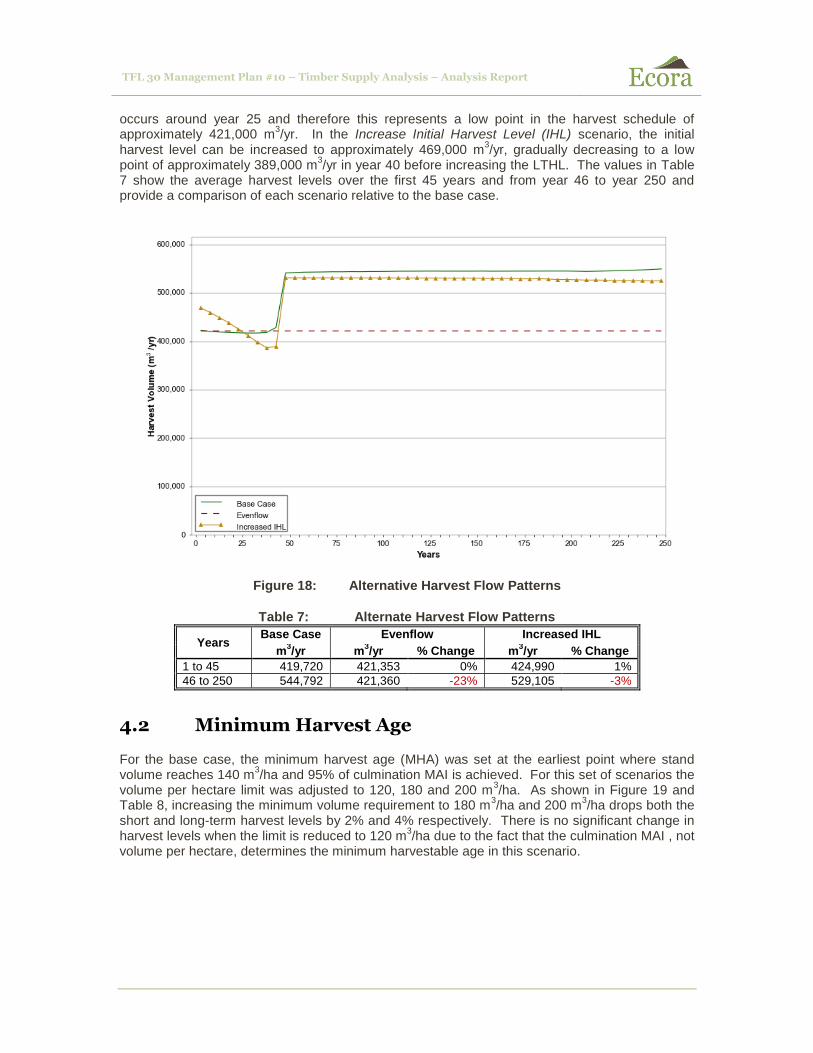
TFL 30 Management Plan #10 – Timber Supply Analysis – Analysis Report
occurs around year 25 and therefore this represents a low point in the harvest schedule of approximately 421,000 m
3/yr. In the Increase Initial Harvest Level (IHL) scenario, the initial
harvest level can be increased to approximately 469,000 m3/yr, gradually decreasing to a low
point of approximately 389,000 m3/yr in year 40 before increasing the LTHL. The values in Table
7 show the average harvest levels over the first 45 years and from year 46 to year 250 and provide a comparison of each scenario relative to the base case.
Figure 18: Alternative Harvest Flow Patterns
Table 7: Alternate Harvest Flow Patterns
Years Base Case Evenflow Increased IHL
m3/yr m
3/yr % Change m
3/yr % Change
1 to 45 419,720 421,353 0% 424,990 1%
46 to 250 544,792 421,360 -23% 529,105 -3%
4.2 Minimum Harvest Age
For the base case, the minimum harvest age (MHA) was set at the earliest point where stand volume reaches 140 m
3/ha and 95% of culmination MAI is achieved. For this set of scenarios the
volume per hectare limit was adjusted to 120, 180 and 200 m3/ha. As shown in Figure 19 and
Table 8, increasing the minimum volume requirement to 180 m3/ha and 200 m
3/ha drops both the
short and long-term harvest levels by 2% and 4% respectively. There is no significant change in harvest levels when the limit is reduced to 120 m
3/ha due to the fact that the culmination MAI , not
volume per hectare, determines the minimum harvestable age in this scenario.

TFL 30 Management Plan #10 – Timber Supply Analysis – Analysis Report
Figure 19: Minimum Harvest Age
Table 8: Minimum Harvest Ages
Years Base Case 120 m
3/ha MHA 180 m
3/ha MHA 200 m
3/ha MHA
m3/yr m
3/yr % Change m
3/yr % Change m
3/yr % Change
1 to 45 419,720 420,869 0% 411,028 -2% 401,257 -4%
46 to 250 544,792 545,781 0% 532,344 -2% 522,149 -4%
4.3 Natural and Managed Stand Yields
Figure 20 and Table 9 show the impact on timber supply if managed stand yields are increased and decreased by 10%. Decreasing managed stand yields does not immediately decrease harvest because the natural stands make up majority of the harvest schedule for the first 45 years of the planning horizon. Long-term harvest levels fall by 10% on average. When managed stand yield are increased by 10%, there is a 9% increase in the average LTHL.

TFL 30 Management Plan #10 – Timber Supply Analysis – Analysis Report
Figure 20: Managed Stand Yields +/- 10%
Table 9: Managed Stand Yields +/- 10%
Years Base Case
Managed Stand Yields +10%
Managed Stand Yields -10%
m3/yr m
3/yr % Change m
3/yr % Change
1 to 45 419,720 429,700 2% 411,231 -2%
46 to 250 544,792 596,301 9% 490,411 -10%
Figure 21 and Table 10 demonstrate that the average short-term harvest level increases by 9% when natural stand yields are increased and decreases by 8% when natural stand yields are decreased. Expectedly, there is no significant change in the average LTHL from either of these scenarios.

TFL 30 Management Plan #10 – Timber Supply Analysis – Analysis Report
Figure 21: Natural Stand Yields +/- 10%
Table 10: Natural Stand Yields +/- 10%
Years Base Case
Natural Stand Yields +10%
Natural Stand Yields -10%
m3/yr m
3/yr % Change m
3/yr % Change
1 to 45 419,720 457,164 9% 384,620 -8%
46 to 250 544,792 545,927 0% 543,250 0%
4.4 Old Seral Objectives
There are no legally established OGMA on the TFL and therefore landscape level biodiversity is modelled aspatially through a set of retention constraints applied at the landscape unit / BEC variant level. In the base case a 2/3 drawdown to the full seral stage targets is enforced with old seral defined as greater than 250 years of age in the ICHvk2, ESSFwk2, and SBSvk variants and greater than 140 years in the remaining BEC variants. As shown in the age class graph in Figure 9 above there is very little area in age class nine (>250 years) and therefore many of the older seral targets are currently in a deficit.
The Old Age 140 scenario shown in Figure 22 and Table 11 demonstrates that reducing the old seral age to 140 years for all BEC variants increases the initial harvest level by approximately 17,000 m
3/yr (4%) for the first 45 years with a small increase over the long-term.
A second scenario examines the impact of modelling the full seral stage requirements by removing the 2/3 drawdown on these targets. This scenario uses the base case seral stage age definitions (>250 years in the ICHvk2, ESSFwk2, and SBSvk variants) and shows the application of the full seral targets has a significant negative impact on both the short (18%) and long-term harvest levels (6%).
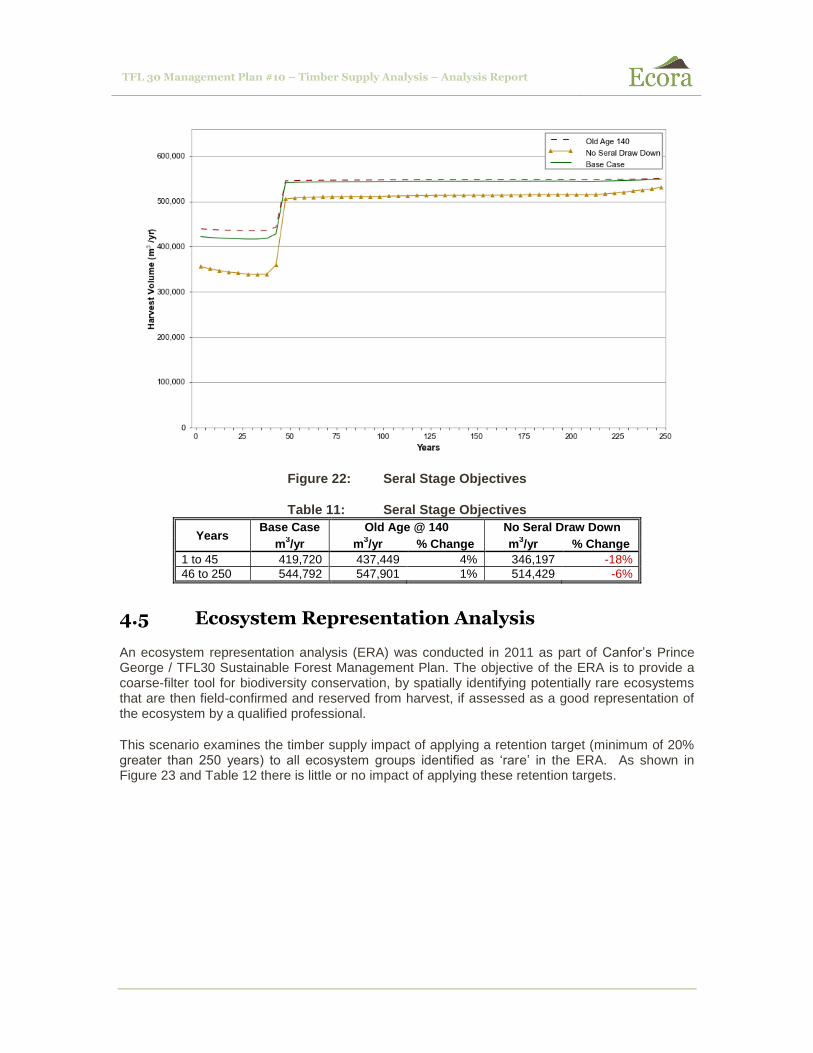
TFL 30 Management Plan #10 – Timber Supply Analysis – Analysis Report
Figure 22: Seral Stage Objectives
Table 11: Seral Stage Objectives
Years Base Case Old Age @ 140 No Seral Draw Down
m3/yr m
3/yr % Change m
3/yr % Change
1 to 45 419,720 437,449 4% 346,197 -18%
46 to 250 544,792 547,901 1% 514,429 -6%
4.5 Ecosystem Representation Analysis
An ecosystem representation analysis (ERA) was conducted in 2011 as part of Canfor‟s Prince George / TFL30 Sustainable Forest Management Plan. The objective of the ERA is to provide a coarse-filter tool for biodiversity conservation, by spatially identifying potentially rare ecosystems that are then field-confirmed and reserved from harvest, if assessed as a good representation of the ecosystem by a qualified professional.
This scenario examines the timber supply impact of applying a retention target (minimum of 20% greater than 250 years) to all ecosystem groups identified as „rare‟ in the ERA. As shown in Figure 23 and Table 12 there is little or no impact of applying these retention targets.

TFL 30 Management Plan #10 – Timber Supply Analysis – Analysis Report
Figure 23: Ecosystem Representation Objectives
Table 12: Ecosystem Representation Objectives
Years Base Case ERA (>20% old)
m3/yr m
3/yr % Change
1 to 45 419,720 417,058 -1%
46 to 250 544,792 543,958 0%
4.6 Patch Size Objectives
Canfor‟s Forest Stewardship Plan (FSP) identifies targets for patch size distribution by landscape unit (LU) and natural disturbance type (NDT) groups. The FSP states that, “At the end of the term of this FSP [2006 – 2016] the young forest patch size categories found in TFL 30 will trend towards or fall within the desired target ranges”. Operationally, the management of patches is a very fluid process, as certain rates of harvest must be maintained in order to create the desired distributions and the ability to achieve a certain patch size distribution is greatly influenced by past harvesting practices as well as past and future natural disturbances. Patch size distribution is monitored annually and reported as part of the Annual Report for the Prince George/TFL30 Sustainable Forest Management Plan, with the results being used to guide operational plans.
For the base case, the patch size objectives from Table 13 have been monitored but not enforced as hard targets. These targets are applied to patches less than 20 years age. In order to be considered part of the same patch, two polygons must have their closest point less than 20 m apart.

TFL 30 Management Plan #10 – Timber Supply Analysis – Analysis Report
Table 13: Patch Size Objectives.
Landscape Unit Patch Size Category
Patch Size Class (ha)
Target Distribution Range (%)
Averil (grouped into NDT 3)
Small < 40 10 – 20
Medium 40 – 250 10 – 20
Large 250 – 1000 60 – 80
Extra Large > 1000 0
Seebach (grouped into NDT 2)
Small < 40 30 – 40
Medium 40 – 80 30 – 40
Large 80 – 250 20 – 40
Extra Large > 250 0
Woodall (grouped into NDT 1,2)
Small < 40 30 – 40
Medium 40 – 80 30 – 40
Large 80 – 250 20 – 40
Extra Large > 250 0
Figure 24 and Table 14 show that the application of the full patch size targets results in an average decrease in timber supply in the short-term of 3% with a 4% long-term decrease. Because patch size targets are applied to stands less than 20 years of age, the model must increase the harvest level in the first period in order to achieve the targets as soon as possible. When the targets are relaxed slightly, patch size targets are achieved over a longer period of time and the timber supply impact is reduced to almost nil.
Figure 24: Patch Size Objectives

TFL 30 Management Plan #10 – Timber Supply Analysis – Analysis Report
Table 14: Patch Size Objectives
Years Base Case Patch Size Targets
Relaxed Patch Size Targets
m3/yr m
3/yr % Change m
3/yr % Change
1 to 45 419,720 408,509 -3% 421,324 0%
46 to 250 544,792 523,997 -4% 538,503 -1%
4.7 Wildlife Tree Patches
With respect to stand-level biodiversity and wildlife tree patches (WTP), Canfor‟s FSP commits to ensuring that at least 7% of the total area of cutblocks harvested over a 12 month period will be covered by wildlife tree retention and that at least 3.5% of each individual cut block will be covered by wildlife tree retention. Operationally, retention requirements are first met using portions of the stand that don‟t typically contribute to timber supply (riparian areas, deciduous stands, unstable terrain, non-merchantable areas, and retention for visual quality and wildlife habitat). Existing wildlife tree patches (WTP) represent 2,830 ha within the TFL and have been removed from the THLB.
A review of the portion of the productive forest that will require future WTP shows that 21.3% of this area is non-THLB indicating that there is sufficient non-THLB to fulfill future WTP requirements without the need for an additional netdown to address this. Even if we exclude large contiguous netdowns (i.e. caribou high habitat) based on the assumption that this area will only contribute to meeting WTP requirements in blocks directly adjacent to it, the proportion of productive non-THLB within the remainder of the land base is approximately 16.5% non-THLB. This information strongly suggests that future WTP requirements will be met without removing additional area from the THLB.
Furthermore, management for old forest objectives, visual quality and other habitat requirements increase the amount of stand level retention and contribute to meeting WTP requirements without removing additional areas from the THLB.
However, given this information, Figure 25 and Table 15 show that applying an additional 3.5% WTP netdown results in a 4% reduction in the initial harvest level and a 3% reduction in the average LTHL.

TFL 30 Management Plan #10 – Timber Supply Analysis – Analysis Report
Figure 25: Additional 3.5% WTP Reduction
Table 15: Additional 3.5% WTP Reduction
Years Base Case
Add 3.5% WTP Reduction
m3/yr m
3/yr % Change
1 to 45 419,720 403,693 -4%
46 to 250 544,792 527,768 -3%
4.8 Operational Adjustment Factor
Operational Adjustment Factors (OAF) are applied to managed stand yield curves to adjust the curve to account for stands not realizing the full volume potential indicated by TIPSY. OAF 1 is used to represent reduced yield due to gaps in stocking; and OAF2 is used to represent decay and losses due to disease and pest. OAF1 is a constant reduction factor that shifts the yield curve down whereas the influence of OAF2 increases with age and therefore alters the shape of the curve.
Under the MP9 analysis an average OAF 1 value of 14.6% was calculated using a 7.5 % default OAF 1 value and adding the percentage of the THLB occupied by non-productive site series from the TEM. A similar approach has been used for base case in this analysis, calculating the non-productive portion for each productive site series as shown in Table 2.
Figure 26 and Table 16 show the impact of using the default OAF 1 value of 0.85 as opposed to the TEM-based OAF 1 estimates. Because OAF 1 values only affect managed stand yields there is very little impact in the short-term. The average LTHL is 3% lower when the default OAF 1 estimates are used.

TFL 30 Management Plan #10 – Timber Supply Analysis – Analysis Report
Figure 26: OAF1 @ 0.85
Table 16: OAF1 @ 0.85
Years Base Case OAF1 @ 0.85
m3/yr m
3/yr % Change
1 to 45 419,720 416,340 -1%
46 to 250 544,792 520,649 -4%
4.9 Leader Weevil
White pine leader weevil attacks the newly formed leaders of young spruce trees. Depending on the attack intensity and frequency, the attacks will destroy the current year‟s growth and reduce the overall wood quality for the years it affects. The impacts of leader weevil on the plantations has been modelled through the application of additional regeneration delay values based on the estimated weevil attack percentages as shown in Section 5.4 of the Data Package. The values reported Table 26 of the Data Package represent the expected additional regeneration delay for the spruce component of each managed stand yield table and have been pro-rated based on the spruce percentage within each yield curve and then applied to the curve in TIPSY.
Figure 27 and Table 17 show that removing the additional regeneration delay‟s used to account for leader weevil result in an 8% increase in the short-term harvest level. The slight decrease in the LTHL is attributable to the increase in harvest volume in the short-term.

TFL 30 Management Plan #10 – Timber Supply Analysis – Analysis Report
Figure 27: Remove Leader Weevil Impacts
Table 17: Remove Leader Weevil Impacts
Years Base Case No Weevil Impacts
m3/yr m
3/yr % Change
1 to 45 419,720 451,661 8%
46 to 250 544,792 541,570 -1%
4.10 Watershed Objectives
Watershed objectives in the base case are modelled through the application of peak flow index (PFI) targets applied to each watershed. These targets include enhanced PFI threshold values in the Seebach Creek watershed as prescribed in the draft fisheries sensitive watershed order for the Seebach Creek watershed. The scenarios shown in Figure 28 and Table 18 explore the impact of removing the FSW objectives as well as the PFI targets themselves and demonstrate that these objectives do not have a significant impact on timber supply.

TFL 30 Management Plan #10 – Timber Supply Analysis – Analysis Report
Figure 28: Watershed Objectives
Table 18: Watershed Objectives
Years Base Case
No Watershed Constraints
Remove FSW Constraints
m3/yr m
3/yr % Change m
3/yr % Change
1 to 45 419,720 420,661 0% 419,753 0%
46 to 250 544,792 545,628 0% 545,508 0%

TFL 30 Management Plan #10 – Timber Supply Analysis – Analysis Report
5.0 DISCUSSION
The role of the base case in timber supply analysis is to present the set of data and assumptions that best reflects current management on the TFL. The base case harvest forecast presented above provides the best representation of timber supply on the TFL over the next 250 years. This scenario demonstrates that the land base can support a harvest level of approximately 420,000 m3
/yr over the next 45 years before increasing to a sustainable long-term harvest level of approximately 545,000
m3/yr.
The initial harvest level of 420,000 m3/yr represents a substantial increase over the base case
harvest forecast from MP9 and the AAC of 330,000 m3/yr. This increase can be attributed to the
following factors:
An increase in the THLB of approximately 5,400 ha (4%) over the THLB from MP9.
An accumulated undercut of almost 2.5 million m3 over the last 10 years, representing an
increase in the short-term annual harvest level of approximately 55,600 m3/yr (over a 45
year period).
Removal of patch size objectives from the base case in MP9 resulted in an average increase of almost 99,000 m
3/yr (38%) over the first 80 years of the planning horizon. We
have not included patch size objectives in the MP10 base case but have demonstrated through sensitivity analysis that these objectives can be achieved over time without impacting the harvest level.
Modification to management objectives for seral stage2 and caribou corridors have
allowed for increased harvest.
The application of improved assumptions on the impacts of leader weevil, the application of improved genetic gains estimates and the application of a fertilization program in the TFL have all contributed towards higher managed stand yield estimates.
The use of a spatially explicit optimization model in MP10 has likely increased harvest levels over MP9. Timber supply analysis for MP9 was conducted using a simulation model that can have difficulty achieving optimal harvest schedules, especially in a highly constrained land base. This is supported by the fact that the LRSY for the TFL has not substantially increased in MP10 however the ability of the model to schedule that volume has dramatically increased. Furthermore, the significant increase in harvest from removing patch size targets in MP9 further suggests that the model has difficulty with these types of constraints.
Sensitivity analysis seeks to quantify the degree to which uncertainty in data and assumptions might affect timber supply. Table 19 shows a summary of the harvest impacts of each scenario relative to the base case.
2 It is not clear from MP9 documentation as to whether the 2/3 draw down to the seral stage targets was
applied. We have assumed that the full seral stage targets were enforced in the MP9 base case.

TFL 30 Management Plan #10 – Timber Supply Analysis – Analysis Report
Table 19: Summary of Analysis Results
Scenario
Years 1 to 45 Years 46 to 250
m3/yr
% Change
m3/yr
% Change
Base Case 419,720
544,792
Evenflow 421,353 0% 421,360 -23%
Increased IHL 424,990 1% 529,105 -3%
120 m3/ha MHA 420,869 0% 545,781 0%
180 m3/ha MHA 411,028 -2% 532,344 -2%
200 m3/ha MHA 401,257 -4% 522,149 -4%
Managed Stand Yields +10% 429,700 2% 596,301 9%
Managed Stand Yields -10% 411,231 -2% 490,411 -10%
Natural Stand Yields +10% 457,164 9% 545,927 0%
Natural Stand Yields -10% 384,620 -8% 543,250 0%
Old Age @ 140 437,449 4% 547,901 1%
No Seral Draw Down 346,197 -18% 514,429 -6%
ERA (>20% old) 417,058 -1% 543,958 0%
Patch Size Targets 408,509 -3% 523,997 -4%
Relaxed Patch Size Targets 421,324 0% 538,503 -1%
OAF1 @ 0.85 416,340 -1% 520,649 -4%
Add 3.5% WTP Reduction 403,693 -4% 527,768 -3%
No Weevil Impacts 451,661 8% 541,570 -1%
No Watershed Constraints 420,661 0% 545,628 0%
Remove FSW Constraints 419,753 0% 545,508 0%

TFL 30 Management Plan #10 – Timber Supply Analysis – Analysis Report
6.0 REFERENCES Alfaro, R.I., 1994. The white pine weevil in British Columbia: biology and damage. Symposium on
the White Pine Weevil: Biology, Damage and Management. Forestry Canada, Pacific Forestry Centre, Richmond, British Columbia, pp. 7–22.
Beaudry and Associates. 1998. Watershed Assessment and Sediment Source Survey for TFL 30. 446p.
British Columbia Ministry of Forests. 1995. Biodiversity Guidebook. Forest Practices Code of British Columbia Act.Strategic Planning Regulations.Operational Planning Regulation. http://www.for.gov.bc.ca/tasb/legsregs/fpc/fpcguide/biodiv/biotoc.htm
British Columbia Ministry of Forests. 1999. Mapping and Assessing Terrain Stability Guidebook. Second Edition, August 1999.
British Columbia Ministry of Forests. 2003 Tree Farm Licence 30 – Rationale for Allowable Annual Cut (AAC) Determination – Effective July 1, 2003. 40pp.
British Columbia Ministry of Forests. 2008. Prince George Timber Supply Area – Timber Supply Review – Data Package.
British Columbia Ministry of Forests. 2011. Prince George Timber Supply Area – Rationale for Allowable Annual Cut (AAC) Determination.
British Columbia Forest Service. 2011. Provincial-Level Projection of the Current Mountain Pine Beetle Outbreak: Update of the infestation projection based on the 2010 Provincial Aerial Overview of Forest Health and the BCMPB model (year 8). 15pp.
Canadian Forest Products Ltd. 2006. CSA – SFM Sustainable Forest Management Plan for Canfor‟s TFL 30 – Prince George Operations.
Forest Ecosystem Solutions Ltd. 2010. Tree Farm Licence 30 – Draft 2 Type 2 Silviculture Strategy Data Package.
Forest Ecosystem Solutions Ltd. 2010. Tree Farm Licence 30 – Draft 2 Type 2 Silviculture Strategy Analysis Report.
J.S. Thrower and Associates Ltd. 2000. Potential Site Index Estimates for the Major Commercial Tree Species on TFL 30. March 31, 2000. 27pp.
McGregor Resource Analysis Group Ltd. 2001. Tree Farm Licence 30 – Management Plan No. 9 – Timber Supply Analysis Data Inputs and Assumptions Report. 176p
McGregor Resource Analysis Group Ltd. 2002. Tree Farm Licence 30 – Management Plan No. 9 – Timber Supply Analysis Report. 80pp;
Taylor, S.P., Alfaro, R.I., DeLong, C., Rankin, L., 1996. The effects of overstory shading on white pine weevil damage to white spruce and its effects on spruce growth rates. Canadian Journal of Forest Research 26, 306–312.
Taylor, S.P. 1997. Relationships between white spruce vulnerability of the white pine weevil and ecological site conditions in the interior of British Columbia. Faculty of Natural Resources and Environmental Studies. Univ. Northern British Columbia. 75 p.

TFL 30 Management Plan #10 – Timber Supply Analysis – Analysis Report
APPENDIX I – NETDOWN MAP
A PDF map of the netdown areas can be downloaded here: https://dl.dropbox.com/u/24626685/netdown.pdf